 Chuan Chen1,2,3
 Lingling Gao
 Shunda Li
- 1College of Geological and Mining Engineering, Xinjiang University, Urumqi, China
- 2Xinjiang Key Laboratory for Geodynamic Processes and Metallogenic Prognosis of the Central Asian Orogenic Belt, Urumqi, China
- 3Xinjiang Natural Resources and Ecological Environment Research Center, Urumuqi, China
Introduction: The Huitongshan skarn-type deposits, in which ore bodies primarily occur in the outer contact zone between K-feldspar granite and marble in the Beishan area, are evidently related to hydrothermal alteration of the surrounding rock. Key mineral alteration processes include serpentinization, epidotization, chloritization, carbonatization, jarosite, ferritization, and hematitization.
Methods: WorldView-3 (WV-3), a satellite-recorded high-spatial resolution multispectral image, has been widely used in the exploration and prediction of different types of deposits around the world. In this study, WV-3 multispectral images were used to extract the spatial distribution data of the main altered minerals in the Huitongshan area. Dedicated radiometric calibration, atmospheric correction, and image fusion were used to pre-process the extracted spectral information related to hydrothermal alteration. In addition, directed principal component analysis (PCA) and a unique mineral index were designed based on the effective use of the WV-3 data band corresponding to the spectral absorption characteristics of altered minerals.
Results: The findings of this study show that the PCA model and mineral index pro-posed herein are reliable both in theory and for practically obtaining extraction information. Additionally, the WV-3 data are well suited for identifying hydroxy-bearing alterations with rich short-wave infrared bands that distinguish Fe-OH–bearing alterations from Mg-OH–bearing alterations. The results obtained were applied to identify potential targets for skarn-type copper deposits and the implementation of prospecting practices.
Discussion: This study provides a basis for the application of WV-3 data as an important and effective tool for alteration information extraction and determination of prospecting practice, thereby proving the validity of multispectral remote sensing images in mineral resource exploration.
1 Introduction
Remote sensing data primarily used include TM, Landsat-8, and ASTER. Several studies worldwide have successfully extracted Al-OH–bearing, Mg-OH–bearing, and iron mineralization alterations from remote sensing data and created the relevant alteration information extraction process for these data (Herrmann et al., 2001; Yang, 2007; Zhang et al., 2007; Lv et al., 2009; Pour and Hashim, 2011; Yang et al., 2012; Huang, 2013; Masoumi et al., 2017; Eldosouky et al., 2020; 2021; Jonas et al., 2020; Bencharef et al., 2022; Mahdi et al., 2022). However, the medium-resolution multispectral data such as ASTER can easily map the large-scale alteration zone, but it is difficult to map the geological outcrop with small scale.
The WorldView-3 (WV-3) satellite is a fourth-generation high-resolution optical satellite owned by Digital Globe. It was the first commercial satellite with multi-load, ultra-high spectrum, and high-resolution features. Launched on 13 August 2014, the WV-3 satellite is the highest spatial, spectral, and radiation resolution optical satellite in the world (Fred et al., 2015). The spectral characteristics of WV-3, covering visible light, near-infrared, and short-wave infrared (SWIR), bestow it with strong quantitative analysis ability and it has broad application prospects in vegetation monitoring, mineral detection, urban atmosphere, and other aspects (Hunt et al., 2016; Sibanda et al., 2016; Masoumi et al., 2017; Aguilar et al., 2021; Son et al., 2021). Higher resolution means more accurate identification and classification of man-made materials (metals, plastics, paints, fiberglass, asphalt, petroleum, and various chemicals) and geological minerals (clays, alterations, iron oxides, carbonates, etc.) on the surface of the Earth (Kruse and Perry, 2012; Samsudin et al., 2016). For example, the WV-3 data are used to extract alteration minerals such as ferritization, silication, sericite and chlorpetritization in gold and copper deposits (Bedini, 2019; Zhao et al., 2021; Mahanta and Maiti, 2022a). Or it is related to the extraction of quartz veins, quartzite, talc, chlorite, sericite schist and other rocks closely related to gold mineralization (Mahanta and Maiti, 2022b).
The Huitongshan deposit is located in Beishan, Northwest (NW) China. The copper orebody is located in hydrothermally altered rocks. Therefore, hydrothermal alteration information extraction is one of the important technologies in the exploration stage of mineral resources related to hydrothermal alteration system (Alvaro et al., 1998; Carranza and Hale, 2002; Tommaso and Rubinstein, 2007; Shahriari et al., 2013; Masoumi et al., 2017; Salehi and Tangestani, 2020). Previous studies have been conducted on remote sensing data of Beishan and Huitongshan (Liu et al., 2013a; Liu et al., 2013b; Liu et al., 2014), and the basic intrusion and maficultramafic complex in the Huitongshan area were identified using ETM+ and ASTER data. However, few studies have been carried out to extract hydrothermal alteration information from high spatial resolution WV-3 data in Huitongshan area. Therefore, the main problem solved in this study is to use high spatial resolution WV-3 data to obtain the alteration distribution characteristics of granite, schist, marble, serpentine and gabbro in the chalcocite mountain area by principal component analysis (PCA) and mineral index method, and verify the accuracy of the information extraction in combination with field investigation.
This research area is ideal for the remote sensing exploration of hydrothermally altered minerals for the following reasons: first, the semi-arid terrain has good bedrock exposure, and second, there is relatively little precipitation and sparse vegetation coverage. In addition, few previous work has been conducted to extract hydrothermal alteration information using WV-3 data in this research area, and few image analysis results related to mineralization have been obtained. The purpose of this study is to evaluate the capacity of WV-3 data to extract alteration information from small-scale alteration zones in arid and semi-arid regions and the reliability of the extracted information.
2 Materials and methods
2.1 Study area
The Beishan area is located at the southern margin of the Central Asian Orogenic Belt and at the junction of the Tarim Craton and Kazakhstan Craton (Gao, 1992; Chen et al., 2007; Yang et al., 2012; Su et al., 2012; Dai et al., 2013; Wang et al., 2015; Yang et al., 2022) (Figure 1A). Huitongshan is located in the Beishan area of NW Gansu Province, China (Figure 1B). The strata of the deposit area are the Huaniushan Group of the lower-middle Ordovician, which is primarily composed of marble and mica quartz schist with quartzite and rhyolite in some parts. Rock alteration, primarily serpentinization followed by chloritization, epidotization, and carbonatization, is intense (Xiao et al., 2000). The NW thrust fault guides and stores the ore, whereas the NW normal fault destroys the ore body. There are two stages of outcropped magmatic rocks in the mining area: the first is the gabbro, distributed in the south of the mining area, and the sporadically outcropped pyroxenite. The second is brick red potash feldspar granite distributed North of the ore deposit, which is the metallogenic mother rock of this deposit. The ore bodies of the Huitongshan Cu deposit was mainly produced in skarn and marble, and skarn is in contact with marble or serpentinite. Therefore, marble and serpentinite are the direct prospecting indicator for this deposit (Figure 1C). The natural geography of the study area belongs to the plateau, low hills, and Gobi desert area, and it has a typical continental climate with harsh natural conditions.
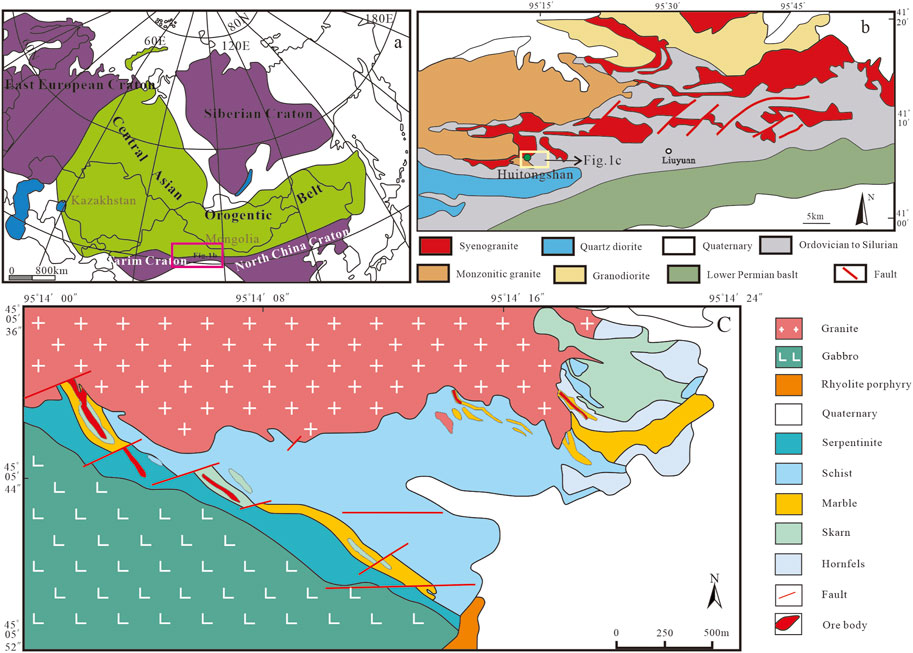
FIGURE 1. (A) Location of study area in the Central Asian Orogenic Belt [modified from Wang and Zhang. (2016); Sun et al. (2020)]. (B) Geology of the Liuyuan area within Huitongshan in the southern Beishan area [modified from Mao et al. (2010)]. (C) Geological sketch of Huitongshan Copper mine [modified from Zhang. (2003)].
2.2 Data used
The WV-3 data purchased from Beijing Aerospace WorldView Information Technology Co., Ltd. used in this study were obtained at 04:55:36 (Greenwich time) on 11 November 2016.
In recent years, the rapid development of commercial optical remote sensing mapping satellites with submeter resolution has been seen, and their image resolution, precision, and data acquisition capability have been continuously enhanced. After the successful launch of WorldView-1 (WV-1) and WorldView-2 (WV-2) on 13 August 2014, Digital Global launched the WV-3 satellite with a higher spatial resolution (0.31 m) than WV-1 and WV-2. WV-2 was launched on 6 October 2009, and it can be seen from Figure 2 and Table 1 that WV-2 can provide 8-band high-resolution satellite influence with a multispectral image resolution of 1.8 m. Which indicates that high-resolution remote sensing satellites are gradually entering a new era where they can compete with airborne aerial photogrammetry. It also brings new opportunities and challenges to the global remote sensing market (Table 1).
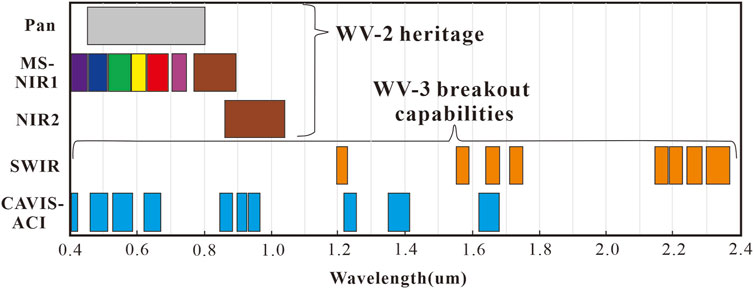
FIGURE 2. Band contrast of WV-2 and WV-3 data at PAN, VNIR, and SWIR bands. PAN, Panchromatic; VNIR, Visible and near-infrared; SWIR, Short-wave infrared; WV-2, WorldView-2; WV-3, WorldView-3.
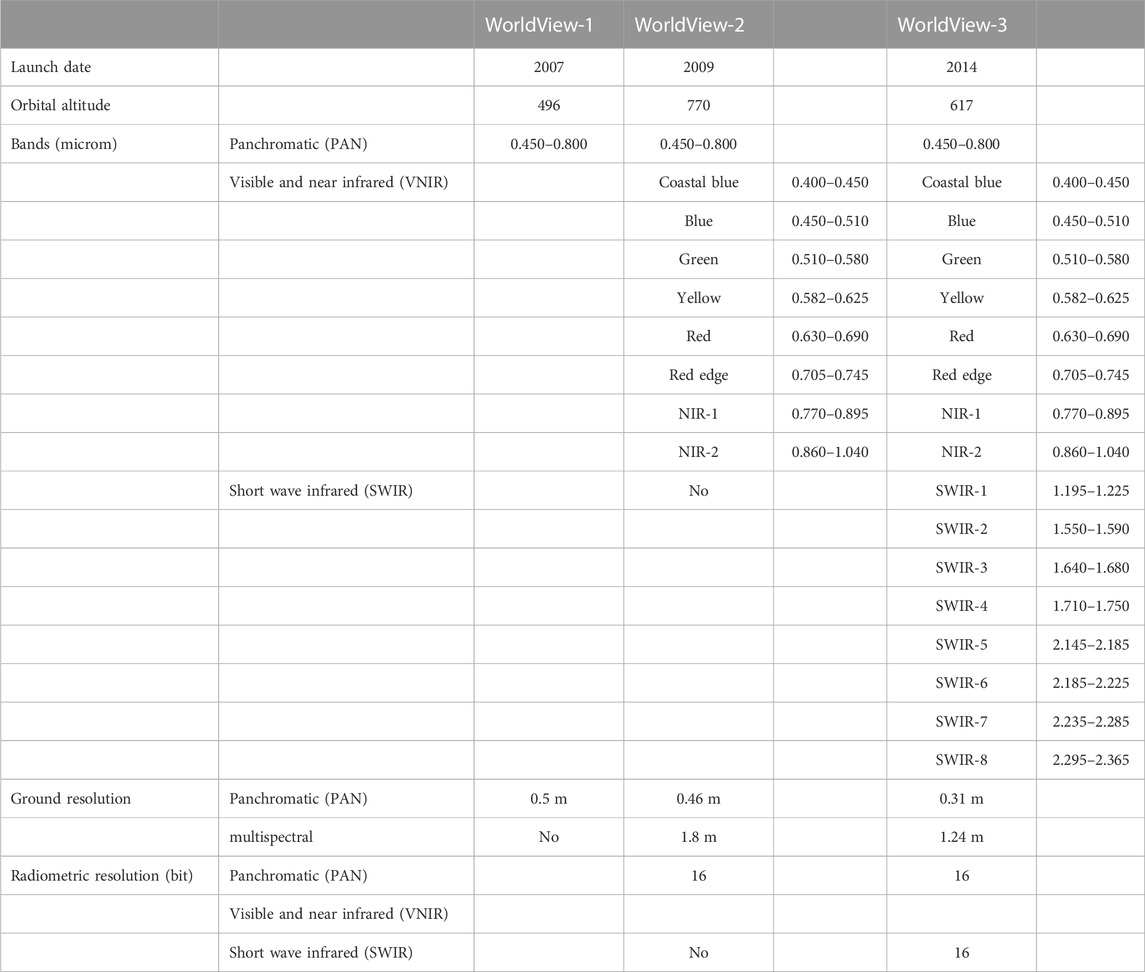
TABLE 1. Band set of WorldView-1, WorldView-2, and WorldView-3 data at PAN, VNIR, and SWIR bands.
In addition to the great improvement in the spatial resolution, WV-3 has adopted eight multispectral bands, eight SWIR bands, and 12 bands of clouds, aerosols, water vapor, snow, and ice used for atmospheric correction. The total spectral number reached 28, which is comparable to that of hyperspectral remote sensing satellites (Figure 2). In addition, WV-3 is highly flexible and agile, and can change the pointing position of satellites by 200 km in 12 s, with a data acquisition capability of up to 680,000 km2 per day.
2.3 Data analysis
Ore-bearing rock usually has an unequal crystalline structure and is composed of garnet, diopside, tremolite, wollastonite, and calcite. Common garnet and epidote are arranged in parallel, with banded structures and metasomatism by calcite (later silicate). Carbonatization, epidotization, chloritization, and serpentinization are produced by hydrothermal alteration and are often near the ore body. There are also evident ferritization and hematitization on the surface. Based on the different ions and ionic groups, the aforementioned alteration types can be divided into Mg-OH–bearing, Fe-OH–bearing, iron-bearing, and carbonate alteration anomalies. The spectral absorption characteristics of the main altered minerals are shown in Figure 3. The minerals produced by the alteration are serpentine [Mg3Si2O5 (OH)4], chlorite [(Mg,Fe)3(Si,Al)4O10(OH)2-(Mg,Fe)3(OH)6], epidote [Ca2(Al,Fe+3)3(SiO4)3(OH)], nontronite [Na0.33(Fe+3)2(Si,Al)4O10*nH2O], limonite [FeO*OH*nH2O], Jarosite [Na(Fe+3)3(SO4)2(OH)6], Hematite [alpha-Fe2O3], dolomite [CaMg(CO3)2], calcite [CaCO3].
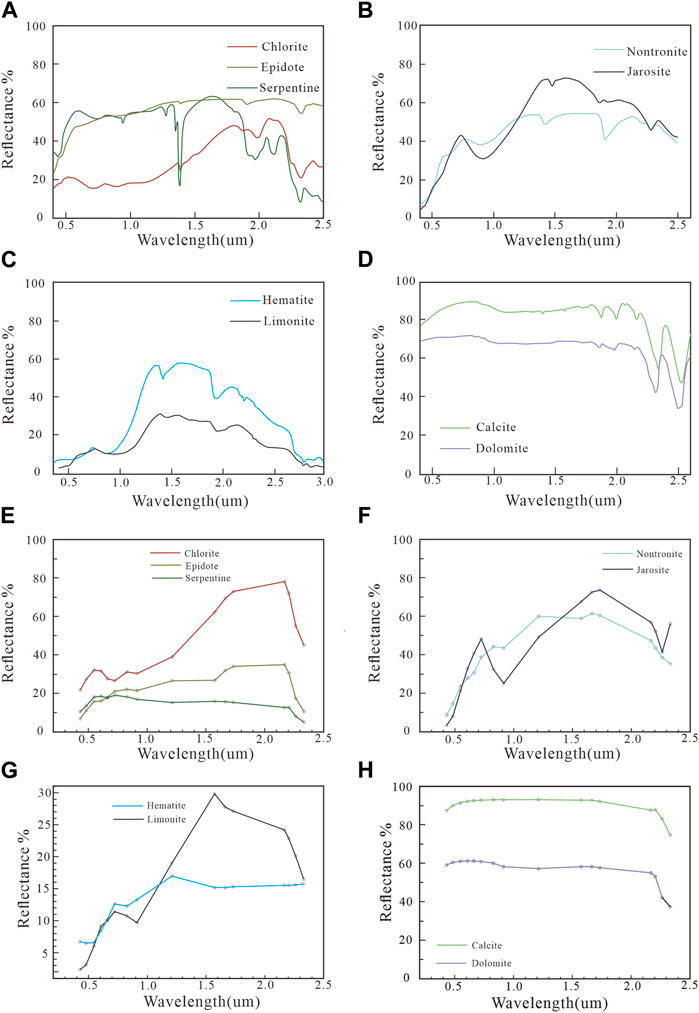
FIGURE 3. (A–D) Continuous reflectance spectra of key alteration minerals (selected from the USGS spectral library). (A) Mg-OH minerals; (B) Fe-OH minerals; (C) iron-stained minerals; and (D) carbonate minerals. (E–H) The same reflectance spectra from the USGS spectral library resampled to the WorldView-3 spectral resolution. (E) Mg-OH minerals; (F) Fe-OH minerals; (G) iron-stained minerals; and (H) carbonate minerals.
The most important absorption characteristic of the minerals containing Mg-OH–bearing (serpentinite + chlorite + epidote) is the strong absorption characteristic peak near 2.30 μm, and the spectra of the minerals containing Mg(OH)2 are characterized by a maximum absorption band of 2.315–2.335 μm, which coincides with SWIR-8 of WV-3 (Figure 3). The characteristic absorption bands of Fe-OH–bearing minerals (chlorite + jarosite) are 2.21–2.30 μm, and the characteristic absorption bands were also in the vicinity of 0.92 μm band SWIR-6 of WV-3, as well as a high absorption in band SWIR-7. The absorption locations of the iron-stained (ferritization + hematitization) altered minerals are 0.87 and 0.35 μm, and the secondary absorption locations are approximately 0.50 μm. The altered minerals containing carbonates (calcite + dolomite) show characteristic absorption at 1.85–2.20 μm and 2.30–2.35 μm, among which the most important absorption feature is 2.33 μm that coincides with WV-3 SWIR-8 (Figure 3).
2.4 Data processing
2.4.1 Data preprocessing
Before the alteration information is extracted, relevant correction and preprocessing are carried out on the data. This primarily includes radiometric calibration, atmospheric correction, and image fusion.
1. Radiometric calibration: The digital numbers (DN) of pixels largely reflect the reflection of solar radiation and electromagnetic energy intensity. But it will be affected by a variety of factors, such as typical sensor characteristics, atmospheric conditions and so on. In this case, we can adopt the linear model method to effectively reduce the error caused by sensors. We used the following formula: Radiance = Gain × DN + Off-set.
The radiometric calibration tool in Environment for Visualizing Images (ENVI) can be used to read the relevant information and calculate the radiation brightness value.
2. Atmospheric correction: Electromagnetic waves are typically affected by atmospheric factors during propagation. Therefore, the spectrum acquired by the sensor has a certain level error. In order to eliminate the influence of atmosphere on the image, we used FLAASH module of ENVI tool for atmospheric correction. It generally uses MODTRAN4+ model, which is an ideal correction model to achieve stage accuracy. Its core objective is to reduce the influence caused by atmosphere, light and other factors, so that the parameters of ground objects can be effectively restored.
3. Image fusion is done to calculate the complementary data at various levels such as space and time according to established rules to obtain more reliable and comprehensive information. And can form a variety of features of synthetic image data, the focus of the design to space, time and other aspects. After image fusion, the spatial resolution of image can be increased, and the multispectral characteristics can be effectively maintained. Therefore, image fusion can not only make the data relatively simple composite, but also emphasize the optimization of the data, so as to make the valuable data more prominent and optimize the credibility of the classification results. In the ENVI software, the spectral fusion of visible and near-infrared (VNIR) and pan-chromatic (PAN) bands is conducted using the Gramm-Schmidt transform to form eight spectral information of existing VNIR bands. There are also remote sensing images with a spatial resolution of 0.5 m in the PAN band.
2.4.2 Principal component analysis (PCA)
Principal component analysis (PCA) is a commonly used method for extracting remote sensing alteration anomaly information. This method has the advantages of low quality atmospheric correction, simple realization, good extraction effect, and robust effect, and is widely favored by geologists (Wu et al., 2018). PCA is a powerful statistical technique that can be used to suppress the irradiance effects that dominate all bands; therefore, it enhances the spectral reflectance features of geological materials. PCA can be applied to multivariate datasets, such as multispectral remote sensing images, to extract specific spectral responses, as in the case of hydrothermal mineral alterations (Crósta et al., 2003). Especially in bedrock-exposed areas, PCA can extract alteration information well.
After PCA, many aspects of the original data are concentrated in several indexes, which greatly simplifies data processing while retaining most of the original information (Fu, 2011), and the redundant information between highly correlated bands is removed, thereby reducing the data dimension (Singh and Harrison, 1985; Crosta and Moore, 1989). PCA is the most popular and effective multispectral extraction method.
2.4.3 Mineral index method
According to the mathematical principle, when the difference between different bands of the feature on remote sensing image is similar but the slope is different, the band ratio method can be used to enhance the feature information, and simultaneously, influence of the terrain can be removed (Inzana et al., 2003). This method is often used to enhance the features of the surface of the Earth. In geological applications, the band ratio can effectively enhance lithological information by removing shadows and increasing other information and is also a common method for remote sensing alteration information extraction.
When using the mineral index method to extract alteration information, the spectral range of the slope with maximum variation amplitude should be determined based on the analysis of the spectral characteristics of corresponding altered minerals depending on the type of remote sensing data. Further, the reflection peak and characteristic absorption valley should be clearly defined, and the ratio operation should be carried out to form a mineral index map. The image resulting from the image ratio can highlight any abnormal information.
3 Results
3.1 Extraction of alteration information using PCA
In the visible, near-infrared, and SWIR regions, the formation of mineral characteristic spectra is primarily because of the differences in mineral absorption characteristics. This results in the formation of unique and relatively stable absorption spectral bands and indicates the existence of certain minerals. The main influencing factors of the mineral reflection spectrum are the mineral chemical composition, crystal structure, and particle size, among which mineral chemical composition is the most important. The spectral characteristics of minerals are related to anion groups or cations such as carbonates, water, hydroxyl, and iron ions.
Mg-OH was characterized by a maximum absorption band of 2.30–2.40 μm. Therefore, the PCA models of the VNIR-1, VNIR-7, SWIR-3, and SWIR-8 bands were selected as the information extraction models of Mg-OH-containing alteration. The symbols corresponding to the contribution coefficients of each band are evidently different, and thus, the alteration can be extracted by PC4 (Table 2). The Mg-OH alteration information extraction results from the PCA of the Huitongshan WV-3 image are shown in Figure 4A. Areas with high Mg-OH anomalies were mapped and detected in the northwestern and western parts of Huitongshan.
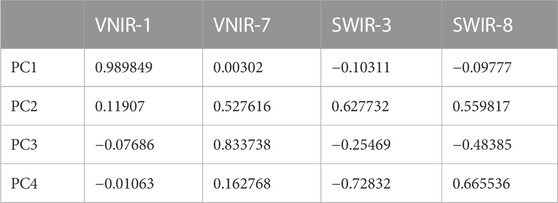
TABLE 2. Principal component eigenvector matrix of Mg-OH information extraction.
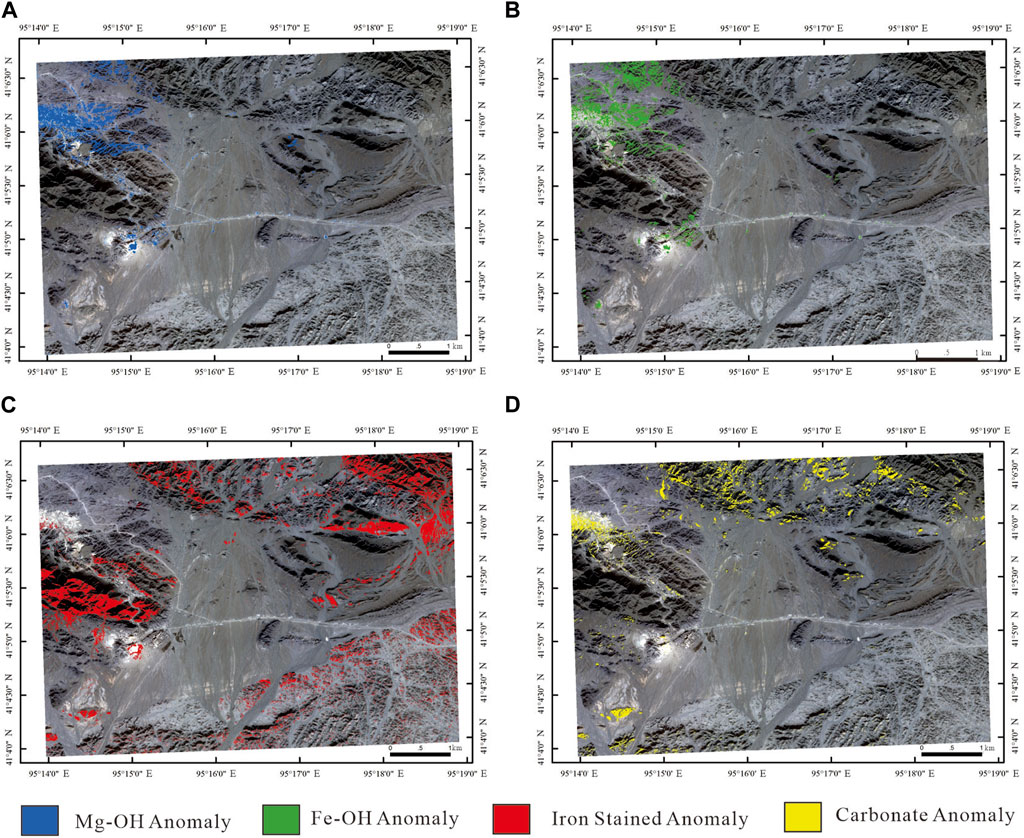
FIGURE 4. Abnormal distribution produced from the principal component analysis processing of the WorldView-3 (WV-3) imagery for (A) Mg-OH; (B) Fe-OH; (C) iron-stained; (D) carbonate alterations.
Fe-OH-containing alterations in the wavebands were extracted using the combined PCA model of VNIR-1, SWIR-1, SWIR-3, and SWIR-7. Corresponding to PC4 covered by the feature vector, the alteration was primarily extracted effectively using PC4 at this time (Table 3). The information extraction results are shown in Figure 4B. The distribution of the Fe-OH anomaly is consistent with that of the Mg-OH anomaly, and a strong anomaly appears in the NW near the orebody and the northeast of the ore-body.
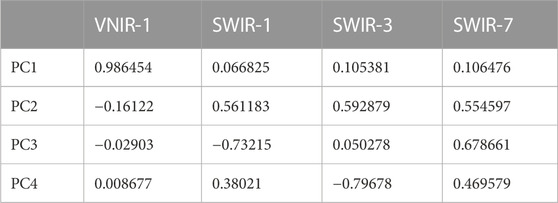
TABLE 3. Principal component eigenvector matrix of Fe-OH information extraction.
Combination of the VNIR-3, VNIR-6, SWIR-1, and SWIR-3 bands of the WV-3 data was selected as an iron-stained mineral alteration PCA model. Therefore, we extracted iron-stained alteration data primarily from PC4 (Table 4). The information extraction results are shown in Figure 4C. The iron staining anomaly is widely distributed, and the NW (Southeast of the ore body) is the strongest anomaly, followed by the Northeast, and the Southeast is the weakest.
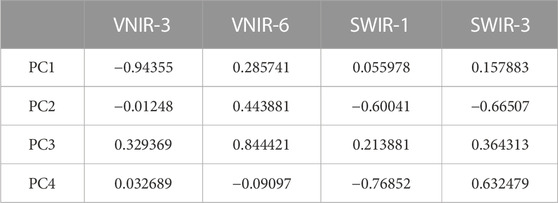
TABLE 4. Principal component eigenvector matrix of iron-stained information extraction.
The mineral alterations of carbonates have characteristic absorption at multiple intervals, which correspond to several bands, such as the SWIR-5 and SWIR-8 bands. Therefore, we can choose the VNIR-1 and SWIR-5 bands to complete PCA and effectively extract the alteration. We combined carbonate spectral characteristics and found that the VNIR-1 and SWIR-5 bands can reflect evident absorption characteristics. Therefore, the corresponding contribution coefficient symbols of each band were substantially different in the feature vector matrix of the principal component. The required alteration information can be extracted efficiently using PC4 (Table 5). The in-formation extraction results are shown in Figure 4D. The strongest carbonate anomaly was located in the NW of the study area (Southwest of the orebody), followed by a weak anomaly in the Northern part of the study area.
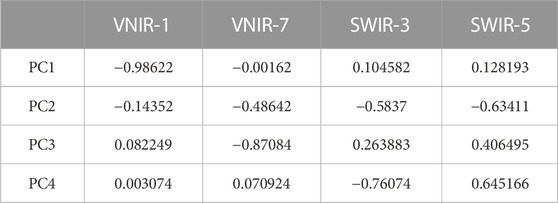
TABLE 5. Principal component eigenvector matrix of carbonates information extraction.
3.2 Extraction of alteration information using the mineral index method
In view of all types of altered minerals, typical reflection peaks and characteristic absorption valleys were found, and a ratio combination calculation was conducted. It enhances subtle differences by taking the digital number ratio of two bands or several bands and highlighting the invisible characteristics or features in the original gray image. Thus, mineral indices for all types of altered minerals were formed. Combined with the geological background of the study area, four mineral indices of Mg-OH, Fe-OH iron-stained, and carbonates were proposed based on WV-3 data in this paper.
Mg-OH–bearing altered minerals have a relatively high reflectance of 1.6–1.7 μm and 2.1–2.2 μm and the corresponding band SWIR-3 and SWIR-6 region, whereas spectral absorption in the region of band SWIR-8. Fe-OH–bearing altered minerals have a relatively high spectral absorption in 1.0–1.2 μm and 2.2–2.3 μm at the corresponding SWIR-3 and SWIR-6, respectively, whereas high reflectance in 1.6–1.7 μm (band SWIR-3). The iron-stained altered minerals show characteristic absorption in bands VNIR-2 (band blue) and VNIR-3 (band green) with relatively high reflectance in the SWIR-6 and SWIR-8 bands. Carbonate altered minerals demonstrate a characteristic absorption at the wavelength of 2.30–2.35 μm (band SWIR-8), with relatively high reflectance in the region of the bands SWIR-6 and SWIR-3.
Therefore, we obtain the following formula:
The band ratio was calculated according to the above formula. The results are shown in Figure 5. Upon comparing the distribution map of alteration anomalies extracted via PCA (Figure 4) with that extracted using the mineral index method, we found that the distribution of Mg-OH, Fe-OH, and iron-stained alterations was basically the same. Meanwhile, the distribution of the carbonate alteration anomalies was significantly different; the distribution range of the information regarding carbonate alteration anomalies extracted using the mineral index was large. In addition to the NW and north of the study area, strong anomalies were also observed in the northeast of the study area.
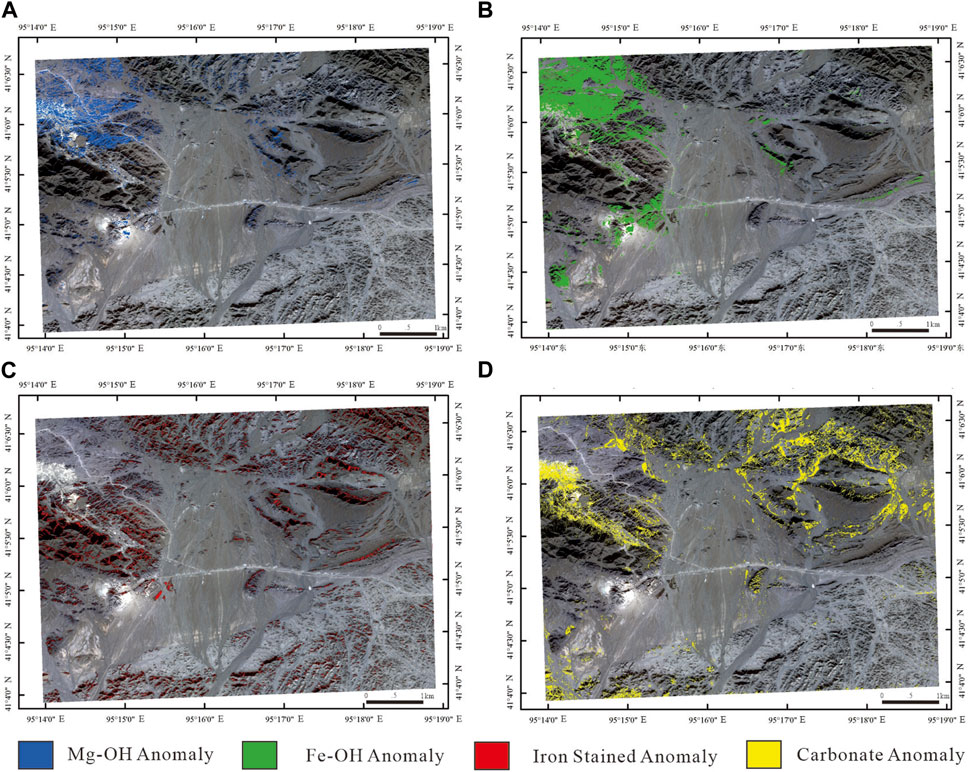
FIGURE 5. Abnormal distribution obtained using the mineral index method for processing WV-3 imagery for (A) Mg-OH; (B) Fe-OH; (C) iron-stained; (D) carbonate alterations.
4 Discussion
In recent years, spatial data has been often used in mineral exploration and mineralization prediction modeling (Eldosouky et al., 2021; Bencharef et al., 2022), and has achieved good results. Or combine remote sensing data with geophysical methods to extract alteration mineral information and apply it to mineral deposits (Eldosouky et al., 2020; Mahdi et al., 2022), and remote sensing data is becoming more and more important. In particular, WV-3 data with high spatial resolution can efficiently and accurately extract geological information. However, in the extraction of alteration information from skarn-type deposits, WV-3 data is still relatively rare.
In this study, WV-3 data were used to extract the alteration information of Mg-OH, Fe-OH, iron stain, and carbonate alterations using PCA and the mineral index method, and the obtained spatial distribution range was consistent. This reflects the validity of the PCA models and mineral indices for the extraction of alteration information.
The Huitongshan ore body occurs in the outer contact zone between the marble and granite, with potassic granite in the north and basic ultrabasic lithofacies in the south. A large amount of serpentine marble developed near the ore body. This is accompanied by evident epidotization and chloritization (Xu et al., 2011; Yu et al., 2012). Compared to the basic geological conditions of the study area (Figure 1C), Mg-OH and Fe-OH anomalies obtained from the WV-3 alteration information are all distributed in the NW of the study area, i.e., near the orebody. It can be observed that the hydroxyl group had the best extraction effect. The carbonate anomaly is scattered and primarily distributed in the north of the study area. The iron stain anomaly was distributed over a wide range, primarily in the North of the study area, and there were several abnormal polar development areas. In summary, the four types of alteration anomalies were primarily distributed in the central and Northern parts of the study area and the scale of each anomaly was different. For skarn deposits, the extraction of hydroxyl-altered mineral information has certain indications of the distribution of the ore body. This reflects the ability of the WV-3 data to identify hydroxyl-altered minerals. In addition, mapping results of the surface spatial distribution of mineral alterations (Figures 4, 5) were better than those obtained using field mapping techniques because of the spatial continuity of remote sensing data.
In this study, a total of 56 verification points were verified in the field to assess the accuracy of the alteration information extraction process. These included structures and strata, primarily for the verification of the alteration phenomenon. The specific distribution locations of the verification belts are shown in Figure 6. Field photographs of rocks from the research area are shown in Figure 7. In Figure 6, blue and green indicate the results of the Mg-OH and Fe-OH alteration information extraction, respectively. During the field investigation, the altered minerals at the corresponding locations were primarily serpentine, epidote, and chlorite (Figures 7A, B, I). This was confirmed via microscopic observation (Figures 7D, E). In Figure 6, red indicates the extraction results of the iron-stained alteration information. From a macro perspective, the distribution of the iron-stained anomaly is consistent with the gabbro in the west of the study area and that in the northeast (Figures 7H, J). The area where the alteration information was extracted in yellow corresponds to the distributions of calcite and dolomite. It can be seen from the verification results that the extraction of alteration information is highly consistent with the field geological conditions.
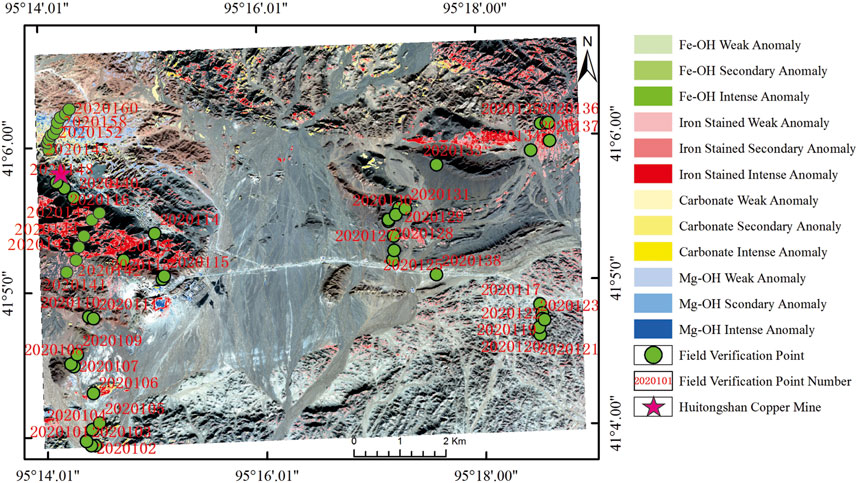
FIGURE 6. Comprehensive alteration information distribution map.
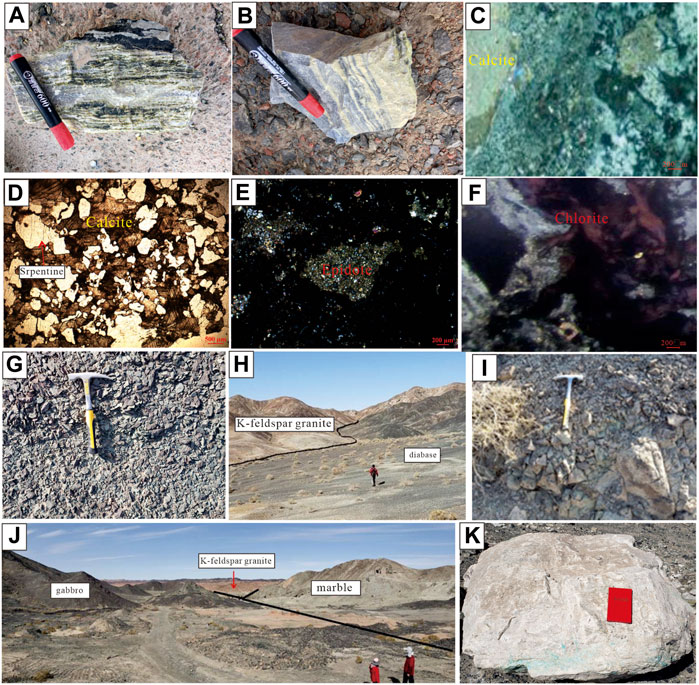
FIGURE 7. Field photographs of rocks from the research area. (A) Serpentinite from hand specimens. (B) Chlorite and epidote from hand specimens. (C) Carbonatite under the microscope. (D) Serpentinized marble under the microscope. (E) Garnet and epidote under the microscope. (F) Chlorite under a microscope. (G) Epidote in greenschist facies. (H) Diabase and K-feldspar granite contact zones. (I) Chlorite biotite granite. (J) Contact zone of gabbro, K-feldspar granite, and marble. (K) Stratified marble.
In addition, we used an error matrix to represent the accuracy and evaluate alteration information extraction (Congalton and Green, 1999). This differs from the traditional error matrix based on each pixel “class” classification. In this alteration information extraction and field verification, it was found that there may be more than one alteration type at some verification points, and an accuracy assessment of sub-pixel mapping such as this may lead to the detection of multiple classes per pixel being problematic (Ji and Jensen, 1999). In this field validation: if found at a verification point with the same type of alteration information extraction image, give error matrix assignment 1; if found in the verification point with two alterations and alteration information extraction image, and to each type of alteration in the error matrix assignment 0.5, in this case, on the error matrix of the diagonal enter a score of 0.5, for each class. If only one of the minerals was correctly detected in the alteration information extraction image, 0.5 points were entered on the diagonal of the error matrix, and a score of 0.5 is entered to indicate the respective missing errors. A similar approach was used to perform an error analysis for all field validation sites. The remaining treatment cases were similar to the traditional error matrix. There were 56 verification points in the field, which included two unclassified class points that were not included in the error matrix. The error matrix calculation results for the 54 verification points are listed in Table 6.
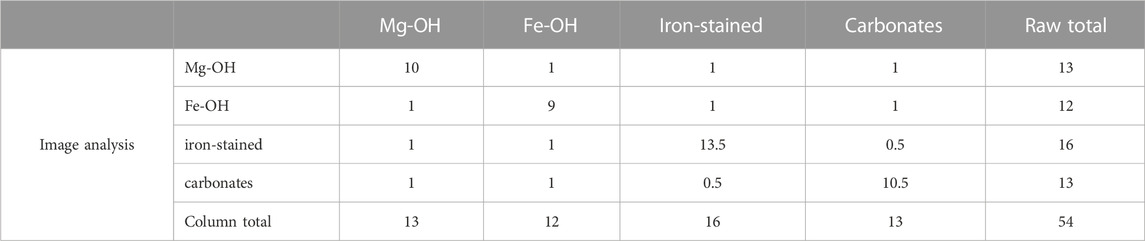
TABLE 6. Error matrix for the field observations vs. image analysis.
From Table 6, the overall accuracy was calculated to be 80%. This establishes the reliability of the results of altered mineral information extraction with WV-3 in the Huitongshan area. High-spatial-resolution alteration information images have important application value in exploration and research.
5 Conclusion
In this study, WV-3 data were used to extract alteration information related to the Huitongshan deposit using PCA and the mineral index method. Combined with the results of this study, the application effect of WV-3 multispectral imaging in various types of deposits around the world can be concluded as follows:
First, according to the extracted alteration information and combined with Figure 1C the distribution of altered minerals containing hydroxyl-bearing minerals provides a certain indication for the location of the ore body, whereas the iron staining and carbonation range is relatively large and is considered a poor ore indication.
Second, the PCA model and mineral index method proposed in this study are feasible in theory and the results obtained in this practical application are reliable.
Third, the results of alteration information extraction also show good agreement with the field evidence.
In this study, the alteration extraction results were mutually authenticated, and these, to some extent, verified the validity of the PCA models and mineral indices proposed.
Data availability statement
The original contributions presented in the study are included in the article/Supplementary Material, further inquiries can be directed to the corresponding author.
Author contributions
Conceptualization, CC and LG.; methodology, CC; software, FuX; validation, FaX; formal analysis, SL; investigation, LG, FuX, and SL; resources, CC; data curation, FuX; writing—original draft preparation, FuX; writing—review and editing, CC; visualization, LG; supervision, FaX; project administration, CC; funding acquisition, CC. All authors contributed to the article and approved the submitted version.
Funding
This work was supported by the “Mineralization prediction and potential evaluation of strategic mineral resources such as uranium, copper, tungsten and other strategic mineral resources in the Central Asia-West Asia Economic Corridor” from the Xinjiang Uygur Autonomous Region of China (Grant No. 2022A03010-3).
Acknowledgments
We are thanks to Huitongshan mine staff for their assistance in field work. Thanks to the chief editor and reviewers for their review and constructive comments, which have played a great role in the improvement of this paper.
Conflict of interest
The authors declare that the research was conducted in the absence of any commercial or financial relationships that could be construed as a potential conflict of interest.
Publisher’s note
All claims expressed in this article are solely those of the authors and do not necessarily represent those of their affiliated organizations, or those of the publisher, the editors and the reviewers. Any product that may be evaluated in this article, or claim that may be made by its manufacturer, is not guaranteed or endorsed by the publisher.
References
Aguilar, M. A., Lao, R. J., and Aguilar, F. J. (2021). Evaluation of object-based greenhouse mapping using WorldView-3 VNIR and SWIR data: A case study from almería (Spain). Remote Sens. 13, 2133. doi:10.3390/rs13112133
Alvaro, P., Crósta, C. S., and James, V. (1998). Hydrothermal alteration mapping at bodie, California, using AVIRIS hyperspectral data. Remote Sens. Environ. 65, 309–319. doi:10.1016/s0034-4257(98)00040-6
Bedini, E. (2019). Application of WorldView-3 imagery and ASTER TIR data to map alteration minerals associated with the Rodalquilar gold deposits, southeast Spain. Adv. Space Res. 63 (10), 3346–3357. doi:10.1016/j.asr.2019.01.047
Bencharef, M. H., Eldosouky, A. M., Zamzam, S., and Boubaya, D. (2022). Polymetallic mineralization prospectivity modelling using multi-geospatial data in logistic regression: the diapiric zone, northeastern Algeria. Geocarto Int. 37 (27), 15392–15427. doi:10.1080/10106049.2022.2097481
Carranza, E. J. M., and Hale, M. (2002). Mineral imaging with Landsat Thematic Mapper data for hydrothermal alteration mapping in heavily vegetated terrane. Int. J. Remote Sens. 23 (22), 4827–4852. doi:10.1080/01431160110115014
Chen, B. L., Wu, G. G., Ye, D. J., Liu, X. C., Shu, B., and Yang, N. (2007). Analysis of the ore-controlling structure of ductile shear zone type gold deposit in southern beishan area, Gansu, northwest China. J. China Univ. Geosciences 18 (1), 30–38. doi:10.1016/s1002-0705(07)60016-8
Congalton, R. G., and Green, K. (1999). Assessing the accuracy of remotely sensed data: Principles and applications. Boca Raton, FL, USA: Lewis Publishers.
Crósta, A. P., De, S. F., Azevedo, F., and Brodie, C. (2003). Targeting key alteration minerals in epithermal deposits in Patagonia, Argentina, using ASTER imagery and principal component analysis. Int. J. Remote Sens. 24 (21), 4233–4240. doi:10.1080/0143116031000152291
Crosta, A. P., and Moore, J. M. (1989). “Enhancement of Landsat thematic mapper imagery for residual soil mapping in SW minais gerais state, Brazil: A prospecting case history in greenstone belt terrain,” in Proceedings of the 9th thematic conference (Calary: Remote Sensing for Exploration Geology), 1173–1187.
Dai, Y. C., Zeng, H. D., Wang, W., Zhu, X. K., Liao, Y. S., and Yang, L. (2013). Geological characteristics and genesis of Poyi magmatic sulfide deposit in Ruo qiang County, Xinjiang. Xinjiang Geol. 31, 161–167.
Eldosouky, A. M., El-Qassas, R. A., Pour, A. B., Mohamed, H., and Sekandari, M. (2021). Integration of ASTER satellite imagery and 3D inversion of aeromagnetic data for deep mineral exploration. Adv. Space Res. 68 (9), 3641–3662. doi:10.1016/j.asr.2021.07.016
Eldosouky, A. M., Sehsah, H., Elkhateeb, S. O., and Pour, A. B. (2020). Integrating aeromagnetic data and landsat-8 imagery for detection of post-accretionary shear zones controlling hydrothermal alterations: the allaqi-heiani suture zone, south eastern desert, Egypt. Adv. Space Res. 65, 1008–1024. doi:10.1016/j.asr.2019.10.030
Fred, A. K., William, M. B., and Sandra, L. P. (2015). Validation of DigitalGlobe WorldView-3 Earth imaging satellite shortwave infrared bands for mineral mapping. J. Appl. Remote Sens. 9 (1), 096044. doi:10.1117/1.jrs.9.096044
Fu, R. L. (2011). Discussion on principal component comprehensive evaluation model. Syst. Eng. theory Pract. 11, 68–74.
Gao, H. Z. (1992). Geological characteristics if NO.1 basic-ultrabasic intrusive body and its ore potentiality, Pobei, Xinjiang. Earth Sci. J. China Univ. Geosciences 17, 391–401.
Herrmann, W., Blake, M., and Doyle, M. (2001). Short wavelength infrared (SWIR) spectral analysis of hydrothermal alteration zones associated with base metal sulfide deposits at Rosebery and Western Tharsis, Tasmania, and Highway Reward, Queensland. Econ. Geol. 96, 939–955. doi:10.2113/96.5.939
Huang, Z. Q. (2013). Copper polymetallic alteration mineral mapping of mingze in tibet based on the short wave infrared spectroscopy. Beijing, China: Geological Society of China, 287–293.
Hunt, E. R., Daughtry, C., and Li, L. (2016). Feasibility of estimating leaf water content using spectral indices from WorldView-3’s near-infrared and shortwave infrared bands. Int. J. Remote Sens. 37 (1-2), 388–402. doi:10.1080/01431161.2015.1128575
Inzana, J., Kusky, T., Higgs, G., and Tucker, R. (2003). Supervised classifications of Landsat TM band ratio images and Landsat TM band ratio image with radar for geological interpretations of central Madagascar. J. Afr. Earth Sci. 37, 59–72. doi:10.1016/s0899-5362(03)00071-x
Ji, M., and Jensen, J. R. (1999). Effectiveness of subpixel analysis in detecting and quantifying urban imperviousness from Landsat Thematic Mapper imagery. Geocarto Int. 14, 33–41. doi:10.1080/10106049908542126
Jonas, D. T., Amin, B. P., Sylvestre, G., Paul, D. A., Basem, Z., Rodrigodos, R. S., et al. (2020). Identifying high potential zones of gold mineralization in a sub-tropical region using landsat-8 and ASTER remote sensing data: A case study of the ngoura-colomines goldfield, eastern Cameroon. Ore Geol. Rev. 122, 103530. doi:10.1016/j.oregeorev.2020.103530
Kruse, F. A., and Perry, S. (2012). Mineral mapping using simulated short-wave-infrared bands planned for digtal globe WorldView-3 data. Opt. Remote Sens. Environ. 5, 2688–2703. doi:10.3390/rs5062688
Liu, L., Zhou, J., Feng, M., Li, Y. X., Niu, T., and Li, P. (2013b). Basic rock mass identification based on ETM+ data in Beishan area Gansu Province. Geol. Prospect. theory Clust. 028 (004), 589–593.
Liu, L., Zhou, J., Feng, M., Li, Y. X., and Niu, T. (2013a). Study on remote sensing Identification method for mafic rock mass in Huitongshan area, Beishan, Gansu Province. Remote Sens. Technol. Appl. 028 (003), 520–525.
Liu, L., Zhou, J., Jiang, D., Zhuang, D., and Mansaray, L. R. (2014). Lithological discrimination of the mafic-ultramafic complex, huitongshan, beishan, China: using ASTER data. J. Earth Sci. 25 (003), 529–536. doi:10.1007/s12583-014-0437-3
Lv, F. J., Hao, Y. S., and Shi, J. (2009). Alteration remote sensing anomaly extraction based on ASTER remote sensing data. Acta Geosci. Sin. 30, 271–276.
Mahanta, P., and Maiti, S. (2022b). Remote detection of hydrothermal alteration zones using WorldView-3 VNIR-SWIR reflectance data: A study from lawa gold mines, India. J. Indian Soc. Remote Sens. 50, 1979–1993. doi:10.1007/s12524-022-01577-w
Mahanta, P., and Maiti, S. (2022a). Remote geochemical alteration proxy for mineral exploration: A case study from lawa gold mines, India. J. Asian Earth Sci. 100093, 100093. doi:10.1016/j.jaesx.2022.100093
Mahdi, A. M., Eldosouky, A. M., Khateeb, S. O., Youssef, A. M., and Saad, A. A. (2022). Integration of remote sensing and geophysical data for the extraction of hydrothermal alteration zones and lineaments; Gabal Shilman basement area, Southeastern Desert, Egypt. J. Afr. Earth Sci. 194, 1464–343X. doi:10.1016/j.jafrearsci.2022.104640
Mao, Q. G., Xiao, W. J., Han, C. M., Sun, M., Yuan, C., and Zhang, J. E. (2010). Discovery of middle silurian adakite granite and tectonic significance in liuyuan area, beishan moutains, NW China. Acta Petrol. Sin. 26 (2), 584–596.
Masoumi, F., Eslamkish, T., Honarmand, M., and Abkar, A. A. (2017). A comparative study of landsat-7 and landsat-8 data using image processing methods for hydrothermal alteration mapping. Resour. Geol. 67 (1), 72–88. doi:10.1111/rge.12117
Pour, A. B., and Hashim, M. (2011). Identification of hydrothermal alteration minerals for exploring of porphyry copper deposit using ASTER data, SE Iran. J. Asian Earth Sci. 42, 1309–1323. doi:10.1016/j.jseaes.2011.07.017
Salehi, T., and Tangestani, M. H. (2020). Evaluation of WorldView-3 VNIR and SWIR data for hydrothermal alteration mapping for mineral exploration: case study from northeastern isfahan, Iran. Nat. Resour. Res. 29 (3), 3479–3503. doi:10.1007/s11053-020-09703-6
Samsudin, S. H., Shafri, H., and Hamedianfar, A. (2016). Development of spectral indices for roofing material condition status detection using field spectroscopy and WorldView-3 data. J. Appl. Remote Sens. 10 (2), 025021. doi:10.1117/1.jrs.10.025021
Shahriari, H., Ranjbar, H., and Honarmand, M. (2013). Image segmentation for hydrothermal alteration mapping using PCA and concentration–area fractal model. Nat. Resour. Res. 22 (3), 191–206. doi:10.1007/s11053-013-9211-y
Sibanda, M., Mutanga, O., and Rouget, M. (2016). Testing the capabilities of the new WorldView-3 space-borne sensor’s red-edge spectral band in discriminating and mapping complex grassland management treatments. Int. J. Remote Sens. 38 (1), 1–22. doi:10.1080/01431161.2016.1259678
Singh, A., and Harrison, A. (1985). Standardized principal components. Int. J. Remote Sens. 6 (6), 883–896. doi:10.1080/01431168508948511
Son, Y. S., You, B. W., Bang, E. S., Cho, S. J., Kim, K. E., Baik, H., et al. (2021). Mapping alteration mineralogy in eastern tsogttsetsii, Mongolia, based on the WorldView-3 and field shortwave-infrared spectroscopy analyses. Remote Sens. 13 (5), 914. doi:10.3390/rs13050914
Su, B., Qin, K., Sun, H., Tang, D., Xiao, Q., Liu, P., et al. (2012). Olivine compositional mapping of mafic-ultramafic complexes in eastern Xinjiang (NW China): implications for Cu-Ni mineralization and tectonic dynamics. J. Earth Sci. 23 (1), 41–53. doi:10.1007/s12583-012-0232-y
Sun, M., Wang, Y. H., Zhang, F. F., Lin, S. Y., Xue, C. J., Liu, J. J., et al. (2020). Petrogenesis of late carboniferous intrusions in the linglong area of eastern tianshan, NW China, and tectonic implications: geochronological, geochemical, and zircon Hf-O isotopic constraints. Ore Geol. Rev. 120, 103462. doi:10.1016/j.oregeorev.2020.103462
Tommaso, I. D., and Rubinstein, N. (2007). Hydrothermal alteration mapping using ASTER data in the Infiernillo porphyry deposit, Argentina. Ore Geol. Rev. 32, 275–290. doi:10.1016/j.oregeorev.2006.05.004
Wang, H., Wang, P., Li, J., Feng, J., Deng, G., and Lv, X. B. (2015). A tentative discussion on features of maficultramafic rocks and exploration methods in Pobei area of Ruoqiang, Xinjiang. Geol. China 42, 777–784.
Wang, Y. H., and Zhang, F. F. (2016). Petrogenesis of early silurian intrusions in the sanchakou area of eastern tianshan, northwest China, and tectonic implications: geochronological, geochemical, and Hf isotopic evidence. Int. Geol. Rev. 58, 1294–1310. doi:10.1080/00206814.2016.1152516
Wu, Z. C., Ye, F. W., Guo, F. S., Liu, W. H., Li, H. L., and Yang, Y. (2018). A review on application of techniques of principle component analysis on extracting alteration information of remote sensing. J. Geo-information Sci. 20 (11), 1644–1656.
Xiao, Y. F., Wang, D. Y., Wu, D. C., Deng, J. H., and He, Z. W. (2000). Geological evolution of western beishan tectonic belt of Xinjiang. Chengdu: Sichuan Science Press, 7–9.
Xu, M. Z., Zhu, L. X., Ma, S. M., Sun, Y., Tang, S. X., and Lu, L. (2011). Element supergenesis activity of skarn type copper deposit in beishan area: A case study of huitongshan copper deposit. J. Jilin Univ. (Earth Sci. Ed. 04, 106–117.
Yang, G. X., Li, Y. J., Tong, L. L., Wang, Z. P., Si, G. H., Lindagato, P., et al. (2022). Natural observations of subduction initiation: implications for the geodynamic evolution of the Paleo-Asian Ocean. Paleo-Asian Ocean. Geosystems Geoenvironment 1, 100009. doi:10.1016/j.geogeo.2021.10.004
Yang, J. G., Wang, L., Wang, X. H., Xie, X., and Qi, Z. G. (2012a). Zircon SHRIMP U-Pb dating of heishan mafic-ultramafic complex in the beishan area of Gansu Province and its geological significance. Geol. Bull. China 31 (2-3), 448–454.
Yang, J. Z. (2007). The technical system of multispectral remote sensing anomaly extraction. Remote Sens. Land Resour. 74, 43–46.
Yang, Z. M., Hou, Z. Q., Yang, Z. S., Qu, H. C., Li, Z. Q., and Liu, Y. F. (2012b). Application of short wavelength infrared (SWIR) technique in exploration of poorly eroded porphyry Cu district: A case study of niancun ore district, tibet. Mineral. Deposits 31, 699–717.
Yu, J. Y., Li, X. M., Wang, G. Q., Wu, P., Yan, Q. J., Ma, J. Y., et al. (2012). JJK694, a synthesized obovatol derivative, inhibits platelet activation by suppressing cyclooxygenase and lipoxygenase activities. Geol. Bull. China 12, 2038–2043. doi:10.1271/bbb.120369
Zhang, T. R., Xiao, K., Zhu, Y., and Cui, N. (2003). A prediction model for important mineral resources in China. Ore Geol. Rev. 91, 1094–1101. doi:10.1016/j.oregeorev.2017.09.010
Zhang, X. f., Pazner, M., and Duke, N. (2007). Lithologic and mineral information extraction for gold exploration using ASTER data in the south Chocolate Mountains (California). ISPRS J. Photogrammetry Remote Sens. 62, 271–282. doi:10.1016/j.isprsjprs.2007.04.004
Zhao, Z. F., Zhou, J. X., Lu, Y. X., Chen, Q., Cao, X. M., He, X. H., et al. (2021). Mapping alteration minerals in the pulang porphyry copper ore district, SW China, using ASTER and WorldView-3 data: implications for exploration targeting. Ore Geol. Rev. 134, 104171. doi:10.1016/j.oregeorev.2021.104171
Keywords: WorldView-3, mineral index method, principal component analysis, Huitongshan, Gansu
Citation: Chen C, Gao L, Xie F, Xia F and Li S (2023) Extracting hydrothermally altered information using WorldView-3 data: a case study of Huitongshan, NW Gansu, China. Front. Earth Sci. 11:1250591. doi: 10.3389/feart.2023.1250591
Received: 30 June 2023; Accepted: 07 September 2023;
Published: 19 September 2023.
Edited by:
Qigui Mao, Chinese Academy of Sciences (CAS), ChinaCopyright © 2023 Chen, Gao, Xie, Xia and Li. This is an open-access article distributed under the terms of the Creative Commons Attribution License (CC BY). The use, distribution or reproduction in other forums is permitted, provided the original author(s) and the copyright owner(s) are credited and that the original publication in this journal is cited, in accordance with accepted academic practice. No use, distribution or reproduction is permitted which does not comply with these terms.
*Correspondence: Lingling Gao, Z2xsZ2FvbGluZ0B4anUuZWR1LmNu