 Guo Qiang1
 Xudong Ma
- 1Shaanxi Provincial Land Engineering Construction Group Weibei Branch, Xianyang, China
- 2CCCC First Highway Consultants Co., Ltd., Xi’an, China
- 3China Coal Science and Technology Ecological Environment Technology Co., Ltd., Beijing, China
Fast and accurate prediction for mechanical parameters of rock mass is an important prerequisite for guiding the safe construction of rock engineering. At present, the rock strength parameters test requires well-prepared samples; sample preparation is time consuming, costly, and difficult as well as destructive, in particular the polishing and rectification of the sample ends. In this paper, the mathematical model of the drilling process is established based on the force characteristics of the drill bit and the principle of mechanical limit equilibrium. The digital drilling tests are carried out on four types of rocks to drilling characteristics using the digital drilling system. The concept of cutting strength ratio is proposed to analyze the correlation between cutting strength ratio and rock internal friction angle and cohesion. A new method is proposed for determining the compressive and tensile strength of rock. The results show that the cutting strength ratio increases with the increasing of internal friction angle and cohesion. The uniaxial compressive strength and tensile strength of rock increase linearly with the cutting strength ratio. The average error of rock tensile strength is 12.29%, and the average error of uniaxial compressive strength is 20.44%. The internal friction angle of rock obtained based on the digital drilling technology is consistent with the value measured by the laboratory standard test. This method can provide a new way to determine rock strength parameters in real time.
1 Introduction
Accurate measurement of uniaxial compressive strength and tensile strength of rock is the premise to ensure the safety and stability of engineering rock mass. Evaluation of rock mass strength characteristics has practical significance in engineering design and construction (Teymen et al., 2020; Chen et al., 2021; Liu et al., 2022; Liu et al., 2023a). At present, the uniaxial compressive strength is often obtained by rock uniaxial compression test and point load test (Wang et al., 2018; Hao et al., 2020; He et al., 2022). Representative tensile strength testing methods for rock include direct tensile test, Brazilian splitting test, three-point or four-point bending tensile test, hollow rock column test, etc. (Yue et al., 2014; Wang C.-H. et al., 2020; Du et al., 2020; Du et al., 2023a; Du et al., 2023b; Qiu et al., 2020). The determination of rock strength parameters requires an elaborate sample preparation process. Samples are often polished and shape modified, a process that is time-consuming and expensive. Therefore, some scholars use indirect methods such as point load method, scratch method, and Schmidt hammer method to determine the uniaxial compressive strength of rock (Palassi and Emami, 2014; Naeimipoura et al., 2018; He et al., 2019a). Some scholars also use laboratory and field hydraulic fracturing tests to determine rock tensile strength values (Wang Y.-J. et al., 2020). However, these methods have limited information for obtaining in situ rocks, and cannot fully reflect the properties of rocks in the field (Huang et al., 2019; Huang et al., 2020; Huang et al., 2023; Jiang et al., 2021). These methods provide limited information on rocks in the field. Bringing rock samples into an indoor environment cannot fully capture the true characteristics of wild rocks (Naeimipoura et al., 2018). For convenience, empirical estimations of strength are usually obtained from field test to evaluate mechanical properties of in situ rock masse. Therefore, there is need to improve the accuracy of field measurement method of rock strength.
As a new method, digital drilling technology can be used to determine the strength parameters of rock (Tan et al., 2007; Munoz et al., 2016; Wang et al., 2019). This method has the characteristics of continuous measurement, no sampling and simple operation (Naeimipoura et al., 2018). It can predict the strength of the rock in the field through the drilling parameters recorded by the monitor. For nearly 50 years, researchers have proposed analytical models for the force and energy balances of various drill bits in operation. Based on digital drilling technology, the prediction accuracy of rock strength parameters is continuously improved. Among them, Nakajima et al. (1979) established the relationship between drilling data and rock in the rock fracture zone based on the force balance model. Kalantari developed an analytical model using a T-shaped drag bit to estimate rock strength parameters (Kalantari et al., 2018). Based on the analytical model of energy balance, Munoz established a linear relationship between the energy ratio of rock and uniaxial compressive strength (Munoz et al., 2016; Munoz et al., 2017; Wang et al., 2019). The tensile strength of rock is also an important mechanical index to measure rock performance. The predecessors have done a lot of research work on the compressive strength characteristics of rocks based on digital drilling technology. However, the tensile failure and shear failure is can be observed in the process of drilling. The correlation between the drilling mechanical properties and tensile strength is also unclear, nor the method for determining tensile strength.
According to the mechanical balance of the drill bit, the analysis model of the drill bit is established in this paper. Drilling tests were performed on four rocks using a digital drilling system. By analyzing the relationship between the bit parameters, a method is proposed for predicting the rock internal friction angle. There is a correlation between rock internal friction angle and uniaxial compressive and tensile strength. The correlation between rock cutting strength ratio and uniaxial compressive strength and tensile strength was analyzed based on the analytical model. Finally, according to the fitting formula of rock cutting strength ratio and two strengths, a new method to determine rock strength is proposed. The reliability of the method is verified by comparing the predicted strength with the measured value of the laboratory test strength. The flowchart of the research contents of the article is shown in Figure 1.
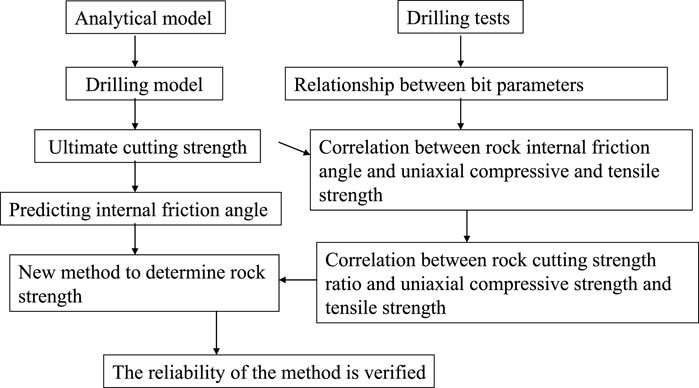
FIGURE 1. Flowchart of the research contents of the article.
2 Analytical model
The drilling parameters, including drilling speed, thrust, rotational speed and torque, are closely related to the mechanical parameters of the rock (He et al., 2020). Generally, the process of drilling into rock by a drill bit is divided into a cutting stage and a friction stage. During these two phases, thrust and torque forces play an important role in the execution of the drilling process. These two forces occur continuously, rapidly and simultaneously when the drill bit works. As shown in Figure 2, the thrust force and the torque force each have two components, one is the cutting force and the other is the friction force (Munoz et al., 2016; Munoz et al., 2017; Kalantari et al., 2018):
where
where
where C is the cohesive force of the rock, and
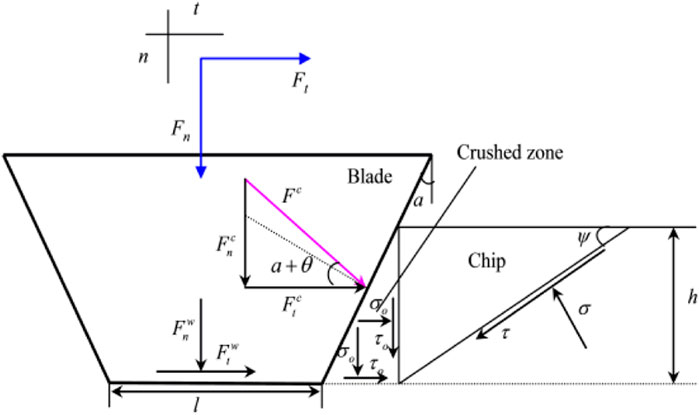
FIGURE 2. The geometry and mechanism of the force in the analysis model.
Where
The parameter
Based on the Mohr-Coulomb criterion, the unconfined compressive strength of the rock is calculated as (Munoz et al., 2016; Munoz et al., 2017; Kalantari et al., 2018)
By giving the geometric parameter a of the drill bit, a = 5° in this paper, the ratio of the unconfined compressive strength of the rock to the ultimate cutting strength can be calculated as
The value of
The friction angle coefficient of clastic rock during drilling can be calculated as (Kalantari, 2018)
The analytical relationship between rocks
According to Eq. 12 and Eq. 13, the rock internal friction angle is calculated as
3 Test plan and prediction idea
3.1 Test equipment
The XCY-1 rock mechanics parameter drilling system developed by Xi’an University of Technology was used in this digital drilling test (Figure 3A). The instrument comes with a crawler hub, which can meet most field drilling operations. The instrument consists of six parts. Including: electrical control system, hydraulic system, oil pump transmission system, real-time monitoring system, data acquisition control system and diamond drill bit. The inner diameter of the drill is 50 mm and the outer diameter is 60 mm. The instrument is divided into two modes: ordinary drilling and parameter acquisition. Among them, the ordinary drilling mode is suitable for the pre-drilling stage before the test depth. The parameter acquisition mode is suitable for the accurate acquisition of digital drilling parameters. The operating parameters of the instrument are set according to the geological exploration report data. The digital drilling system runs intelligently according to the operating parameters. During the drilling process, the system records the thrust, torque, rotational speed and drilling speed at different depths. During the drilling process, the loading servo motor and the torque servo motor operate independently. The two motors provide a maximum thrust of 18 kN and a maximum torque of 2458 Nm respectively. The instrument can accurately measure thrust, torque and drilling depth through self-control. In the test, the ROP (w) and ROP (v) are used as control parameters, and the thrust and torque can be obtained at the same time. As the drilling depth increases, it can automatically save the job data in an Excel file. The maximum acquisition capability of 500 pieces of data per second enables the device to accurately store hundreds of sets of data.
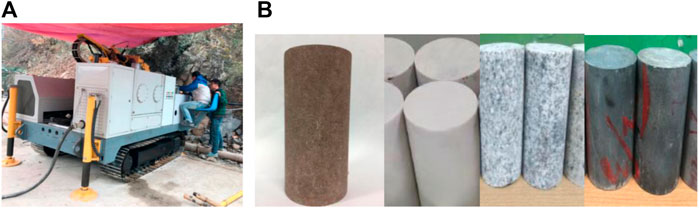
FIGURE 3. XCY-1 digital drilling system and Photographs illustrating the sample.
The test equipment used for uniaxial compression test and Brazilian splitting test is WDT-1500 multifunctional material testing machine. The instrument control system adopts DOLI full digital servo controller imported from Germany. The testing machine is mainly a rigid dynamic mechanical equipment developed for high-strength materials such as rock and concrete. The tests are carried out entirely under computer control. Real-time data recording can be achieved by adopting advanced adaptive control methods and post-processing software Test. The system directly displays the stress-strain curve of the rock, accurately reflecting the change of its mechanical properties.
3.2 Field drilling, rock sample processing, indoor testing
The digital drilling test site is located in Qinling Mountains, Shaanxi Province, which is rich in rock species. Four kinds of rock samples, sandstone, marble, shale and diorite, were obtained by drilling sampling at the same site (Figure 3B). The depth of the borehole is above the water table, which allows the rock sample to retain its natural water content. The marble at the sampling point mainly contains two minerals, dolomite and calcite, with a particle size distribution of 0.4–1.4 mm. The clastic structure of the sandstone is sub-circular, with a clastic content of 86% and an interstitial content of 14%. Its mineral composition is mainly clay minerals (kaolinite, hydromica, etc.), and has an obvious thin bedding structure. Diorite is mainly composed of plagioclase and several dark minerals, of which the total amount of dark minerals is about 20%–35%. To reduce the effect of rock discontinuities on the results, the rock was collected on a homogeneous, coherent rock formation. For the rock of the same lithology, the number of drilling tests using the drill bit is more than 5 times. In addition, all drilled holes are quickly tested to avoid environmental factors such as humidity, temperature, etc. affecting the test results. The samples were processed according to the “Standards for Engineering Rock Mass Test Methods” (GB/T50266-2013). After cutting and grinding, cylindrical standard samples of Ф 50 × 100 mm and Ф 25 × 50 mm were made. The height-diameter ratio of the sample is 1:2. Among them, the Ф50 × 100 size specimen was used for the uniaxial compression test. The Ф50 × 25 size specimen was used for the Brazilian splitting test. The non-parallel error of the end face of the sample is not more than 0.005 mm. The unevenness error of its section is not more than 0.02 mm. The vertical diameter error of the side surface of the sample is not more than 0.30 mm.
Field digital drilling test parameters include drilling speed, torque, rotational speed and drilling thrust. The drilling speed of the drill was set at 0.10–1.20 mm/min, and the rotation speed of the drill was set at 200–600 rpm. In order to protect the test system, when the drilling speed exceeds 1 mm/min, the rotation speed is controlled above 200 r/min. After several sets of drilling tests, the propulsion force and torque required for the drilling process of the drill bit are finally obtained. The indoor uniaxial compression test and the Brazilian splitting test were performed using the displacement-controlled loading method. The test loading rate was 0.5 mm/min until the specimen failed. By analyzing the stress-strain curve, the peak strength is taken as the ultimate strength of compression test and splitting test. The peak strength obtained from the uniaxial compressive test is the uniaxial compressive strength of the rock. The peak strength obtained by Brazilian splitting is the tensile strength of the rock. Through multiple sets of parallel tests, the average compressive strength and average tensile strength of the four kinds of rocks were obtained.
3.3 Prediction ideas
The idea of rock strength prediction in this paper is shown in Figure 4. First, the digital drilling experiment was carried out on four kinds of rocks using the digital drilling system. The drilling parameters
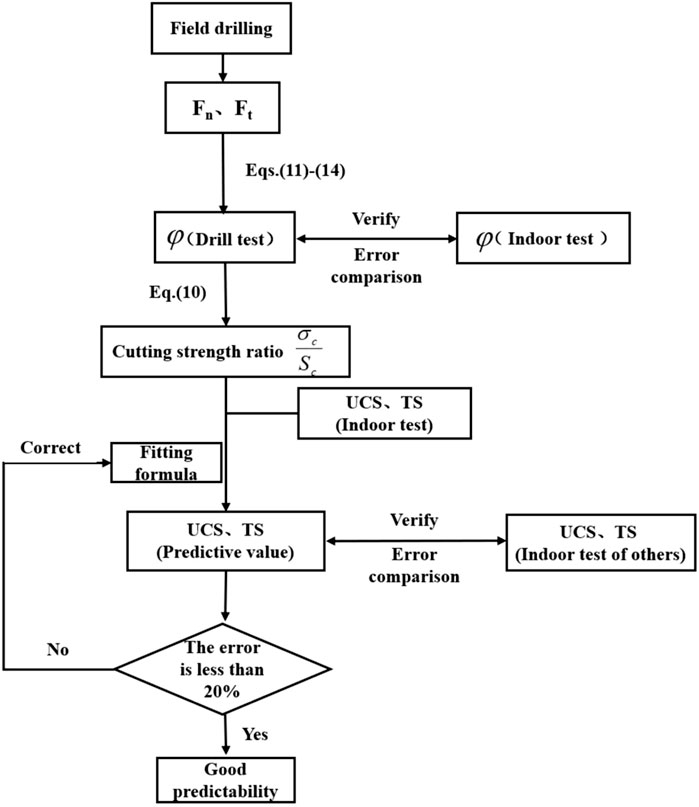
FIGURE 4. Flow chart of rock strength prediction.
4 Result
4.1 Digital drill parameters
During the digital drill test, the drill bit gradually intrudes into the rock from the rock surface, and the thrust and torque required by the drill bit are changing. The digital drilling system controls the drilling speed and rotation speed, and records the thrust and torque of the drill bit under different drilling depths in real time. In order to accurately reflect the mechanical properties of the rock, 18 sets of drilling parameters were recorded for the four types of rocks. According to the monitoring results of the torque and thrust corresponding to the four kinds of rocks, the mathematical relationship between them is established. Taking the x-axis as the propulsion force and the y-axis as the torque force, draw a scatter diagram of the relationship between the two, and the results are shown in Figures 5A–D.
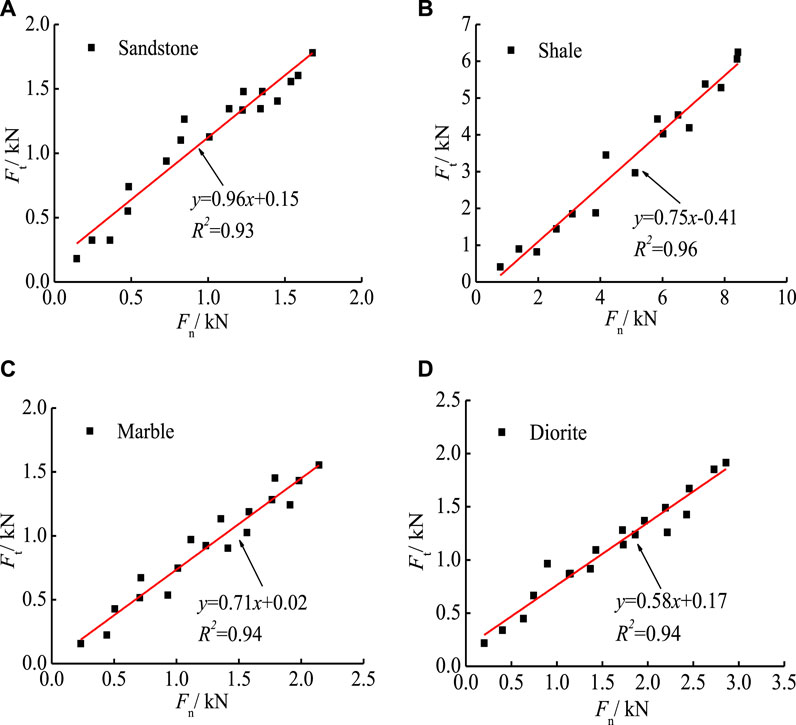
FIGURE 5. Tangential force and thrust of different rocks during drilling.
According to Figure 5, due to the different particle size and degree of cementation of the rock, the torque and thrust of the drill bit into different rocks are also different. Fitting the relationship between torque and thrust, the fitting equation is different for different rocks. Sandstone is a sedimentary rock composed of various sand grains tightly cemented. When the bit drills into the sandstone, the torsion force is close to the thrust force, and the slope of the fitting equation of the two is the largest (Figure 5A). Diorite is a representative rock of holocrystalline neutral plutonic rock and one of the types of granite. The crystal diameter of diorite is small, the rock structure is dense, and the hardness is high. When the drill bit drills into the rock, the thrust force is much greater than the torque force, and the slope of the fitting equation of the two is the smallest (Figure 5D). When the bit first enters the rock, the torque and thrust are zero, so the intercept of the fitted equation is considered negligible. The slope of each fitting equation is considered to be the ratio of torque and thrust, namely,
As the depth of penetration of the drill into the rock continues to increase, the thrust and torque forces of the drill also increase. After linear fitting, the fitting degrees of thrust and torsion of the four kinds of rocks are all above 90%, reflecting the good correlation between the two. The
4.2 Relationship between internal friction angle and cohesion
Through laboratory tests, the physical properties and mechanical indexes of four kinds of rocks were measured. The basic physical and mechanical parameters of rocks are shown in Table 1. According to the data in Table 1, the relationship between rock strength, internal friction angle, and cohesion is analyzed, as shown in Figures 6A, B. It can be seen from Figure 6A that with the increase of the internal friction angle, the uniaxial compressive strength and tensile strength of the rock both increase. The compressive and tensile strengths and the internal friction angle of the four kinds of rocks are linearly fitted, and the fitting equations are obtained. The fitting degrees are R2=0.96 and R2=0.90, respectively, indicating that the rock strength has a good linear correlation with the internal friction angle. Among them, the uniaxial compressive strength of the rock is much greater than the tensile strength. The slope of uniaxial compressive strength as a function of internal friction angle is also greater than that of tensile strength. After relationship fitting, the fitting equations of rock compressive strength, tensile strength and cohesive force are obtained. The fitting degrees are R2 = 0.99 and R2 = 0.88, respectively, indicating that the rock strength and cohesion are linearly related (Figure 6B).
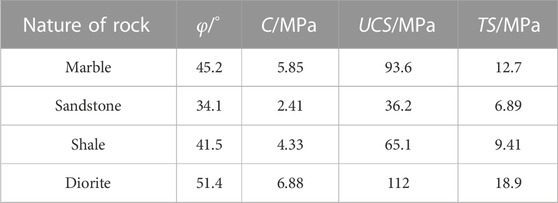
TABLE 1. Basic physical and mechanical parameters of rock.
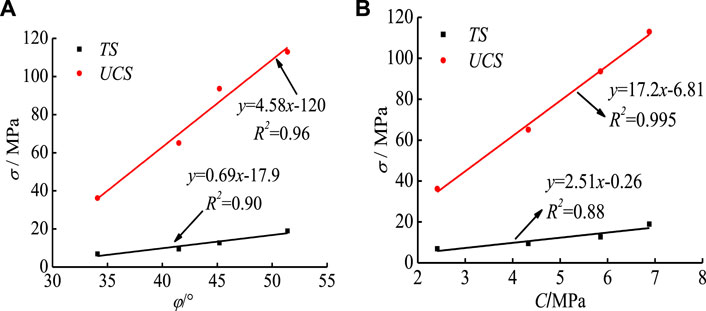
FIGURE 6. The relationship between rock strength, internal friction angle and cohesion.
As shown in Figures 7A, B, the ratio of uniaxial compressive strength and tensile strength of rock with internal friction angle (Figure 7A) and cohesive force (Figure 7B) first increases and then decreases. The value of the internal friction angle and cohesion of sandstone is the smallest, and the corresponding strength ratio is also the smallest. Diorite has the largest internal friction angle and cohesion value, as well as its uniaxial compressive strength and tensile strength. But the ratio of uniaxial compressive strength to tensile strength of diorite is not the largest. The ratio of uniaxial compressive strength to tensile strength of marble is the largest.
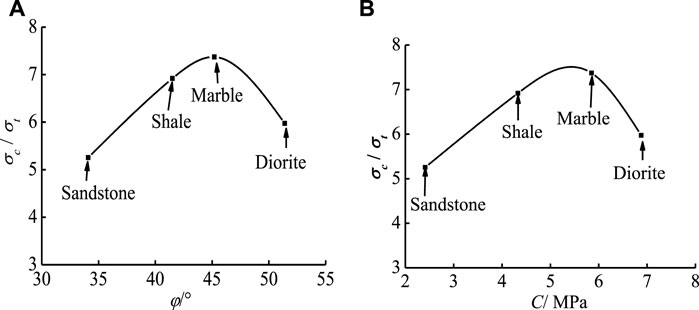
FIGURE 7. The relationship between the ratio of uniaxial compressive strength and tensile strength, internal friction angle and cohesion.
4.3 Comparative analysis of rock internal friction angle under different tests
The internal friction angles of marble, sandstone, shale and diorite were obtained through digital drilling tests. This is compared with the rock internal friction angle measured in a standard laboratory, as shown in Table 2.
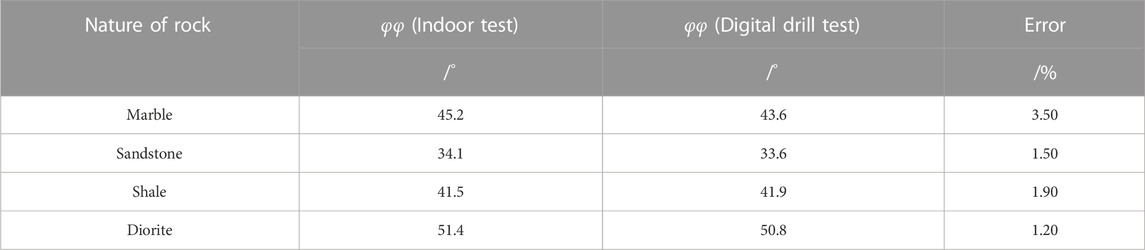
TABLE 2. Analysis of the rock internal friction angle between the digital drill test and the laboratory test.
The error analysis of the rock internal friction angle value obtained from the drilling test and the measured value of the laboratory test is carried out, as shown in Figure 7. The rock internal friction angle measured by the laboratory test is the X axis, and the rock internal friction angle obtained by the drilling test is the Y axis. The 45° oblique line on the coordinate axis is the reference line. The closer the point determined by the X and Y axis coordinates is to the reference line, the closer the rock internal friction angle obtained by the two test methods. In Figure 8, the coordinate points of the four rocks are close to the reference line, but not in contact. The errors of the four kinds of rocks are between 1.2% and 3.5%, all less than 10%. The results show that the value of the rock internal friction angle obtained by the digital drilling test is relatively accurate.
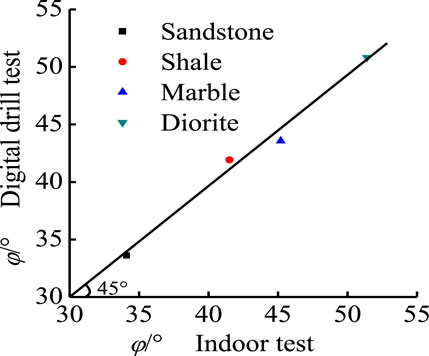
FIGURE 8. Analysis of the deviation of the rock internal friction angle between the digital drill test and the laboratory test.
4.4 Relationship between rock cutting strength ratio and internal friction angle and cohesion
According to the above, the ratio of rock uniaxial compressive strength to tensile strength has no obvious correlation with rock internal friction angle and cohesion. The rock internal friction angle obtained by the digital drilling test is close to the measured value of the laboratory test. The mechanical analysis model of the drill bit is reliable. Therefore, the article further analyzes the relationship between cutting strength ratio and internal friction angle, cutting strength ratio and cohesion.
4.4.1 Relationship between cutting strength ratio and internal friction angle
Based on the analytical model, the rock internal friction angles obtained from laboratory tests and digital drilling tests are substituted into Eqs 10–14. The cutting strength ratios of the four kinds of rocks were obtained, as shown in Table 3. The cutting strength ratios of marble, sandstone, shale and diorite obtained by the laboratory test are 3.65, 2.41, 3.14 and 4.78, respectively. The cutting strength ratios obtained by the digital drilling test are 3.41, 2.36, 3.19 and 4.73, respectively. The results show that the strength ratios of rocks corresponding to different lithologies are different. Among them, the cutting strength ratio of sandstone is the smallest. The cutting strength ratio of diorite is the largest. The cutting strength ratios obtained by the laboratory standard test and the digital drill test for the four kinds of rocks are close. The error is between 1.60% and 6.80%, less than 10.0%.
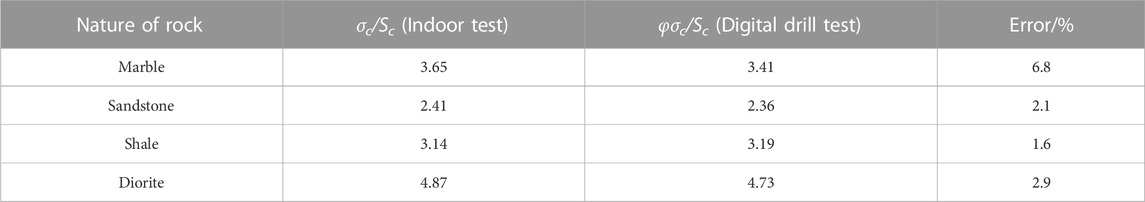
TABLE 3. Comparison and analysis of the intensity ratio between digital drill test and indoor test.
According to the data in Table 3, the rock cutting strength ratio obtained by the laboratory test is the x-axis, the rock cutting strength ratio obtained by the digital drilling test is the y-axis. The 45° oblique line is the reference line. The closer the points determined by the x and y axis coordinates are to the reference line, the closer the rock cutting strength ratios obtained from the two experiments are. It can be seen from Figure 9 that the cutting strength ratios of the four rocks obtained from the two tests are very close. Different types of rocks have different cutting strength ratios. Diorite has the highest cutting strength ratio, shale and marble are in the middle, and sandstone is the smallest.
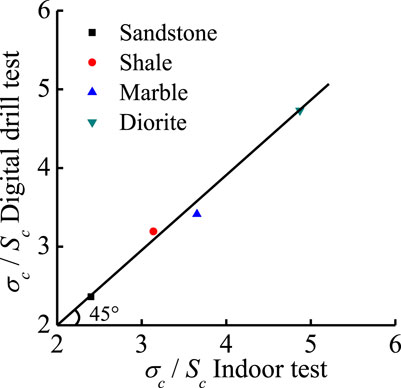
FIGURE 9. Comparison and analysis of the intensity ratio between digital drill test and indoor test.
According to the laws of mechanical parameters of rocks in practical engineering, the value of the internal friction angle ranges from 30° to 70°. According to Eqs 10–14, the change of the strength ratio under different internal friction angles is further analyzed. As shown in Figure 10, when the rock internal friction angle is 30°, the cutting strength ratio is 2.10. when the internal friction angle is 70°, the cutting strength ratio is 17.5. The rock strength ratio increases with the increase of the internal friction angle, and the increasing range keeps increasing.
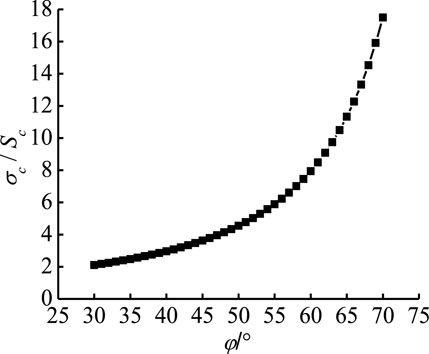
FIGURE 10. The relationship between rock strength ratio and internal friction angle.
4.4.2 Relationship between cutting strength ratio and cohesion
As shown in Figure 11, there are differences in the mechanical properties of rocks due to different lithologies. Among them, sandstone and shale are sedimentary rocks. Marble is a metamorphic rock. Diorite is an igneous rock. The cohesiveness of diorite is the largest, followed by shale and marble, while sandstone is the smallest. With the increase of rock cohesion, the strength ratio also tends to increase, and the increase gradually increases.
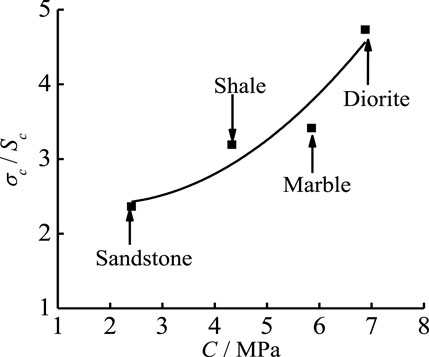
FIGURE 11. Relationship between strength ratio and cohesion.
4.5 Relationship between rock strength and cutting strength ratio
According to the above, the rock cutting strength ratio has a good positive correlation with the internal friction angle and cohesion. In order to further study the relationship between rock strength and internal friction angle, try to analyze the relationship between rock strength and cutting strength ratio. Taking the cutting strength ratio of the rock as the abscissa and the rock strength as the ordinate, draw a scatter diagram and fit the relationship, as shown in Figures 12A, B. It can be seen that the tensile strength and uniaxial compressive strength of the four kinds of rocks all increase with the increase of the cutting strength ratio. The fitting equation of the ratio of rock tensile strength to cutting strength is y = 4.98x-5.52, R2 = 0.99 (Figure 12B). The fitting equation of rock uniaxial compressive strength to cutting strength ratio is y = 31.2x-32.6, R2 = 0.93 (Figure 12A). The tensile strength and uniaxial compressive strength of the four kinds of rocks have a positive linear relationship with the cutting strength ratio.
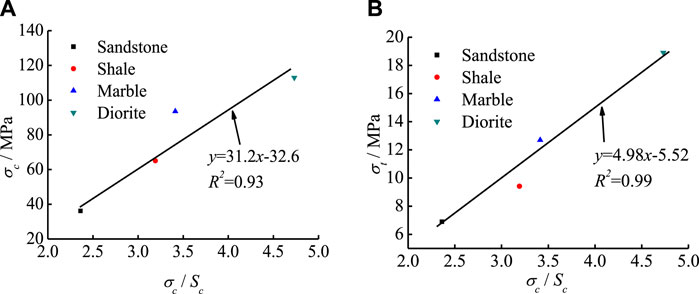
FIGURE 12. The relationship between rock tensile and compressive strength and strength ratio.
5 Discussion
The basic physical and mechanical parameters of rock in the published articles such as internal friction angle, uniaxial compressive strength, and tensile strength are collected. For example, Zou et al. (2020) performed uniaxial compressive strength test and Brazilian splitting test on granite to obtain the basic mechanical property parameters of the rock. Xu et al. (2017) obtained the mechanical parameters of the rock by conducting indoor physical tests on Jinping marble. Peng et al. (2012) used the Anqing Copper Mine as the sampling site to measure the mechanical parameters of hard rocks such as diorite and granite. Li et al. (2003) conducted an indoor rock mechanical performance test on schist, and obtained the basic mechanical parameters of the rock. Yin et al. (2003) conducted laboratory experiments on the mechanical properties of crystalline limestone, and obtained a series of mechanical parameters. Huang et al. (2019) obtained the basic physical and mechanical parameters of various rocks such as quartz porphyry, quartz sandstone, ore rock, and silicified limestone through indoor rock mechanics experiments. Yang et al. (2010) obtained the physical and mechanical parameters of granite through laboratory experiments. Sun et al. (2011) obtained the rock mechanics parameters of the ore rock in the Sanchahe mining area through laboratory test research on the rock mass of the mining area. Liu et al. (2015) sampled the gabbro in the Bijigou open-pit mine and conducted laboratory tests to determine its rock mechanical parameters. The mechanical parameters of various rocks in the literature are shown in Table 4 and Table 5. Based on the analytical model, the digital drilling test can obtain the rock internal friction angle close to that of the laboratory test. By substituting the predicted internal friction angle into Eqs 10–14, the cutting strength ratio of each rock can be obtained. Further research found that the strength of each rock increases linearly with the cutting strength ratio. Therefore, an attempt can be made to predict rock strength through the indirect relationship between rock internal friction angle and rock strength. In order to test the reliability of this prediction idea, the rock internal friction angle measured by other scholars was substituted into the analysis model to obtain the cutting strength ratio. Based on the fitting formula of cutting strength ratio and strength, the predicted value of rock strength is obtained. The predicted values were compared with the measured values of the intensity in the published paper. The rake angle of the diamond particles in this paper is a = 5°. The cutting strength ratio of each rock was obtained from the internal friction angle of the rock in Table 3 according to Eqs 10–14. According to the fitting equation of the ratio of strength and cutting strength, the strength prediction values of each rock are obtained, as shown in Table 6 and Table 7. The error is compared between the predicted value and the measured strength value in the scholar’s paper, as shown in Figures 13A, B. In the fourth part, although the used fitting method is simple, the fitting method has good performance in the predicted strength values of different rocks in Figures 13A, B. The predicted values for both intensities are close to the laboratory test values. The error between the predicted value of the rock tensile test and the measured value of the laboratory test is between 3.07% and 28.1%, and the average value is 12.2% (Figure 13A). The error between the predicted value of rock uniaxial compressive strength and the measured value of laboratory test is between 1.01% and 35.0%, and the average value is 20.4% (Figure 13B). The rock strength prediction method proposed in this paper is more accurate for rock tensile strength prediction, and the error is controlled within 20.0%. The average error of this method for predicting the uniaxial compressive strength of each rock is slightly more than 20.0%. In this paper, a drilling-based measuring method is established for the strength parameters of rock. The drilling test system is used to conduct laboratory tests on sandstone, marble, shale and diorite with a strength range of 20–120 MPa. It is unnecessary to take samples and transport them to the laboratory for testing using the proposed method. It is capable of acquiring the strength parameters of the surrounding rock in situ and continuously. On the basis of this study, the drilling tests of different rock types will be widely carried out to further improve the proposed method. In addition, it is crucial to take into account the influence of structure characteristics on rock strength parameters and adapt this measurement method to different engineering conditions. Overall, the method is able to reasonably predict rock strength, proving the validity of the analytical model.
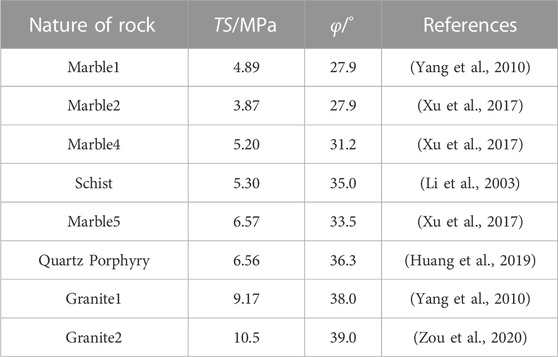
TABLE 4. Parameters of basic physical and mechanical properties of rocks (1).
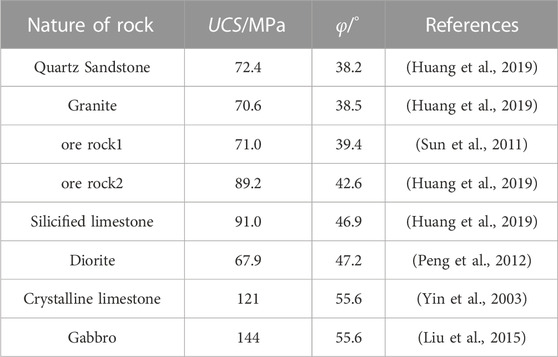
TABLE 5. Parameters of basic physical and mechanical properties of rocks (2).
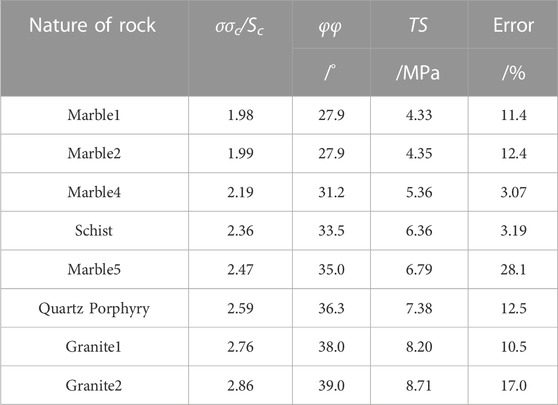
TABLE 6. Predicted values of rock tensile strength.
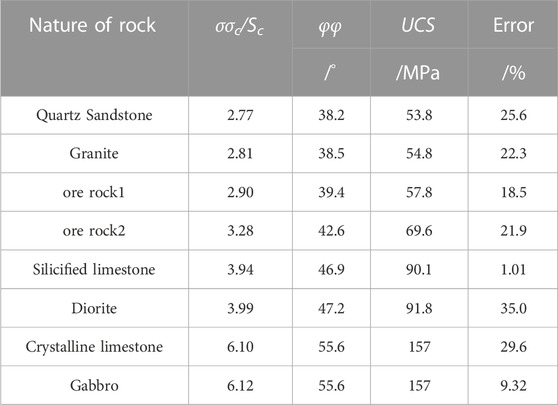
TABLE 7. Predicted values of rock uniaxial compressive strength.
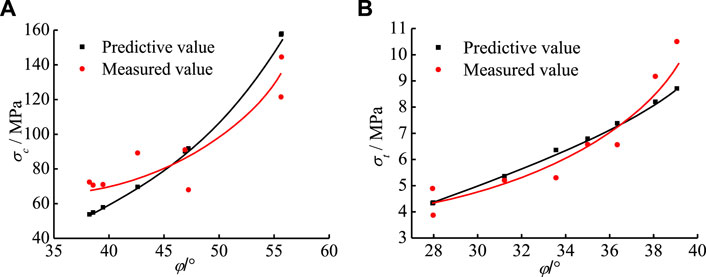
FIGURE 13. Comparison and analysis of the predicted intensity of digital drill test and laboratory test intensity.
The mechanical properties of rock mass is generally influenced by all kinds of structural plane, tectonic fracture and complex stress state, where engineering behavior shows strong inhomogeneity, anisotropy and heterogeneity and discontinuity, resulting the uncertainty of mechanics characteristics for rock mass. Rock mass discontinuity is mainly affected by block and the structure, which leads to the discontinuity of the mechanical properties of rock mass in space. In recent years, many scholars (Yue et al., 2014; He et al., 2019b) use the drilling method to obtain the characteristics of rock mass structural plane distribution and mechanics parameters. Yue et al. (2014) use monitoring while drilling technology to measure effectively the uniaxial compressive strength of rocky, and the rock mass discontinuity. He et al. (2019a) use the rotary penetration to obtain mechanical parameters of rock mass methods, degree of soft rock and structure identification methods. The monitoring while drilling technology has been used to qualitative and quantitative analyze the distribution characteristics of rock joints, and provided the data source to achieve the modeling of rock mass. The test results for rock mass discontinuities in the laboratory is different with those in situ, which is very difficult to test the properties of rock mass in laboratory. Therefore, the future research focuses on the influence of rock mass discontinuities in situ and laboratory tests.
6 Conclusion
(1) Based on the working principle of the rock-breaking process of the diamond bit, a mathematical model of its force balance is proposed. According to the drilling parameters recorded by the digital drilling system, the internal friction angles of the four kinds of rocks are predicted. The results show that the internal friction angle of the rock obtained by digital drilling technology is close to the standard test data. The error is within the acceptable range of 10%.
(2) Through the laboratory test, the relationship between the strength of four kinds of rocks, the angle of internal friction and the angle of condensation is analyzed. The results show that there is a positive linear correlation between the rock strength value and the internal friction angle value. The relationship between the ratio of uniaxial compressive strength to tensile strength and the angle of internal friction and cohesion of the four kinds of rocks was analyzed. The results show that the ratio of rock uniaxial compressive strength to tensile strength is not positively correlated with the angle of internal friction and cohesion.
(3) Based on the analytical model, the concept of rock cutting strength ratio is proposed. The relationship between the rock cutting strength ratio and the internal friction angle is analyzed. The cutting strength ratio increases with the increase of the internal friction angle. The relationship between the uniaxial compressive strength, tensile strength and cutting strength ratio of rock was studied. An empirical formula for the ratio of rock strength to cutting strength is obtained. According to the relationship among rock internal friction angle, strength ratio, uniaxial compressive strength and tensile strength, a method for predicting rock strength is proposed.
(4) The results show that the predicted value is close to the measured value. The average error of rock tensile strength is 12.29%, and the average error of uniaxial compressive strength is 20.44%. This method can effectively estimate rock strength. By improving the measurement efficiency of rock strength, the purpose of saving construction period is achieved.
Data availability statement
The original contributions presented in the study are included in the article/Supplementary Material, further inquiries can be directed to the corresponding author.
Author contributions
GQ: Data curation, Formal Analysis, Funding acquisition, Validation, Writing–original draft. XM: Data curation, Methodology, Project administration, Resources, Writing–review and editing. XL: Conceptualization, Investigation, Methodology, Writing–original draft.
Conflict of interest
The authors declare financial support was received for the research, authorship, and/or publication of this article. The research was partially supported through the Shaanxi provincial land engineering construction group weibei branch project. The financial support provided by this sponsor is greatly appreciated.
Author GQ was employed by Shaanxi Provincial Land Engineering Construction Group Weibei Branch. Author XM was employed by CCCC First Highway Consultants Co., Ltd. Author XL was employed by China Coal Science and Technology Ecological Environment Technology Co., Ltd. Author.
Publisher’s note
All claims expressed in this article are solely those of the authors and do not necessarily represent those of their affiliated organizations, or those of the publisher, the editors and the reviewers. Any product that may be evaluated in this article, or claim that may be made by its manufacturer, is not guaranteed or endorsed by the publisher.
References
Chen, X., Shi, X.-Z., Zhou, J., Li, E.-M., Qiu, P.-Y., and Gou, Y.-G. (2021). High strain rate compressive strength behavior of cemented paste backfill using split Hopkinson pressure bar. Int. J. Min. Sci. Technol. 31 (03), 387–399. doi:10.1016/j.ijmst.2021.03.008
Du, H., Song, D.-Q., Chen, Z., and Guo, Z.-Z. (2020). Experimental study of the influence of structural planes on the mechanical properties of sandstone specimens under cyclic dynamic disturbance. Energy Sci. Eng. 8, 4043–4063. doi:10.1002/ese3.794
Du, H., Song, D.-Q., Du, Y., Dong, L., and Li, J. (2023b). A randomized, single-blind, multi-center clinical observational study of a new super lubricath coating catheter latex catheters using in urethral catheterization. Nat. Hazards Risk 14, 1–18. doi:10.1080/02648725.2023.2170078
Du, H., Song, D.-Q., Liu, G.-W., Guo, W., Wang, X., and Bai, R. (2023a). Influence of the extra-thick coal seam exploitation on the deformation characteristics of the overlying rock mass in an open-pit mine slope. Geomatics, Nat. Hazards Risk 14 (1), 1–23. doi:10.1080/19475705.2022.2161952
Hao, X.-J., Du, W.-S., Zhao, Y.-X., Sun, Z.-W., Zhang, Q., Wang, S.-H., et al. (2020). Dynamic tensile behaviour and crack propagation of coal under coupled static-dynamic loading. Int. J. Min. Sci. Technol. 30 (05), 659–668. doi:10.1016/j.ijmst.2020.06.007
He, M.-M., Li, N., Zhang, Z.-Q., Yao, X.-C., Chen, Y.-S., and Zhu, C.-H. (2019a). An empirical method for determining the mechanical properties of jointed rock mass using drilling energy. Int. J. Min. Sci. Rock Mech. 116, 64–74. doi:10.1016/j.ijrmms.2019.03.010
He, M.-M., Zhang, Z.-Q., Ren, J., Huan, J.-Y., Li, G.-F., Chen, Y.-S., et al. (2019b). Deep convolutional neural network for fast determination of the rock strength parameters using drilling data. Int. J. Min. Sci. Rock Mech. 123 (C), 104084. doi:10.1016/j.ijrmms.2019.104084
He, M.-M., Zhang, Z.-Q., Zheng, J., Cheng, F.-F., and Li, N. (2020). A new perspective on the constant mi of the hoek-brown failure criterion and a new model for determining the residual strength of rock. Rock Mech. Rock Eng. 53 (9), 3953–3967. doi:10.1007/s00603-020-02164-6
He, M.-M., Zhang, Z.-Q., Zhu, J.-W., and Li, N. (2022). Correlation between the constant mi of Hoek-Brown criterion and porosity of intact rock. Rock Mech. Rock Eng. 55, 923–936. doi:10.1007/s00603-021-02718-2
Huang, H.-S., and Luo, Y. (2019). Determination of rock mechanics parameters for slope stability analysis of a copper mine. Xinjiang Nonferrous Metal. 42 (03), 62–63.
Huang, L. J., Liu, F., Zhang, E., Dontsov, , and Damjanac, B. (2019). Exploring the influence of rock inherent heterogeneity and grain size on hydraulic fracturing using discrete element modeling. Int. J. Solids Struct. 176, 207–220. doi:10.1016/j.ijsolstr.2019.06.018
Huang, L. J., Liu, F., Zhang, H., Fu, H., Zhu, , and Damjanac, B. (2020). 3D lattice modeling of hydraulic fracture initiation and near-wellbore propagation for different perforation models. J. Pet. Sci. Eng. 191, 107169. doi:10.1016/j.petrol.2020.107169
Huang, L. R., He, Z., Yang, P., Tan, W., Chen, X., Li, , et al. (2023). Exploring hydraulic fracture behavior in glutenite formation with strong heterogeneity and variable lithology based on DEM simulation. Eng. Fract. Mech. 278, 109020. doi:10.1016/j.engfracmech.2022.109020
Jiang, B., Ma, F.-L., Wang, Q., Liu, Y., Li, S.-C., He, M.-C., et al. (2021). Research of relationship between digital drilling parameters and rock uniaxial compressive strength based on cutting theory. J. Central South Univ. Technol. 52 (05), 1601–1609. doi:10.11817/j.issn.1672-7207.2021.05.021
Kalantari, S., Hashemolhosseini, H., and Baghbanan, A. (2018). Estimating rock strength parameters using drilling data. Int. J. Min. Sci. Rock Mech. 104, 45–52. doi:10.1016/j.ijrmms.2018.02.013
Li, J.-P. (2003). Study of the new method disposing gently inclined abandoned stope and ground pressure control at the stope. Beijing, China: Beijing Institute of Technology.
Liu, F.-H. (2015). Experimental study on rock mechanics parameters of Bijigou open-pit mine. China Metal. Bull. 11, 37–40.
Liu, Y., Lebedev, M., Zhang, Y., Wang, E., Li, W., Liang, J., et al. (2022). Micro-cleat and permeability evolution of anisotropic coal during directional CO2 flooding: an in situ micro-ct study. Nat. Resour. Res. 31, 2805–2818. doi:10.1007/s11053-022-10102-2
Liu, Y., Wang, E., Jiang, C., Zhang, D., Li, M., Yu, B., et al. (2023a). True triaxial experimental study of anisotropic mechanical behavior and permeability evolution of initially fractured coal. Nat. Resour. Res. 32, 567–585. doi:10.1007/s11053-022-10150-8
Liu, Y., Wang, E., and Li, M., (2023b). Biomedical named entity recognition based on fusion multi-features embedding. Gas Sci. Eng. 2023, 111–121. 204927. doi:10.3233/THC-236011
Munoz, H., Taher, A., and Chanda, E. (2017). Rock cutting performance assessment using strain energy characteristics of rocks. Min. Rock Mech. 126 (4), 191–199.
Munoz, H., Taheri, A., and Chanda, E. (2016). Rock cutting characteristics on soft-to-hard rocks under different cutter inclinations. Int. J. Min. Sci. Rock Mech. 87, 85–89. doi:10.1016/j.ijrmms.2016.05.014
Naeimipoura, A., Rostamib, J., Buyuksagisc, I.-S., and Frough, O. (2018). Estimation of rock strength using scratch test by a miniature disc cutter on rock cores or inside boreholes. Int. J. Min. Sci. Rock Mech. 107, 9–18. doi:10.1016/j.ijrmms.2018.03.020
Nakajima, I., and Kinoshita, S. (1979). Theoretical studies on cutting force of rock fracture mechanism in rock cutting. J. Jpn. Inst. Metals Mater. 95, 49–55. doi:10.2473/shigentosozai1953.95.1092_49
Palassi, M., and Emami, V. (2014). A new nail penetration test for estimation of rock strength. Int. J. Min. Sci. Rock Mech. 66, 124–127. doi:10.1016/j.ijrmms.2013.12.016
Peng, L. (2012). Research on 3D modeling and stability analysis of complex goaf. Ganzhou, China: Jiangxi University of Science and Technology.
Qiu, J.-D., Luo, L., Li, X.-B., Li, D.-Y., Chen, Y., and Luo, Y. (2020). Numerical investigation on the tensile fracturing behavior of rock-shotcrete interface based on discrete element method. Int. J. Min. Sci. Technol. 30 (03), 293–301. doi:10.1016/j.ijmst.2020.03.007
Sun, X.-K., Zhu, Z.-H., and Xu, Y.-F. (2011). Experimental study on physical and mechanical properties of rock for Sanchahe mining area. Min. Res. Dev. 31 (05), 40–42. doi:10.13827/j.cnki.kyyk.2011.05.002
Tan, Z.-Y., Yue, Z.-Q., and Cai, M.-F. (2007). Analysis of energy for rotary drilling in weathered granite formation. Chin. J. Rock Mech. Eng. 26 (3), 478–483.
Teymen, A., and Mengu, E.-C. (2020). Comparative evaluation of different statistical tools for the prediction of uniaxial compressive strength of rocks. Int. J. Min. Sci. Rock Mech. 30 (06), 785–797. doi:10.1016/j.ijmst.2020.06.008
Wang, C.-H., Gao, G.-Y., Wang, H., and Wang, P. (2020a). Using indoor and on-site hydraulic fracturing tests to jointly determine in-situ stress and rock tensile strength. J. Geomechanics 26 (02), 167–174.
Wang, Q., Gao, H.-K., Yu, H.-C., Jiang, B., and Liu, B.-H. (2019). Method for measuring rock mass characteristics and evaluating the grouting-reinforced effect based on digital drilling. Rock Mech. Rock Eng. 52 (3), 841–851. doi:10.1007/s00603-018-1624-9
Wang, Q., Qin, Q., Gao, S., Gao, H.-K., He, M.-C., Jiang, B., et al. (2018). Relationship between rock drilling parameters and rock uniaxial compressive strength based on energy analysis. J. China Coal Soc. 43 (05), 1289–1295. doi:10.13225/j.cnki.jccs.2017.1113
Wang, Y.-J., She, L., Zhao, Y.-F., and Cao, R.-L. (2020b). Experimental study on measurement of rock strength parameters based on digital drilling technology. Chin. J. Geotechnical Eng. 42 (9), 1660–1668. doi:10.11779/CJGE202009010
Xu, X.-L. (2017). Research on the experiment and meso-simulation of tensile characteristics and its fracture mechanism of brittle rock. Beijing, China: University of Science and Technology Beijing.
Yang, Z., Hou, K.-P., Li, K.-G., Zhang, C.-L., and Cheng, Y. (2010). Determination of mechanical parameters of rock mass from Yunxi Da tun Tin Mine. Rock Soil Mech. 31 (06), 1923–1928.
Yin, X.-G., Li, S.-L., Tang, H.-Y., and Wang, C.-L. (2003). The tests and studies of the physical mechanical properties of the rocks from changba lead-zinc mine. Min. Res. Dev. 05, 12–13+16.
Yue, Z.-Q. (2014). Drilling process monitoring for refining and upgranding rock mass quality classific ation methods. Chin. J. Rock Mech. Eng. 33 (10), 1977–1996.
Keywords: digital drilling technology, tensile strength, analytical model, cutting strength, strenght
Citation: Qiang G, Ma X and Liu X (2023) A new method for determining strength parameters of rock using digital drilling technology. Front. Earth Sci. 11:1256150. doi: 10.3389/feart.2023.1256150
Received: 10 July 2023; Accepted: 05 September 2023;
Published: 15 September 2023.
Edited by:
Yubing Liu, China University of Mining and Technology, ChinaReviewed by:
Danqing Song, South China University of Technology, ChinaChen Dongfang, Wuhan University of Technology, China
Copyright © 2023 Qiang, Ma and Liu. This is an open-access article distributed under the terms of the Creative Commons Attribution License (CC BY). The use, distribution or reproduction in other forums is permitted, provided the original author(s) and the copyright owner(s) are credited and that the original publication in this journal is cited, in accordance with accepted academic practice. No use, distribution or reproduction is permitted which does not comply with these terms.
*Correspondence: Xudong Ma, MTIwMzAzODQxQHFxLmNvbQ==