 Huan Liu
 Yangwen Jia
 Huidong Su1,2
- 1China Institute of Water Resources and Hydropower Research (IWHR), Beijing, China
- 2State Key Laboratory of Simulation and Regulation of Water Cycle in River Basin (SKL-WAC), Beijing, China
- 3School of Water Conservancy and Electric Power, Qinghai University, Xining, China
Through large-scale hydrological simulation, understanding the impact of different climatic and geomorphic conditions on hydrological variables is valuable for water and land management. However, the related study is still a challenge due to strong environmental diversity in large scale region. The physically-based, national-scale hydrological model in China was developed and validated, which considered the spatial heterogeneity of climatic and geomorphic conditions. Using the model, hydrological differences during the period 1956–2020 in 21 representative basins located in nine climatic zones and four geomorphic regions were quantified. Results showed that: 1) mean annual precipitation was strongly positively correlated with mean actual evapotranspiration, and both increased gradually from north to south. Interestingly, as annual precipitation increases, precipitation tended to be more evenly distributed. In recent decades, the northern river basins have been warming and drying, while the Heihe River basin and the cold northeast regions were under climatic warming and wetting; 2) the spatial distribution of streamflow was consistent with precipitation, but their trends were different. In cold regions affected by frozen soil, the streamflow tended to increase. On the contrary, the basins located in the Warm Temperate Zone with intense human activities and fragile ecosystem had a significant decrease in natural streamflow. As for the streamflow components, the frozen soil and karst structures contributed to the increase of the baseflow index (BFI); 3) The streamflow increase or reduction in 86% of the basins was dominated by climate change, as the contribution rate varied from 51.4% to 95.7%. Affected by the Grain to Green Programme, the streamflow of the Weihe River basin reduced significantly while the BFI increased. However, the reduction of forest, grassland and wetland areas dominated streamflow increase in the Huaihe, and Hulan River basins, and the rates were 65.3% and 66.1%, respectively.
1 Introduction
The natural hydrological cycle underpins the formation of available renewable freshwater resources and plays a crucial role in the evolution of terrestrial environments and ecosystems. Affected by climate change as well as intense human activities, global hydrological processes and the related variables have been undergoing profound changes (Ramanathan et al., 2001; IPCC, 2014). Meanwhile, several water problems characterized by streamflow reduction, urban flood disaster and aquatic biodiversity loss become increasingly prominent around the world (Dudgeon et al., 2006; Arnell and Gosling, 2014; Wheater and Gober, 2015). Obviously, better knowledge about the changes of hydrological variables and their response to environmental change is essential for improving water resources and land management. Just as said by Oki and Kanae (2006), “if the water cycle is managed wisely, RFWR (renewable freshwater resources) can cover human demand far into the future”.
Numerous studies have attempted to quantify the changing characteristics of key hydrological variables (i.e., precipitation, evaporation, streamflow) in recent years, and the attribution analysis of streamflow change has become a hot area. In general, two main approaches, model-based and statistics-based methods, are applied for attribution analysis of hydrological changes. The model-based method commonly relies on the distributed physically-based hydrological model, where the behavior of model parameters accords with the physical mechanism of hydrological cycle, and thus the hydrological heterogeneity is fully considered. Consequently, the method has greater advantages than the latter in quantifying hydrological response to climate change and human activities, especially for future scenarios. Consequently, the method is a powerful supplement to the traditional statistics-based method, which is mainly based on the Budyko hypothesis and climate elasticity (Budyko and Miller, 1974; Yang et al., 2008; Xu et al., 2014). Duethmann et al. (2015) assessed the individual contributions to streamflow changes in snow and glacier melt-dominated catchments using the WASA (Water Availability in Semi-Arid Environments) model and the multiple linear regression. As concluded by the authors, “Comparing the two approaches, an advantage of the simulation-based approach is the fact that it is based on process-based relationships implemented in the hydrological model instead of statistical links in the regression model”. Zhao et al. (2013) investigated the runoff increase in the Aksu catchment by applying the VIC (Variable Infiltration Capacity) model, and they attributed the runoff increase mostly to an increase in precipitation. Setti et al. (2020) applied the SWAT (Soil Water Assessment Tool) model to separate the impact of land use and rainfall variability to streamflow in a tropical river basin, India. The study pointed out that the model-based approach provides a better alternative way to understand the impact of the changes on the hydrology of the system. Due to the complexity of model structure and parameters, most of the available studies focus on one watershed or a small number of watersheds (van Roosmalen et al., 2007; Eregno et al., 2013; Xu et al., 2013). Moreover, many models only consider human activities such as land cover change, without considering the impact of human water consumption (Yuan et al., 2018). However, there is a lack of research on the quantitative differentiation of detection and attribution of hydrological changes in multiple basins that have different climatic and underlying surface conditions, especially across a vast country like China. According to Huo et al. (2021), the effects of climatic and geographical factors on the long-term water balance in different climatic zones need to be further quantified.
The increasing water-related problems urge the managers to pay more attention to develop comprehensive water management strategies at larger spatial scale, especially at the national- or continental-scale (McMillan et al., 2016). However, the expansion of the study area from the traditional catchment to vast region with multi-basins means more diversified hydrological changes among different basins. In large scale regions, the spatial heterogeneity of climatic characteristics indicates different hydrothermal conditions and vegetation cover. Thus, this spatial heterogeneity is the fundamental driving force of difference in the water balance of ecosystems and the associated streamflow (Jarihani et al., 2017). Furthermore, focusing on the basins located in the same climatic zone, there may be several differences in geomorphic structure that leads to diverse precipitation redistribution and streamflow responses. For example, the hydrological behaviors of karst landform are very special compared with those of non-karst areas (Hartmann et al., 2014). Additionally, human activities exhibit remarkable regional variability, which significantly affects land use and vegetation patterns as well as river flow regimes (Barnett et al., 2008; Döll et al., 2009; Bosmans et al., 2017). Hence, if we are committed to serving the large-scale water resources planning and management, a deep understanding and quantification of regional differences of hydrological changes is necessary and urgent.
China covers a large land area of about 9.6 million km2, owning many river basins and various geophysical and climatic zones. As the world’s second largest economy, the country has been facing severe water crisis (Jiang, 2015; Liu et al., 2018). Most river basins in north China, such as the Hai River (Ma et al., 2010), the Yellow River (Cong et al., 2009), and the Shiyang River (Ma et al., 2008), are obviously decreasing in annual runoff. In the southern water-rich regions, extreme hydrological events are expected to intensify (Wang et al., 2019). To meet the practical needs of nationwide water resources planning and management, we have developed the WEP-CN (Water and Energy transfer Processes in China) model by considering different climatic and hydrological conditions, geomorphic structures and their effects on infiltration and runoff (Liu et al., 2020a). Based on the model, the objective of this study was to clarify the differences of the variation characteristics of main hydrological variables from different climatic and geomorphic regions nationwide by trend detection as well as attribution analysis. Therefore, 21 representative basins in different climatic and geomorphic regions were selected as study areas. Furthermore, a comparative analysis was conducted on the evolution of key water cycle variables including precipitation, actual evapotranspiration, and streamflow in these basins from 1956 to 2020.
2 Data and methods
2.1 Study area
China (N:3°52´∼ N:53°34′, E:73°40´∼ E:135°05′) is situated in southeastern of Eurasian continent, with area of 9.6 million km2. The mean annual temperature (MAT) varies from −5.4°C to 27.8°C, and the mean annual precipitation (MAP) is 649.8 mm with an extremely uneven distribution. As the country spans nearly 50 latitudes from north to south, it owns various climatic conditions as well as vegetation patterns. China covers 10 Climatic Zones and the change of these climatic zones from north to south forms roughly three bands, as shown in Figure 1. Specifically, the band I is Frigid Temperate Zone (FTZ)—Median Temperate Zone (MTZ)—Warm Temperate Zone (WTZ)—North Asian Tropical Zone (NATZ)—Middle Asian tropical Zone (MATZ)—South Asian Tropical Zone (SATZ)—Marginal Tropical Zone (MTPZ); the band II is Median Temperate Zone (MTZ)—Alpine Sub-frigid Zone (ASZ)—Plateau Temperate Zone (PTZ)—Middle Asian tropical Zone (MATZ)—South Asian Tropical Zone (SATZ); the band III is Median Temperate Zone (MTZ)—Warm Temperate Zone (WTZ)—Alpine Frigid Zone (AFZ)—Alpine Sub-frigid Zone (ASZ)—Plateau Temperate Zone (PTZ).
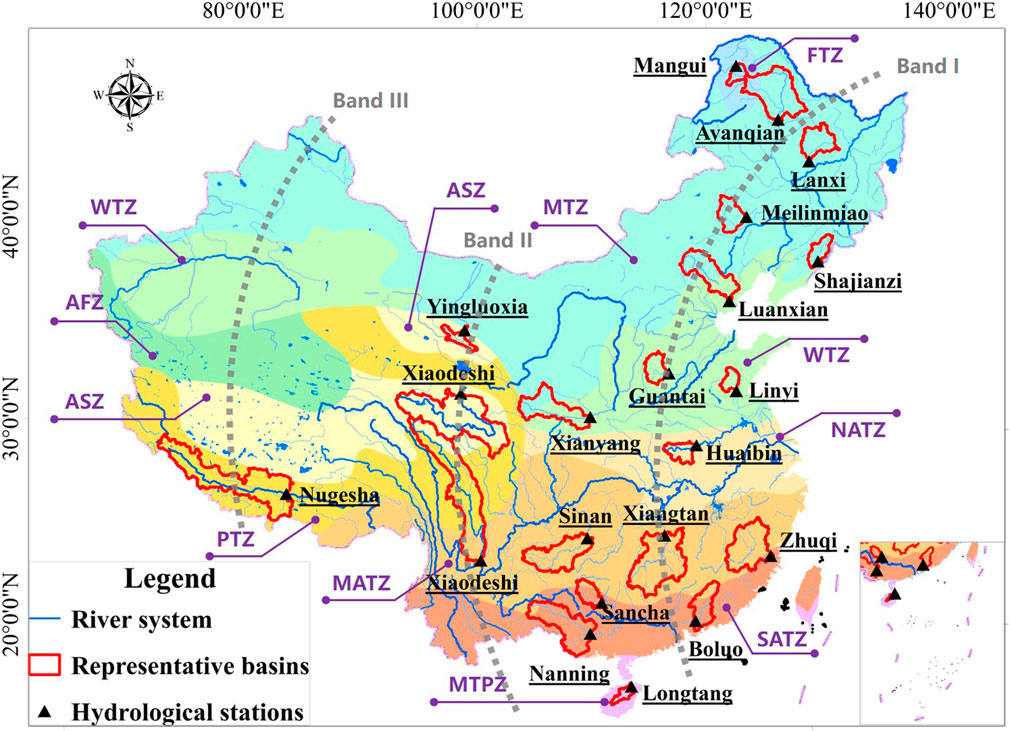
FIGURE 1. Distribution of 21 representative basins, and 10 Climatic Zones and their three change bands. Note: Frigid Temperate Zone (FTZ), Median Temperate Zone (MTZ), Warm Temperate Zone (WTZ), Alpine Frigid Zone (AFZ), Alpine Sub-frigid Zone (ASZ), Plateau Temperate Zone (PTZ), North Asian Tropical Zone (NATZ), Middle Asian tropical Zone (MATZ), South Asian Tropical Zone (SATZ), and Marginal Tropical Zone (MTPZ).
Moreover, it is a mountainous country, with 69% of its land comprising mountains, hills and highlands. Influenced by diverse climates and landforms, China’s geomorphic structure is complex. Roughly speaking, there are four typical geomorphic structures that are widely distributed in the country (Figure 2): 1) the mountainous area in northern China is characterized by the soil-bedrock structure, among which the Taihang Mountain Region (TMR) is a typical one. The TMR, known as the water tower of the North China Plain, is the ecological barrier of the Beijing-Tianjin-Hebei region (Du et al., 2019). At present, the traditional hydrological modeling is mostly applied to this geomorphic structure; 2) the karst mountain region of southwest China (KMRSC) is one of the largest continuous karst areas in the world, which owns thin surface soil, high soil infiltration capacity and complex topography (Liu et al., 2020b); 3) swelling soils, special soil type distributed widely all around the Loess Plateau. The deformable soil will swell, shrink, or collapse along with the movement of soil water (Su et al., 2020); 4) while in vast cold regions, the soil alternately freezes and melts as its temperature decreases and increases, which influences water evaporation and infiltration (Watanabe and Osada, 2017).
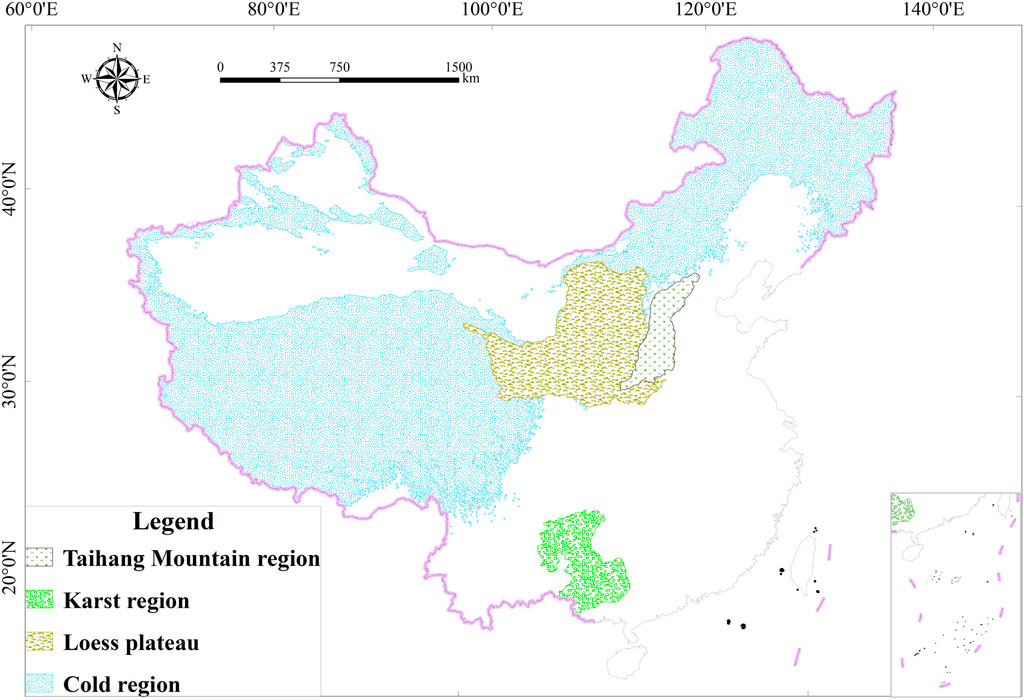
FIGURE 2. Distribution of the four typical geomorphic structures in China.
To clarify the spatial heterogeneity of hydrological change in different climatic and geomorphic regions, 21 representative basins and their outlet hydrological stations were selected across China. These basins involve nine climatic zones except AFZ, where is located on the Qinghai-Tibet Plateau and lacks river systems. Figure 1 illustrated the location of the representative basins and 10 climatic zones. Meanwhile, all four typical geomorphic structures were covered. The 21 basins mostly cover an area of 10,000 to 100,000 km2, and are well represented in terms of climatic and geomorphic characteristics. The basic information of these basins was summarized in Table 1.
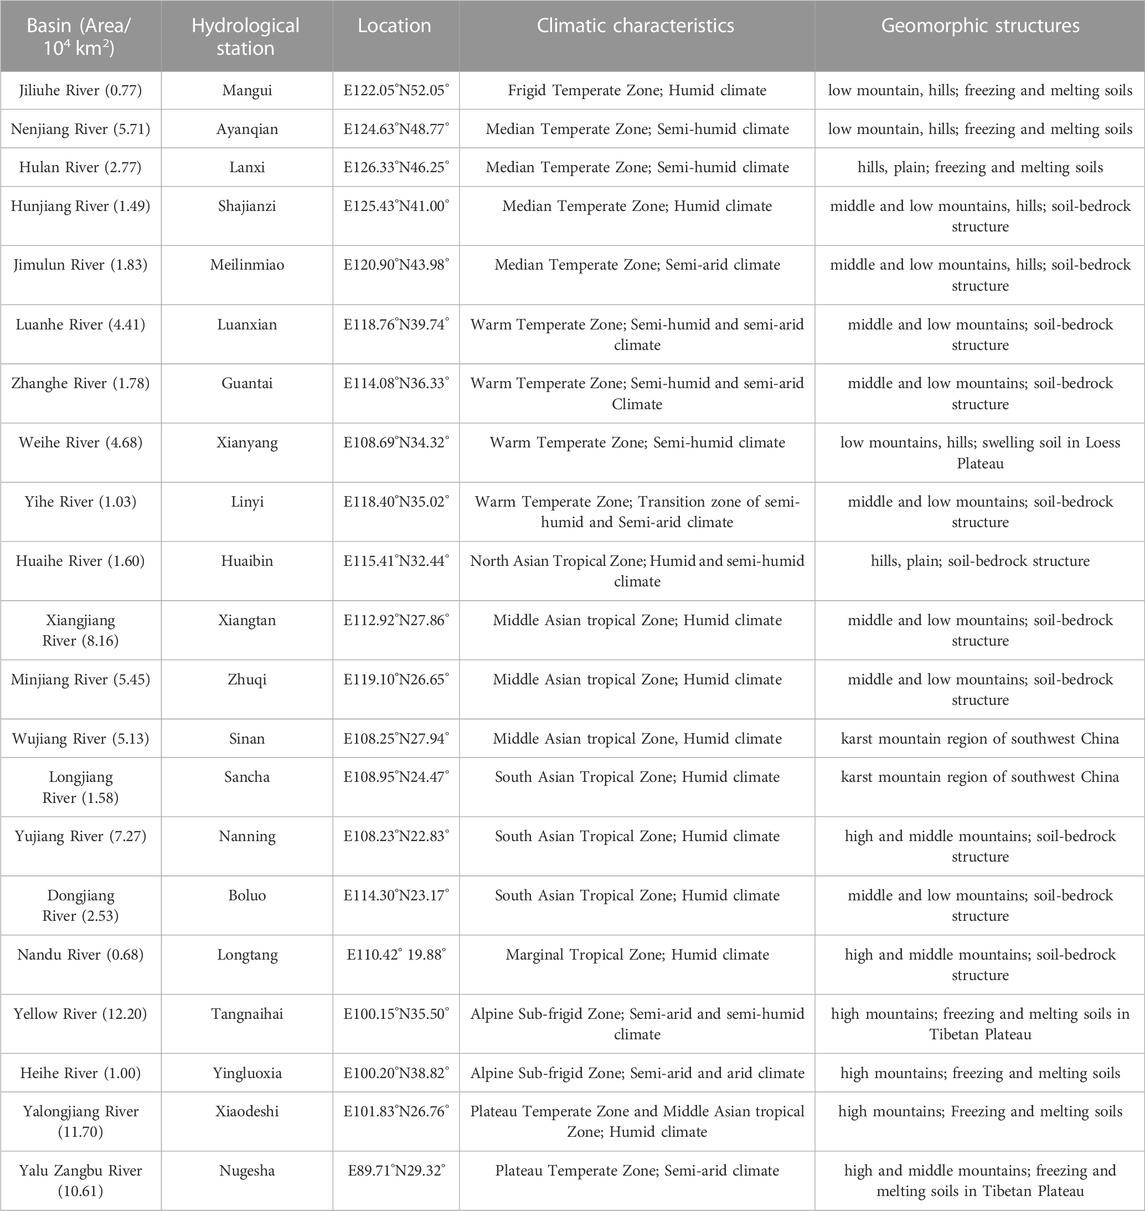
TABLE 1. Basic information of 21 representative basins across China.
2.2 Data preparation
This study focused on quantifying regional differences in the evolution characteristics of key hydrological variables in 21 representative basins through the model-based method. Meanwhile, the WEP-CN (Water and Energy transfer Processes in China) model has been developed and then validated in these basins through remote sensing and site observation data (Liu et al., 2020a). Through the verified model, more than 20 water fluxes and storages were determined. In this study, some of the key variables were analyzed, including precipitation, actual evapotranspiration, and streamflow. Precipitation data were obtained by spatial interpolation from meteorological stations across the country, while actual evapotranspiration and streamflow were simulated by the model. The results were performed at monthly and annual scales from 1956 to 2020. Additionally, the 1 km grid land use data of six periods (1980, 1990, 1995, 2000, 2005, 2010, 2015, and 2020) were processed to identify the impact of land use change on streamflow. These data were from Chinese Academy of Sciences (http://www.dsac.cn/DataProduct). Climatic Zones and landform distribution were available at the Geospatial Data Cloud website of Computer Network Information Center of the Chinese Academy of Sciences: http://www.gscloud.cn). Soil data including map of the 1 km grid soil types and the corresponding characteristic parameters were obtained from the National Second Soil Survey Data. Streamflow data were from National Second Water Resources Survey Data.
2.3 Methodology
2.3.1 Mann-Kendall trend analysis
Trend detection of hydrological variables was conducted at annual time scales by using the Mann-Kendall (M-K) test with the significance level set to 0.05 (Kendall, 1975). It is calculated as following formula:
where S is the M-K test statistic variables; n is the number of detected data series; xk and xj are the data values in time series k and j, respectively.
The test Z is used as a measure of trend significance. Positive values of Z denote increasing trends while negative Z values denote decreasing trends. For the given significance level of 0.05, if
2.3.2 Analysis of intra-annual concentration of hydrological variables
Concentration period (Cp) and Concentration degree (Cd), proposed by Zhang and Qian (2003), are two important indexes to measure the annual concentration of hydrological variables. The Cp represents the period (month) in which the total amount within a year concentrates and the Cd represents the degree to which the total amount is distributed in 12 months (Yeşilırmak and Atatanır, 2016). The basic idea for calculating Cp and Cd is that the monthly value of hydrological variables is a vectoral quantity having both magnitude and direction. The directions are the angles assigned to each month in 30° increments, all of which comprise a circle (360°) for a year (Table 2). The procedure to calculate Cp and Cd is as follows:
where i is the year; j is the month in a year; rij is the value of hydrological variable in the jth month of the ith year; θi is the angle assigned to the month j, °.
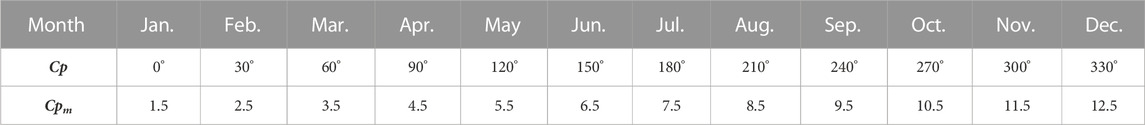
TABLE 2. Corresponding relation between month, Cp, and Cpm.
According to the above calculation results, the Cp is a value of 0–360. In order to represent the month more intuitively in which hydrological variables are concentrated, this study uses linear interpolation to convert Cp to the value of 1–13. The formula is as follows:
where the integer part of the Cpm represents the month, and the decimal part reflects the position in this month. The larger the decimal part is, the more concentrated the hydrological variables are at the end of the month. For example, the 1.5 in Table 2 represents that the hydrological variables concentrate in the middle of January.
For these 21 representative basins, the Cpm and Cd from 1956 to 2020 were calculated and then used to depict their spatial-temporal changes.
2.3.3 Model-based attribution analysis of streamflow change
Change in streamflow can be attributed to the impact of climate change and human activities, and the human activities mainly involves land use change and water intake. Because the WEP-CN model simulates the process of rainfall runoff generation without consideration of water use, the total change in river streamflow (∆Q) was tentatively assumed a response to climate change (∆Qcc) and land use change (∆Qlu):
Based on the verified model, the scenario analysis is performed to separate the contribution of climate and land use changes to streamflow variability. First, the time when abrupt changes of streamflow occurred is identified using the M–K test and t-test (Mu et al., 2020). Accordingly, the base period (before the abrupt change) and the effect period (after the abrupt change) of streamflow series are divided. Second, three scenarios are set as the input data of the verified model. Scenario 1: Climatic condition and land use in the base period; Scenario 2: Climatic conditions in the effect period and land use in the base period; Scenario 3: Climatic condition and land use in the effect period. Third, with the same model structure and parameters, the mean annual streamflow under the scenario 1, 2 and 3 are simulated respectively, namely RN1, RC2 and RN2. The contribution rates of climatic condition (ηcc) and land use change (ηlu) on streamflow are finally obtained using the follow equation:
where ∆Qcc = RC2 - RN1 and ∆Qlu = RN2–RC2.
3 Results
3.1 Validation of WEP-CN model in 21 representative basins
3.1.1 WEP-CN model
WEP-CN model is a distributed hydrological model that considers different physical mechanisms in order to study and simulate the hydrological cycle of the entire mainland China. Through the improved sub-watershed division, the improvement of the soil water movement module, and the optimization of the parameterization scheme, the model can depict the differences in streamflow generation mechanisms of large-scale watersheds, making large-scale watershed hydrological models more reliable and accurate.
To understand and simulate the soil water movement process under special geomorphic features including swelling loess, frozen soil and karst, a series of experiments were carried out. For swelling loess, soil saturated water content and saturated hydraulic conductivity decrease with the increase of soil depth and change as a power function. By introducing the equivalent porous medium approach, the vadose zone in karst region was divided into four layers: soil, upper epikarst, lower epikarst and transition layer. Then, soil moisture parameters for different layers were determined experimentally. In the frozen soil parameterization scheme, both soil saturated hydraulic conductivity and soil saturated water content were decreases exponentially with the decrease of soil temperature during, when the soil temperature is lower than a certain critical temperature. For detailed explanation, please see the literature Liu et al., 2020a.
3.1.2 Model calibration and validation
The simulated streamflows were used to compared with the naturalized streamflows by reverting statistical water consumption to the observed ones. The relative error (RE) of mean annual streamflow and the Nash-Sutcliffe efficiency (NSE) of monthly streamflow in each basin were calculated, as shown in Table 3; Figure 3. For the calibration period (1956–1980), the absolute values of RE were smaller than 10%, and the NSE were larger than 0.64. For the validation period (1981–2000), the absolute values of RE were all smaller than 12.5%, and the NSE were larger than 0.65. Especially, 97% of the basins own the absolute values of RE less than 10%, and 60% of them had the NSE value larger than 0.8. According to Moriasi et al. (2007), NSE > 0.50 can be considered satisfied simulation. Overall, it can be concluded that WEP-CN performs well and is applicable to the study basins.
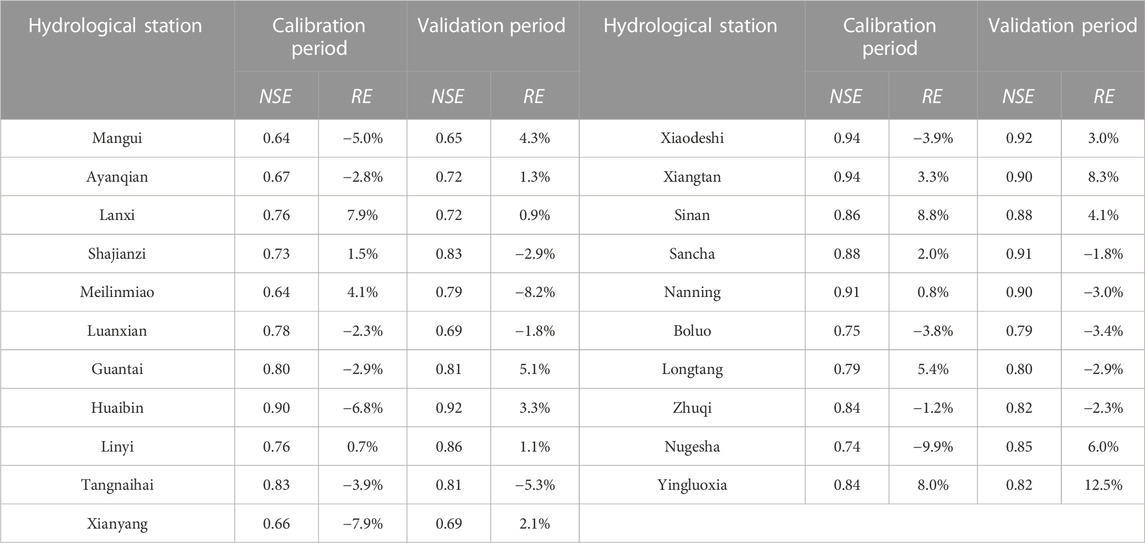
TABLE 3. Calibration and validation of the WEP-CN model in 21 representative basins.
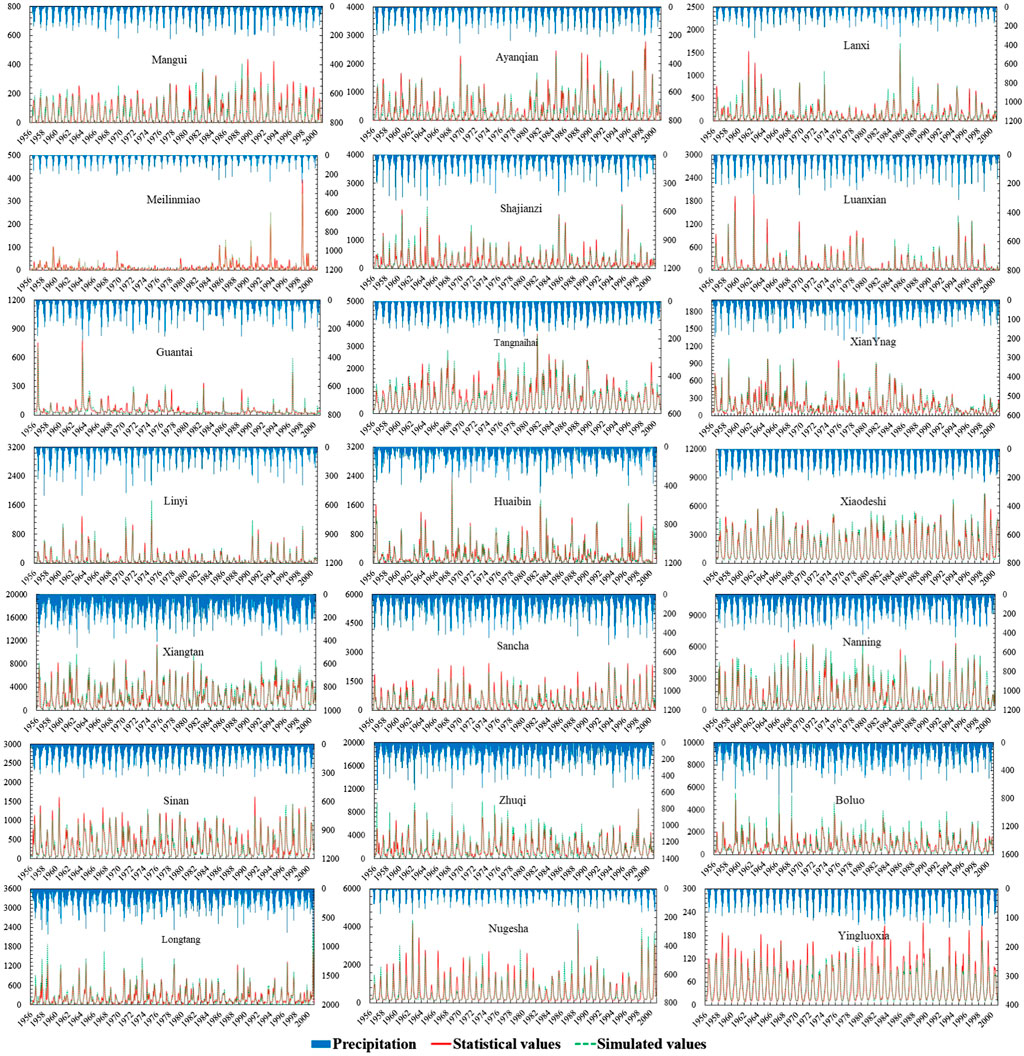
FIGURE 3. Monthly streamflow validation of simulations by WEP-CN and observations from 21 hydrological stations (The abscissa is a time series, month, the primary ordinate is the runoff value, m3/s, and the secondary ordinate is the precipitation value, mm).
3.2 Evolution characteristics of precipitation and actual evapotranspiration
3.2.1 Precipitation
Table 4; Figure 4 jointly illustrated the annual value of precipitation and its concentration degree within the year in 21 representative basins. The precipitation evolution varied greatly among different climatic and geomorphic regions throughout China. The MAP values increased gradually along the band I (FTZ–MTZ–WTZ–NATZ–MATZ–SATZ - MTPZ), varying between 538 and 2,339 mm. Meanwhile, there existed significant differences in annual precipitation between the two basins located in the same climatic zone. For example, in the four watersheds located in the MTZ, the maximum and minimum MAP values were 957mm and 408 mm respectively. Interestingly, the precipitation concentration degree (PCD) in 21 basins showed a distribution pattern opposite to that of precipitation. The value was generally larger than 0.7 in arid or semi-arid basins, but less than 0.5 in southern humid basins. The results showed that compared with humid areas in China, precipitation distribution in arid and semi-arid areas was more concentrated, which may make water resources utilization more difficult. Moreover, the PCD was strongly positively correlated with latitude with a 0.01 confidence level. Compared with the southern humid basins, the precipitation in the arid basins is less but more concentrated. Consequently, the effective utilization of water resources in the water-deficient basins in northern China faces greater challenges. In terms of the precipitation concentration period (PCP), the northern basins were about mid-July to early August that was generally 1 month later than that in the southern basins.
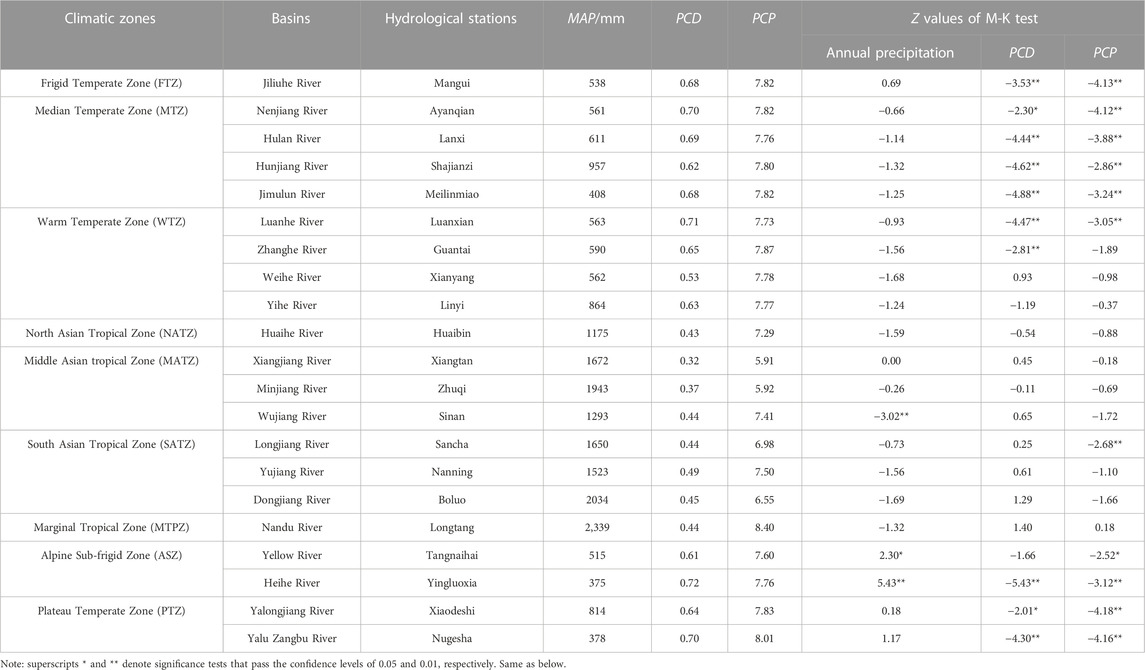
TABLE 4. Temporal and spatial variation of annual precipitation, PCD and PCP in the 21 representative basins.
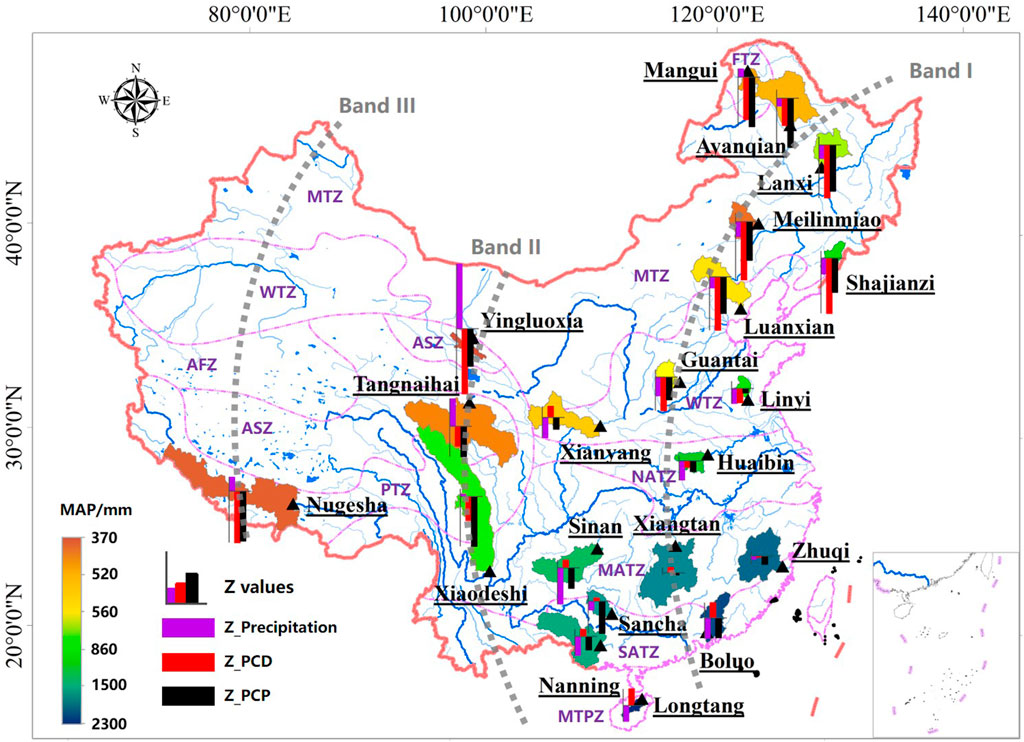
FIGURE 4. Trend distribution of annual precipitation, PCD and PCP from 1956 to 2020 in the 21 representative basins.
The annual precipitation in most basins exhibited a downward trend, whereas significant increases were detected in several basins that located in the Qinghai-Tibet Plateau and its surrounding areas. In particular, the precipitation in the source areas of the Yellow River and Heihe River increased most significantly, while its concentration degree decreased and concentration period advanced. This trend may be beneficial to the streamflow recharge and utilization of the downstream basins. Focusing on the change trend of the PCD, different climatic zones had a distinct regional pattern. Specifically, the PCD in the southern tropical basins tended to increase. Although the trend was not significant, it is still necessary to pay more attention to the possible increase of flood pressure in these basins. On the contrary, the PCD in most of the northern temperate and cold basins (i.e., the MTZ, ASZ, and PTZ) showed a significant decreasing trend, and the distribution of precipitation within a year tended to be uniform. Besides, almost all basins had an earlier precipitation concentration period than in the past, except the Nandu River Basin (above Longtang), and the trend was notable in northern temperate and cold basins.
3.2.2 Actual evapotranspiration
To reflect the dry-wet conditions of the basins, in addition to calculating the actual evapotranspiration (AET) of each representative basin, the proportion of annual actual evapotranspiration in precipitation (AET/P) was also analyzed. The results were shown in Table 5; Figure 5.
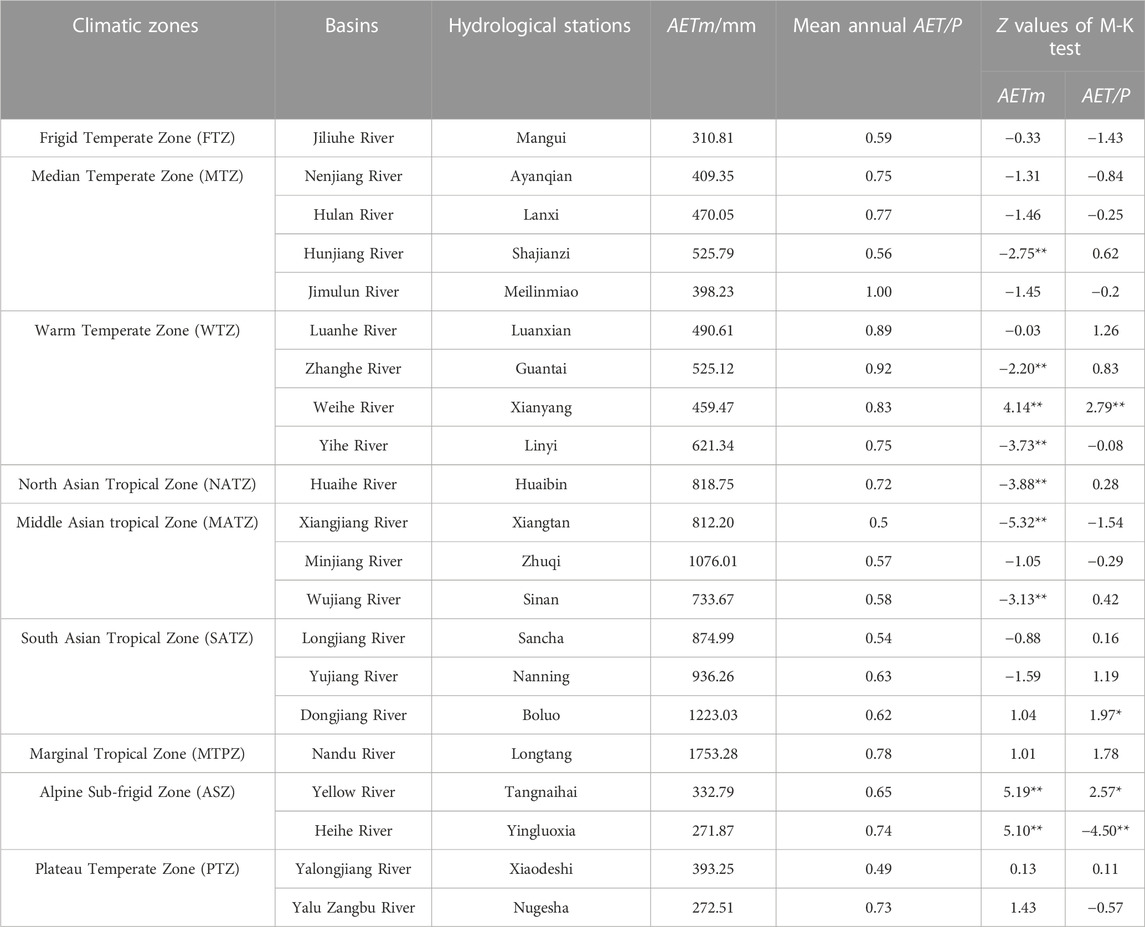
TABLE 5. Temporal and spatial variation of actual evapotranspiration and its proportion in precipitation in the 21 representative basins.
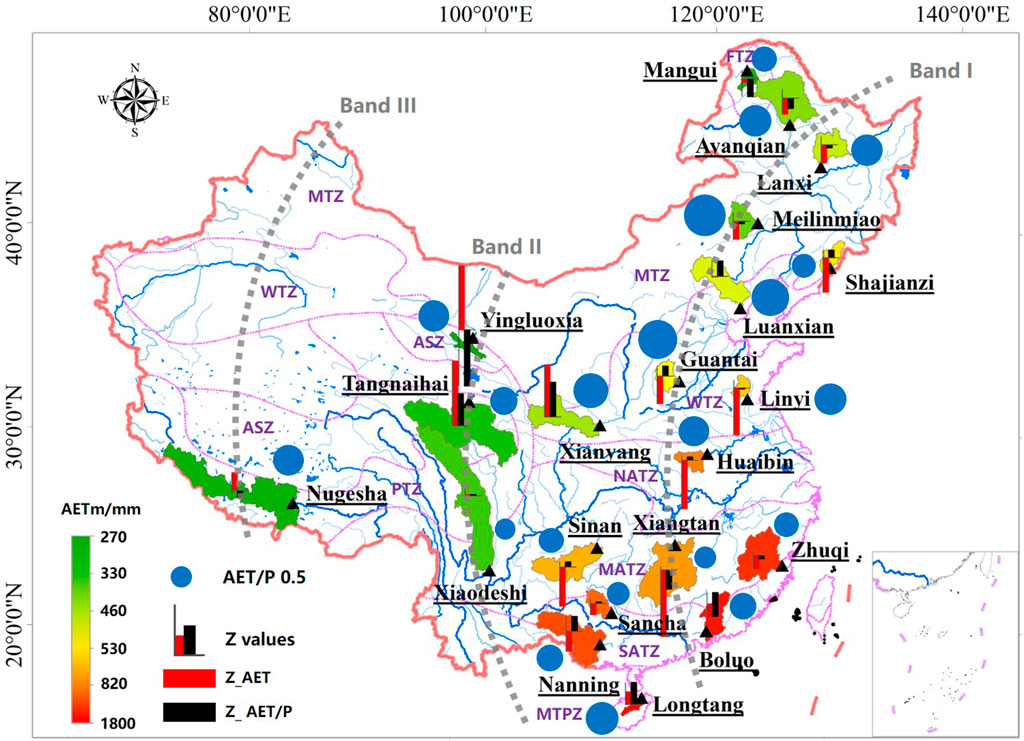
FIGURE 5. Trend distribution of annual actual evapotranspiration and its proportion in precipitation from 1956 to 2020 in the 21 representative basins.
Mean annual actual evapotranspiration (AETm) increased gradually from cold to tropical basins, ranging between 272 and 1753 mm. There existed a strong consistency between MAP and AETm across these basins, as the Pearson correlation coefficient of the two reached 0.95 that passed the confidence level of 0.01. The value of AET/P showed significant climatic zone differences, and increased first and then decreased along the band I (FTZ–MTZ–WTZ–NATZ–MATZ–SATZ–MTPZ). The high values were mainly distributed in MTZ and WTZ, where more than 80% of the precipitation was consumed by the evapotranspiration. Affected by the low air temperature in FTZ and ASZ, the evapotranspiration was limited. Although the precipitation was small, the AET/P had a low value. Furthermore, the AETm was large in the tropical zones (i.e., NATZ, MATZ, SATZ, MTPZ), but it only accounted for 0.5–0.7 of the local precipitation.
The AET of most basins was decreasing, covering FTZ, MTZ, WTZ, NATZ, MATZ, and SATZ. Among them, the trend was most significant in the Xiangjiang River basin (above Xiangtan), Huaihe River basin (above Huaibin), Wujiang River basin (above Sinan) and Yihe River basin (above Linyi). However, the Weihe River basin (above Xianyang) showed a significant increased trend opposite to that of surrounding basins. The main reason is that China has implemented large-scale afforestation programme on the Loess Plateau since 1999 (Wang et al., 2016). Other basins where the AET had an increased trend were mainly concentrated in the Qinghai-Tibet Plateau and its surrounding areas. Affected by the increasing precipitation and air temperature in ASZ, the source area of Heihe River Basin (above Yingluoxia) and the Yellow River (above Tangnaihai) exhibited a significant increased trend in the AET. For different basins in the same climatic zone, the trend of the AET/P was lower consistent than that of the AET. Obviously, the impact of the change of climatic condition and land use on the AET/P was more complex than that on the AET. It should be noted that the source area of the Yellow River Basin (above Tangnaihai) and the Weihe River basin (above Xianyang) located in the Loess Plateau were evolving towards dryness. The notable increase of the AET/P means that more precipitation translates into evapotranspiration rather than streamflow, which has led to the decrease of water storage in these basins. The reason for this phenomenon may be related to the local excessive afforestation, but the reasonable scale of forest and grass planting needs to be further studied. Some researchers have urged a cessation of the Grain for Green expansion on the Loess Plateau in China because it leads to an annual decline in the streamflow of the Yellow River (Chen et al., 2015; Feng et al., 2016). Although the AET increased in the source area of Heihe River Basin (above Yingluoxia), its proportion in precipitation decreased significantly. This showed that the basin has been under climatic warming and wetting conditions in recent decades. However, due to the intensification of limited glacial meltwater, whether this phenomenon is a long-term trend needs to be viewed more carefully. Moreover, the basins in WTZ were characterized by decreased precipitation and increased AET/P values, which further confirmed the phenomenon of warming and drying in the Huabei region of north China (Ma and Fu, 2003). The basins in the cold region of northeast China were experiencing a more humid climate, while the southern basins tend to be drier, although these trends were not significant.
3.3 Streamflow and its composition changes
In this study, the soil flow and underground flow were classified as river baseflow, and then the baseflow index (BFI) was calculated as the proportion of river baseflow in streamflow. Consequently, the temporal and spatial variation of streamflow and its components in 21 representative basins were analyzed (Table 6; Figure 6).
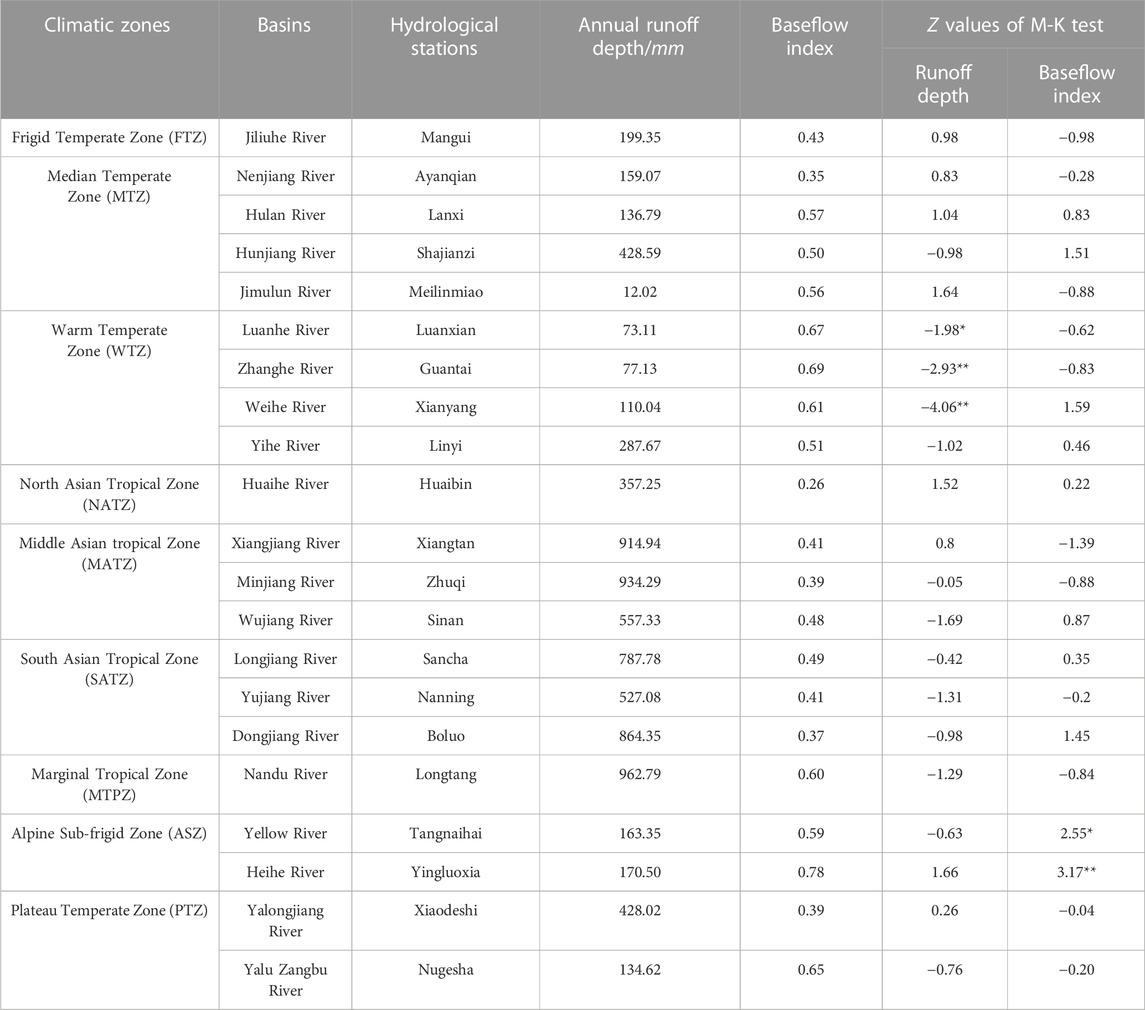
TABLE 6. Temporal and spatial variation of streamflow and its baseflow index in the 21 representative basins.
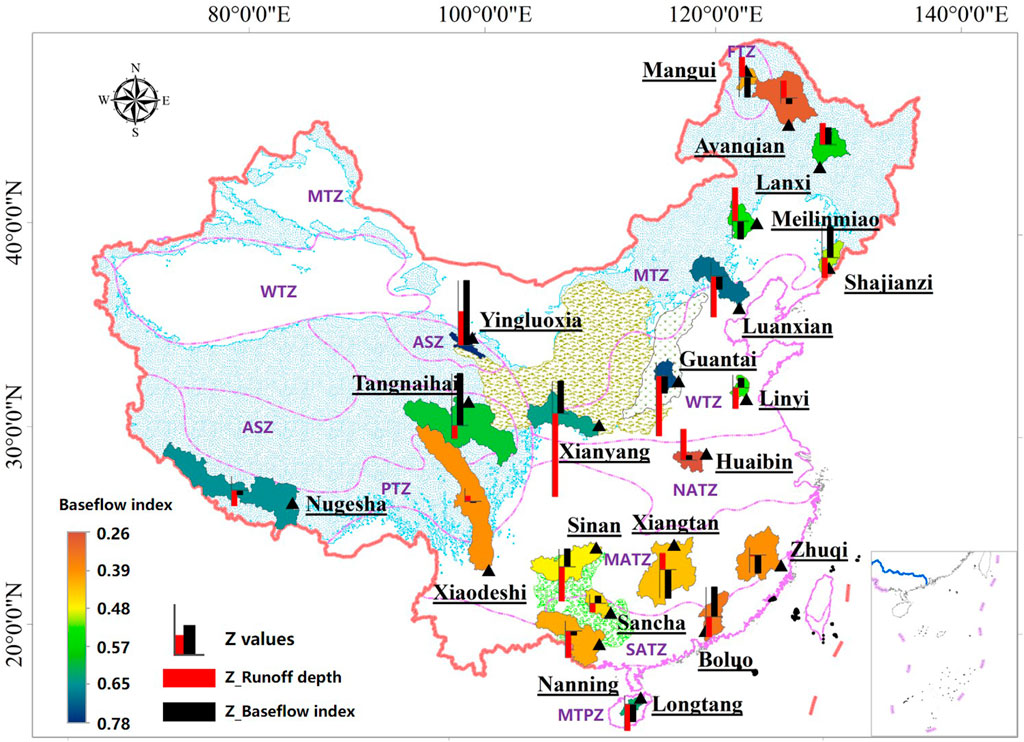
FIGURE 6. Trend distribution of streamflow and its BFI from 1956 to 2020 in the 21 representative basins.
As expected, the spatial distribution of annual runoff depth was highly consistent with that of precipitation, as their Pearson correlation coefficient reached 0.96. However, the trend characteristics of runoff depth were different from that of precipitation and actual evapotranspiration. Among the seven basins affected by the freezing and melting soils, annual runoff depth of five basins showed an increasing trend. The reason may be that increasing air temperature leads to the melting of ice and snow and frozen soil in cold regions, which increases the contribution to streamflow. In addition, the Weihe River Basin (above Xianyang), Luanhe River Basin (above Luanxian) and Zhanghe River Basin (above Guantai) were the basins with the most significant decrease in natural streamflow. These basins are concentrated in the Warm Temperate Zone with intense human activities and fragile ecosystem. Obviously, the reduction of streamflow will further aggravate local water scarcity.
Furthermore, the spatial differences of BFI among the 21 basins were analyzed. On the whole, the proportion of river baseflow in streamflow in the northern basins was higher than that in the southern basins. Except for Nenjiang River Basin (above Ayanqian), Jiliuhe River Basin (above Mangui) and Hunjiang River Basin (above Shajianzi), the BFI of other basins all exceed 0.5. Especially in the Heihe River Basin (above Yingluoxia), the value reached 0.78. The BFI in the southern basins was generally below 0.5, except for the Nandu River basin (above Longtang). The reason may be that the precipitation in the northern basins from October to March is less than that in the southern basins, and river streamflow mainly relies on groundwater. However, when the climatic conditions are similar, the difference of geomorphic structures becomes an important factor to change the streamflow components of the basin. In the Longjiang River Basin (above Sancha) and Wujiang River Basin (above Sinan), characterized by karst geomorphic structure, the BFI reached 0.49 and 0.48, respectively. However, for other basins located in the same climatic zone as the two basins, the value was only around 0.4. In the karst mountain region, the epikarst zone with large interconnected aquifers can significantly enhance the water storage capacity of groundwater aquifer, increasing groundwater-river interaction. According to the trend detection, the BFI of the source areas of the Yellow River and Heihe River increased most significantly. Due to a larger-scale melting of frozen soil, soil infiltration capacity and relative water storage capacity increased. Affected by the ecological restoration programme, the streamflow of Weihe River basin (above Xianyang) reduced significantly while the BFI increased. This has not been paid much attention to in previous studies, and its possible ecological impacts should be further explored.
3.4 Attribution of streamflow change
The base and effect periods of natural streamflow in each basin were determined, and then the contributions of climate and land use changes to streamflow were quantified (Table 7). By observing the ηcc and ηlu values, climate change played a role in reducing streamflow for most basins. Only 6 of the 21 representative basins experienced an increase in streamflow, which were mainly in the northern cold region. In comparison, the positive or negative contribution of land use change to streamflow was more complex in space. Affected by land use change, the streamflow generally decreased in the WTZ, but mainly increased in the ASZ and MTZ. However, it was not clear whether the contribution of land use change to streamflow is positively or negatively dominant in other climatic zones.
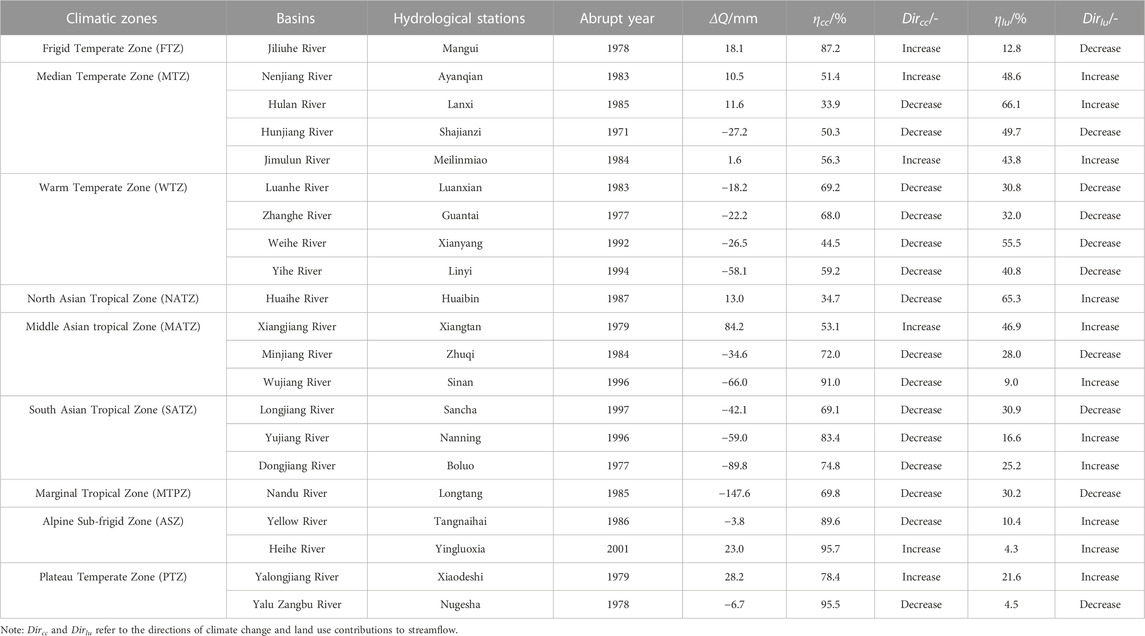
TABLE 7. Contribution rate and direction of climate and land use changes to streamflow in the representative basins.
The contribution rate of climate and land use changes to streamflow was significantly different among these basins. Meanwhile, the two possessed the opposite contribution characteristics to streamflow change in basins like Jiliuhe River basin (above Mangui). For most basins (86% of the total), climate change contributed more to streamflow increase or decrease, as the ηcc values varied from 51.4% to 95.7%. Briefly, there existed three high value areas of ηcc, namely the Jiliu River basin in the FTZ, the Dongjiang, Wujiang, and Yujiang River basins in the southwest, and the Qinghai-Tibet Plateau and its surrounding areas. These basins span north and south of China and involve many climatic zones, which further indicates that the impact of climate change on streamflow is significant and widespread in China.
In contrast, only in the Weihe, Huaihe, and Hulan River basins, the variation of land use dominated the change of natural streamflow. Although the number of basins was small, the impact of land use change on streamflow and its spatial differences were well reflected. The Hulan River basin (above Lanxi) in the Songnen Plain had a significant land use change, which contributed to 66.1% of streamflow increase. Intensive agricultural practices that peaked in the 1990s have led to large areas of forest, grassland and wetland being reclaimed for cropland and residential sites. The proportion of cropland reached 10.75% in 2015, an increase of 56.58% compared to 1980. Correspondingly, the area of forests has been greatly reduced, and its proportion decreased from 31.89% to 28.34%. As a result, the capacity of the basin to infiltrate and store precipitation in soil decreased significantly, and more streamflow was generated. Similar results were found in the Huaihe River basin (above Huaibin). However, the land use change in the Weihe River basin (above Xianyang) was opposite to that in other two basins. The Grain to Green Programme (GTGP) has converted 16,000 km2 of rain-fed cropland to planted vegetation, causing a 25% increase in vegetation cover during the last decade (Feng et al., 2016). As mentioned above, this programme has caused significant increase in evapotranspiration (AET) and its proportion in precipitation (AET/P). Consequently, land use change contributed 55.5% to the continuous reduction of streamflow.
4 Discussion
4.1 Reasonable analysis of results
It is a challenge to identify regional regionalized characteristics of hydrological evolution in different climatic and geomorphic basins, especially using a physically based, distributed hydrological model. Based on the WEP-CN model, many interesting results have been revealed, such as warming and drying in WTZ (i.e., Huabei region), warming and wetting in the Heihe River basin, and streamflow reduction affected by afforestation programme in the Loess Plateau. These results correspond well with the previous studies. The Haihe River basin, a typical large basin in WTZ, has been one of the most significant areas of warming and drying in China in recent decades (Cheng and Huang, 2016). Shi et al. (2007) found that in the Heihe River basin, the annual temperature increased significantly from 1960 to 2009, with an abrupt upward change occurring in about 1986. Precipitation in the high mountains also experienced a substantial increase during this period as well. Besides, though the SWAT model simulations, Zhang et al. (2016) forecast an increase in streamflows in the headwater region of the basin in the near future (2021–2050).
Moreover, some exploratory views are proposed. 21 basins in nine climatic zone have an inverse correlation between annual precipitation and its concentration degree, as the Pearson correlation coefficient reaches −0.862(p<0.01). The results quantitatively reveal the characteristics of China’s hydrology, that is, for the northern arid region, the precipitation is less but more concentrated, which brings greater challenges to water security. By comparing the results of multi-basin analysis, the study elaborates the impact of karst aquifers and frozen soil on streamflow. For example, karst and frozen soil structure cause a significantly higher BFI than other basins in the same climatic zone. Interestingly, the streamflow reduction but BFI increase in the Loess Plateau. The annual flattening of streamflow has some benefits to soil and water conservation and ecological improvement in the region. However, some researchers worry that the Grain for Green Expansion cause a further reduction in the amount of water available to humans (Feng et al., 2016).
Due to insufficient existing data, it is difficult to conduct further in-depth and rich research on the interesting phenomena discovered. Through comparative analysis of streamflow characteristics in different basins, it is found that the frozen soil and karst structures contributed to the increase of the BFI. However, the correlation between the characteristics of frozen soil or karst and the baseflow index has not yet been quantified. Therefore, we plan to select more basins for further research. First, determine a series of indicators that can scientifically and reasonably characterize permafrost or karst landforms, such as area ratio, etc. Then, through data analysis methods, the quantitative relationship between these indicators and the baseflow index is established.
4.2 Model uncertainty analysis
The uncertainties from the input data, structures and parameters of the model, owning nine climatic zones and four geomorphic regions, is a problem that cannot be ignored. In the selection of representative basins, the study has considered the influence of basin area on streamflow, and the area of 21 basins has little difference (generally between 10,000 and 100,000 km2). Zhang et al. (2019) established a quantitative relationship between runoff and basin area in the Haihe River basin, finding that as basin area increased, the average annual runoff depth of the basin decreased logarithmically. Huo et al. (2021) found that the average annual runoff coefficient was strongly correlated with basin area, showing a scale effect. However, this study lacks attention to regional differences of other watershed characteristic indicators, such as river length, slope, elevation, etc. Moreover, due to the limitation of data, the number of basins selected in the comparative study is still relatively small. This may lead to a risk of not fully reveal the impact of special geomorphic structures on hydrological variables. Meanwhile, it should be noted that as the number of selected basins increases, the uncertainty of model results will also increase.
Overall, the model-based method may underestimate the contribution of land use change (i.e., overestimate the contribution of climate change) to streamflow in large-scale region. Through a three-dimensional interpolation method considering elevation effects, the meteorological data of the stations have been well distributed to the sub-basins in WEP-CN model (Liu et al., 2020a). However, it is difficult to obtain refined land use data for large-scale hydrological simulation. Pielke (2005) mentioned that the effects of spatially heterogeneous land use might at least be as important in altering the weather as changes in climate patterns associated with greenhouse gases. As the land use data of 1km×1 km is utilized in this study, the lack of high-resolution data may hide a lot of information about land use change in different periods. This results in that the impact of climate change on streamflow in the model is more sensitive to land use change. Taking the Weihe River basin (above Xianyang) as an example, compared with the previous studies (Zuo et al., 2014; Deng et al., 2020), the conclusion that streamflow decreased significantly in the 1990s and land use change dominated streamflow reduction is consistent. However, the cumulative contribution rate of land use change to streamflow (55.5%) is lower than that in the above studies. Correspondingly, the contribution of climate change is relatively higher in this study. To relive this potential bias, the model requires to refine land use data in simulations by interpretating high-resolution remote sensing data sets. In addition, some scholars attributed conflicting results regarding the effects of land use and climate changes on streamflow to uncertainties in hydrological simulations (Yin et al., 2017).
Although the lack of fine land use data and model uncertainties may impact the results, this study can well reveal the combined effects of climatic and underlying surface conditions on hydrological processes and their spatial heterogeneity. Meanwhile, some meaningful conclusions have been obtained, which can be used as a guide for practical water and land management. Research has found that most basins in the northern climate zone of China had a trend of warming and drying, which showed increased stress on water resources in the north. Although the cold regions showed an increase in streamflow, to which the thawing processes made a non-negligible contribution, the cold regions may continue to encounter water shortages as future thawing water decreases. Moreover, there may be a problem of excessive afforestation in the Weihe River Basin, and the reasonable scale of forest and grass planting needs to be determined urgently.
5 Conclusion
Using the model-based method, regional differences in hydrological changes among 21 representative basins located in nine climatic zones and four geomorphic regions across China were revealed. The high efficiency and low error confirmed the performance of WEP-CN model at acceptable accuracy.
The heterogeneity analysis of hydrological variables focused on precipitation, actual evapotranspiration and streamflow in 21 basins. There existed a significant positive correlation between precipitation and actual evapotranspiration that increased gradually along climatic change band I (FTZ–MTZ–WTZ–NATZ–MATZ–SATZ–MTPZ). The PCD had a distribution pattern opposite to that of precipitation. The value of AET/P increased first and then decreased along the band I, and its trend indicated that the warming and drying of the basins in northern China is still continuing. On the contrary, the Heihe River basin and the cold northeast regions were under climatic warming and wetting. Briefly, climatic conditions highly affected the magnitude and annual distribution of streamflow, while differences in geomorphic structure mainly changed the composition of streamflow. The basins located in the Warm Temperate Zone with intense human activities and fragile ecosystem had a significant decrease in natural streamflow. The frozen soil and karst structures promoted groundwater–river interaction and increased the BFI in basins.
Furthermore, the contributions of climate and land use changes to streamflow in each basin were quantified comparatively. Climate change was the main driver behind increase or reduction of streamflow for most basins (86% of the total), as the contribution rate varied from 51.4% to 95.7%. Affected by land use change, the streamflow generally decreased in the Warm Temperate Zone, but mainly increased in the Alpine Sub-frigid Zone and Median Temperate Zone. The Grain to Green Programme contributed 55.5% of streamflow reduction in the Weihe River basin. On the contrary, land use change characterized by drastic reduction of forest, grassland and wetland dominated streamflow increase in the Huaihe, and Hulan River basins, and the contribution rates were 65.3% and 66.1%, respectively. This study provides a useful reference for regional differences in hydrological changes from the perspective of different climatic and geomorphic regions through the model-based method.
Data availability statement
The datasets presented in this study can be found in online repositories. The names of the repository/repositories and accession number(s) can be found in the article/supplementary material.
Author contributions
HL: Writing–original draft. YJ: Methodology, Writing–review and editing. HS: Data curation, Writing–review and editing. CN: Software, Writing–original draft. JW: Validation, Visualization, Writing–review and editing. YG: Data curation, Investigation, Writing–original draft. PH: Writing–review and editing. QY: Funding acquisition, Resources, Writing–review and editing.
Funding
The author(s) declare financial support was received for the research, authorship, and/or publication of this article. This research was supported by the National Natural Science Foundation of China (52242905, 42001040, and 51625904), National Key Research and Development Program of China (2021YFC3200203), and the Basic Scientific Research Expense Project of the China Institute of Water Resources and Hydropower Research (WR0145B022021,WR0145B072021).
Conflict of interest
The authors declare that the research was conducted in the absence of any commercial or financial relationships that could be construed as a potential conflict of interest.
Publisher’s note
All claims expressed in this article are solely those of the authors and do not necessarily represent those of their affiliated organizations, or those of the publisher, the editors and the reviewers. Any product that may be evaluated in this article, or claim that may be made by its manufacturer, is not guaranteed or endorsed by the publisher.
Abbreviations
AET, Actual evapotranspiration; AFZ, Alpine Frigid Zone; ASZ, Alpine Sub-frigid Zone; Cd, Concentration degree; Cp, Concentration period; FTZ, Frigid Temperate Zone; MAT, Mean annual temperature; MAP, Mean annual precipitation; MTZ, Median Temperate Zone; MATZ, Middle Asian tropical Zone; MTPZ, Marginal Tropical Zone; NATZ, North Asian Tropical Zone; NSE, Nash-Sutcliffe efficiency: PTZ, Plateau Temperate Zone; RE, Relative error: SATZ, South Asian Tropical Zone; WTZ, Warm Temperate Zone; WEP-CN, Water and Energy transfer Processes in China.
References
Arnell, N. W., and Gosling, S. N. (2014). The impacts of climate change on river flood risk at the global scale. Clim. Change 134, 387–401. doi:10.1007/s10584-014-1084-5
Barnett, T. P., Pierce, D. W., Hidalgo, H. G., Bonfils, C., Santer, B. D., Das, T., et al. (2008). Human-induced changes in the hydrology of the western United States. Science 319, 1080–1083. doi:10.1126/science.1152538
Bosmans, J. H., van Beek, L. P., Sutanudjaja, E. H., and Bierkens, M. F. P. (2017). Hydrological impacts of global land cover change and human water use. Hydrology Earth Syst. Sci. 21 (11), 5603–5626. doi:10.5194/hess-21-5603-2017
Chen, Y., Wang, K., Lin, Y., Shi, W., Song, Y., and He, X. (2015). Balancing green and grain trade. Nat. Geosci. 8 (10), 739–741. doi:10.1038/ngeo2544
Cheng, S., and Huang, J. (2016). Enhanced soil moisture drying in transitional regions under a warming climate. J. Geophys. Res. Atmos. 121, 2542–2555. doi:10.1002/2015jd024559
Cong, Z., Yang, D., Gao, B., Yang, H., and Hu, H. (2009). Hydrological trend analysis in the Yellow River basin using a distributed hydrological model. Water Resour. Res. 45 (7), W00A13. doi:10.1029/2008wr006852
Deng, W., Song, J., Sun, H., Cheng, D., Zhang, X., Liu, J., et al. (2020). Isolating of climate and land surface contribution to basin runoff variability: a case study from the Weihe River Basin, China. Ecol. Eng. 153, 105904. doi:10.1016/j.ecoleng.2020.105904
Döll, P., Fiedler, K., and Zhang, J. (2009). Global-scale analysis of river flow alterations due to water withdrawals and reservoirs. Hydrology Earth Syst. Sci. 13 (12), 2413–2432. doi:10.5194/hess-13-2413-2009
Du, J., Jia, Y., Hao, C., Qiu, Y., Niu, C., and Liu, H. (2019). Temporal and spatial changes of blue water and green water in the Taihang Mountain Region, China, in the past 60 years. Hydrological Sci. J. 64 (16), 2040–2056. doi:10.1080/02626667.2019.1599119
Dudgeon, D., Arthington, A. H., Gessner, M. O., Kawabata, Z., Knowler, D. J., Lévêque, C., et al. (2006). Freshwater biodiversity: importance, threats, status and conservation challenges. Biol. Rev. 81 (2), 163–182. doi:10.1017/s1464793105006950
Duethmann, D., Bolch, T., Farinotti, D., Kriegel, D., Vorogushyn, S., Merz, B., et al. (2015). Attribution of streamflow trends in snow and glacier melt-dominated catchments of the Tarim River, Central A sia. Water Resour. Res. 51 (6), 4727–4750. doi:10.1002/2014wr016716
Eregno, F. E., Xu, C. Y., and Kitterød, N. O. (2013). Modeling hydrological impacts of climate change in different climatic zones. Int. J. Clim. Change Strategies Manag. 5 (3), 344–365. doi:10.1108/ijccsm-04-2012-0024
Feng, X., Fu, B., Piao, S., Wang, S., Ciais, P., Zeng, Z., et al. (2016). Revegetation in China’s Loess Plateau is approaching sustainable water resource limits. Nat. Clim. Change 6 (11), 1019–1022. doi:10.1038/nclimate3092
Hartmann, A., Goldscheider, N., Wagener, T., Lange, J., and Weiler, M. (2014). Karst water resources in a changing world: review of hydrological modeling approaches. Rev. Geophys. 52 (3), 218–242. doi:10.1002/2013rg000443
Huo, J., Liu, C., Yu, X., Jia, G., and Chen, L. (2021). Effects of watershed char and climate variables on annual runoff in different climatic zones in China. Sci. Total Environ. 754, 142157. doi:10.1016/j.scitotenv.2020.142157
IPCC (2014). Climate change 2014: impacts, adaptation, and vulnerability. Part A: global and sectoral aspects:working group II contribution to the IPCC fifth assessment report. Cambridge, UK and New York: Cambridge University Press, 1–32.
Jarihani, B., Sidle, R. C., Bartley, R., Roth, C., and Wilkinson, S. (2017). Characterisation of hydrological response to rainfall at multi spatio-temporal scales in savannas of semiarid Australia. Water 9 (7), 540. doi:10.3390/w9070540
Jiang, Y. (2015). China's water security: current status, emerging challenges and future prospects. Environ. Sci. Policy 54, 106–125. doi:10.1016/j.envsci.2015.06.006
Liu, H., Jia, Y., Niu, C., Gan, Y., and Xu, F. (2018). Evaluation of regional water security in China based on dualistic water cycle theory. Water Policy 20 (3), 510–529. doi:10.2166/wp.2017.062
Liu, H., Jia, Y., Niu, C., Hu, P., Du, J., Su, H., et al. (2020b). Evolution of main water cycle fluxes in the karst Mountain Region of southwest China. Water 12 (8), 2262. doi:10.3390/w12082262
Liu, H., Jia, Y., Niu, C., Su, H., Wang, J., Du, J., et al. (2020a). Development and validation of a physically-based, national-scale hydrological model in China. J. Hydrology 590, 125431. doi:10.1016/j.jhydrol.2020.125431
Ma, H., Yang, D., Tan, S. K., Gao, B., and Hu, Q. (2010). Impact of climate variability and human activity on streamflow decrease in the Miyun Reservoir catchment. J. Hydrology 389 (3-4), 317–324. doi:10.1016/j.jhydrol.2010.06.010
Ma, Z., and Fu, C. (2003). Interannual characteristics of the surface hydrological variables over the arid and semi-arid areas of northern China. Glob. Planet. Change 37 (3-4), 189–200. doi:10.1016/s0921-8181(02)00203-5
Ma, Z., Kang, S., Zhang, L., Tong, L., and Su, X. (2008). Analysis of impacts of climate variability and human activity on streamflow for a river basin in arid region of northwest China. J. hydrology 352 (3-4), 239–249. doi:10.1016/j.jhydrol.2007.12.022
McMillan, H. K., Booker, D. J., and Cattoën, C. (2016). Validation of a national hydrological model. J. Hydrology 541, 800–815. doi:10.1016/j.jhydrol.2016.07.043
Moriasi, D. N., Arnold, J. G., Van Liew, M. W., Bingner, R. L., Harmel, R. D., and Veith, T. L. (2007). Model evaluation guidelines for systematic quantification of accuracy in watershed simulations. Trans. ASABE 50, 885–900. doi:10.13031/2013.23153
Mu, X., Wang, H., Zhao, Y., Liu, H., He, G., and Li, J. (2020). Streamflow into Beijing and its response to climate change and human activities over the period 1956–2016. Water 12 (3), 622. doi:10.3390/w12030622
Oki, T., and Kanae, S. (2006). Global hydrological cycles and world water resources. science 313 (5790), 1068–1072. doi:10.1126/science.1128845
Pielke, R. A. (2005). Land use and climate change. Science 310, 1625–1626. doi:10.1126/science.1120529
Ramanathan, V. C. P. J., Crutzen, P. J., Kiehl, J. T., and Rosenfeld, D. (2001). Aerosols, climate, and the hydrological cycle. science 294 (5549), 2119–2124. doi:10.1126/science.1064034
Setti, S., Maheswaran, R., Radha, D., Sridhar, V., Barik, K. K., and Narasimham, M. L. (2020). Attribution of hydrologic changes in a tropical river basin to rainfall variability and land-use change: case study from India. J. Hydrologic Eng. 25 (8), 05020015. doi:10.1061/(asce)he.1943-5584.0001937
Shi, Y., Shen, Y., Kang, E., Li, D., Ding, Y., Zhang, G., et al. (2007). Recent and future climate change in northwest China. Clim. Change 80, 379–393. doi:10.1007/s10584-006-9121-7
Su, H., Jia, Y., Gan, Y., Ni, G., Niu, C., Liu, H., et al. (2020). Soil water movement model for deformable soils. J. Water Clim. Change 11 (4), 1191–1202. doi:10.2166/wcc.2019.262
van Roosmalen, L., Christensen, B. S., and Sonnenborg, T. O. (2007). Regional differences in climate change impacts on groundwater and stream discharge in Denmark. Vadose Zone J. 6 (3), 554–571. doi:10.2136/vzj2006.0093
Wang, H., Hu, C., Wang, J., et al. (2019). Water security strategy in China and related policy studies. Beijing: China Science Publishing and Media Ltd.
Wang, S., Fu, B., Piao, S., Lü, Y., Ciais, P., Feng, X., et al. (2016). Reduced sediment transport in the Yellow River due to anthropogenic changes. Nat. Geosci. 9 (1), 38–41. doi:10.1038/ngeo2602
Watanabe, K., and Osada, Y. (2017). Simultaneous measurement of unfrozen water content and hydraulic conductivity of partially frozen soil near 0 C. Cold Regions Sci. Technol. 142, 79–84. doi:10.1016/j.coldregions.2017.08.002
Wheater, H. S., and Gober, P. (2015). Water security and the science agenda. Water Resour. Res. 51 (7), 5406–5424. doi:10.1002/2015wr016892
Xu, X., Yang, H., Yang, D., et al. (2013). Assessing the impacts of climate variability and human activities on annual runoff in the Luan River basin, China. Hydrology Res. 44 (5), 940–952. doi:10.2166/nh.2013.144
Xu, X., Yang, D., Yang, H., and Lei, H. (2014). Attribution analysis based on the Budyko hypothesis for detecting the dominant cause of runoff decline in Haihe basin. J. Hydrol. 510, 530–540. doi:10.1016/j.jhydrol.2013.12.052
Yang, H., Yang, D., Lei, Z., and Sun, F. (2008). New analytical derivation of the mean annual water-energy balance equation. Water Resour. Res. 44 (3). doi:10.1029/2007WR006135
Yeşilırmak, E., and Atatanır, L. (2016). Spatiotemporal variability of precipitation concentration in western Turkey. Nat. Hazards 81 (1), 687–704. doi:10.1007/s11069-015-2102-2
Yin, J., He, F., Xiong, Y. J., and Qiu, G. Y. (2017). Effects of land use/land cover and climate changes on surface runoff in a semi-humid and semi-arid transition zone in northwest China. Hydrology Earth Syst. Sci. 21 (1), 183–196. doi:10.5194/hess-21-183-2017
Yuan, X., Jiao, Y., Yang, D., and Lei, H. (2018). Reconciling the attribution of changes in streamflow extremes from a hydroclimate perspective. Water Resour. Res. 54 (6), 3886–3895. doi:10.1029/2018wr022714
Zhang, A., Liu, W., Yin, Z., Fu, G., and Zheng, C. (2016). How will climate change affect the water availability in the Heihe River Basin, Northwest China? J. Hydrometeorol. 17 (5), 1517–1542. doi:10.1175/jhm-d-15-0058.1
Zhang, L., and Qian, Y. (2003). Annual distribution features of precipitation in China and their interannual variations. Acta Meteorol. Sin. 17 (2), 146–163.
Zhang, X., Dong, Q., Cheng, L., and Xia, J. (2019). A Budyko-based framework for quantifying the impacts of aridity index and other factors on annual runoff. J. Hydrolgy 579, 124224. doi:10.1016/j.jhydrol.2019.124224
Zhao, Q., Ye, B., Ding, Y., Zhang, S., Yi, S., Wang, J., et al. (2013). Coupling a glacier melt model to the Variable Infiltration Capacity (VIC) model for hydrological modeling in north-western China. Environ. earth Sci. 68 (1), 87–101. doi:10.1007/s12665-012-1718-8
Keywords: WEP-CN model, regional differences, hydrological change, climatic condition, geomorphic structure
Citation: Liu H, Jia Y, Su H, Niu C, Wang J, Gan Y, Hu P and Yang Q (2023) Detection and attribution of hydrological changes in different climatic and geomorphic regions of China. Front. Earth Sci. 11:1260962. doi: 10.3389/feart.2023.1260962
Received: 19 July 2023; Accepted: 21 November 2023;
Published: 28 December 2023.
Edited by:
Chris Bradley, University of Birmingham, United KingdomReviewed by:
Xing Yuan, Nanjing University of Information Science and Technology, ChinaZengliang Luo, China University of Geosciences Wuhan, China
Yanfeng Wu, Chinese Academy of Sciences (CAS), China
Copyright © 2023 Liu, Jia, Su, Niu, Wang, Gan, Hu and Yang. This is an open-access article distributed under the terms of the Creative Commons Attribution License (CC BY). The use, distribution or reproduction in other forums is permitted, provided the original author(s) and the copyright owner(s) are credited and that the original publication in this journal is cited, in accordance with accepted academic practice. No use, distribution or reproduction is permitted which does not comply with these terms.
*Correspondence: Yangwen Jia, amlheXdAaXdoci5jb20=