- 1Center for Hydrogeology and Environmental Geology Survey, China Geology Survey, Tianjin, China
- 2Tianjin Engineering Center of Geothermal Resources Exploration and Development, Tianjin, China
- 3CNOOC Research Institute Ltd., Beijing, China
With the rapid economic development in North China, the demand for geothermal energy is increasing. It is urgent to find favorable deep geothermal resource targets in North China. Although geothermal resources in the North China Plain are widely distributed, in order to develop deep geothermal resources in North China safely, stably and efficiently, it is essential to carry out the target selection and evaluation of geothermal resource zoning. This article takes the typical geothermal fields in the central Hebei region as the research object, and through the comprehensive collation of regional geothermal geological data, constructs an optimization evaluation indicator system for geothermal resource target areas from three aspects: resource conditions, mining potential, and heating demand. On this basis, it establishes a linear relationship between the attribute values and scores of each indicator, and uses the analytic hierarchy process to assign weights to each indicator and calculate the comprehensive weight. Then, the comprehensive evaluation value is obtained by weighted calculation of the scores and comprehensive weights of each block in the grid segmentation of the evaluation area. Finally, through the spatial analysis function of GIS, the comprehensive evaluation values of all blocks in the evaluation area were analyzed using kriging difference analysis, and a comprehensive evaluation map, the geothermal resource prospective target area map, was finally obtained. Using quantitative zoning evaluation methods, the target areas for exploration and development of deep geothermal resources in central Hebei Province have been delineated within a large region. The evaluation results indicate that the Cambrian-Ordovician reservoir target area is relatively large, and there are many favorable target areas with good reservoir conditions in the Middle-Upper Proterozoic. The excellent prospective target area of the Mesoproterozoic geothermal reservoir accounts for 56%, mainly located in the Xingji uplift and Gaoyang low uplift. Xiong’an New Area, Cangzhou, and the eastern part of Hengshui are excellent prospective target areas for the evaluation of the Mesoproterozoic geothermal reservoir in a single area. This evaluation method can provide a reference for the optimization of resource exploration and development target areas in key regions.
1 Introduction
As a kind of renewable green energy, the geothermal energy is abundant, stable and safe. China’s geothermal property has made rapid development, with the“Double carbon” target, geothermal energy in the adjustment of the role of a significant increase in the energy structure. By the end of 2020, China’s geothermal utilization is equivalent to about 40 million tons of standard coal, which is only 4.5% of non-fossil energy, and available space is very large.The deep geothermal heating area is up to 580 million square meters (Wang D. et al., 2022).The geothermal resources in the North China plain are widely distributed. With the rapid development of the capital economic circle, the demand for geothermal energy is increasing, and the North China Plain has become one of the most important mid-deep hydrothermal geothermal development zones in China (Mao et al., 2020). Geothermal reservoirs of the clastic rock pore type and carbonate rock karst cavern-fracture type are the main types in this area. Three geothermal reservoir types are mainly developed, including the Jixian Wumishan formation and Gaoyuzhuang formation carbonate karst geothermal reservoir, the Cambrian-Ordovician carbonate karst geothermal reservoir and the Neogene sandstone geothermal reservoir (Mao et al., 2020; Wang T. H. et al., 2022). The first two types of geothermal reservoir development zones are mainly concentrated in Jizhong depression, Cangxian uplift and the north-west area of Huanghua depression and Linqing depression. The Neogene sandstone geothermal reservoir development zones are mainly concentrated in Jizhong Depression, Huanghua Depression, Jiyang Depression, and Linqing Depression.
In recent years, with the increasing exploration and development of geothermal resources, the predecessors have done a lot of work on the zoning evaluation of medium-deep geothermal resources. In 1995, Dunshi Yan, Yingtai Yu and others did a lot of work on the geothermal distribution, type division, resource quantity calculation, development and utilization evaluation of the Beijing Tianjin Hebei oil and gas region (Yan and Yu, 2000). The current situation and potential of development and utilization were analyzed (Wang et al., 2017a). Lin et al. (2013) and Wang G. L. et al. (2020) used different evaluation methods to evaluate the potential of shallow geothermal energy, hydrothermal geothermal resources and dry hot rock resources for different types of geothermal resources in China, and Wang G. L. et al. (2020) analyzed the current situation and the economic and environmental benefits of the geothermal resources development and utilization. Pang et al. (2020) proposed an index system for evaluating the mining conditions of deep geothermal energy, assigned values to each single index by expert scoring, and then quantitatively calculated and evaluated the developing difficulty of deep geothermal energy resources by using fuzzy mathematics. Wang (2019) selected the geothermal exploration target areabased on the distribution characteristics of geothermal fields and geothermal resources in Shandong Province and combined with market conditions. Zhang et al. (2016a), Zhang et al. (2016b) selected multiple evidence factors such as earthquake epicenter, fault, Bouguer gravity anomaly, magnetic anomaly, intrusive rock and terrestrial heat flow, to build a fuzzy logic model in a typical geothermal site in Anatolia, Türkiye, and then apply it to the geothermal potential evaluation of Fujian Province. Liu Z. M. et al. (2022) constructed a evaluation system of 61 geological condition indicators, including basic geological conditions, geological environment elements, and geological resource elements, to evaluate the urban geological conditions of Beijing. Based on the development characteristics and utilization direction of geothermal resources in bedrock in Shandong Province, Gao (2009) has established a selection evaluation method based on resource and market conditions. Li et al. (2018) established a site selection evaluation index system based on the Analytic Hierarchy Process, which includes four aspects: resources, technology, safety, and economy. Feng and Cao (2007) predicted favorable areas for geothermal resource development and utilization by studying the distribution of geothermal anomalies, physical properties of thermal reservoirs, and water yield. According to the project selection, project establishment, construction and operation stages, Liu G. Y. et al. (2022) proposed a set of evaluation system for hydrothermal geothermal resources in the middle and deep layers of sedimentary basin. In 2018, Quinao and Zarrouk, (2018) used the workflow of experimental design and response surface methodology (ED and RSM) to study the Ngatamariki geothermal field in New Zealand as an example. This method not only solves the problem of multiple factors for sufficient testing of the model, but also uses response surfaces for thousands of probabilistic geothermal resource assessments. Ciriaco et al. (2020) improved the workflow of experimental design (ED) and response surface methodology (RSM) by using two-level and three-level full factors and Box Behnken design, and established a proxy numerical model for evaluating geothermal resources. In 2022, Ciriaco et al. (2022) also used experimental design and response surface methodology to select 6 uncertain parameters, implemented Plasckett Burman design, and established twelve versions of Wright reservoir models for uncertainty quantification and geothermal resource evaluation.
The evaluation methods in these studies include resource calculation, numerical simulation and comprehensive evaluation based on physical indicators. Although there are many methods and significant progress, they still remain based on the evaluation unit of tectonic units, and there has been no quantitative evaluation research on geothermal resources in the central region of Hebei in previous studies. On the basis of previous research methods, this article uses GIS to comprehensively evaluate the fusion of geothermal geological multi-source information data, and uses the Kriging method to analyze the grid division difference in the evaluation area, breaking through the previous situation of using structural units as evaluation units; At the same time, by using analytic hierarchy process (AHP), the index of deep geothermal resources exploration and development zoning is quantified, and the exploration and development target areas of deep geothermal resources in central Hebei Province have been delineated on a large regional scale through quantitative zoning evaluation method. The purpose is to construct the zoning evaluation method for geothermal resources, and to provide reference for the exploration and development of middle-deep geothermal resources in key areas. In order to effectively reduce the risk of geothermal resources development and provide a reliable basis for the planning and management of geothermal resources development and utilization.
2 Geologic setting
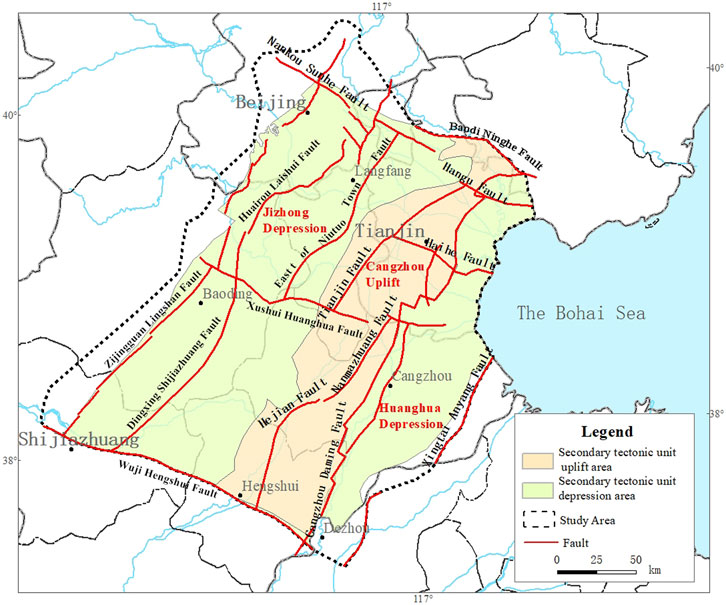
The central Hebei Province is located in the North China Plain, where the Bohai Bay basin is extremely rich in geothermal resources. It is one of the important mid deep hydrothermal geothermal development zones in China (Jiang et al., 2013). North China plain is a typical alluvial plain with low and flat terrain, sloping from the west to the east, and gradually lowering from the Taihang Mountains to the Bohai Bay (Chen, 1988). This area is mainly a huge Meso-Cenozoic depression, mostly low-lying land and lacustrine marsh, with a sedimentary thickness of 1,500–5000 m. It mainly develops three groups of faults in NNE-NE direction, NW direction and near EW direction (Liu et al., 2018; Zhang et al., 2023). The study area can be divided into three secondary structural units: Jizhong depression, Cangxian uplift and Huanghua depression (Figure 1) (Qiu, 2004; Gong, 2011). The overall structural pattern of NE-SW uplifts and depressions is presented. The sedimentary layer of this area is thick and wide, which has been formed a huge space for water and heat storage (Cai Y. H., 2004). There are two types of the developed geothermal reservoirs at the shallow depth of 4000 m in the study area: pore type and karst fissure type. From shallow to deep, five major geothermal reservoirs are mainly developed, including Minghuazhen formation, Guantao formation, Dongying formation, Cambrian-Ordovician and Middle-Upper Proterozoic (Wang et al., 2017b). Because it is more susceptible to be heated by a deep heat source, the temperature of deep bedrock geothermal reservoirs are higher, which are mainly existed in the Lower Paleozoic Cambrian-Ordovician and the Middle-Upper Proterozoic carbonate karst cavern-fractured geothermal reservoirs (Wang and Zhou, 1992). This study focuses on the deep karst fracture-type geothermal reservoirs.
2.1 Cambrian-ordovician geothermal reservoir
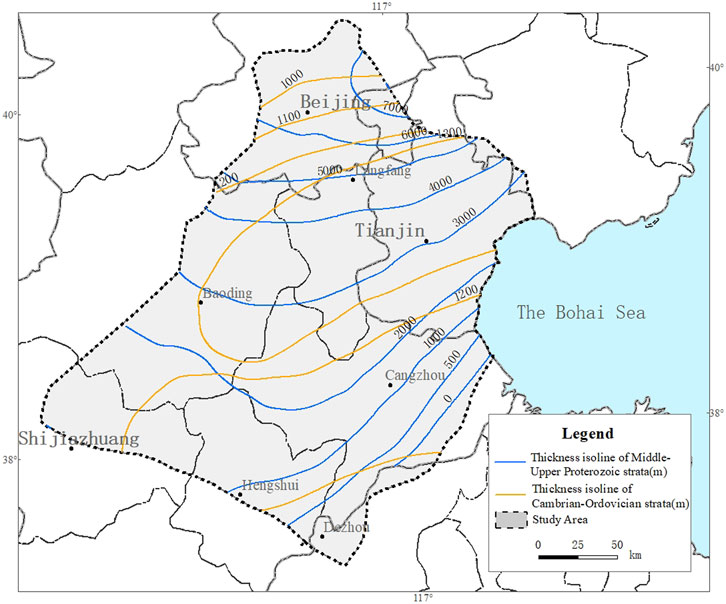
The Cambrian-Ordovician geothermal reservoir is mainly distributed in the Cangxian uplift, and other scattered areas are located near the boundary of the structural units, with a thickness of 600–800 m (Figure 2) (Chen et al., 1994; Zhang et al., 2018; Li and Zhang, (2018). Most of the buried depth of the Cambrian-Ordovician geothermal reservoir is buried under the Cenozoic stratum, and its developmental degree and the developmental thickness of the ancient weathering crust are affected by lithology, basement structure and the buried depth of the stratum, which is uneven. The roof interface of the Cambrian-Ordovician geothermal reservoir is controlled by the basement structure and fluctuates greatly. The degree of geothermal reservoir development varies greatly due to different top cover layers. The roof buried depth of the Cambrian-Ordovician geothermal reservoir is 2000–3000 m in Anxin, Fucheng, Shenze, and Cangxian in central Heibei (Chen et al., 1994; Liu et al., 2018). The proportion of reservoir thickness to formation thickness is about 20%, with an average effective porosity of about 3%. The water inflow of a single well is 150–1,500 m3/d (Feng, 2018; Li et al., 2018). The temperature range in the middle of the heat storage is 25°C–110°C, and the highest temperature area is located in Gaoyang low swell, where the highest temperature is about 120°C.
2.2 Middle-upper proterozoic geothermal reservoir
In the Beijing-Tianjin-Hebei plainStudy area, the dolomite carbonate rocks of the Jixian Wumishan formation and Gaoyuzhuang formation mainly were deposited. After the strong transformation in the later period, the karst fractures are extremely developed, and it is one of the most important geothermal reservoirs in the area. The geothermal reservoir is mainly distributed in the north-west of the Beijing-Tianjin-Hebei Plain, and the structural divisions include Jizhong depression, Cangxian uplift, and Huanghua depression, with a total thickness of 300–1000 m (Figure 2) (Chen et al., 1994; Wang et al., 2017b). In Gaoyang, Cangxian, Xianxian, and other areas in central Hebei, the overall burial depth is about 800–2000 m (Feng, 2018; Zhang et al., 2018). Due to the different geological and structural conditions, the buried depth of the geothermal reservoir is also different. Some are exposed to the surface to form peaks, and some are buried deeper than 3500 m. Karst fractures are developed and have good connectivity. The thickness of the thermal reservoir accounts for 25%–64.2% of the formation thickness, and the average effective porosity of the geothermal reservoir is 3%–6%. The water inflow of a single well is 400–1,500 m3/d (Feng, 2018; Li et al., 2018).The geothermal reservoir temperature is generally greater than 60°C, and the highest temperature area is located in Niutuozhen swell, Xianxian swell, Dacheng swell and other places, the maximum temperature is about 130°C (Wang et al., 2017b; Feng, 2018).
3 Evaluation methods
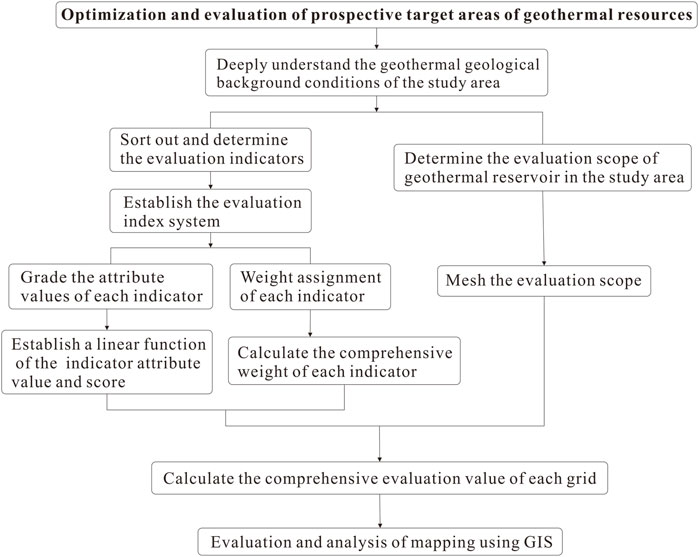
Taking the central part of Hebei Province as an example, by selecting scientific evaluation methods, the exploration and development prospects of geothermal resources are divided into zones, which provides reliable basis for the planning and management of the middle and deep geothermal resources in north China (Liu J. L. et al., 2019). On the basis of comprehensive analysis of geothermal geological conditions in the evaluation area, this paper draws lessons from the previous technical evaluation experience of geothermal resources development and utilization suitability zoning (Liu et al., 2006; Xu C et al., 2009). The evaluation model of the analytic hierarchy process (AHP) is used to realize the quantization of division index (Liu et al., 2012).This method quantifies the decision-maker’s experience and is more convenient to use when the target factors are complex and lack of necessary data, so it is widely used in practice (Guan et al., 2009). The specific analysis process mainly includes the following steps (Figure 3).
① Constructing an indicator evaluation system: By thoroughly understanding the geothermal geological background conditions and development and utilization needs of the study area, we will sort out and determine the evaluation indicators at various levels, and construct an indicator evaluation system.
② Assigning scores to each evaluation indicator: Based on the actual range of attribute values for each indicator in the study area, as well as relevant standards and experience, a grading system is established. For each grade, a score is assigned, and a linear function is constructed between attribute values and scores to obtain the corresponding score for different attribute values.
③ Assigning weights to each evaluation indicator: Using the analytic hierarchy process to assign weights to each level of indicators and calculate the comprehensive weight value for each weight.
④ Calculating the comprehensive evaluation value of the evaluation area: Determine the evaluation scope of the thermal reservoir in the study area, and perform equal-area grid sectioning on the evaluation scope. Using the method of multi-source information superposition, that is, weighted calculation of the scores of all indicators in each grid and the corresponding comprehensive weight values in the evaluation area, the comprehensive evaluation value of each block can be obtained.
⑤ Mapping through GIS analysis: Using the spatial analysis function of GIS, the comprehensive evaluation values of each block are analyzed and mapped using kriging method, and areas with high scores are screened as prospective target areas for geothermal resources.
3.1 The determination of evaluation indicators
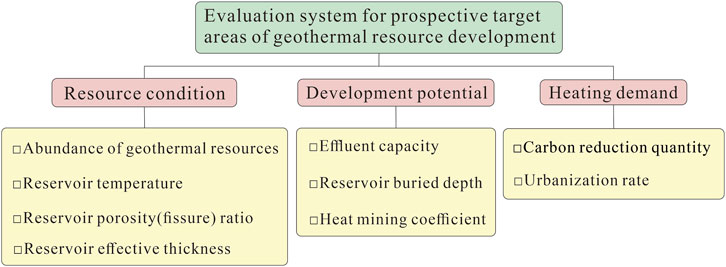
From the perspective of geothermal resource development, the target area for geothermal resources should have resource condition, development potential, and heating demand. Considering these three aspects, areas with good resource condition have abundant geothermal resources, high temperatures, large reservoir porosit (fissure) ratio, and reservoir effective thickness of the reservoir layer. Such areas have strong water productivity, better connectivity, and stronger heat conduction and water productivity. Areas with great development potential have better effluent capacity, shallower reservoir buried depth, and stronger economic development, areas with higher heat mining coefficients have greater development potential. Areas with high heating demand are a crucial part of the evaluation of geothermal resource development, which further strengthens the development and utilization of geothermal resources. Hebei Province is an important industrial province in China with relatively concentrated carbon emissions. In 2020, the carbon emissions were 794.18 million tons of carbon dioxide equivalent, ranking third in the country in total emissions. Therefore, areas with higher urbanization rate have a high demand for carbon neutrality. Through the above considerations, we further analyzed the geological background conditions and various factors that may be involved in the division of geothermal resources in central Hebei, summarized and classified the indicator levels, and constructed an evaluation indidicator system for the target area of geothermal resource development in central Hebei (Figure 4; Table 1). The system includes three primary evaluation indicators: the resource condition, the development potential, the heating demand; nine second-level evaluation indicators: the resources abundance, the reservoir temperature, the reservoir fissure ratio, the reservoir effective thickness, the water yield capacity, the reservoir buried depth, the heat mining coefficient, the carbon reduction quantity, the urbanization ratio.
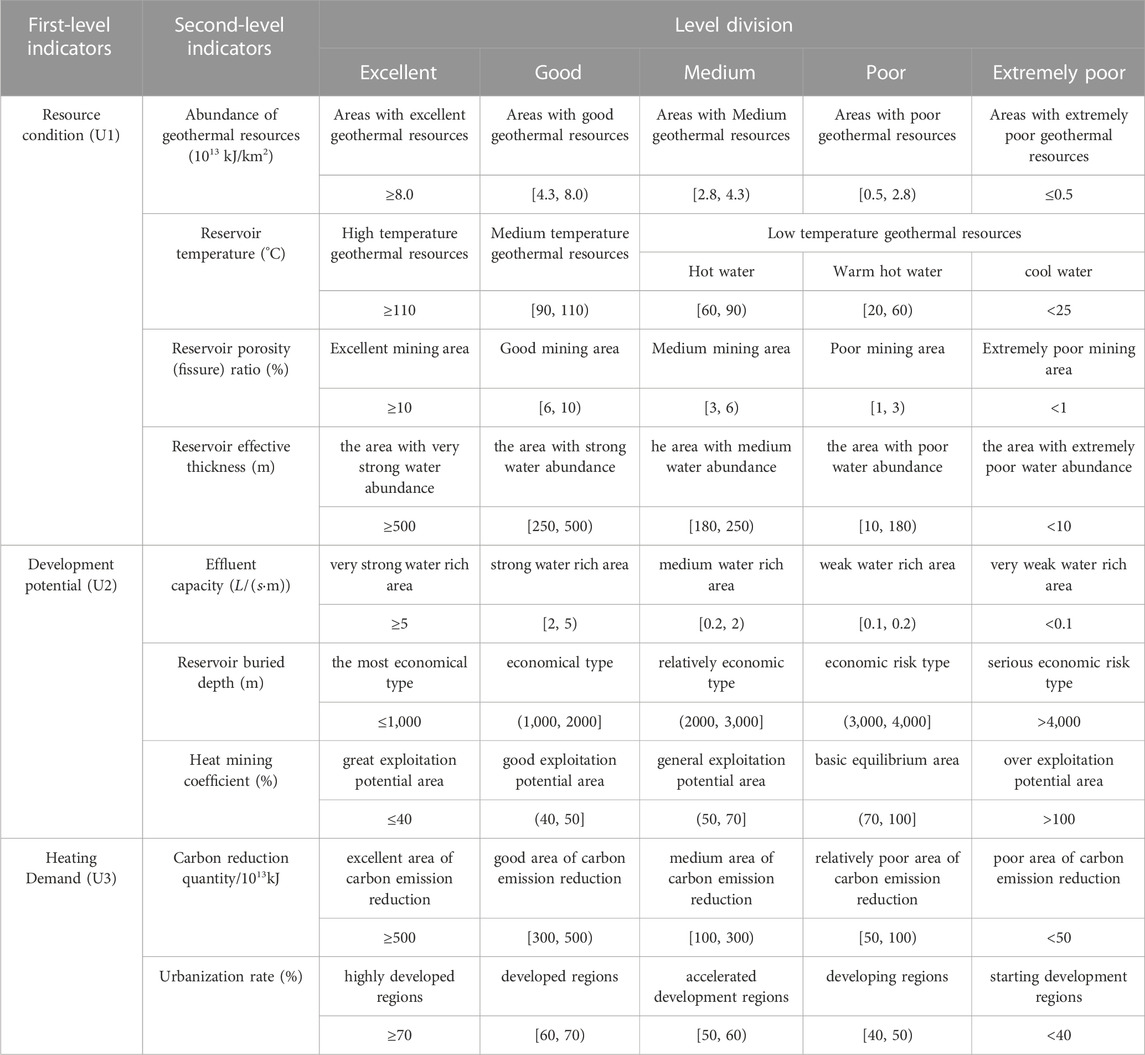
TABLE 1. Grading evaluation table for evaluation indicators of prospective target areas for geothermal resources development.
The abundance of geothermal resources (
Where
The reservoir temperature (
The calculation of pore-type reservoir temperature is determined by the measured wellhead water temperature and geothermal gradient. Calculation formula:
where
The division of temperature in the evaluation process is based on the “GB 11615-2010 code for geological exploration of geothermal resources,”
The reservoir porosity (fissure) ratio: The reservoir porosity is the proportion of pore volume per unit volume of rock (Zhou, 2005; Wang, 2013). The porosity of geothermal reservoir is one of the important parameters for evaluating geothermal resources (Yan et al., 2022), and the pore size, connectivity and filling material also have great influence on the heat transfer of rock (Wang and Sun, 2000), which reflects the water-rich nature of the thermal reservoir. According to the previous geophysical logging data and well testing data, this paper determines that the porosity of carbonate rocks in central Hebei is generally 1%–10%, so the porosity of geothermal reservoirs is divided into five levels: the reservoir porosity (fissure) ratio ≥10% is an excellent mining area, the reservoir porosity (fissure) ratio within the range of 6%–10% is a good mining area, the reservoir porosity (fissure) ratio within the range of 3%–6% is a medium mining area, the reservoir porosity (fissure) ratio within the range of 1%–3% is a poor mining area, and the reservoir porosity (fissure) ratio <1% is a very poor mining area.
The reservoir effective thickness: the reservoir effective thickness is the reservoir thickness containing geothermal fluid, which reflects the size of the thermal storage space of the geothermal reservoir. Under the same conditions, the unit area of water-rich strong in the thick section, conversely, weak. In this paper, the ratio of the bedrock geothermal reservoir thickness is based on the borehole data and referring to the regional value. Due to the uneven development of the karst fissures of the bedrock geothermal reservoir, the karst fissures near the top of the bedrock are relatively developed, With the increase of depth, its development degree gradually decreases, so when the thickness of bedrock geothermal reservoir is large, it is generally taken as a small value. The Cambrian-Ordovician reservoir thickness ratio is 20%, and the Middle-Upper Proterozoic reservoir thickness ratio is 25% (Zhang et al., 2013).
According to the calculation results of the reservoir effective thickness in central Hebei, it can be divided into five grades: the reservoir effective thickness ≥500 m is the area with very strong water abundance, the reservoir effective thickness within the range of 250–500 m is the area with strong water abundance, the reservoir effective thickness within the range of 180–250 m is the area with medium water abundance, the reservoir effective thickness within the range of 10–180 m is the area with poor water abundance, and the reservoir effective thickness <10 m is the area with extremely poor water abundance.
The water yield capacity: the water yield capacity is reflected by the unit water inflow. The unit water inflow is the basic measurement to measure the pumping capacity of a well. The larger the value, the higher the water production capacity of the well. It is an important indicator to compare the water production capacity of the aquifer (Hudak, 2010; Zhai et al., 2013), which represents the water supply capacity of geothermal reservoir. Based on the statistics of pumping test data of geothermal wells in the study area, and according to the division of unit water inflow in the Exploration Specification of Hydrogeology and Engineering Geology in Mining Areas (GB12719-91), The water yield capacity in central Hebei is divided into five levels: the water yield capacity ≥5
The reservoir buried depth: the buried depth of geothermal reservoir directly affects the cost of geothermal resource exploitation. According to the Geothermal Resource Evaluation Method and Estimation Regulations (DZ/T0331-2020), if the depth is less than 1000 m, hot water above 40°C can be obtained in order to be used as an available resource (Xu and Guo, 2009). The reservoir depth is less than 1,000 m as an economic geothermal resource, while is 1,000–3,000 m as a sub economic geothermal resource. The lower limit of geothermal reservoir depth can reach 3,500 m–4,000 m. For geothermal reservoir depth greater than 3,000 m, there are significant differences in geothermal geological characteristics and utilization conditions, which is not conducive to the comprehensive evaluation of geothermal resources. According to the previous borehole data and geophysical interpretation thickness, this paper determines the buried depth of the reservoir, and then divides the buried depth of the geothermal reservoir into five levels according to the Geothermal Resource Evaluation Method and Estimation Regulations (DZ/T0331-2020), which are respectively: the reservoir buried depth ≤1,000 m is the most economical type, the reservoir buried depth within the range of 1,000–2,000 m is the economical type, the reservoir buried depth within the range of 2,000–3,000 m is the relatively economic type, the reservoir buried depth within the range of 3,000–4,000 m is the economic risk type, and the reservoir buried depth≥ 4,000 m is the serious economic risk type.
The geothermal exploitation coefficient (
where
The carbon reduction quantity (
where
The exploitable geothermal resources in this paper are calculated according to the background value of the actual exploitable geothermal resources in central Hebei, and then divided into five levels according to the range of the obtained values, which are:
The urbanization rate: the urbanization rate is a measure of urbanization, usually using the demographics indicator, which is the proportion of the urban population in the total population (both agricultural and non-agricultural).The higher the degree of economic development, the higher the rate of urbanization, which reflects the extent of the regional demand for resources. The size of the urbanization rate reflects the heating scale degree for geothermal energy. Urbanization is closely related to urban energy consumption and its carbon emissions. For every 0.095% increase in urbanization, the total energy consumption increases by 1% (Wang Y. et al., 2020).With the development of urbanization in our country, the carbon emission presents a pattern of increasing from south to north and decreasing from east coast to inland (Wu and Jin, 2023).Therefore, geothermal resources are also an effective way to achieve dual-carbon targets in high-urbanization areas. The data of this paper is derived from the demographic data in 2019. The urbanization rate is divided into five levels: the urbanization rate ≥70 kJ are highly developed regions, the urbanization rate within the range of 60%–70% are developed regions, the urbanization rate within the range of 50%–60% are accelerated development regions, the urbanization rate within the range of 40%–50% are developing regions, and the urbanization rate <40% are starting development regions.
3.2 The given evaluation score of the interval attribute
According to the above analysis, combined with the characteristics of deep carbonate geothermal reservoirs in central Hebei, fully considering the geothermal geological background conditions and factors affecting the development and utilization potential of geothermal resources in the central Hebei region, based on the background value of geothermal geological conditions in central Hebei, “the evaluation methods and specifications for geothermal resources” (DZ/T0331-2020), “the code for geological exploration of geothermal resources” (GB 11615-2010), “the code for hydrogeological and engineering geological survey of mining areas” (GB12719-91) and previous experience values have divided each indicator into 5 levels, (excellent, good, medium, poor, and extremely poor), and the scoring intervals of five levels are given respectively: excellent = 9, good ∈ [7–9), medium ∈ [3–7), poor ∈ [1–3), range = 1. Based on whether it is beneficial for the exploration and development of geothermal resources as a standard, the attribute interval data of each indicator is scored and quantified. The scoring algorithm is to establish a linear formula according to the evaluation interval division and evaluation score range of the indicator. Based on this, the scores corresponding to each indicator attribute value can be calculated (Table 2).
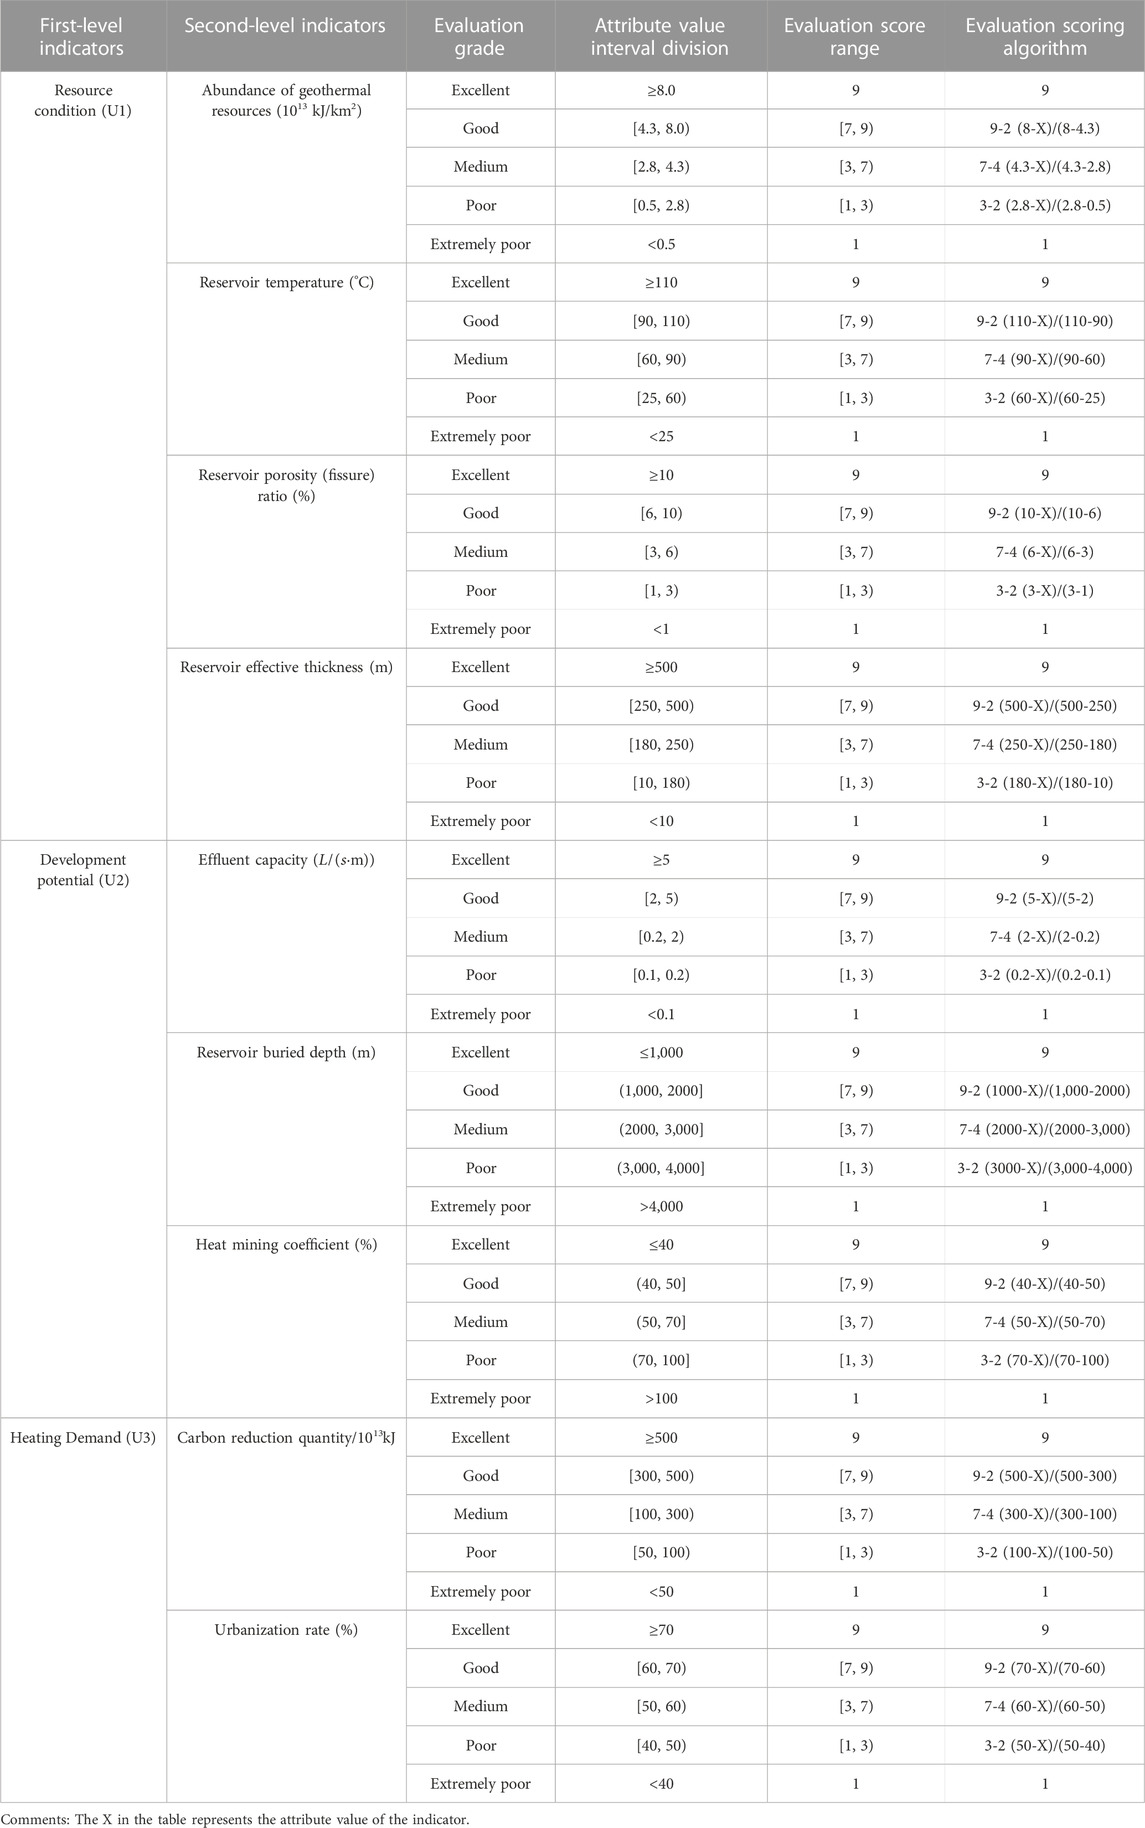
TABLE 2. Scoring table for evaluation indicators of prospective target areas for geothermal resource development.
3.3 The quantification of evaluation factors weight
The weight is a quantized value which represents the effect of the lower sub-criteria relative to the upper one (Cai L., 2004). In order to ensure the reliability and credibility of the weight taken by each evaluation index factor, the analytic hierarchy process (AHP) evaluation model was used to calculate the weight of factors (Di et al., 2013). The weight of each evaluation index is evaluated comprehensively by expert scoring method and analytic hierarchy process. The analytic hierarchy process (AHP) is the relative value obtained by comparing the advantages of each index, that is the superiority weight (Zhang, 2000; Deng et al., 2012). The weight value is determined and tested by the judgment matrix. Cebi et al. (2023) used the DF-AHP method to determine the importance of pharmaceutical industry evaluation standards, Ma (2023) proposed a fuzzy hybrid AHP evaluation method for evaluating the risks of urban wind power enterprises, Deretarla et al. (2023) used Analytic Hierarchy Process (AHP) and Complex Proportional Assessment (COPRAS) to evaluate suppliers. AHP has been widely applied in various industries.
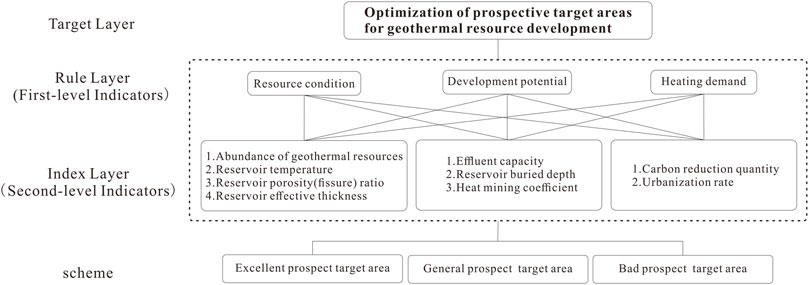
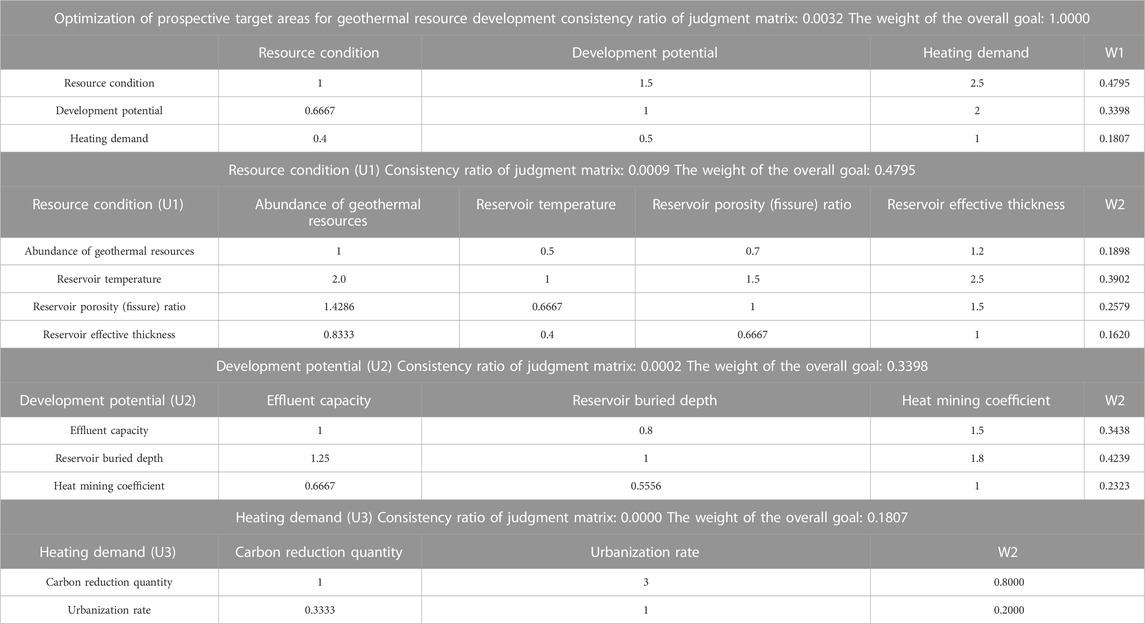
The analytic hierarchy process (AHP) is used to determine the weight of each layer in the index system, and the hierarchical structure of the evaluation index system for the optimization of geothermal resource exploration and development prospect area is designed, including the target layer, the rule layer (First-level indicators), the index layer (second-level indicators), and the scheme (Figure 5). The relative values between indicators are obtained through the comparison of priority and importance, and a pairwise comparison judgment matrix of importance is established. The 1–9 ratio scaling method is used to compare the importance of influencing factors. The consistency ratio of the comparison judgment matrix of the 9 evaluation indicators constructed in this evaluation is far less than 0.1, indicating satisfactory consistency, thus determining the weight values of each level. Calculate the comprehensive weight values of each indicator based on the results and interrelationships of the weight values of the two levels. The calculation method is as follows:
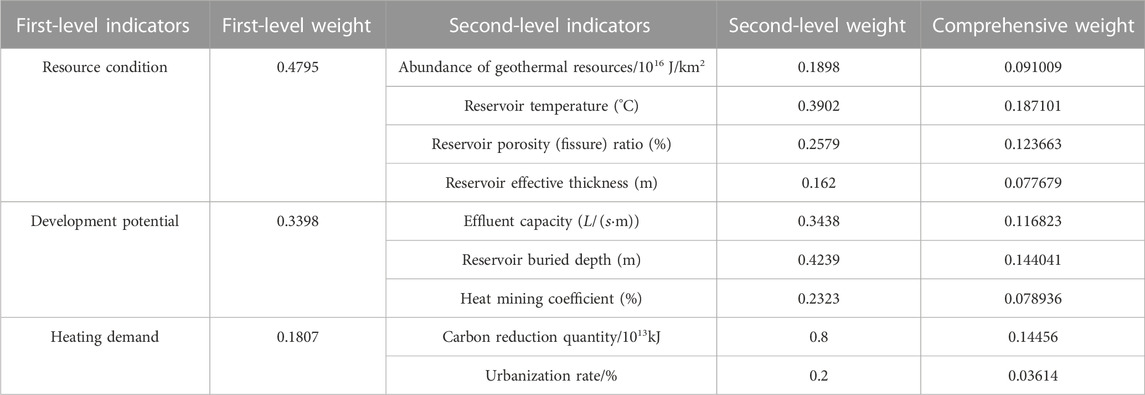
According to the above method, the importance pairwise comparison judgment matrix of each level is constructed as shown in Table 3. From the calculation results, it can be seen from the calculation results that the importance of the first-level indicators in descending order is: Resource condition > Development potential > Heating demand, Weight value W1 = (0.4795, 0.3398, 0.1807); the importance of the second-level indicators in descending order is: Carbon reduction quantity > Reservoir buried depth > Reservoir temperature > Effluent capacity > Reservoir porosity (fissure) ratio > Heat mining coefficient > Urbanization rate > Abundance of geothermal > Reservoir effective thickness, Weight value W2 = (0.8000, 0.4239, 0.3902, 0.3438, 0.2579, 0.2323, 0.2000, 0.1898, and 0.162). According to Formula 6, the comprehensive weight values of the nine indicators are obtained. From the calculation results, it can be seen that the weight values of reservoir temperature, carbon reduction quantity and reservoir buried depth are relatively high, as shown in Table 4.
3.4 The calculation of comprehensive evaluation value
In this paper, the analytic hierarchy process (AHP) and multi-source information superposition evaluation method based on GIS are applied to the zoning evaluation of hydrothermal geothermal target area. Through systemic analysis of hydrothermal geothermal influence factors, and according to the comprehensive weight of each influence factor, GIS is used to prepare single factor information map. The each single factor information map is registered and processed to form a composite superimposed evaluation model, and then the zoning evaluation map of the study area is carried out. Formula 7 is used for GIS spatial analysis and evaluation (Jin et al., 2004; Xu MJ et al., 2009).
Where
4 Results
Based on the in-depth understanding of the geothermal geological background conditions in the central region of Hebei Province, the evaluation indicators have been sorted out and determined, and an evaluation indicator system for the prospective target areas of geothermal resources in the study area has been constructed. Based on the principle that the higher the score is, the more favorable the mining is, the attribute values of each indicator have been classified into different levels, and a linear function between each attribute level and the scoring area has been established. According to this, the corresponding scores can be obtained based on different attribute values. The analytic hierarchy process is used to assign weights to each level of evaluation indicators, and the comprehensive weights of each evaluation indicator are calculated. While carrying out the above work, this article delineates the evaluation area based on the structural units in the study area, the cover layer with a geothermal gradient greater than 3°C/100 m, the depth of the geothermal reservoir less than 4000 m, and the distribution range of the geothermal reservoir as the boundary (Figures 6, 7). The evaluation area is divided into equal-area grids, and the weighted values of the scores and comprehensive weights of each indicator in each grid are calculated according to the formula x, which can obtain the comprehensive evaluation value of each grid. Then, using the spatial analysis function of GIS, the comprehensive evaluation value of each grid in the evaluation area is analyzed and mapped using the kriging difference method, and the geothermal resource zoning evaluation map is obtained (Figures 8, 9). From the calculation results, it is known that the regions with higher scores have a geothermal resource abundance greater than 6.0 × 10¹³ kJ/km2 and an effective reservoir thickness greater than 500 m. However, the middle-upper Proterozoic geothermal reservoirs located in Xiongan New Area have a unit water inflow rate of basically greater than 5
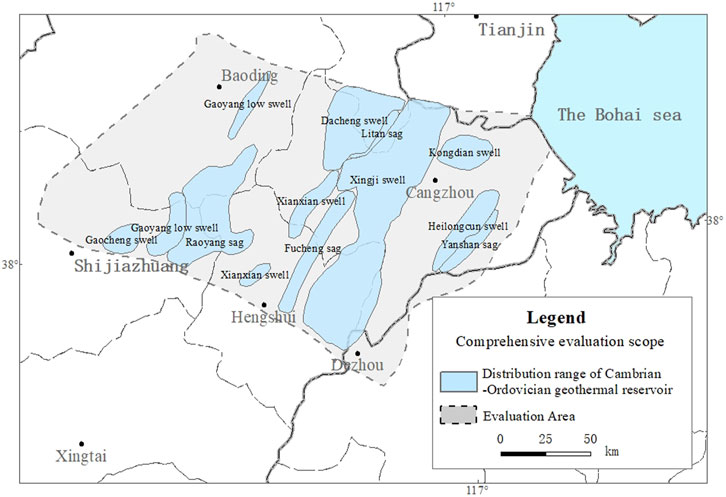
FIGURE 6. The distribution range of Cambrian-Ordovician geothermal reservoir with burial depth less than 4000 m.
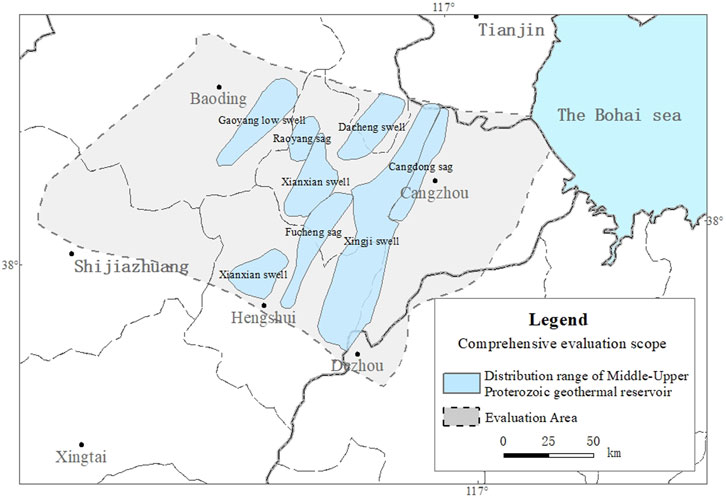
FIGURE 7. The distribution range of Middle-Upper Paleozoic geothermal reservoir with burial depth less than 4000 m.
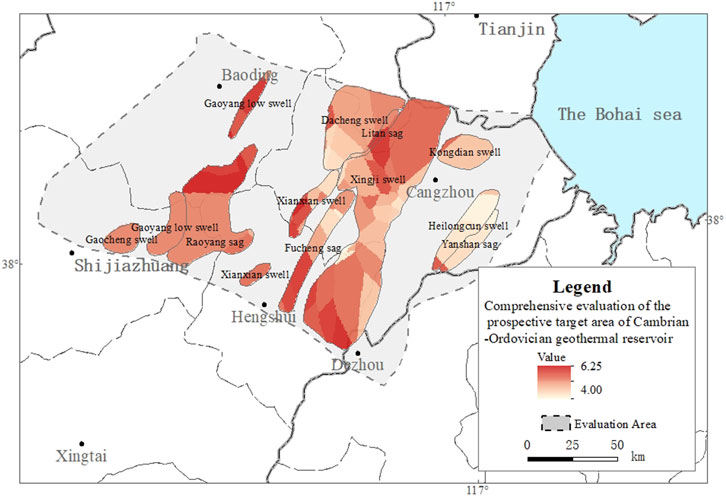
FIGURE 8. Comprehensive evaluation score of Cambrian-Ordovician geothermal reservoir. Evaluation unit in central Hebei.
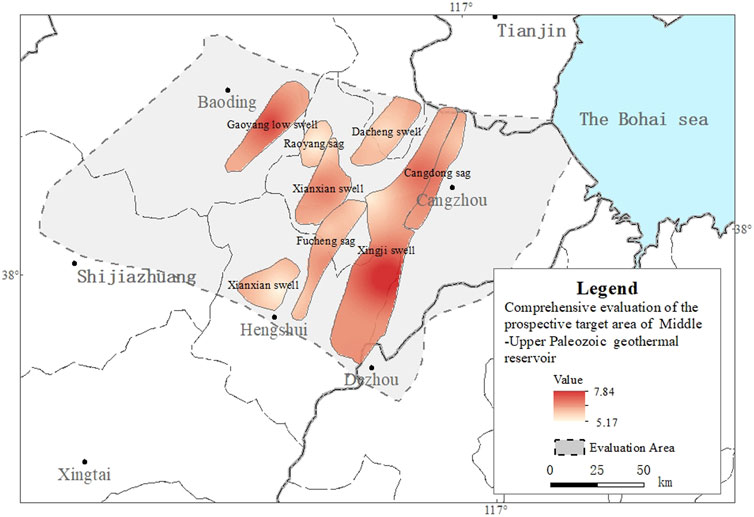
FIGURE 9. Comprehensive evaluation score of Middle-Upper Proterozoic geothermal reservoir. Evaluation unit in central Hebei.
5 Discussion
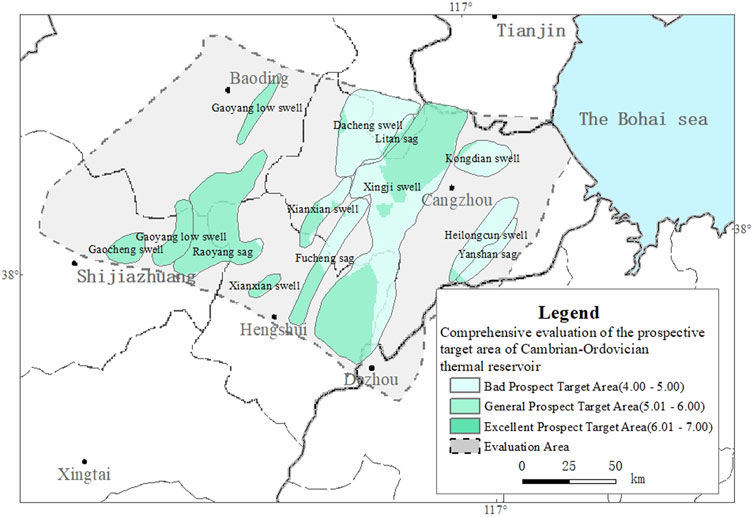
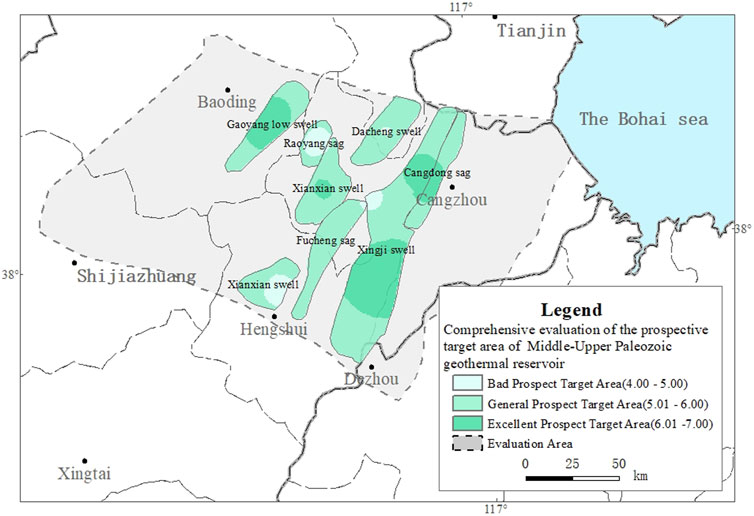
Finally, according to the evaluation results, the two sets of geothermal reservoirs are divided into three levels of prospect target areas (Figures 10, 11): the areas with evaluation score over 6.00 were classified as the excellent prospect target areas; the areas with evaluation score over 5.00 and less than 6.00 were classified as the general prospect target areas; and the areas with evaluation score less than 5.00 were classified as the bad prospect target areas. See Table 5 for the evaluation units included in the three levels of prospect target areas.
As can be seen from Figures 10, 11, due to regional differences in the characteristics of geothermal reservoirs, exploration and development prospects are not the same. The Middle-Upper Proterozoic geothermal reservoir distribution area of the excellent prospect target area accounts for 56%, which is mainly located at Xingji swell, and Gaoyang low swell. For the Middle-Upper Proterozoic geothermal reservoir in the evaluation area, the regions with high geothermal abundance values are Xianxian and Dacheng. Among the Middle-Upper Proterozoic geothermal reservoirs, the geothermal resource potential in most areas of central Hebei have great exploitation potential and certain exploitation potential, including Cangxian in Cangzhou, Fucheng in Hengshui and Xiong’an New Area; There is no excellent prospective target area in the Cambrian-Ordovician geothermal reservoir, and the general prospective target area accounts for 54%. The northern part of Cangzhou, the northeastern part of Hengshui, and the border among the Shijiazhuang, and the junction of Shijiazhuang, Baoding and Hengshui all have certain exploitation potential.
According to the statistics of the distribution area of favorable areas of geothermal reservoirs at all levels, the geothermal reservoir distribution area of the excellent prospect target area accounts for 28%, and the Middle-Upper Proterozoic geothermal reservoirs mainly distributed in Xiong’an New Area, the eastern part of Hengshui, and the central part of Cangzhou; The geothermal reservoir distribution area of the general prospect target area accounts for 46%, and the distribution area of Cambrian-Ordovician geothermal reservoirs is slightly larger; The geothermal reservoir distribution of the bad prospect target area accounts for 26%, and the distribution area are mainly Cambrian-Ordovician geothermal reservoirs. From the comprehensive evaluation results, it can be seen that the Middle-Upper Proterozoic geothermal reservoir target area is relatively large, and the proportion of favorable target areas with better conditions is relatively large.
This article uses a quantitative zoning evaluation method to assess the prospective target areas for geothermal resources in the central Hebei region from the perspective of development and utilization. It delineates the exploration and development target areas for deep geothermal resources in the central Hebei region within a large area. This evaluation method is also applicable to the screening of resource development prospects in other regions, such as carbon sequestration, shallow geothermal energy resource development, and deep dry hot rock resource development.
From the perspective of resource utilization and sustainable development, in order to maximize the availability of geothermal resources for economic construction services, the reasonable planning and development of geothermal resources can greatly supplement the consumption of energy resources. This evaluation provides grounds for the sustainable development and utilization of the geothermal resources in North China Plain. Under the current situation, the large-scale and sustainable development and utilization of geothermal energy is part of the implementation of General Secretary Xi Jinping’s National Energy Security Strategy, which is a response to global climate change. Implementing that strategy requires energy conservation and emission reduction via concrete measures to help achieve the goal of a “2030 carbon peak and 2060 carbon neutrality” (Liu et al., 2023).
6 Conclusion
(1) Based on the geothermal geological conditions in the central Hebei region, this article establishes a comprehensive evaluation index system for the favorable areas of deep geothermal development in the central Hebei region from three aspects: resource conditions, development potential, and heating demand. By combing the relevant indicators for the development and utilization of geothermal energy in the central Hebei region, a linear function is constructed based on the evaluation interval values of the indicator attributes and the corresponding score ranges. The analytic hierarchy process is used to assign weights to each indicator, which prepares for the weighted calculation of the comprehensive evaluation value of each block in the evaluation area. Finally, the GIS is used to analyze and evaluate each indicator by superimposing them, that is, to comprehensively weight and score each indicator in each section of the evaluation area, and to optimize the comprehensive score of the high-scoring areas as the prospective target areas.This evaluation method can provide a reference for optimizing the exploration and development goals of geothermal resources in key areas.
(2) According to the evaluation results, from the perspective of regional structure, the excellent prospective target areas of the Middle-Upper Proterozoic geothermal reservoirs are mainly located in the Xingji uplift and the Gaoyang low uplift, and the excellent prospective target areas of the Middle-Upper Cenozoic geothermal reservoirs account for 56%. The geothermal resource abundance in these areas is greater than 8.0 × 10¹³ kJ/km2, with good resource development potential. It is suitable for the exploration and development of geothermal resources. From the perspective of geographical division, Xiong’an New Area, Cangzhou, and the eastern part of Hengshui are the excellent prospective target areas in the Middle-Upper Proterozoic geothermal reservoir evaluation unit.
(3) This assessment provides a reference basis for the sustainable development and exploitation of geothermal resources in the North China Plain. At the same time, it also provides new ideas for the optimization and evaluation of regional target areas in other resource and energy fields.
Data availability statement
The raw data supporting the conclusion of this article will be made available by the authors, without undue reservation.
Author contributions
HX: Data curation, Investigation, Methodology, Software, Writing–original draft, Writing–review and editing. YY: Investigation, Methodology, Writing–review and editing. SG: Investigation, Methodology, Writing–review and editing. JS: Investigation, Methodology, Writing–review and editing. WS: Data curation, Writing–review and editing. JL: Methodology, Project administration, Writing–review and editing. ZF: Data curation, Writing–review and editing.
Funding
The author(s) declare financial support was received for the research, authorship, and/or publication of this article. This research was supported by China Geological Survey project (DD20221680/DD20190127).
Acknowledgments
We thank the CNOOC Research Institute Ltd. and the individuals who contributed to this work.
Conflict of interest
Author SG was employed by CNOOC Research Institute Ltd.
The remaining authors declare that the research was conducted in the absence of any commercial or financial relationships that could be construed as a potential conflict of interest.
Publisher’s note
All claims expressed in this article are solely those of the authors and do not necessarily represent those of their affiliated organizations, or those of the publisher, the editors and the reviewers. Any product that may be evaluated in this article, or claim that may be made by its manufacturer, is not guaranteed or endorsed by the publisher.
References
Cai, L. (2004a). The fuzzy mathematics methods of determining weight in modeling and simulation. Teach. Technol. 2, 23–25.
Cai, Y. H. (2004b). Geothermal direct utilization. Tianjin: Tianjin Ancient Literature Press, 488–628.
Cebi, S., Gündoğdu, F. K., and Kahraman, C. (2023). Consideration of reciprocal judgments through Decomposed Fuzzy Analytical Hierarchy Process: a case study in the pharmaceutical industry. Appl. Soft Comput. 134, 110000. doi:10.1016/j.asoc.2023.110000
Chen, M. X., Wang, J. Y., Deng, X., Hu, S. B., Huang, S. P., Pang, Z. H., et al. (1994). China geothermal resources-formation characteristics and potential assessment. Beijing: Science Press, 90–123.
Ciriaco, A. E., Uribe, M. H., Zarrouk, S. J., Downward, T., Omagbon, J. B., Austria, J. J. C., et al. (2022). Probabilistic geothermal resource assessment using experimental design and response surface methodology: the Leyte geothermal production field. Geothermics 103, 102426. doi:10.1016/j.geothermics.2022.102426
Ciriaco, A. E., Zarrouk, S. J., Zakeri, G., and Mannington, W. I. (2020). Refined experimental design and response surface methodology workflow using proxy numerical models for probabilistic geothermal resource assessment. Geothermics 88, 101911. doi:10.1016/j.geothermics.2020.101911
Deng, X., Li, J. M., Zeng, H. J., Chen, J. Y., and Zhao, J. F. (2012). Research on computation methods of AHP wight vector and its applications. Math. Pract. Theory 7, 93–99. doi:10.3969/j.issn.1000-0984.2012.07.012
Deretarla, Ö., Erdebilli, B., and Gündoğan, M. (2023). An integrated Analytic Hierarchy Process and Complex Proportional Assessment for vendor selection in supply chain management. Decis. Anal. J. 6, 100155. doi:10.1016/j.dajour.2022.100155
Di, Y. H., Wu, Y. L., and Jiang, H. (2013). Scheme optimization of geothermal project based on grey relational analysis and analytical hierarchy process. Refrig. Air Cond. 2, 164–169. doi:10.3969/j.issn.1671-6612.2017.02.011
Feng, B. B. (2018). Geothermal resource potential research in central area of ji zhong depression. master's thesis. Beijing: China University of Geosciences.
Feng, W. J., and Cao, B. (2007). Geoheat resources evaluation and target optimization in Gaoyou region of Jiangsu. Jiangsu Geol. 2, 130–133. doi:10.3969/j.issn.1674-3636.2007.02.010
Gao, Z. X. (2009). The summarization of geothermal resources and its exploitation and utilization in Shandong province. J. Shandong Univ. Sci. Technol. 28 (2), 1–7. doi:10.3969/j.issn.1672-3767.2009.02.001
Gong, Y. L. (2011). Geothermal structure and thermal evolution of the Bohai Bay basin in eastern China. Beijing: China Atomic Energy Press, 1–18.
Guan, S. Y., Long, Z. G., and Miao, Z. (2009). The adaptive partition of groundwater source heat pump system application in wuhan city. City Surv. 5, 143–146. doi:10.3969/j.issn.1672-8262.2009.05.043
Jiang, D. D., Jiang, W. W., and Hu, J. W. (2013). Study of crustal structure and geodynamic characteristics around the Bohai Sea area. Prog. Geophys. 4, 1729–1738. CNKI:SUN:DQWJ.0.2013-04-015. doi:10.6038/pg20130413
Jin, J. L., Wei, Y. M., and Ding, J. (2004). Fuzzy comprehensive evaluation model based on i mproved analytic hierarchy process. J. Hydraulic Eng. 3, 65–75. doi:10.3321/j.issn:0559-9350.2004.03.011
Kappelmeyer, O., and Haenel, R. (1981). Geothermics with special reference to application. Beijing: Science Press, 23–28.
Li, J., and Zhang, Z. (2018). Characteristics of geothermal resources in Jizhong depression (Hebei region). J.Hebei Univ. Technol. 47 (2), 113–120. doi:10.14081/j.cnki.hgdxb.2018.02.020
Li, S. T., Zhang, S. Q., Jia, X. F., Xu, T. F., Ren, T., and Li, F. C. (2018). Index system research of project site selection for dry hot rocks exploration. Geol. Surv. China 2, 64–72. doi:10.19388/j.zgdzdc.2018.02.10
Lin, W. J., Liu, Z. M., Wang, W. L., and Wang, G. L. (2013). The assessment of geothermal resources potential of China. Geol. China 1, 312–321. doi:10.3969/j.issn.1000-3657.2013.01.021
Liu, C., Huang, L., Zhang, D., Zhao, J., Deng, Y., Guo, P., et al. (2018). Genetic causes of oil-rich and oil-poor reservoirs: implications from two Cenozoic basins in the eastern North China Craton. Sci. China. Earth Sci. 61, 1910–1931. doi:10.1007/s11430-017-9271-6
Liu, G. Y., Zhao, Z. X., Ren, L., and Meng, L. J. (2022b). Study and application of the evaluation system concerning the hydrothermal type geothermal resource at the middle and deep layers of sedimentary basin. Oil, gas new energy 2, 38–54. doi:10.3969/j.issn.2097-0021.2022.02.007
Liu, J., Han, S., Yang, F., and Yue, D. (2023). The hydraulic connection analysis of dongying geothermal fluid using hydrochemical information and isotope data in tianjin coastal regions. Water-Sui. 15, 1235. doi:10.3390/w15061235
Liu, J., Song, M. Y., Qin, L. H., Yu, Y., Lin, W., and Kang, N. (2019a). Division of potential geothermal resources zones in the Wumishan Formation in Tianjin. Contributions Geol. Mineral Resour. Res. 2, 321–325. CNKI:SUN:DZZK.0.2019-02-021. doi:10.6053/j.issn.1001-1412.2019.02.021
Liu, J. L., Lin, L., and Chen, W. Q. (2012). Suitability division evaluation of groundwater source heat pump system in Tianjin. J. Jilin Univ. (Earth Sci. Ed. 12, 380–386. doi:10.13278/j.cnki.jjuese.2012.s1.027
Liu, J. L., Wei, X. P., Chen, W. Q., Tian, G. H., Qin, L. H., and Wang, L. L. (2019b). Geothermal liquid enrichment conditions and exploration & production prospect division of Dongying geothermal resources in Tianjin Binhai New Area. J. Hebei Geo Univ. 2, 20–25. doi:10.13937/j.cnki.hbdzdxxb.2019.02.004
Liu, L. C., Wang, J. S., Zhang, N., and Guo, M. L. (2006). Suitability division for water source heat pumps in the central districts of Beijing. Hydrogeology Eng. Geol. 6, 15–17. doi:10.1016/S1872-2040(06)60004-2
Liu, Z. M., Liu, L. G., Zhen, G. L., Qi, R. Y., Wang, J. M., Zhao, Y., et al. (2022a). Study on suitability evaluation system of urban geological conditions in Beijing. Urban Geol. 2, 164–174. doi:10.3969/j.issn.1007-1903.2022.02.007
Ma, Y. (2023). Research on safety risk assessment method of wind power enterprises based on hybrid analytic hierarchy process. J. Phys. Conf. Ser. 2418, 012084. doi:10.1088/1742-6596/2418/1/012084
Mao, X., Luo, L., Wang, X. W., and Guo, D. B. (2020). Distribution characteristics of cenozoic volcanic rocks and its geothermal exploration potential in Bohai bay basin. Geoscience 4, 858–864. doi:10.19657/j.geoscience.1000-8527.2020.04.21
Pang, Z. H., Luo, J., Cheng, Y. Z., Duan, Z. F., Tian, J., Kong, Y. L., et al. (2020). Evaluation of geological conditions for the development of deep geothermal energy in China. Earth Sci. Front. 1, 134–151. doi:10.13745/j.esf.2020.1.15
Qiu, N. S. (2004). Theory and application of geothermal regime in sedimentary basin. Beijing: Petroleum Industry Press, 133–167.
Quinao, J. J. D., and Zarrouk, S. J. (2018). Geothermal resource assessment using experimental design and response surface methods: the Ngatamariki geothermal field, New Zealand. Renew. Energ. 116, 324–334. doi:10.1016/j.renene.2017.09.084
Wang, D., Liang, H. J., Huang, J. C., and Liu, R. (2022a). Development path of Chinese geothermal business under carbon peaking and carbon neutrality targets. Petroleum&Petrochemical Today 5, 6–15.
Wang, G. L., Liu, Y. G., Zhu, X., and Zhang, W. (2020a). The status and development trend of geothermal resources in China. Earth Sci. Front. 1, 1–9. doi:10.13745/j.esf.2020.1.1
Wang, G. L., Zhang, W., Liang, J. Y., Lin, W. J., and Wang, W. L. (2017a). Evaluation of geothermal resources potential in China. Acta Geosci. Sin. 4, 449–459. doi:10.3975/cagsb.2017.04.02
Wang, G. L., Zhang, W., Lin, W. J., Liu, F., Zhu, X., Liu, Y., et al. (2017b). Research on formation mode and development potential of geothermal resources in Beijing-Tianjin-Hebei region. Geol. China 6, 1074–1085. doi:10.12029/gc20170603
Wang, J., and Zhou, J. P. (1992). Medium and low temperature geothermal resources in the North China Plain and its environmental impacts. Beijing: Seismological Press, 1–4.
Wang, T. H. (2019). Evaluation of geothermal resources and target selection in Shandong province. Explor. Dev. 7, 114–115. doi:10.3969/j.issn.1006-0235.2019.07.062
Wang, T. H., Wang, X. W., Mao, X., Luo, L., Gao, N. A., Liu, H. Y., et al. (2022b). Characteristics and development potential of geothermal resources in northern Cangxian uplift. Geol. China 6, 1747–1764. doi:10.12029/gc20220604
Wang, Y., Tan, D., Zhang, J., Meng, N., Han, B., and Ouyang, Z. (2020b). The impact of urbanization on carbon emissions: analysis of panel data from 158 cities in China. Acta Ecol. Sin. 21, 7897. doi:10.5846/stxb201911292591
Wu, J. S., and Jin, X. R. (2023). Analysis of carbon emissions and influencing factors in China based on city scale. Environ. Sci. 5, 2974–2982. doi:10.13227/j.hjkx.202205326
Xu, C., Dai, F. C., Yao, X., Chen, J., and Wang, Z. (2009). GIS-based landslids susceptibility assessment using analytical hierarchy process in Wenchuan earthquake region. J. Chin. J. Rock Mech. Eng. 28, 3978–3985. doi:10.3321/j.issn:1000-6915.2009.z2.100
Xu, M. J., Jiang, Y., Xie, Z. H., and Wang, X. J. (2009). Study on division of the appr opriate rank of water source heat pumps based on AHP in Beijing plain. Anal. Study 1, 10–14. doi:10.3969/j.issn.1007-1903.2009.01.004
Xu, S. G., and Guo, Y. S. (2009). Fundamentals of geothermal science. Beijing: Science Press, 132–137.
Yan, D. S., and Yu, Y. T. (2000). Evaluation and utilization of geothermal resources in Beijing-Tianjin-Hebei oil region. Beijing: China University of Geosciences Press, 8–62.
Yan, J. H., Wang, S. J., and Yao, Y. H. (2022). Evaluation and development practice of geothermal resources in oil region. Beijing: Petroleum Industry Press, 19–20.
Zhai, Y. Z., Wang, J. S., Teng, Y. G., and Zuo, R. (2013). Humble opinion on assessment indices for groundwater renewability: applicability of renewal period and recharge rate. Adv. Water Sci. 24, 56–61. doi:10.14042/j.cnki.32.1309.2013.01.014
Zhang, D. Z., Liu, Z. G., and Lu, H. L. (2013). Hebei geothermal energy. Beijing: Geological Press, 100–125.
Zhang, D. Z., Ma, Y. Q., and Su, Y. Q. (2018). Study on the calculation of geothermal fluids recoverable quantity and the distribution law of karst geothermal reservoirs in Hebei Plain. Geol. Surv. China 5, 78–85. doi:10.19388/j.zgdzdc.2018.02.12
Zhang, J., Fang, G., and He, Y. B. (2023). The deep high temperature characteristics and geodynamic background of geothermal anomaly areas in Eastern China. Earth Sci. Front. 2, 316–332. doi:10.13745/j.esf.sf.2022.1.20
Zhang, J. J. (2000). Fuzzy analytical hierarchy process. Fuzzy Syst. Math. 2, 80–88. CNKI:SUN:MUTE.0.2000-02-015.
Zhang, Y. J., Yu, H., Li, J. M., Yu, Z., and Zhang, J. (2016a). Prediction models of deep hydrothemal geothermal potential areas based on GIS: ACase study of western Anatolia, Turkey. J. Jilin Univ. (Earth Sci. Ed. 3, 855–864. doi:10.13278/j.cnki.jjuese.201603207
Zhang, Y. J., Zhu, C. C., Yu, H., Lei, H. L., and Lü, T. Q. (2016b). Evaluation of geothermal resources potential on GIS and fuzzy logic theory. J. Eng. Geol. 24, 1173–1178. doi:10.13544/j.cnki.jeg.2016.s1.170
Keywords: geothermal resource, target selection, zoning evaluation, prospect target area, central Hebei, North China plain
Citation: Xiang H, Yao Y, Gai S, Song J, Song W, Liu J and Feng Z (2023) The target selection and quantitative evaluation for deep geothermal resource zoning of typical geothermal fields in central Hebei of North China plain. Front. Earth Sci. 11:1264652. doi: 10.3389/feart.2023.1264652
Received: 21 July 2023; Accepted: 21 November 2023;
Published: 28 December 2023.
Edited by:
Yingfeng Sun, University of Science and Technology Beijing, ChinaCopyright © 2023 Xiang, Yao, Gai, Song, Song, Liu and Feng. This is an open-access article distributed under the terms of the Creative Commons Attribution License (CC BY). The use, distribution or reproduction in other forums is permitted, provided the original author(s) and the copyright owner(s) are credited and that the original publication in this journal is cited, in accordance with accepted academic practice. No use, distribution or reproduction is permitted which does not comply with these terms.
*Correspondence: Jiulong Liu, anVsb24wOTIwQDE2My5jb20=
 Hong Xiang
 Yahui Yao1,2
 Shaohua Gai