 Xiong Xiaofei
 Wang Haibo1,2,3
- 1State Key Laboratory of Shale Oil and Gas Enrichment Mechanisms and Effective Development, Beijing, China
- 2National Energy Shale Oil Research and Development Center, Beijing, China
- 3SINOPEC Petroleum Exploration and Production Research Institute, Beijing, China
Shale oil resources have enormous potential and broad development prospects in China. Especially with the rapid development of horizontal well volume fracturing technology, the production of shale oil has been greatly increased, and it has become an important position to increase oil and gas storage and production. However, due to the existence of artificial and natural fractures produced by fracturing, gas channeling will occur in the process of huff-n-puff gas injection, which will affect the production and lead to poor development effect. In this paper, foam is used as an anti-channeling agent in the process of huff-n-puff gas injection. The results of microfluidic experiments show that the production mode of foam in porous media is liquid membrane hysteresis and liquid membrane separation. In porous media, foam first blocks large channels such as fractures, and then enters the matrix. The oil recovery mechanism of foam assisted gas injection in porous media is to improve the sweep efficiency and oil displacement efficiency of gas. Compared with N2 huff-n-puff, the oil recovery of the first cycle of foam assisted N2 huff-n-puff increased by 4.50%, and the third cycle increased by 9.58%. It is proved that foam has good anti channeling effect in gas huff-n-puff injection process. The research results provide an effective method for efficient gas injection development of shale oil.
1 Introduction
Shale oil is an important unconventional oil and gas resource, which is widely distributed in China, with considerable predicted reserves and great development potential (Jia et al., 2012; Du et al., 2014; Qiu et al., 2015; Ning et al., 2017; Qu et al., 2017; Qi et al., 2018; Rao et al., 2018; Yang et al., 2018). The permeability of shale oil reservoir is usually very low, and the oil mobility is poor. It is necessary to achieve effective transformation of shale oil reservoir through large-scale fracturing to form artificial fractures, so as to improve the oil production of single wells. Therefore, the typical heterogeneity characteristics of shale oil reservoirs are reflected in the matrix with ultra-low permeability and fractures with high permeability (Soliman et al., 2010).
A large number of experiments and numerical simulation studies show that huff-n-puff gas injection is the most effective process measure to improve the recovery factor of shale reservoir (Wan et al., 2013; Gamadi, 2014; Sheng, 2015; Yu and Sheng, 2016; Li et al., 2017; Li L. et al., 2019; Mahzari et al., 2020). Fracturing technology creates artificial fractures in shale reservoirs and expands the flow channel of fluids in the reservoirs. Its purpose is to improve oil displacement efficiency, but it poses challenges for huff and puff gas injection technology to improve oil recovery. In the middle and late stages of gas injection through huff -n-puff, the oil content in the matrix inside and near the fracture decreases, and the subsequently injected gas is prone to flow along the fracture, which is unfavorable for improving oil recovery. Therefore, in order to weaken the adverse effects of cracks, we should manually intervene in the gas flow behavior during the gas injection process. The injected gas can accumulate pressure in the fractures and matrix, and enter the matrix for oil recovery under the established pressure difference.
So far, foam injection technology has good adaptability in the development of fractured reservoirs (Bernard and Jacobs, 1965; Dellinger et al., 1984; Heller et al., 1985; Casteel and Djabbarah, 1988; Srivastava and Nguyen, 2010; Szlendak et al., 2013; Szlendak et al., 2016; Li S. et al., 2019; Hao et al., 2020). Foam can seal fractures, control gas flow, and improve gas sweep efficiency and oil displacement efficiency. However, few scholars have paid attention to the issue of anti channeling during the process of gas injection through huff-n-puff. Therefore, it is instructive to study the channeling prevention effect of foam in huff -n-puff gas injection of shale reservoir.
By means of microfluidic experiments, the law of foam migration in porous media and the mechanism of auxiliary gas injection for oil recovery were revealed. The oil content in micro pores is monitored by NMR equipment, and the core recovery factor is calculated. The anti-channeling effect of foam in fractured shale core is confirmed.
2 The migration law of foam in porous medium
2.1 Experimental materials and methods
The experimental materials include a glass etching model and an Olympus BX-61 optical microscope. The intention of the model was drawn with CAD drawing software. The injection end and production end were connected by fractures, and the two sides of the fractures were evenly covered with irregular matrix, forming a fracture matrix Porous medium model. The model size is 63 mm × 63 mm, range of etching model is 44 mm × 44 mm, with a porosity of 10% (as shown in Figure 1). With the help of this model, the flow of foam in the fracture matrix can be observed intuitively, and the plugging mechanism of foam can be revealed. In the experiment, the foaming agent is 0.8wt% AOS surfactant solution, and the volume fraction of foam is 50%.
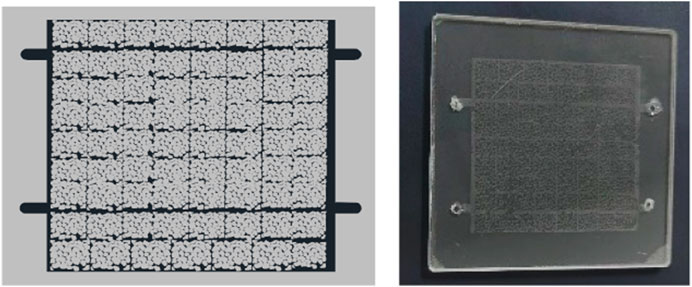
FIGURE 1. The fracture-matrix porous media model.
The experimental process of foam Microfluidics is shown in Figure 2, and the experimental steps are as follows:
1. Clean the glass etching model;
2. After the glass etching model is dry, we push 0.05 mL (0.25 times the pore volume) foaming agent solution into the model, and then inject the same volume of N2 to generate foam in this way. The migration of foam in porous media was observed and recorded with a microscope.
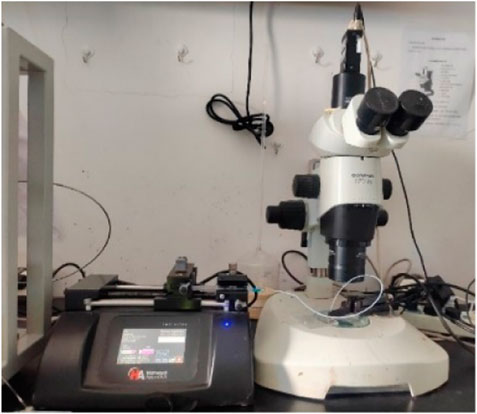
FIGURE 2. The microfluidic experimental setup.
2.2 Plugging process of foam in porous medium
As shown in Figure 3, the shape characteristics of foam in the fracture are related to the volume fraction of foam. When the volume fraction of foam is 30%, the proportion of gas in foam is small, and the generated foam is small in volume and thick in liquid film. The foam is distributed in the fracture channel in a spherical shape. With the increase of foam volume fraction, the proportion of gas in foam increases, the volume of foam becomes larger and the liquid film becomes thinner. When the volume fraction of foam is greater than 50%, the shape of foam in the fracture is irregular polygon, the liquid film of foam is thin, and the stability in the fracture is weak.
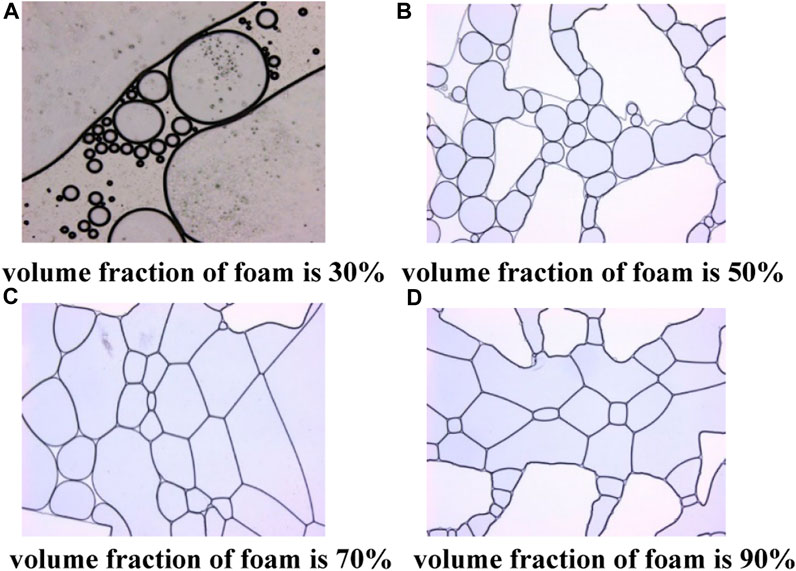
FIGURE 3. The morphology of foam with different volume fractions in fractures. (A) Volume fraction of foam is 30%. (B) Volume fraction of foam is 50%. (C) Volume fraction of foam is 70%. (D) Volume fraction of foam is 90%.
Foam accumulates and arranges in the fracture in the way of face to face contact, fills the fracture space, and forms sealing. Figures 4, 5, respectively show the morphology of foam in the fractures near and far from the injection end after gas injection for a period of time. The gas content at the injection end is high, so the generated foam has large volume, thin liquid film and weak stability. However, the gas content far away from the injection end is not high, so the foam produced is relatively stable. The sealing first occurs in the fracture at the entrance. As the gas injection rate increases, the sealing effect at the entrance deteriorates, and the sealing position moves forward along the fracture.
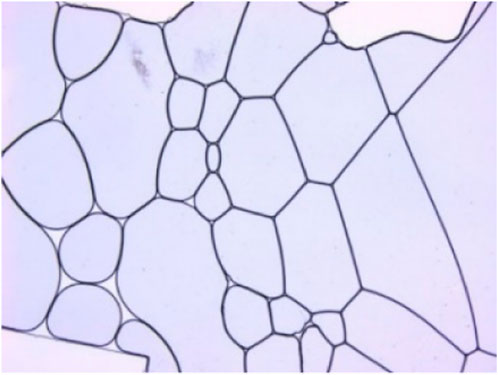
FIGURE 4. The morphology of foam in the fracture near the injection end.
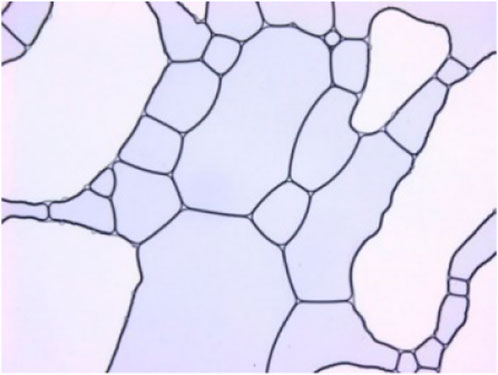
FIGURE 5. The morphology of foam in the fracture away from the injection end.
At the beginning of gas injection, foam is only generated in the fracture. With the increase of gas injection volume, the number and volume of foam in the fracture increase, forming a stable group structure. The subsequently injected gas is diverted by the plugging resistance of foam in the fracture to enter the matrix channel and combine with the foaming liquid to produce foam (as shown in Figure 6). When the gas injection volume is 0.5 mL, the amount of gas entering the matrix is less, and the amount of foam generated in the matrix is less (as shown in Figure 6A). When the gas injection volume is 1.0 mL, the number of foam in the matrix increases and is arranged continuously in the matrix (as shown in Figure 6B). When the gas injection volume is 1.5 and 2.0 mL, the volume of foam further increases, small foam gathers and forms large foam, and foam with stable structure also begins to appear in the matrix (as shown in Figures 6C, D). It can be concluded that in fracture matrix Porous medium, foam first blocks large channels such as fractures, and then enters into matrix channels under the influence of plugging resistance.
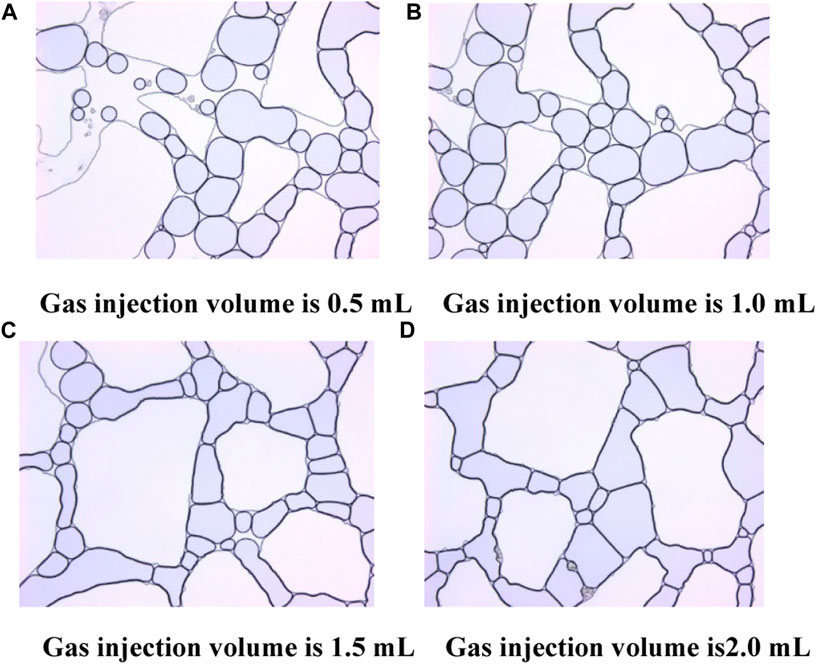
FIGURE 6. Effect of gas injection volume on foam distribution in matrix porous media. (A) Gas injection volume is 0.5 mL. (B) Gas injection volume is 1.0 mL. (C) Gas injection volume is 1.5 mL. (D) Gas injection volume is 2.0 mL.
3 Oil recovery mechanism of foam assisted gas injection in porous medium
3.1 Oil production experiment of foam assisted gas injection
The oil recovery mechanism of foam in Porous medium is studied by means of microscopic glass etching model (as shown in Figure 7). The experimental steps are as follows: 1. Inject dyed kerosene into the model until the model channel is filled with kerosene; 2. Inject 0.1 mL foam (0.5 times the pore volume) into the model; 3. Continuously inject N2 into the model at a rate of 0.05 mL/min until gas breakthrough occurs at the outlet of the other end of the model; 4. Use a microscope to observe the local oil recovery effect of the model.
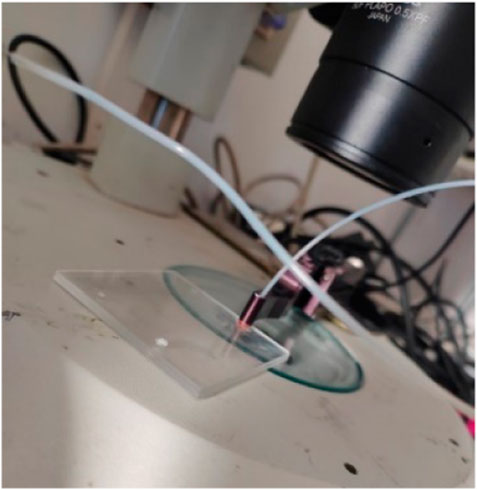
FIGURE 7. Glass etching model.
3.2 Oil production mechanism of foam assisted gas injection in fractures
When foam is injected initially, foam is dispersed in the fracture flow channel (as shown in Figure 8A), and moves in the fracture along the direction of driving force. The surfactant molecules on the foam liquid film used to maintain foam stability will transfer after contacting with oil, reducing the stability of foam liquid film, and foam is easy to burst. With the increase of foam injection amount, foam gradually accumulates in the fracture channel and accumulates in the fracture channel (as shown in Figure 8B). Since the diameter of a single foam is smaller than the fracture width, foam is not compressed by the wall, and several foam can be stacked in a “spherical” shape. Then gas is injected into the fracture. Under the impact of gas, the volume of foam in the fracture becomes larger, the distance between foam and each other becomes smaller, and the polygon is closely arranged. The contact area changes from point to surface, occupying the fracture space. The gas is blocked in the fracture by the resistance of foam, and is not easy to flow along the fracture. Under the effect of foam resistance, the gas can spread to the oil that is difficult to wave at the gap between foam and the fracture (as shown in Figure 8C), which increased gas sweep volume and oil recovery in fractures. Under the plugging resistance of foam, the fluidity of gas in the fracture decreases, and it is easy to enter the matrix with relatively small resistance for oil production (as shown in Figure 8D), which increases the swept volume and oil production of gas in the matrix. With the continuous injection of gas, the diameter of foam continues to increase to more than the width of the matrix channel. Driven by the injected gas, the foam is deformed by the wall extrusion and flows into the matrix (as shown in Figure 8E).
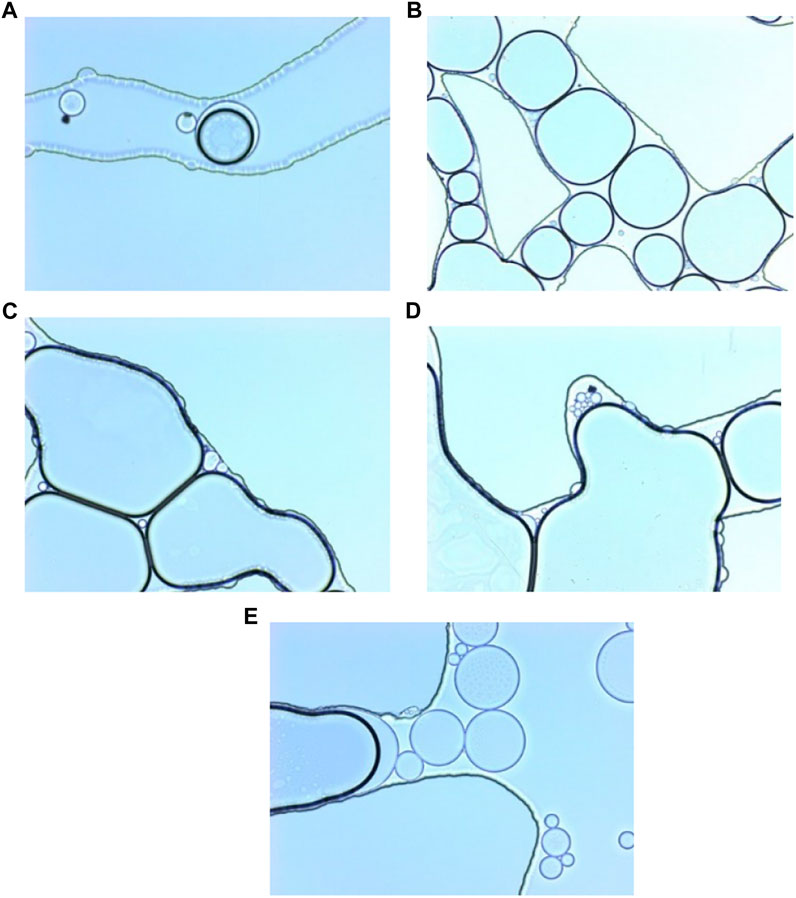
FIGURE 8. Oil recovery scene of foam-assisted gas injection in fractures.
3.3 Oil recovery mechanism of foam assisted gas injection in matrix
Foam is divided into two or more foam due to the influence of Porous medium wall when it enters the small channel of matrix from the large channel of fracture (as shown in Figure 9A). The separated small foam with small volume can enter the matrix channel (as shown in Figures 9B–D). Different from the distribution of foam in fractures, there is no accumulation space for foam in the matrix, and a single large volume of foam will be severely deformed by the wall extrusion, and closely contacted with the matrix channel to extract the oil in the matrix channel (as shown in Figures 9E–H). Some extremely small foam can also enter into smaller matrix space (as shown in Figures 9I–L). After entering the matrix, the gas will be subject to the resistance provided by the foam occupying the matrix space, and the fluidity in the matrix channel will be reduced. The flow along the foam gap and the gap between the foam and the wall will produce oil that cannot be affected, which will increase the swept volume and oil production of the gas in the matrix (as shown in Figures 9M–R).
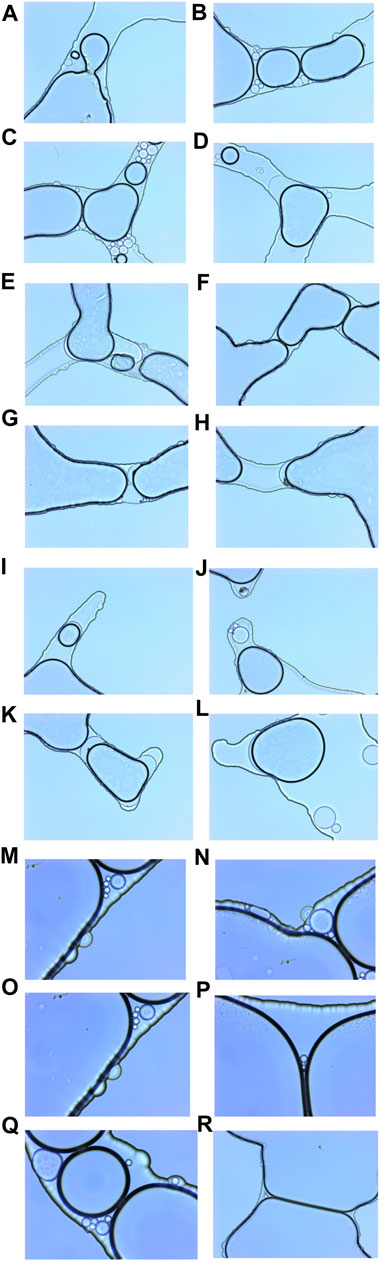
FIGURE 9. Oil recovery scenario of foam-assisted gas injection in matrix.
Therefore, the oil recovery mechanism of foam in the process of Porous medium gas injection is: 1) The foam accumulates in the fracture and blocks the fluidity. 2) The fluidity of gas along the fracture decreases under the blocking resistance of foam, and the swept volume in the fracture increases. 3) Some gas turns into the matrix under the influence of foam blocking resistance. 4) Some foam enters the matrix driven by the gas and plays an oil production role in the matrix, which increased flow resistance and swept volume of gas entering the matrix. This flow characteristic of foam enables it to seal fractures in the process of auxiliary gas injection production, prevent gas from flowing along the fracture channel, improve the injection performance of gas in the matrix, and increase the swept volume of gas in Porous medium.
4 Study on channeling prevention effect of foam in gas huff-n-puff injection of fractured shale core
4.1 Core test of foam assisted N2 huff-n-puff
As shown in Figure 10, nitrogen and 0.8wt% AOS surfactant solution are simultaneously injected into the six way valve at a volume ratio of 1:1, and foam is generated through the foam generation device (sand filling pipe). After each gas huff-n-puff experiment, we will rinse and dry the foaming device to prevent residual foaming agent solution from affecting the next experiment. Since the injection of foam will increase the weight of the core, the mass conservation method cannot be used to calculate the oil recovery in the N2 huff-n-puff experiment assisted by foam. Therefore, we will use nuclear magnetic resonance T2 spectrum to calculate the recovery rate during this process. The core data is shown in Table 1.
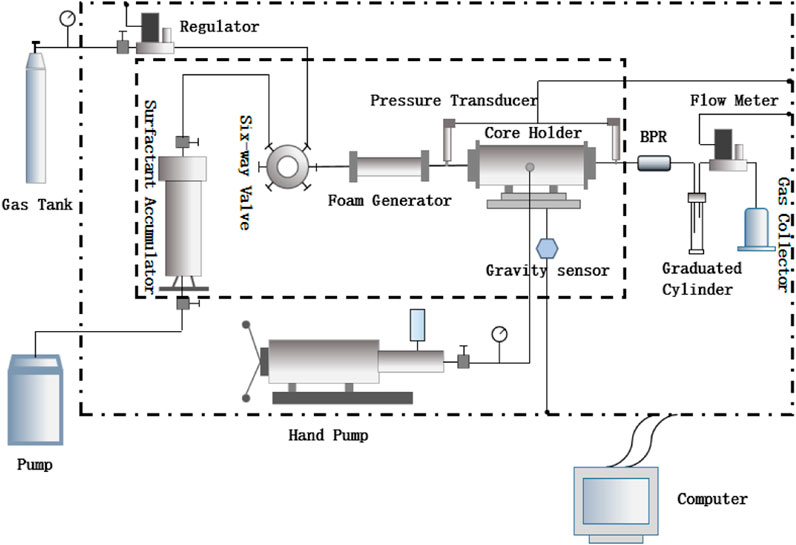
FIGURE 10. Experiment process of foam-assisted N2 huff-n-puff.
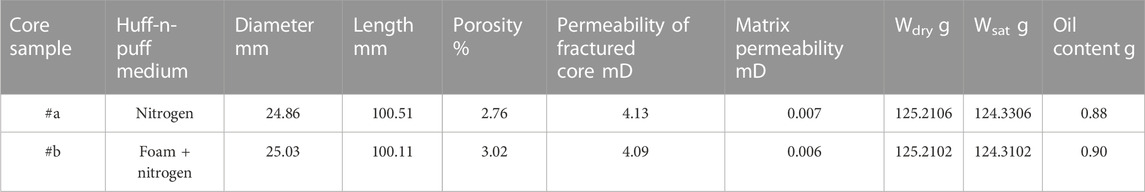
TABLE 1. The petrophysical properties of the samples.
4.2 Embodiment of channeling prevention effect of foam in micro pores
Figure 11 shows the nuclear magnetic resonance T2 spectrum curve of a cycle of N2 huff-n-puff experiments. The horizontal axis reflects the pore size of the core, while the vertical axis represents the amplitude of the nuclear magnetic signal. The black curve in the figure represents the initial oil distribution of the core, while the red curve represents the oil distribution of the core after a cycle of gas huff-n-puff. After a cycle of huff-n-puff, the amplitude signal of the nuclear magnetic resonance T2 spectrum curve will change, which is caused by the flow of oil in various pores. N2 huff-n-puff and foam assisted N2 huff-n-puff experiments were conducted under similar initial oil bearing conditions of cores, and the amplitude signal distribution of NMR T2 spectrum was also similar, so the influence of the two experimental methods on oil distribution in pores can be compared.
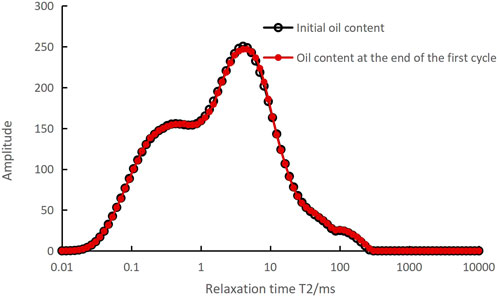
FIGURE 11. T2 spectra for fractured shale cores with 1 cycle of N2 huff-n-puff.
From Figure 11, it can be seen that there is no significant change in the nuclear magnetic resonance amplitude signal in the core before and after a cycle of N2 huff-n-puff. Figure 12 shows the change of NMR amplitude signal in core before and after a cycle of N2 huff-n-puff assisted by foam. The relaxation time can be divided into three parts based on the increase or decrease of the nuclear magnetic resonance amplitude signal. When the relaxation time is 0.01–0.65 ms or greater than 3.05 ms, the corresponding nuclear magnetic resonance amplitude signal decreases to varying degrees. When the relaxation time is 0.65–3.05 ms, the corresponding nuclear magnetic resonance amplitude signal increases.
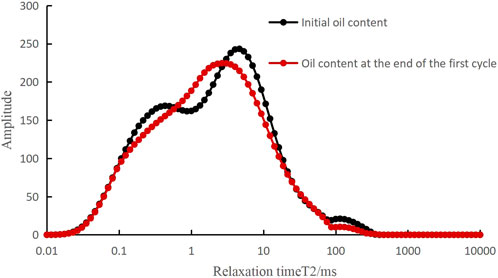
FIGURE 12. T2 spectra for fractured shale cores with 1 cycle of foam-assisted N2 huff-n-puff.
In order to further observe the anti channeling effect of foam in gas huff-n-puff injection process, we monitored the nuclear magnetic resonance T2 spectrum of three cycles of gas huff-n-puff. Figure 13 shows that after three cycles of N2 huff-n-puff experiments, there was no significant change in the nuclear magnetic resonance amplitude signal of the core. It can be seen from Figure 14 that after three cycles of foam assisted N2 huff-n-puff experiments, the relaxation time between 0.01 and 0.1 ms, the NMR amplitude signal quantity decreases slightly. When the relaxation time is greater than 0.1 ms, the amplitude signal quantity of nuclear magnetic resonance significantly decreases.
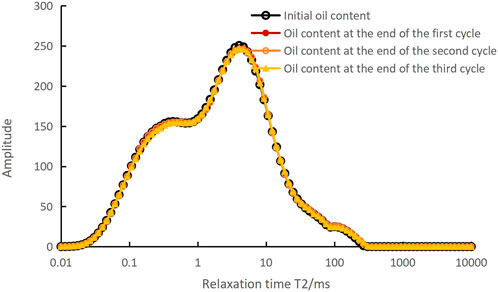
FIGURE 13. NMR T2 spectra of three cycles of N2 huff-n-puff.
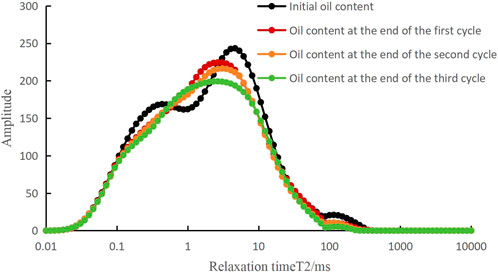
FIGURE 14. NMR T2 spectrum of three cycles of foam-assisted N2 huff-n-puff.
Some scholars classify shale pores into micropores (<2 nm), mesopores (2–50 nm), and macropores (>50 nm) based on their pore size (Louks et al., 2012; Hinal et al., 2014; Liu et al., 2018; Zhang et al., 2018). According to the nuclear magnetic resonance T2 spectrum, shale pore radius distribution, and pore classification standards, the pores of shale cores in the experiment were divided into three types: micropores (T2 < 0.1 ms), mesopores (0.1 ms < T2 < 2.5 ms), and macropores (T2 > 2.5 ms) (Freedman, 2006; XIONG and SHENG, 2021; XIONG et al., 2022).
We analyze the effect of channeling prevention of foam on the production of oil in various pores of core from the perspective of microscopic pore oil content. Comparing Figures 11, 12, it can be visually observed the changes in oil content in various pores. Figures 13, 14 show the strong oil production performance caused by the channeling prevention of foam. This reveals the oil recovery mechanism of foam in huff-n-puff gas injection from the perspective of micro pores, that is, it increases the swept volume of gas in micro pores, middle pores and large pores, and improves the oil recovery as a whole (Diwu et al., 2018; Zhu et al., 2018; Feng et al., 2020; Yang et al., 2021).
In the T2 spectrum curve of nuclear magnetic resonance, the area enclosed by nuclear magnetic amplitude and relaxation time is related to the oil content of the core. The calculation formula for recovery rate is as follows.
Where,
According to Formula 1, the oil saturation of various pores in the core before and after a cycle of foam assisted N2 huff-n-puff and N2 huff-n-puff is calculated, and the results are shown in Table 2. In a cycle of N2 huff-n-puff experiments, the oil saturation of micropores and mesopores showed almost no change compared to the initial oil saturation, while the oil saturation of macropores only decreased by 0.0007. However, in a cycle of foam assisted N2 huff-n-puff experiment, the oil saturation in macropores decreased by 0.0233, while that in micropores and mesopores decreased by 0.0018 and 0.0199, respectively.
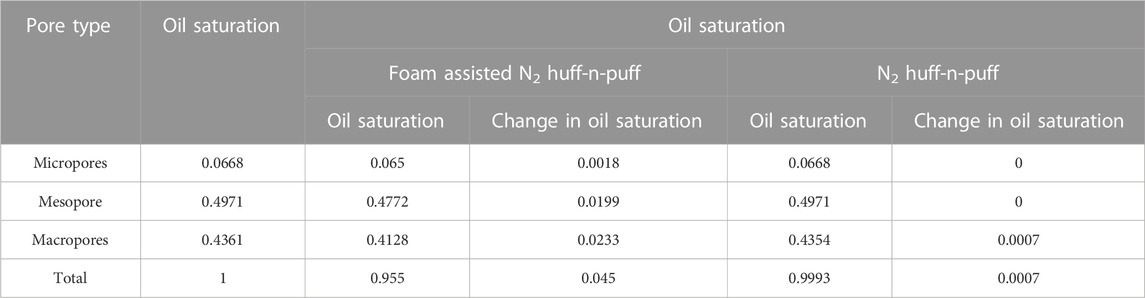
TABLE 2. Oil saturation in different pores by one cycle huff-n-puff.
In order to further reveal what kind of pore oil is mainly produced by the anti channeling effect of foam, we conducted five rounds of nuclear magnetic resonance monitoring experiments of foam assisted N2 huff-n-puff. The changes in oil saturation of various pores in the core are shown in Figure 15, and the cumulative recovery rate of various pores is calculated in Table 3. In the first and second cycles of these experiments, oil was extracted from the micropores. The cumulative recovery rate of mesopores and macropores has been continuously increasing in five cycles of gas huff-n-puff experiments. Therefore, the application of foam in huff-n-puff gas injection can use oil in all types of pores. As the number of cycles increases, oil in mesopores and macropores is continuously extracted, while oil in micropores is only extracted in the first two cycles. The recovery rate of the core during the entire process is mainly contributed by mesopores and macropores.
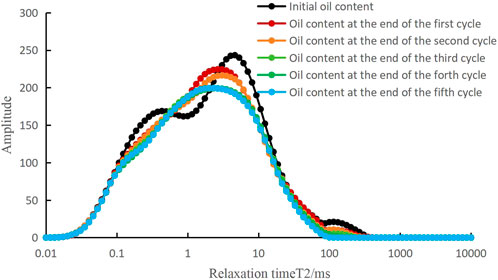
FIGURE 15. T2 spectra for fractured shale cores with 5 cycles of foamassisted N2 huff-n-puff.
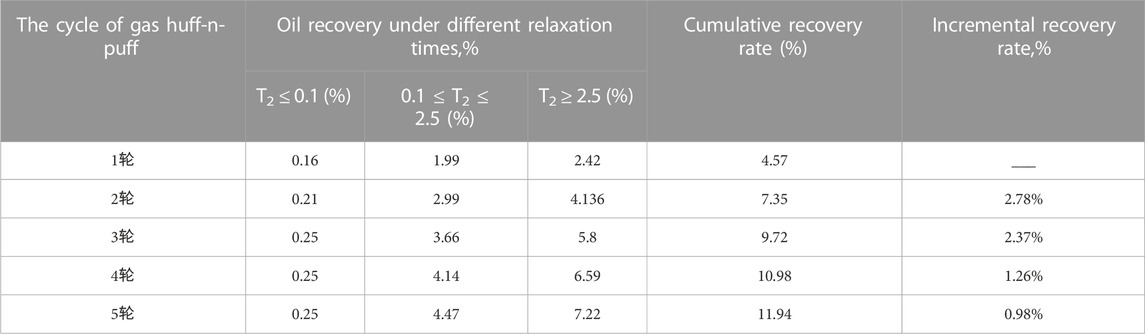
TABLE 3. NMR cumulative oil recovery for different pore intervals at different stages.
5 Conclusion
(1) With the help of Microfluidics experiments, it is clear that the generation mode of foam in Porous medium is liquid membrane hysteresis and liquid membrane separation. The plugging position of foam in Porous medium moves forward along the fractures. It will first plug large channels such as fractures, and then enter the matrix channel to play a role under the influence of plugging resistance.
(2) The oil recovery mechanism of foam assisted gas injection in Porous medium is to seal fractures, reduce the flow of gas along fracture channels, and improve the sweep efficiency and oil displacement efficiency of gas in Porous medium. It is reasonable to evaluate the channeling prevention effect of foam in gas huff-n-puff injection of fractured shale core with recovery factor as an indicator. The higher the core recovery factor is, the better the channeling prevention effect of foam is.
(3) It is feasible to use nuclear magnetic resonance method to calculate the recovery rate of gas huff-n-puff in fractured shale cores. Comparing the oil saturation of various pores in the core under two different huff-n-puff modes, it can be concluded that after a cycle of N2 huff-n-puff experiments, the oil saturation of macropores in the core decreased by 0.07%, while the oil saturation of mesopores and micropores did not decrease. However, after a cycle of foam assisted N2 huff-n-puff experiment, the oil saturation of macropores in the core decreased by 2.33%, and that of micropores and mesopores decreased by 0.18% and 1.99%, respectively. This shows that the channeling prevention effect of foam in huff-n-puff gas injection is significant from the perspective of oil content in micropores.
Data availability statement
The original contributions presented in the study are included in the article/supplementary material, further inquiries can be directed to the corresponding author.
Author contributions
XX: Writing–original draft, Writing–review and editing.
Funding
The authors declare financial support was received for the research, authorship, and/or publication of this article. This work was financially supported by a joint fund project from Sinopec, named “The mechanism of fracture formation and effective exploitation of shale oil and gas reservoirs with lacustrine and multi lithofacies combinations (U23B6004).
Conflict of interest
Author XX, WH, LF, and ZT were employed by SINOPEC Petroleum Exploration and Production Research Institute.
The authors declare that this study received funding from a joint fund project from Sinopec, named “The mechanism of fracture formation and effective exploitation of shale oil and gas reservoirs with lacustrine and multi lithofacies combinations (U23B6004)”. The funder played a role in the study analysis, decision to publish, and preparation of the manuscript.
Publisher’s note
All claims expressed in this article are solely those of the authors and do not necessarily represent those of their affiliated organizations, or those of the publisher, the editors and the reviewers. Any product that may be evaluated in this article, or claim that may be made by its manufacturer, is not guaranteed or endorsed by the publisher.
References
Bernard, G. G., and Jacobs, W. L. (1965). Effect of foam on trapped gas saturation and on permeability of porous media to water. SPE J. 5 (04), 295–300. doi:10.2118/1204-pa
Casteel, J. F., and Djabbarah, N. F. (1988). Sweep improvement in CO2 flooding by use of foaming agents. SPE Reserv. Eng. 3 (4), 1186–1192. doi:10.2118/14392-pa
Dellinger, S. E., Patton, J. T., and Holbrook, S. T. (1984). CO2 mobility control. SPE J. 24 (2), 191–196. doi:10.2118/9808-pa
Diwu, P., Liu, T., You, Z., Jiang, B., and Zhou, J. (2018). Effect of low velocity non-Darcy flow on pressure response in shale and tight oil reservoirs. Fuel 216, 398–406. doi:10.1016/j.fuel.2017.11.041
Du, J., He, H., Yang, T., et al. (2014). Progress and challenges in tight oil exploration in China. China Pet. Explor. 19 (1), 1–9.
Feng, G., Zhu, Y., Chen, S., Wang, Y., Ju, W., Hu, Y., et al. (2020). Supercritical methane adsorption on shale over wide pressure and temperature ranges: implications for gas-in-place estimation. Energy & Fuels 34, 3121–3134. doi:10.1021/acs.energyfuels.9b04498
Freedman, R. (2006). Advances in NMR logging. J. Petrol Technol. 58 (1), 60–66. doi:10.2118/89177-ms
Gamadi, T. D. (2014). Experimental and numerical study of the EOR potential in shale oil reservoirs by cyclic gas injection. PhD dissertation. Lubbock, Texas, USA: Texas Tech University.
Hao, H., Hou, J., Zhao, F., Huang, H., and Liu, H. (2020). N2-foam-assisted CO2 huff-n-puff process for enhanced oil recovery in a heterogeneous edge-water reservoir: experiments and pilot tests. RSC Adv., 11. doi:10.1039/D0RA09448J
Heller, J. P., Lien, C. L., and Kuntamukkuula, M. S. (1985). Foamlike dispersions for mobility control in CO2 floods. SPE J. 25 (4), 603–613. doi:10.2118/11233-pa
Hinal, A. A., Rezaee, R., Esteban, L., and Labani, M. (2014). Comparisons of pore size distribution: a case from the western Australian gas shale formations. Unconv. Oil Gas. Res. 8, 1–13. doi:10.1016/j.juogr.2014.06.002
Jia, C., Zou, C., Li, J., Li, D., and Zheng, M. (2012). Evaluation criteria, main types, basic characteristics and resource prospects of tight oil in China. Acta Pet. Sin. 33 (3), 343–350. doi:10.1016/S2096-2495(17)30026-1
Li, L., Wang, C. W., Li, D. S., Fu, J., Su, Y., and Lv, Y. (2019a). Experimental investigation of shale oil recovery from Qian Jiang core samples by the CO2 huff-n-puff EOR method. RSC Adv. 9 (49), 28857–28869. doi:10.1039/c9ra05347f
Li, L., Zhang, Y., and Sheng, J. J. (2017). Effect of the injection pressure on enhancing oil recovery in shale cores during the CO2 huff-n-puff process when it is above and below the minimum miscibility pressure. Energy & Fuels 31 (4), 3856–3867. doi:10.1021/acs.energyfuels.7b00031
Li, S., Qiao, C., Ji, G., Wang, Q., and Tao, L. (2019b). Experimental study of profile control with foam stabilized by clay particle and surfactant. Energies 12 (5), 781. doi:10.3390/en12050781
Liu, Y., Yao, D., Liu, S., et al. (2018). Enhancing gas recovery in tight dolomite reservoirs: a study of water-lock damage and chemical drainage. Mar. Pet. Geol. 96, 591.
Louks, R. G., Reed, R. M., Ruppel, S. C., M, D., and Jarvie, D. M. (2012). Morphology, genesis, and distribution of nanometer-scale pores in siliceous mudstones of the mississippian barnett shale. J. Sediment. Res. 96, 1071. doi:10.2110/jsr.2009.092
Mahzari, P., Mitchell, T. M., Jones, A. P., Oelkers, E. H., Striolo, A., Iacoviello, F., et al. (2020). Novel laboratory investigation of huff-n-puff gas injection for shale oils under realistic reservoir conditions. Fuel 285, 118950. doi:10.1016/j.fuel.2020.118950
Ning, Y., Zhong, M., Yi, W., et al. (2017). Development status and countermeasures of tight oil resources under low oil prices. China Min. Mag. 26 (4), 35–40.
Qi, S., Zhang, Y., Wu, Y., et al. (2018). Exploration potential evaluation of lacustrine carbonate rocks in southwest Qaidam Basin. Fault-Block Oil Gas Field 25 (6), 715–720.
Qiu, Z., Li, J., Wu, X., et al. (2015). Current situation, main geological characteristics and differences of tight oil exploration at home and abroad. Lithol. Reserv. 27 (4), 119–126.
Qu, J., Wupuer, A., Ming, C., et al. (2017). Formation conditions and distribution of tight oil in lucaogou Formation, jimsar sag, junggar basin. Geoscience 31 (1), 119–128.
Rao, Y., Yang, H., and Guo, Z. (2018). Distribution and exploration direction of subsalt oil and gas in South Gabon subbasin. Fault-Block Oil Gas Field 25 (4), 440–445.
Sheng, J. J. (2015). Enhanced oil recovery in shale reservoirs by gas injection. Nat. Gas. Sci. Eng. 22, 252–259. (invited review). doi:10.1016/j.jngse.2014.12.002
Soliman, M. Y., East, L., and Augustine, J. (2010). “Fracturing design aimed at enhancing fracture complexity,” in Paper SPE 130043 Presented at the SPE EUROPEC/EAGE Annual Conference and Exhibition, Barcelona, Spain, June, 2010.
Srivastava, M., and Nguyen, Q. P. (2010). Application of gas for mobility control in chemical EOR in problematic carbonate reservoirs. Richardson, Texas, USA: Onepetro.
Szlendak, S. M., Nguyen, N. M., and Nguyen, Q. P. (2013). Laboratory investigation of low-tension-gas flooding for improved oil recovery in tight formations. SPE J. 18 (5), 851–866. doi:10.2118/159841-pa
Szlendak, S. M., Nguyen, N. M., and Nguyen, Q. P. (2016). Investigation of localized displacement phenomenon for low–tension–gas (LTG) injection in tight formations. J. Petrol Sci. Eng. 142, 36–45. doi:10.1016/j.petrol.2016.01.042
Wan, T., Sheng, J. J., and Soliman, M. Y. (2013). “Evaluation of the EOR potential in shale oil reservoirs by cyclic gas injection,” in Paper SPWLA-D-12-00119 Presented at the SPWLA 54th Annual Logging Symposium Held in New Orleans, Louisiana, June, 2013, 22–26.
Xiong, X., and Sheng, J. (2021).An optimized experimental investigation of foam-assisted N2 huff-n-puff enhanced oil recovery in fractured shale cores Richardson, Texas, USA: Onepetro.
Xiong, X., Sheng, J., Wu, X., and Qin, J. (2022). Experimental investigation of foam-assisted N2 huff-n-puff enhanced oil recovery in fractured shale cores. Fuel (311), 20–29. doi:10.1016/j.fuel.2021.122597
Yang, Y., Cheng, T., You, Z., Liang, T., and Hou, J. (2021). Profile control using fly ash three-phase foam assisted by microspheres with an adhesive coating. Appl. Sci. 11, 3616. doi:10.3390/app11083616
Yang, Z., Hou, L., Lin, S., et al. (2018). Geological characteristics and exploration potential of tight oil and shale oil in Lucaogou Formation. China Pet. Explor. 23 (4), 76–85.
Yu, Y., and Sheng, J. J. (2016). A comparative experimental study of IOR potential in fractured shale reservoirs by cyclic water and nitrogen gas injection. J. Petrol Sci. Eng. 149, 844–850. doi:10.1016/j.petrol.2016.11.034
Zhang, P., Lu, S., Li, J., et al. (2018). Quantitative characterization of gas hydrate bearing sediment using elastic-electrical rock physics models. Mar. Petrol Geol. 89, 775.
Keywords: gas huff-n-puff, foam, gas channeling, shale reservoir, oil recovery
Citation: Xiaofei X, Haibo W, Fengxia L and Tong Z (2024) Experimental study on the effect of foam in preventing gas channeling in shale reservoir. Front. Earth Sci. 11:1265991. doi: 10.3389/feart.2023.1265991
Received: 24 July 2023; Accepted: 30 November 2023;
Published: 16 January 2024.
Edited by:
Mehdi Ostadhassan, Northeast Petroleum University, ChinaReviewed by:
Zhenjiang You, Edith Cowan University, AustraliaBo Bao, East China University of Science and Technology, China
Copyright © 2024 Xiaofei, Haibo, Fengxia and Tong. This is an open-access article distributed under the terms of the Creative Commons Attribution License (CC BY). The use, distribution or reproduction in other forums is permitted, provided the original author(s) and the copyright owner(s) are credited and that the original publication in this journal is cited, in accordance with accepted academic practice. No use, distribution or reproduction is permitted which does not comply with these terms.
*Correspondence: Xiong Xiaofei, bGluZGF4aW9uZzAzMTVAMTYzLmNvbQ==