 Xiaodie Liu
 Zhixi Liu
- School of Architectural Engineering, Tongling University, Tongling, Anhui, China
To investigate the influence of the length-to-diameter (L/D) ratio and strain rate on the evolution of strain energy of sandstone under uniaxial compression, experimental tests were conducted using the RMT-150B rock mechanics test system. Specifically, uniaxial compression experiments (UCE), uniaxial loading-unloading experiment(ULUE) and uniaxial cyclic loading-unloading experiments (UCLUE) were performed. The results show that: 1) Based on an investigation of the Kaiser effect in UCLUE, it is postulated that a small degree of loading-unloading has negligible impact on the storage of strain energy in rock masses. The hypothesis regarding the limited influence of loading-unloading on the elastic strain energy storage of rocks is confirmed through a comparative analysis between the elastic strain energy storage in UCLUE and ULUE. 2) By analyzing the ESED and ISED of sandstone under different L/D ratios and strain rates, it is found that it follows the linear energy storage law. The evolution of elastic strain energy is not affected by strain rate. Therefore, the UCLUE at any strain rate can analyze the elastic strain energy of uniaxial compression experiment with the same size at any strain rate, and provide a new method for strain energy analysis at different length-diameter ratios and strain rates. 3) When the stress of sandstone samples of equal size is equal, the smaller the strain rate, the longer the loading experiment of sandstone, the more time the friction development and interconnection of cracks in sandstone are, and the more dissipated strain energy and input strain energy are generated. 4) Smaller L/D ratios are associated with larger ESED and DSED values in sandstone. As the stress intensifies, the ESED and DSED of certain sandstones with larger L/D ratios experience a sharp increase when approaching the failure stress. Under equal stress levels, it is possible for sandstones with larger L/D ratios to exhibit higher ESED and DSED values compared to those with smaller L/D ratios.
1 Introduction
The concept of the “size effect” in rock mechanics is the phenomenon where the strength of a rock specimen decreases as its size increases. Additionally, the strength of the rock increases with higher strain rates. In engineering design, rock mass is affected by size effect and strain rate, which brings difficulties to its failure prediction (Hashiba et al., 2019; Li et al., 2021). In traditional elastic-plastic mechanics analysis, the curve of stress-strain is usually used to describe the mechanical response of rock deformation and failure process, and thus constitutive equation and strength theory describing rock are established (Haupt, 1991; Nawrocki et al., 1999; Hajiabdolmajid et al., 2002; Liu and Dai, 2018; Dong et al., 2021; Richards et al., 2022; Sun et al., 2023). However, the dispersion of rock strength and the diversity of stress-strain relationship bring difficulties to engineering design analysis and prediction. According to principles of thermodynamics, the fundamental characteristic of rock deformation is the conversion of strain energy, and it failure is the instability phenomenon driven by energy (Xie et al., 2005a; Xie et al., 2008). Consequently, conducting an energy evolution analysis of the rock failure process from a thermodynamic perspective, considering diverse strain rates and sizes, has the potential to effectively reflect the nature of rock failure.
The investigation of rock failure through the lens of thermodynamics has emerged as a prominent area of interest in the realm of rock mechanics, and noteworthy advancements have been achieved (Xie et al., 2005b; Li et al., 2020). Xie et al. (2005a), Xie et al. (2005b), Xie et al. (2008) examined the impact of strain energy evolution law of rocks, providing a comprehensive analysis of the intricate connection between strain energy dissipation and damage. Zhao et al. (2020) analyzed the strain energy evolution law of marble under true triaxial experiment, and further discussed the influence of strain rate on rock damage. In the above studies on rock energy evolution, the ESED is mainly obtained by energy calculation formula, which assumes that rock unloading curve is a straight line. However, the study reveals that the unloading curve of the rock does not exhibit a linear trajectory, but instead exhibits distinct nonlinear characteristics (Yoshinaka et al., 1998; Manoj and Petroš, 2009; Xiao et al., 2010; Ma et al., 2013; Zhang et al., 2013; Song et al., 2016; Zhou et al., 2018; Xie et al., 2023). As a result, the accuracy of energy calculations using the formula is questionable. Based on the principles of thermodynamics, scholars have obtained unloading curves for rocks by conducting loading-unloading experiments. These curves represent the behavior of rocks during the unloading process. Hence, certain researchers have investigated the loading-unloading experiments of rocks through the thermodynamic perspective. The area bounded by the unloading curves and the horizontal axis signifies the buildup of elastic strain energy within the rock (Qingbin et al., 2015). Meng et al. (2018) conducted a comprehensive analysis on the strain energy during the loading-unloading process of red sandstone. Their investigation utilized the UCLUE to explore the patterns and mechanisms of energy transfer within the red sandstone. In a related study, Liu and Dai (2021) examined the impact of particle diameter on the elastic strain energy and dissipated strain energy of coal mine gravel through loading-unloading experiments. Their findings indicated that the particle diameter played a significant role in the storage and dissipation of energy within the gravel samples. Notably, samples with larger particles exhibited a greater capacity for storing elastic strain energy compared to samples with smaller particles. With the progression of research, scholars have been investigating the energy evolution of uniaxial single loading-unloading experiments on rocks. Gong et al. (2018), Gong et al. (2019a), Gong et al. (2019b) conducted a comprehensive analysis on the strain energy evolution of rock deformation and failure using uniaxial single loading-unloading experiments. Their findings revealed a linear relationship between the ESED and the ISED, indicating a linear energy storage law. Additionally, they enhanced the calculation formula of the peak energy impact index based on this linear energy storage law. Furthermore, they established a rock burst tendency criterion by incorporating the residual ESED index (the difference between pre-peak ESED and post-peak failure strain energy density). This criterion significantly enriched the understanding of rock energy evolution.
Until now, the majority of studies on the size effect and strain rate of rocks have primarily focused on their strength and mechanical properties. Huang et al. (2014) investigated the uniaxial compression of marble with varying sizes and suggested that the uniaxial compressive strength of rocks exhibits a size effect that correlates with the L/D ratio. Yang et al. (2005), through experimental and theoretical studies of rock materials, proposed that the size effect in rocks is primarily influenced by the friction effect at the rock ends, rather than the heterogeneity of their internal structure. They further developed a theoretical model for the size effect in marble. Zhu et al. (2019) conducted triaxial compression experiments on siltstone to investigate the size effect and analyze the correlation between rock strength and deformation under varying confining pressures. According to their findings, the measured values of rock strength, Poisson’s ratio, and Young’s modulus reach a stable state when the confining pressure is equal and the L/D ratio exceeds 2.2. Nevertheless, the analysis of rock strain energy under various L/D ratios and strain rates remains relatively scarce in the existing research literature. Some studies on L/D ratio and strain rate still assume that the unloading curve follows a linear pattern. The research conducted on CLU experiments provides clear evidence that the unloading curve of rocks exhibits nonlinearity. Therefore, utilizing this assumption to analyze the energy evolution of rock masses may not accurately reflect the energy evolution of rock failure and deformation.
This study employed a comprehensive experimental approach, encompassing UCE, UCLUE, and ULUE. The experiments involved the use of sandstone specimens with varying L/D ratios. Firstly, based on the Kaiser effect of UCLUE, it is assumed that a small amount of loading-unloading will not affect the strain energy storage of rock mass. Then the ESED was compared between the uniaxial single loading-unloading experiment and the UCLUE to verify the correctness of the hypothesis. Finally, the UCLUE is adopted to evaluate the strain energy of rock under UCE. The evolution of elastic strain energy and dissipative strain energy along with axial stress is obtained by calculating the energy analysis method proposed in this paper. The research results have positive significance for rock failure mechanism and dynamic disaster mechanism.
2 Rock specimen size and experiment scheme
This paper uses sandstones from Luling coal Mine in Anhui Province, China. The sampling depth of the sandstone used in the experiment is 850 ∼ 860 m, the rock geology is uniform, and there is no obvious joint. The wave velocity of the sample was measured with MC-6310 non-metallic ultrasonic detector to remove the large discrete test block, and the wave velocity of the test block was between 2.4 and 2.5 km/s. Figures 1A illustrates the rock specimens and test equipment.
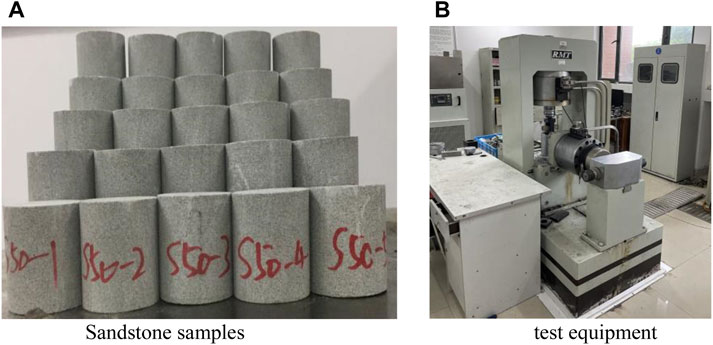
FIGURE 1. Rock specimens and test equipment. (A) Sandstone samples, (B) test equipment.
UCE scheme with different L/D ratio: UCEs were carried out on sandstone samples with diameter of 50 mm and length of 50 mm, 75 mm, 100 mm, 125 mm and 150 mm with strain rate of 5.0 × 10⁻⁴s−1.
UCE scheme with different strain rates: UCEs were carried out on sandstone samples with diameter of 50 mm and length of 100 mm with strain rates of 1.0×10⁻⁵s-1, 5.0×10⁻⁵s-1, 1.0×10⁻⁴s-1, 5.0×10⁻⁴s-1 and 1.0×10⁻³s-1.
UCLUE scheme with different L/D ratio: UCLUEs were carried out on sandstone samples with diameter of 50 mm and length of 50 mm, 75 mm, 100 mm, 125 mm and 150 mm with strain rate of 5.0×10⁻⁴s-1. The loading stress path is: 0→10 kN→0→20 kN→0→30 kN→0→40 kN→0→50 kN. Until the sample is compressed to failure, the peak load difference between the adjacent cycles is 10 kN.
UCLUE scheme with different strain rates: UCLUEs were carried out on sandstone samples with a diameter of 50 mm and a length of 100 mm using strain rates of 1.0×10⁻⁵s-1, 5.0×10⁻⁵s-1, 1.0×10⁻⁴s-1, 5.0×10⁻⁴s-1 and 1.0×10⁻³s-1. The loading stress path is: 0→10 kN→0→20 kN→0→30 kN→0→40 kN→0→50 kN. Until the sample is compressed to failure, the peak load difference between the adjacent cycles is 10 kN.
ULUE scheme with different L/D ratio: ULUEs were carried out on sandstone samples with diameter of 50 mm and length of 50 mm, 75 mm, 100 mm, 125 mm and 150 mm at a strain rate of 5.0 × 10⁻⁴s-1. The peak stress of ULUE is equal to the each cyclic load of uniaxial cyclic loading-unloading with different length-to-diameter ratio.
ULUE scheme with different strain rates: ULUEs were carried out on sandstone samples with diameter of 50 mm and length of 100 mm at the strain rates of 1.0 × 10⁻⁵s-1, 5.0 × 10⁻⁵s-1, 1.0 × 10⁻⁴s-1, 5.0 × 10⁻⁴s-1 and 1.0 × 10⁻³s-1. The peak stress of ULUE is equal to the each cyclic load of uniaxial cyclic loading-unloading with same strain rates.
The stress path diagram of UCLUE and the stress path diagram of UCLUE are shown in Figure 2.

FIGURE 2. Stress path diagrams. (A) The stress path diagram of UCLUE, (B) The stress path diagram of uniaxial single loading-unloading experiment.
Figure 3A illustrates the UCE curves of sandstone with L/D ratios of 1.0, 1.5, 2.0, 2.5, and 3.0, respectively. The specific size of the samples is: the diameter is 50mm, the length is 50 mm, 75 mm, 100 mm, 125 mm and 150 mm respectively. The strain rates for all experiments were set at 5 × 10⁻⁴s-1, and the corresponding uniaxial compressive strengths were measured as 56.1 MPa, 44.9 MPa, 39.3 MPa, 35.2 MPa, and 33.6 MPa, respectively. It is evident from Figure 3A that there exists an inverse relationship between the L/D ratio of the sandstone samples and their uniaxial compressive strengths.
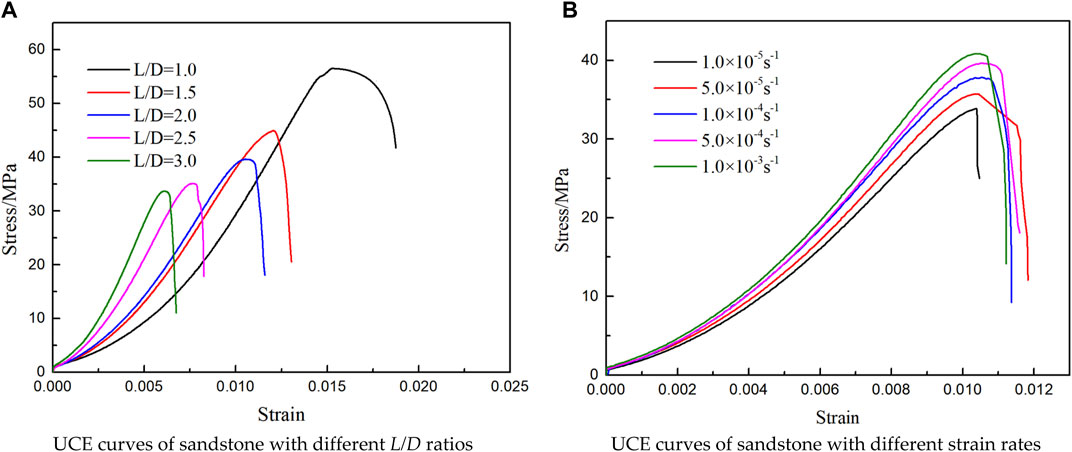
FIGURE 3. UCE curves of sandstone with different L/D ratios and different strain rates. (A) UCE curves of sandstone with different L/D ratios, (B) UCE curves of sandstone with different strain rates.
To investigate the inpact of strain rates on rock, we conducted UCEs on sandstone specimens with varying the strain rates. The strain rates used in the experiment were 1 × 10⁻⁵s-1, 5 × 10⁻⁵s-1, 1 × 10⁻⁴s-1, 5 × 10⁻⁴s-1, and 1 × 10⁻³s-1, respectively. Figure 3B presents the UCE curves of sandstone at varying strain rates. As the strain rate increases, the strength of the sandstone also increases.
3 Energy calculation and hypothesis
To investigate the failure process of rock from a thermodynamic perspective, it is essential to determine the object of study, which involves selecting a thermodynamic system. In this paper, the focus is on rocks subjected to specific external loads, which serve as the research system. The experimental machine housing the rocks is considered the environment (Xie et al., 2005b).
3.1 The calculation method of rock energy
Based on the thermodynamic principles, elastic strain energy is characterized as reversible, while dissipated strain energy is regarded as unidirectional and irreversible. In the context of UCE conducted without heat exchange between the rock specimen and its surrounding environment, the relationship between these energy components can be expressed as follows (Zhang et al., 2023):
The variable “u” represents the ISED generated by the external load applied to the rock specimen. “ud” represents the DSED, which refers to the energy consumed in the process of rock deformation and failure. On the other hand, “ue” represents the ESED stored within the rock. Energy density, in this context, refers to the amount of energy per unit volume of the rock. Energy distribution diagram of rock is shown in Figure 4.
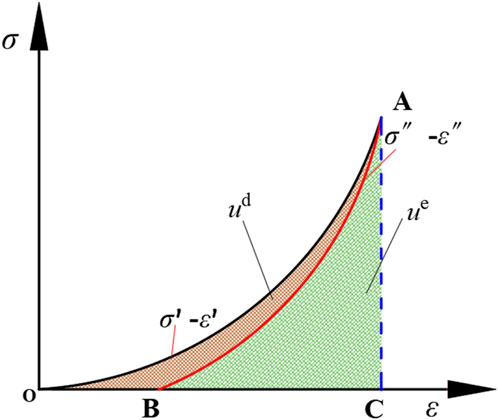
FIGURE 4. Energy distribution diagram of rock.
The specific calculation formula for the strain energy distribution in the rock can be expressed as follows:
Where: ε is strain,
3.2 The hypothesis of energy analysis
The Kaiser effect, which is the phenomenon of acoustic emission occurring during the ductile deformation of materials, serves as the foundation for AE inspection. Numerous studies have revealed that in CLU experiments, compared to the initial loading and unloading cycles, subsequent CLU cycles exhibit lower ringing counts and weaker AE signals (Ge et al., 2022). This suggests that the rock mass sustains less damage from a small amount of CLU. Consequently, it can be inferred that the influence of a small amount of CLU on the accumulated ESED of the rock mass is minimal and can be neglected. Based on this hypothesis, when the stress, size and strain rate are equal, the ESED at each unloading point of UCLUE is equal to the ESED of UCE. As shown in Figure 5, the ESED at point A of the UCE is the area surrounded by point ACB. The ESED at point D1 of UCE is the area surrounded by point DFE. The ESED of G1 point in UCE is the area surrounded by GIH point.
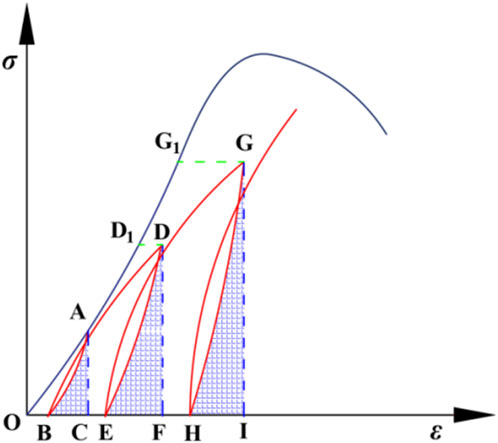
FIGURE 5. Energy diagram of UCE and UCLUE.
4 Energy analysis method under uniaxial compression experiment
4.1 Stress-strain curve of UCLUE
Based on the above energy calculation method and hypothesis, a UCLUE is designed. UCLUE adopts the loading and unloading method of increasing load, taking 10 kN as a cycle, that is, loading in sequence as 0→10→0→20→0→30 kN, until the rock specimen is damaged.
Figure 6 shows the curves comparison between UCE and UCLUE with varying L/D ratios. As the cycle number in the UCLUE increases, there is a gradual deviation between the UCE curve of rock and the unloading points of the UCLUE curve. The maximum deviation occurs when the peak strength of the UCE is reached.
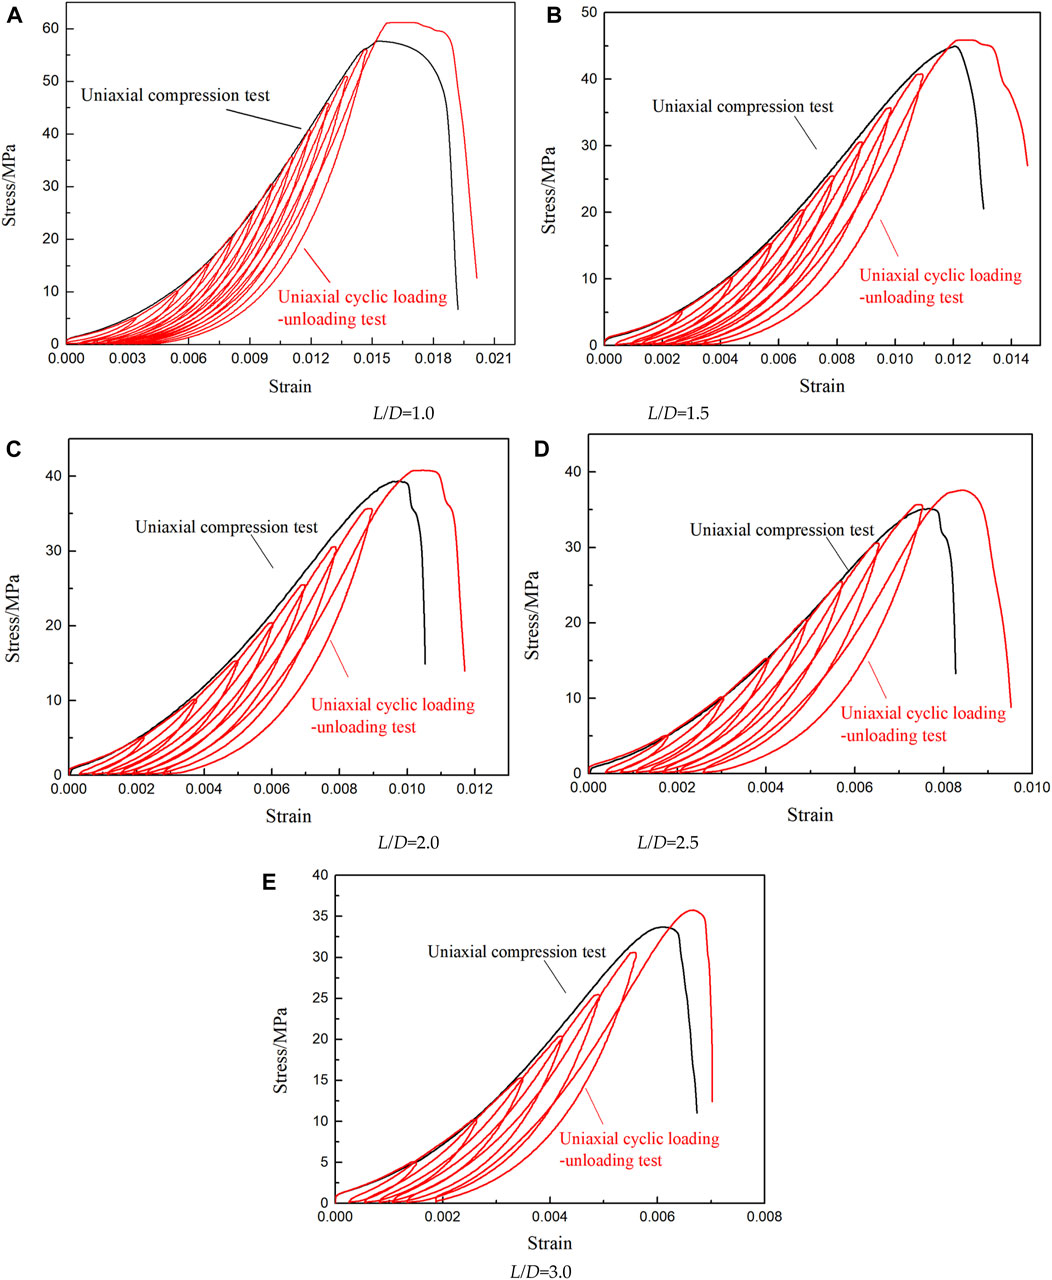
FIGURE 6. UCE curves and UCLUE curves of sandstone with different L/D ratios. (A) L/D=1.0, (B) L/D=1.5, (C) L/D=2.0 (D) L/D=2.5, and (E) L/D=3.0.
Notably, the rock strength in the UCLUE is higher than that in the UCE, indicating a phenomenon known as “hardening” of the rock after the loading and unloading process. The observation of this “hardening” phenomenon contradicts the conventional belief that loading and unloading cause damage to the rock mass, which is inconsistent with the theory of fatigue damage. To support this finding, the authors referred to relevant literature and discovered similar occurrences of the “hardening” phenomenon in previous studies. For example, (Jian-ping et al., 2011) investigated coal and rock mass under cyclic loading, while (Ming-qing and Cheng-dong, 2008) studied marble specimens, both of which reported the presence of the “hardening” phenomenon. Xu et al. (2009) carried out a uniaxial cyclic loading-unloading experiment on skarn and found that the same “hardening” phenomenon existed. Liu et al. (2021) also found that the rock hardening phenomenon existed after cyclic loading and unloading in the study of red sandstone uniaxial cyclic loading-unloading experiment.
Building upon the previous studies on the “hardening” phenomenon in rock specimens, the authors propose that this phenomenon can be attributed to the presence of cracks within the rock specimens. During loading, the local contact stress between these cracks becomes significantly higher than the nominal stress. Consequently, the specimens experience substantial deformation and may even exhibit local failure phenomena due to the elevated stress levels. As a result of this stress-induced deformation and failure, debris is generated, which can then fall off and fill the nearby cracks. The presence of debris between the cracks enhances friction and subsequently increases the bearing capacity of the rock. This phenomenon of debris filling between cracks plays a crucial role in the observed “hardening” behavior of the rock specimens. By shedding light on the underlying mechanisms of the “hardening” phenomenon, this explanation provides valuable insights into the complex behavior of rocks during loading and unloading. It emphasizes the significance of crack propagation, deformation, and debris filling as key factors influencing the mechanical response and strength enhancement observed in the rock specimens. It is worth noting that “hardening” is not the same as the increase in strength, which includes tensile, compressive, shear, and torsional resistance, whereas “hardening” is simply the increase in the bearing capacity due to the increase in friction.
4.2 Verification of energy analysis method
In line with the hypothesis presented in this paper, it is posited that a small amount of loading-unloading has minimal impact on the elastic strain energy of sandstone. To verify the rationality and accuracy of the aforementioned analysis method, the ESED at each unloading point in the ULUE was compared with that of the UCLUE. The stress-strain curve of the ULUE is depicted in Figure 7, wherein it is evident that the unloading curve exhibits noticeable nonlinearity.
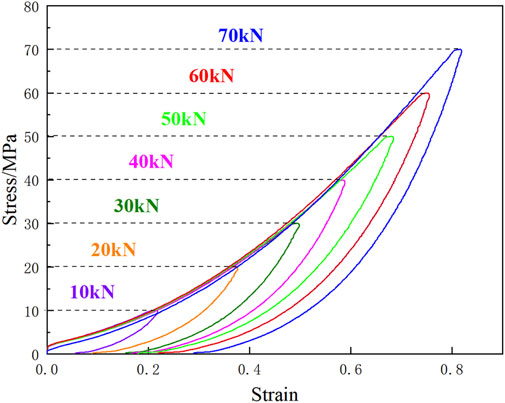
FIGURE 7. Stress-strain curve of the ULUE.
The ESED of ULUE was compared with that of UCLUE. As shown in Figure 8A, the ESED of sandstone under different L/D ratios in UCLUE has the same evolutionary trend as that of ULUE, and the two curves almost coincide. As shown in Figure 8B, the ESED-stress curve of sandstone follows a distinct pattern during the UCLUE and ULUE conducted at various strain rates. The hypothesis proposed in this paper is substantiated by observing the evolution pattern of ESED in the ULUE with different L/D ratios and sizes. The correctness of the hypothesis in this paper is verified by a ULUE.
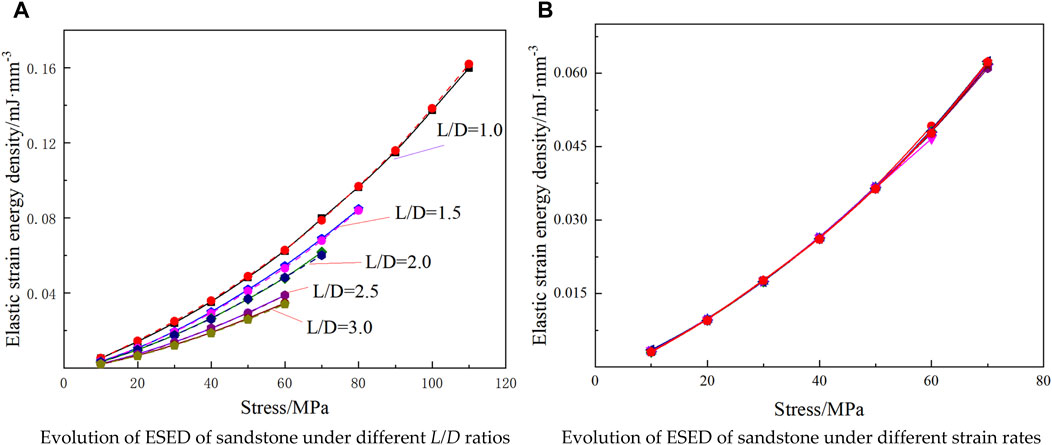
FIGURE 8. Comparison of ESED of rock under ULUE and UCLUE. (A) Evolution of ESED of sandstone under different L/D ratios, (B) Evolution of ESED of sandstone under different strain rates.
4.3 Energy analysis of sandstone under uniaxial compression experiment
According to the previous research, when the unloading point loads of UCE and UCLUE are equal, the ESED of both is also equal. Therefore, the UCLUE of sandstone can be used to analyze the energy evolution of UCE, and the results are shown in Tables 1, 2.
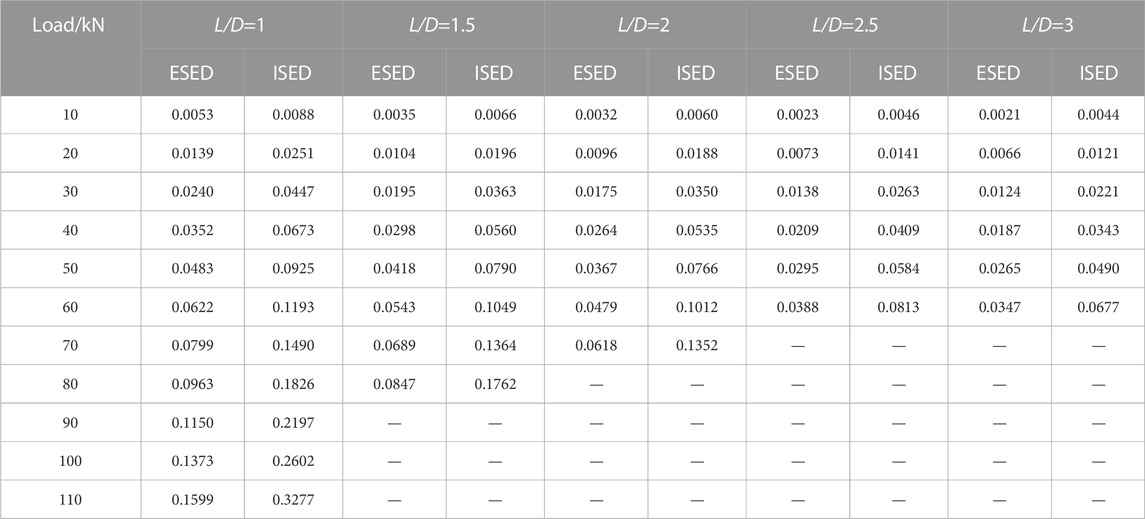
TABLE 1. Energy evolution law of sandstone with different L/D ratios. (mJ▪mm-3).
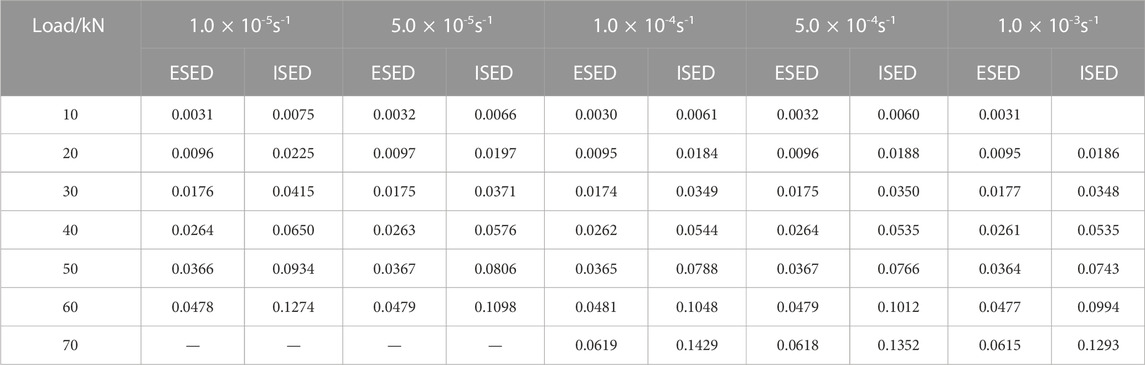
TABLE 2. Energy evolution law of sandstone with different strain rates. (mJ▪mm-3).
According to the hypothesis, the energy evolution can be obtained when the unloading points of UCE and UCLUE are equal, but the energy evolution law under arbitrary stress before the peak of UCE cannot be described. Based on the analysis of strain energy consumption characteristics during rock loading, it has been observed that there exists a linear relationship between the ESED and the ISED. This linear energy storage behavior can be expressed as follows (Gong et al., 2018; Gong et al., 2019a; Gong et al., 2019b):
Where, ue is the ESED in the rock loading process; u is the ISED; Both a and b are fitting parameters.
The ESED and DSED of sandstone under UCE with different strain rates and L/D ratios were fitted, and the fitting results were shown in Tables 3, 4.
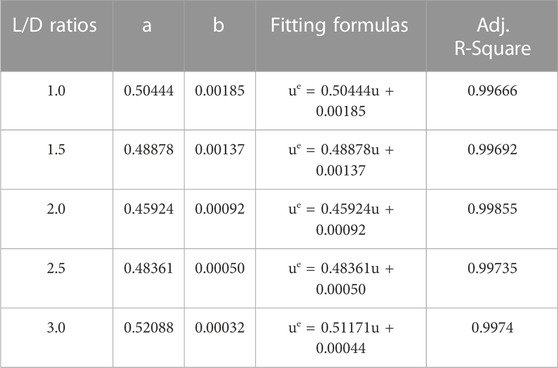
TABLE 3. Linear energy storage fitting formulas of sandstone with different L/D ratios.
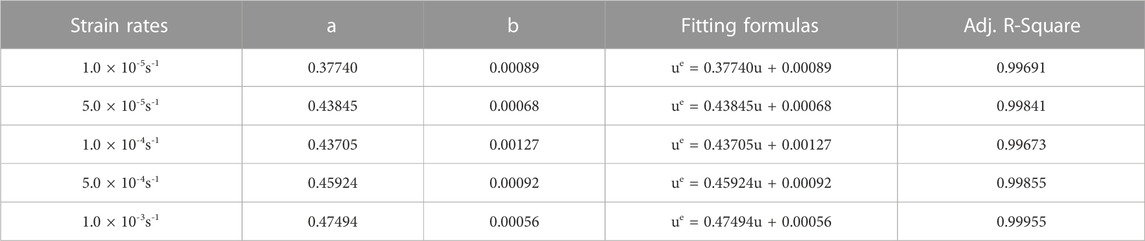
TABLE 4. Linear energy storage fitting formulas of sandstone with different strain rates.
The ESED and DSED values of sandstone under UCE were obtained for different strain rates and L/D ratios, and these data were used to perform fitting analysis. The fitting results for the ESED and DSED are presented in Tables 3, 4, respectively.
Previous research conducted by various scholars has suggested that the plastic stage of rock deformation is accompanied by the generation of numerous cracks, particularly near the peak stress (Ge et al., 2022). Additionally, (Gong et al., 2019b) have assumed that the failure process of rock include the initiation, propagation, coalescence, penetration, and sliding of micro-cracks within the rock, and the formation of new fracture planes within the sandstone necessitates energy absorption.
Figure 9A illustrates the ESED-stress curves of sandstones with varying L/D ratios under varying loads. It can be observed that at low loads, there is minimal difference in the ESED values among sandstones with varying L/D ratios. However, as the stress increasing, the deviation between the ESED-stress curves of different L/D ratios becomes pronounced. This indicates that for a given stress level, sandstones with smaller L/D ratios store a higher amount of ESED. With the increase of stress, the ESED of some sandstones with large L/D ratio will increase sharply when approaching the failure stress. It may even appear that the ESED stored by sandstones with large L/D ratio is greater than that of sandstones with small L/D ratio.
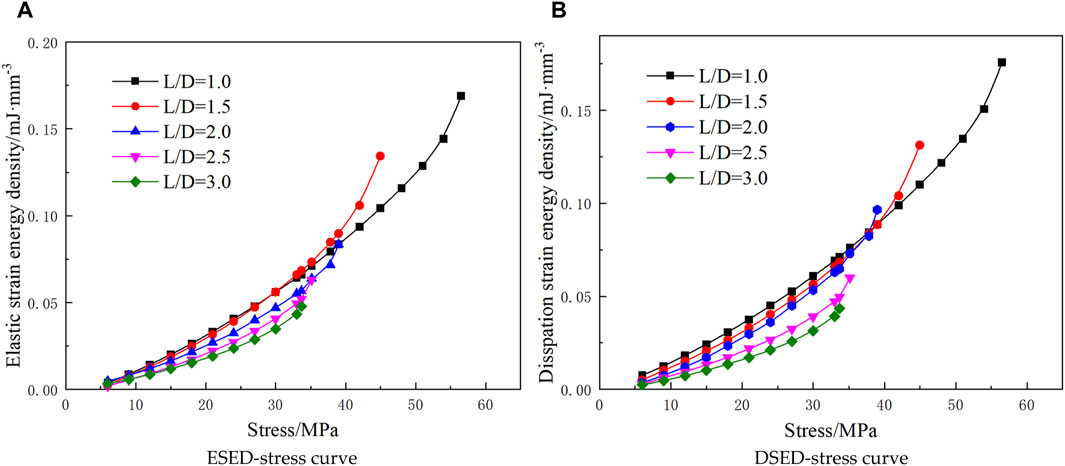
FIGURE 9. Energy evolution of sandstone under UCE with different L/D ratios. (A) ESED-stress curve (B) DSED-stress curve.
According to Figure 9B, the overall ISED of rocks shows a nonlinear growth trend during the loading process. At the first loading stage, when the loads are equal, the DSED of sandstone under different aspect ratios has a small difference. With increasing stress, the smaller the L/D ratio under the same stress, the greater the DSED. With the further increase of stress, the DSED increases sharply when the sandstone with large high-diameter ratio approaches the peak stress. The DSED of sandstone with L/D ratio of 2 is greater than that of sandstone with L/D ratios of 1.5 and 1 under the same stress at the peak stress. The reason is that with the increase of stress, the sandstone with large high-diameter ratio will produce more cracks when approaching the peak stress, and the energy will be dissipated by sliding friction between crack surfaces. However, the sandstone with relatively small high-diameter ratio is in the elastic stage or the early plastic stage at this time.
The dissipated strain energy of sandstone samples with large L/D ratio is lower than that of sandstone samples with small L/D ratio at the initial stage of loading. However, when the DSED of rocks approaches the peak stress, the cracks enter an unstable development stage, and the friction between cracks consumes more strain energy. Therefore, the DSED of sandstone samples with large L/D ratio is higher than that of sandstone samples with small L/D ratio. Because the crack is usually in a state of stress concentration, the ESED stored in sandstone samples with large L/D ratio is higher than that of sandstone samples with small L/D ratio.
Through the analysis of sandstone samples at different strain rates, it has been determined that the energy evolution of rock adheres to the linear energy storage. This indicates a linear relationship between the ESED and the ISED of sandstone. Figure 10 illustrates the evolution curves of the ISED, ESED, and DSED of rock under various strain rates.
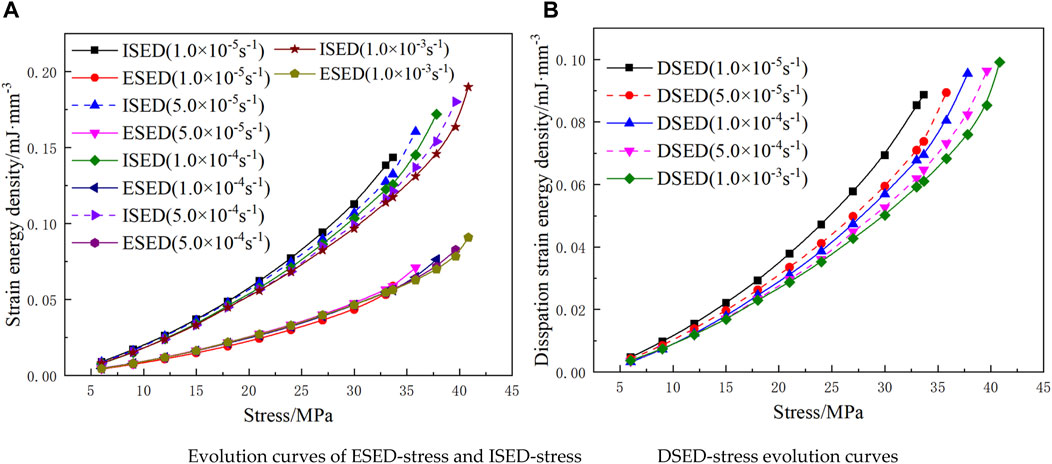
FIGURE 10. Energy evolution curves at different strain rates. (A) Evolution curves of ESED-stress and ISED-stress, (B) DSED-stress evolution curves.
The evolution law of ISED and ESED is shown in Figure 10A. In UCE, both ISED and ESED of rock show nonlinear growth with load increasing. When the strain rates of sandstone are 1 × 10⁻⁵s-1, 5 × 10⁻⁵s-1, 1 × 10⁻⁴s-1, 5 × 10⁻⁴s-1 and 1 × 10⁻³s-1, the ESED-stress of sandstone before the peak stress evolves along a specific curve, and the strain rate has little effect on it. The relationship between strain rate and energy storage limit in sandstone is evident in the findings of this study. Under equal stress conditions, it has been observed that higher strain rates correspond to lower ISED values in sandstone. Meng et al. (Gong et al., 2019a) point out that the smaller the strain rate is, the more the new crack and the primary crack inside the sandstone can fully friction. However, due to the higher strain rates during the loading process, there is less energy dissipation in the rock. Researchers such as Xie et al. (Xie et al., 2005a; Xie et al., 2005b; Xie et al., 2008) have proposed that rock damage is positively correlated with energy dissipation. Therefore, at equal stress levels, the damage is less pronounced at higher strain rates, resulting in greater peak strength and a higher accumulation of elastic strain energy at the peak.
Figure 10B illustrates the DSED-stress curve of rock under various strain rates. It is evident that the DSED of sandstone exhibits a nonlinear increase with increasing stress. The inpact of strain rate on the DSED is more significant compared to the ESED. The generation of new crack surfaces within the rock necessitates energy absorption, while the sliding friction between crack surfaces dissipates energy, as highlighted by previous research (Meng et al., 2018). When the strain rate is low, an extended loading time allows for enhanced friction, development, and connection of cracks within the rock, resulting in the generation of greater dissipated strain energy under equivalent loads. Consequently, a portion of the external work applied to the rock is converted into dissipated strain energy, leading to the gradual lower in the strength of the rock (xie et al., 2005b). This phenomenon explains the observed decrease in rock strength with decreasing strain rate.
5 Discussion
According to the strain energy evolution law of the UCE of sandstone specimens with the same diameter and different length, the energy evolution analysis of the UCE of sandstone specimens with different L/D ratio is proposed by using UCLUE combined with linear energy storage law. The energy evolution analysis of sandstone specimens with different L/D ratio shows that the smaller the L/D ratio, the larger the energy storage limit of sandstone; the higher the strain rate, the greater the energy storage limit of sandstone.
To solve the problem of maintaining the stability of deep roadway, scholars at home and abroad have done a lot of studies and pointed out that surrounding rock stress, lithology and support are the main factors affecting the stability of roadway. It is very difficult to control large deformation of deep roadway simply by improving the properties of surrounding rock and enhancing the strength of support, while relatively reducing the stress of surrounding rock is fundamental to maintaining the stability of such roadway. The essence of roadway stress transfer is to use artificial methods to reduce the stress environment of surrounding rock or change the stress distribution of surrounding rock, so that the peak of abutment pressure is transferred to the depth of surrounding rock, so as to reduce the fracture range of surrounding rock and maintain the long-term stability of roadway.
The essential feature of rock deformation and failure is energy conversion, so the occurrence process of rock burst can be understood from the perspective of energy: Due to the influence of excavation unloading on rock mass, the limit energy storage of rock mass around surrounding rock mass decreases, and unloading will cause energy transfer and conversion of rock mass around roadway. After one or several energy transfer events, the rock mass of roadway reaches the energy storage limit. The elasticity will be released quickly resulting in rock burst. In this study, the greater the strain rate, the greater the energy storage limit of rock mass, the more severe the rock burst damage caused by the release of elastic strain energy. Therefore, it is very important to select the appropriate driving rate in the process of roadway driving for the safety of rock burst mine.
In the prevention and control of rock burst, borehole pressure relief is a common measure, which belongs to the pressure relief in the roadway, and the process is relatively simple. Borehole pressure relief changes the stress concentration of the surrounding rock, as shown in Figure 11 and Figure 12 (σp is the peak value of the vertical stress of the surrounding rock of the roadway; L(σp) is the peak position of the vertical stress of the surrounding rock. σ′p is the peak value of vertical stress of roadway wall rock after borehole pressure relief. L(σ′p) is the peak position of vertical stress in roadway wall rock after borehole pressure relief). Borehole pressure relief can provide effective compensation space for the expansion deformation of surrounding rock and absorb part of the deformation while transferring the high stress around the roadway. Large dimensions such as roadway, chamber, etc.; medium size such as pressure relief hole, gas extraction hole, etc.; smaller dimensions such as joints, cracks, etc. All of the above can be regarded as free Spaces of different scales. Any newly formed free space is the expansion and extension of the free space system, and any free space can also be regarded as a system composed of countless smaller free spaces (Qi et al., 2018).
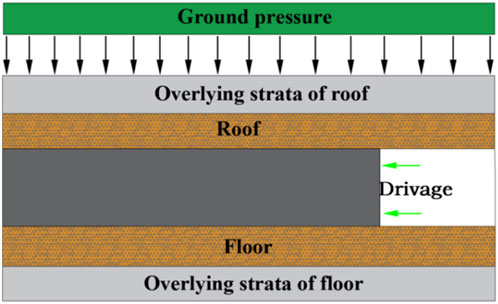
FIGURE 11. Schematic diagram of roadway driving.
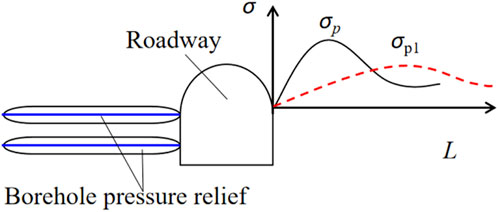
FIGURE 12. Borehole pressure relief diagram.
In summary, it is generally believed that borehole pressure relief can reduce the size of rock mass and the stress concentration of surrounding rock to a certain extent. In this study, the smaller the L/D ratio, the higher the energy storage limit of rock. Borehole pressure relief can reduce the probability of rock burst from the perspective of energy. If we can further study the energy storage limit of surrounding rock under different tunneling rates and the energy storage law of rock specimens with other shapes, then the energy storage limit of rock mass in surrounding rock can be better predicted. The monitoring coordinates of roadway microseismic events under different tunneling rates are used to obtain the energy changes of surrounding rock, so as to determine the location and range of borehole pressure relief, and more accurately prevent rock burst by using borehole pressure relief technology. There is a great difference between the roadway tunneling rate and the specimen size in the broken zone of surrounding rock, so it is of positive significance to study the dimension effect and strain energy evolution characteristics of rock mass under different strain rates.
6 Conclusion
It is postulated that a small amount of loading and unloading has negligible impact on the energy storage of rock mass. The strain energy density of uniaxial compression experiment was analyzed by UCLUE. The validity of the analysis method is further substantiated through ULUE. The key conclusions derived from the study are as follows:
(1) Based on an investigation of the Kaiser effect in UCLUE, it is postulated that a small degree of loading-unloading has negligible impact on the storage of strain energy in rock masses. The hypothesis regarding the limited influence of loading-unloading on the elastic strain energy storage of rocks is confirmed through a comparative analysis between the elastic strain energy storage in UCLUE and ULUE.
(2) By analyzing the ESED and ISED of sandstone under different L/D ratios and strain rates, it has been observed that these two quantities exhibit a linear functional relationship. Specifically, the ESED increases linearly with an increase in ISED. Consequently, we present a methodology for studying the evolution of strain energy in uniaxial compression experiments through the utilization of UCLUEs.
(3) The ESED of rocks remains unaffected by the strain rate. Under equal load and size conditions, the ESED of rocks remains constant. However, at low loads and under equal stress conditions, both the DSED and ISED decrease with increasing strain rate. At peak stress, both ESED and DSED exhibit an increase with higher strain rates. When the strain rate is low, an extended loading time facilitates enhanced friction, development, and interconnection of cracks within the rock. Consequently, under equivalent loads and low strain rates, a greater amount of dissipated strain energy is generated.
(4) At low loads, the differences in ESED and DSED values among sandstones with varying L/D ratios are minimal. However, as the stress level increases, the divergence between the ESED-stress and DSED-stress curves for different L/D ratios becomes more prominent. Smaller L/D ratios are associated with larger ESED and DSED values in sandstone. As the stress intensifies, the ESED and DSED of certain sandstones with larger L/D ratios experience a sharp increase when approaching the failure stress. Under equal stress levels, it is possible for sandstones with larger L/D ratios to exhibit higher ESED and DSED values compared to those with smaller L/D ratios.
Data availability statement
The original contributions presented in the study are included in the article/supplementary material, further inquiries can be directed to the corresponding author.
Author contributions
XL: Data curation, Supervision, Writing–review and editing. ZL: Conceptualization, Data curation, Methodology, Writing–original draft.
Funding
The author(s) declare financial support was received for the research, authorship, and/or publication of this article. This study was funded by a grant from the Anhui University graduate Scientific research Project (No. YJS20210387).
Acknowledgments
The authors are very grateful to the reviewers for carefully reading the manuscript and providing valuable suggestions.
Conflict of interest
The authors declare that the research was conducted in the absence of any commercial or financial relationships that could be construed as a potential conflict of interest.
Publisher’s note
All claims expressed in this article are solely those of the authors and do not necessarily represent those of their affiliated organizations, or those of the publisher, the editors and the reviewers. Any product that may be evaluated in this article, or claim that may be made by its manufacturer, is not guaranteed or endorsed by the publisher.
Abbreviations
CLU, cyclic loading-unloading; DSED, dissipated strain energy density; ESED, elastic strain energy density; ISED, input strain energy density; L/D, length-to-diameter; UCE, uniaxial compression experiment; UCLUE, uniaxial cyclic loading-unloading experiment; ULUE, uniaxial loading-unloading experiment.
References
Dong, W., Wu, Z., Zhang, B., and She, J. (2021). Study on shear–softening constitutive law of rock–concrete interface. Rock Mech. Rock Eng. 54, 4677–4694. doi:10.1007/s00603-021-02536-6
Ge, Z., Sun, Q., Gao, Q., Li, D., Zhang, Y., and Huang, H. (2022). Thermoacoustic emission characteristics and real-time damage evolution in shales of the Lower Palaeozoic Niutitang Formation. Int. J. Rock Mech. Min. Sci. 157, 105175, 105175. doi:10.1016/j.ijrmms.2022.105175
Gong, F., Yan, J., and Li, X. (2018). A new criterion of rock burst proneness based on the linear energy storage law and the residual elastic strain energy index. Chin. J. Rock Mech. Eng. 37(9), 1993–2014. doi:10.13722/j.cnki.jrme.2018.0232
Gong, F., Yan, J., Luo, S., and Li, X. (2019a). Investigation on the linear energy storage and dissipation laws of rock materials under uniaxial compression. Rock Mech. Rock Eng. 52, 4237–4255. doi:10.1007/s00603-019-01842-4
Gong, F., Yan, J., Li, X., and Luo, S. (2019b). A peak-strength strain energy storage index for rock burst proneness of rock materials. Int. J. Rock Mech. Min. Sci. 117, 76–89. doi:10.1016/j.ijrmms.2019.03.020
Hajiabdolmajid, V., Kaiser, P. K., and Martin, C. D. (2002). Modelling brittle failure of rock. Int. J. Rock Mech. Min. Sci. 39 (6), 731–741. doi:10.1016/S1365-1609(02)00051-5
Hashiba, K., Fukui, K., and Kataoka, M. (2019). Effects of water saturation on the strength and loading-rate dependence of andesite. Int. J. Rock Mech. Min. Sci. 117, 142–149. doi:10.1016/j.ijrmms.2019.03.023
Haupt, M. (1991). A constitutive law for rock salt based on creep and relaxation tests. Rock Mech. Rock Engng 24, 179–206. doi:10.1007/BF01045031
Huang, D., and Li, Y. (2014). Conversion of strain energy in triaxial unloading tests on marble[J]. Int. J. Rock Mech. Min. Sci. 66:160–168. doi:10.1016/j.ijrmms.2013.12.001
Jian-ping, Z., Heping, X., Meng, B.-B., and Jianfeng, L. (2011). Experimental research on loading-unloading behavior of coal-rock combination bodies at different stress levels. Rock Soil Mech. 32 (5), 1287–1296. doi:10.16285/j.rsm.2011.05.028
Li, C., Gao, C., Xie, H., and Ning, L. (2020). Experimental investigation of anisotropic fatigue characteristics of shale under uniaxial cyclic loading. Int. J. Rock Mech. Min. Sci. 130, 104314. doi:10.1016/j.ijrmms.2020.104314
Li, K., Yin, Z. Y., Han, D., Fan, X., Cao, R., and Lin, H. (2021). Size effect and anisotropy in a transversely isotropic rock under compressive conditions. Rock Mech. Rock Eng. 54, 4639–4662. doi:10.1007/s00603-021-02558-0
Liu, Y., and Dai, F. (2018). A damage constitutive model for intermittent jointed rocks under cyclic uniaxial compression. Int. J. Rock Mech. Min. Sci. 103, 289–301. doi:10.1016/j.ijrmms.2018.01.046
Liu, Y., and Dai, F. (2021). A review of experimental and theoretical research on the deformation and failure behavior of rocks subjected to cyclic loading. J. Rock Mech. Geotechnical Eng. 13 (5), 1203–1230. doi:10.1016/j.jrmge.2021.03.012
Liu, Z., Zhao, G., Meng, X., Zhang, R., Cheng, X., Dong, C., et al. (2021). Analysis of creep energy evolution of red sandstone based on linear energy storage law[J]. J. Central South Univ. Sci. Technol. 52 (08): 2748–2760. doi:10.11817/j.issn.1672-7207.2021.08.021
Ma, L.-J., Liu, X.-Y., Wang, M.-Y., Xu, H.-F., Hua, R.-P., Fan, P.-X., et al. (2013). Experimental investigation of the mechanical properties of rock salt under triaxial cyclic loading. Int. J. Rock Mech. Min. Sci. 62, 34–41. doi:10.1016/j.ijrmms.2013.04.003
Manoj, N., and Petroš, V. (2009). Fatigue and dynamic energy behaviour of rock subjected to cyclical loading. Int. J. Rock Mech. Min. Sci. 46 (1), 200–209. doi:10.1016/j.ijrmms.2008.05.002
Meng, Q., Zhang, M., Han, L., Pu, H., and Chen, Y. (2018). Acoustic emission characteristics of red sandstone specimens under uniaxial cyclic loading and unloading compression. Rock Mech. Rock Eng. 51, 969–988. doi:10.1007/s00603-017-1389-6
Ming-qing, Y., and Cheng-dong, S. (2008). Experimental study on strengthening of marble specimen in cyclic loading of uniaxial or pseudo-triaxial compression. Chin. J. Solid Mech. 29(1), 66–72. (in Chinese).
Nawrocki, P. A., Cristescu, N. D., Dusseault, M. B., and Bratli, R. K. (1999). Experimental methods for determining constitutive parameters for nonlinear rock modeling. Int. J. Rock Mech. Min. Sci. 36 (5), 659–672. doi:10.1016/S0148-9062(99)00030-3
Qingbin, M., Lijun, H., Hai, P., and Literary and courageousHao, L. (2015). Experimental on the effect of strain rate and size on the energy accumulation and dissipation of rock. J. China Coal Soc. 40 (10), 2386–2398. doi:10.13225/j.cnki.jccs.2014.1771
Qi, Y., Jing, H., Meng, B., and Dong, Z. (2018). Experimental modelling on size effect of pressure relief hole[J]. J. Min. Saf. Eng. 35(3), 538–544. doi:10.13545/j.cnki.jmse.2018.03.013
Richards, M. C., Issen, K. A., and Ingraham, M. D. (2022). A coupled elastic constitutive model for high porosity sandstone. Int. J. Rock Mech. Min. Sci. 150, 104989. doi:10.1016/j.ijrmms.2021.104989
Song, H., Zhang, H., Fu, D., and Zhang, Q. (2016). Experimental analysis and characterization of damage evolution in rock under cyclic loading. Int. J. Rock Mech. Min. Sci. 88, 157–164. doi:10.1016/j.ijrmms.2016.07.015
Sun, X., Shi, F., Luan, Z., Yang, L., Ding, J., He, L., et al. (2023). Constitutive model and microscopic mechanism for sandstone strength softening damage. Rock Mech. Rock Eng. 56, 797–813. doi:10.1007/s00603-022-03096-z
Xiao, J.-Q., Ding, D.-X., Jiang, F.-L., and Xu, G. (2010). Fatigue damage variable and evolution of rock subjected to cyclic loading. Int. J. Rock Mech. Min. Sci. 47 (3), 461–468. doi:10.1016/j.ijrmms.2009.11.003
Xie, Y., Hou, M. Z., and Li, C. (2023). Anisotropic characteristics of acoustic emission and the corresponding multifractal spectrum during progressive failure of shale under cyclic loading. Int. J. Rock Mech. Min. Sci. 165, 105364. doi:10.1016/j.ijrmms.2023.105364
Xie, H., Ju, Y., and Li, L. (2005b). Criteria for strength and structural failure of rocks based on energy dissipation and energy release principles[J]. Chin. J. Rock Mech. Eng. 24 (17):3003–3010. (in Chinese). doi:10.3321/j.issn:1000-6915.2005.17.001
Xie, H., Ju, Y., Li, L., and Peng, R. D. (2008). Energy mechanism of deformation and failure of rocks[J]. Chin. J. Rock Mech. Eng. 27 (9), 1729–1739. (in Chinese). doi:10.3321/j.issn:1000-6915.2008.09.001
Xie, H., Peng, R., Ju, Y., and Zhou, H. (2005a). On energy analysis of rock failure. Chin. J. Rock Mech. Eng. 24 (15), 2603–2608. doi:10.3321/j.issn:1000-6915.2005.15.001
Xu, S., Feng, X., and Chen, B. (2009). Experimentalstudy of skarn under uniaxial cyclic loading and unloading test and acoustic emission characteristics. Rock Soil Mech. 30 (10), 2929–2934. doi:10.1016/S1874-8651(10)60073-7
Yang, S., Su, C., and Xu, W. (2005). Experimental and theoretical study on size effect of rock materials[J]. Eng. Mech. 22 (4), 112–118. (in Chinese). doi:10.1080/02726340590910084
Yoshinaka, R., Tran, T. V., and Osada, M. (1998). Non-linear, stress- and strain-dependent behavior of soft rocks under cyclic triaxial conditions. Int. J. Rock Mech. Min. Sci. 35 (7), 941–955. doi:10.1016/S0148-9062(98)00158-2
Zhang, A., Xie, H., Zhang, R., Gao, M. Z., Xie, J., Jia, Z., et al. (2023). Mechanical properties and energy characteristics of coal at different depths under cyclic triaxial loading and unloading. Int. J. Rock Mech. Min. Sci. 161, 105271. doi:10.1016/j.ijrmms.2022.105271
Zhang, J. C., Zhou, S. H., Hua Xu, X., and Fang, L. G. (2013). Evolution of the elastic properties of a bedded argillite damaged in cyclic triaxial tests. Int. J. Rock Mech. Min. Sci. 58, 103–110. doi:10.1016/j.ijrmms.2012.09.008
Zhao, K., Xiang, Y., Zhou, Y., Wang, Q., Wang, J., and Hao, J. (2020). Energy evolution of brittle granite under different loading rates. Int. J. Rock Mech. Min. Sci. 132, 104392. doi:10.1016/j.ijrmms.2020.104392
Zhou, M., Liao, J., Lin, A., Deng, W., Fahmi Hassanein, M., and Yu, Z. (2018). Analysis of stress-induced cracks in concrete and mortar under cyclic uniaxial compression. Constr. Build. Mater. 187, 652–664. doi:10.1016/j.conbuildmat.2018.07.219
Keywords: length-to-diameter ratio, strain rate, uniaxial compression, energy evolution, sandstone
Citation: Liu X and Liu Z (2024) Effects of length-to-diameter ratio and strain rate on strain energy accumulation and dissipation in sandstone. Front. Earth Sci. 11:1272476. doi: 10.3389/feart.2023.1272476
Received: 04 August 2023; Accepted: 23 November 2023;
Published: 22 January 2024.
Edited by:
Binbin Yang, Xuchang University, ChinaCopyright © 2024 Liu and Liu. This is an open-access article distributed under the terms of the Creative Commons Attribution License (CC BY). The use, distribution or reproduction in other forums is permitted, provided the original author(s) and the copyright owner(s) are credited and that the original publication in this journal is cited, in accordance with accepted academic practice. No use, distribution or reproduction is permitted which does not comply with these terms.
*Correspondence: Xiaodie Liu, MTU3NTU0MDMwNTJAMTYzLmNvbQ==