 Huang Min1,2
 Cai Sijie
- 1School of Resources and Environment Engineering, Jiangxi University of Science and Technology, Ganzhou, China
- 2Zijin Mining Group Co., Ltd., Shanghang, China
- 3Zijin School of Geology and Mining, Fuzhou University, Fuzhou, China
Introduction: Cavability issues often arise in hard rock mines employing the block caving mining method. Hydraulic fracturing stands out as a promising pre-conditioning technology for hard rock masses, with its pre-conditioning effects dependent on variable parameters.
Methods: The impact of cluster number, injection rate, and liquid volume on fracture propagation was investigated through on-site hydraulic fracturing practices. Fracturability was initially verified via true triaxial fracturing tests, and preconditioning parameters were subsequently optimized using numerical simulations. The optimized on-site construction was monitored using electromagnetic methods.
Results: The study revealed a negative correlation between fracture radius and the number of clusters, gradually decreasing with an increase in cluster number. However, the fracture weakening area increased with the rise in the number of clusters. The fracture weakening area also increased with the injection rate. Additionally, the fracture radius initially increased and then decreased. Both fracture weakening area and radius increased with an increase in liquid volume. The optimized parameters were identified as four clusters, an injection rate of 4 m3/min, and a liquid volume of 500 m3.
Discussion: Building upon these findings, on-site experiments were conducted and monitored using electromagnetic methods. The monitored results demonstrated that the optimized parameters effectively achieved hydraulic fracturing expansion, accomplishing the goal of weakening hard rock.
1 Introduction
Block caving is an underground mining method that is as advantageous as surface mining, with high efficiency, large scale, and low cost (Rong et al., 2017; Zarate et al., 2022). It is mainly suitable for mining ore deposits with large thicknesses, steep dip angles, and poor rock integrity (Yu et al., 2022). The block caving method is a relatively advanced technology and is constantly updated with practical applications. It is now a popular development trend to introduce block caving in increasingly underground metal mines with hard rock masses (Yu, 2020). The key to the success of block caving mining in hard rock mines lies in its rock caving characteristics, which directly affect the bulk rate, caving rate, and caving suspension in block caving. In order to improve the caving characteristics of hard rock mines, some block caving mines have gradually formed and applied preconditioning technology in production (Brown, 2007), where artificial fractures are created within the deposit to change the structural characteristics through artificial interference measures to enhance the cavability so that the ore body can maintain continuous and stable caving and achieve the expected fragmentation degree (Laubscher, 2000).
At present, the methods used for ore rock preconditioning include hydraulic fracturing, long hole drilling and blasting, and their combined application (Yu et al., 2018). The application of rock preconditioning is making block caving mining of hard rock metal mines become a reality (Someehneshin et al., 2015). Hydraulic fracturing preconditioning refers to the construction of deep boreholes to reach the ore body to be caved, according to the fracturing borehole layout scheme, and the injection of high-pressure water in the borehole section by section in accordance with a certain spacing to generate new fractures or expand primary fractures in the borehole wall. The fractures continue to extend outward under the action of continuous injection of high-pressure water, thus weakening the ore rock mass. This provides a good precondition for the block caving of mineral rock. In hard rock mines mined by block caving, such as Cadia East mine and Northparkes mine in Australia and El Salvador mine and El Teniente mine in Chile, hydraulic fracturing preconditioning technology has improved the initial conditions of rock mass and improved the caving characteristics of hard rock mines. This provides a good precondition for the block caving and propagative caving of ore and rock (Leiva et al., 2003; As et al., 2004; Chacon et al., 2004; Wei et al., 2021; Catalan et al., 2022). The large-scale application of the block caving method has led to the complexity of hydraulic fracturing technology. Scholars have primarily conducted their research using engineering analogies and empirical methods without systematically analyzing the factors influencing hydraulic fracturing fracture propagation. This approach has resulted in uncertainties in their results, and the existence of several failed experiments also indicates this shortcoming. Numerical simulation methods and advanced monitored techniques can effectively compensate for this shortcoming. Moreover, in the field of oil and gas extraction, many scholars have also conducted research on hydraulic fracturing, which can provide good references for the implementation of hydraulic fracturing methods in hard rock mines (Shakib et al., 2012; Bao et al., 2019; Jun et al., 2021; Yue et al., 2022; Bo et al., 2023).
Liu Yuming et al. (2020) analyzed the rock initiation pressure and the expansion range of hydraulic fractures through industrial test of hydraulic fracturing, and their results showed that the ground stress test and other basic work could provide support for the successful development of hydraulic fracturing preconditioning. However, though their research work serves as the foundation for the implementation of hydraulic fracturing preconditioning technology, it does not take into account the potential influencing factors during the implementation of hydraulic fracturing preconditioning technology. Li Guang et al. (2020) carried out hydraulic fracturing rock preconditioning tests in Yanqianshan Iron Mine, analyzed the expansion distance and fracture surface direction of rock hydraulic fracturing by using microseismic location and water level observation, and found that the fractures generated by hydraulic fracturing were controlled by vertical minimum stress. However, their research did not reveal the relationship between hydraulic fracturing fracture propagation and influencing factors. He Q et al. (2017) believe that the hydraulic fracturing direction is uncontrollable and is dictated by the minimum in situ stress direction. They proposed the feasibility of a proposed method for creating specified hydraulic fracturing based on previous research and numerical modeling. Their results show that the numerical modeling code reliability in simulating the hydraulic fracturing propagation and reorientation process was validated. However, the study did not take into account that the hydraulic fracturing preconditioning technology targets a large area, and fracture propagation may be influenced by various geological factors. Im H et al. (2022) adopted the fuzzy inference system for estimating the cost of fracking in a block caving operation and deciding on the scale of infrastructure and ore production by facilitating undercut propagation and controlling the block height of the block caving operation, including additional fragmentation processes. The results show that systematic fuzzy cost engineering could help estimate the initial stage of budgeting. The study approached the analysis from the perspective of caving block size and examined the relationship between caving block size and hydraulic fracturing costs. However, this method can only serve as a supplementary economic aspect of the block caving method and hydraulic fracturing preconditioning technology. Chen W et al. (2023) used acoustic emission, digital image correlation, scanning electron microscopy, electron dispersion spectroscopy, and X-ray diffraction to study the effect of water’s acid–base properties on rock damage. The results showed that acidic water can cause microstructural changes inside the rock mass, leading to fracture propagation. Rafiee R et al. (2018), using a numerical technique named the synthetic rock mass (SRM), investigated the compressive strength of intact rock (UCS), joint direction, joint persistence, joint density (P-32), joint friction, confined stress, and hydraulic radius (HR). It was found that in situ stress and hydraulic radius are the most effective parameters in the cavability of rock mass in block caving mines. The results of this study are of reference value for the block caving method and hydraulic fracturing technology but have not been applied in engineering practice. Chen W et al. (2023) conducted a study on the deformation and damage mechanisms of rocks under dynamic water pressure conditions. The results indicate that during the stages of fracture closure and compaction, the deformation of the rock is primarily axial compression, with minimal lateral deformation. Simultaneously, with an increase in flow velocity, the internal fracture types in the rocks transition from shear fractures to tensile fractures, corresponding to a shift from shear failure to cleavage failure. However, these research findings represent general patterns observed through laboratory experiments, and industrial tests have not yet been conducted.
The block caving method, with its efficiency advantages, has been increasingly adopted by hard rock mines. However, its large-scale implementation brings about heightened complexity, which, in turn, may lead to the possibility of caving interruptions in the rock mass during the caving process. Hydraulic fracturing preconditioning technology aims to weaken the rock mass by inducing the expansion of natural fractures through engineered means. However, there are numerous factors affecting these natural fractures, making it challenging to understand their correlations. This study focused on investigating the impact of cluster number, injection rate, and liquid volume on hydraulic fracturing fissures. First, the physical characteristics of the study object and the in situ stress were obtained through geomechanical testing and geological surveys. Then, the relationship between injection fracturing rate and time was analyzed through true triaxial fracturing tests while demonstrating the compressibility of the rock mass. Subsequently, hydraulic fracturing numerical simulations were conducted to explore the influence of cluster number, injection rate, and liquid volume on hydraulic fracturing fissures, along with the optimization of parameters. Finally, the results were validated using electromagnetic methods.
2 Background
The Tongshan deposit is a porphyry epithermal large-scale copper deposit mainly occurring in the Middle Ordovician Duobaoshan Formation neutral volcanic rock and the Middle Carboniferous Tongshan unit quartzite diorite; the main ore type is sulfide ore. Ore bodies occur in the first lithologic member of the Duobaoshan Formation in the upper wall of Tongshan fault in the green mud sericite andesite or andesitic pyroclastic rock. The ore body occurrence level is from +513.8 m to −285.2 m. The ore body is in the shape of strip, plate, and lens, with a dip of 210°, a dip of 30–70°, and a maximum of 79°. The controlled length of the ore body is 2000 m, and the maximum horizontal thickness is 174.6 m. The Tongshan mine is mined by the block caving method. Figure 1 shows the three-dimensional diagram of the ore body morphology. Figure 2 shows the schematic diagram of the relative position between the well logging and ore body. The Tongshan mine is a typical hard rock mine.
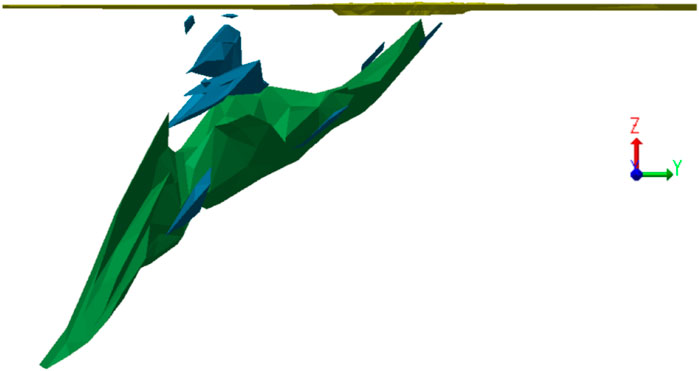
FIGURE 1. 3D schematic diagram of Tongshan ore body.
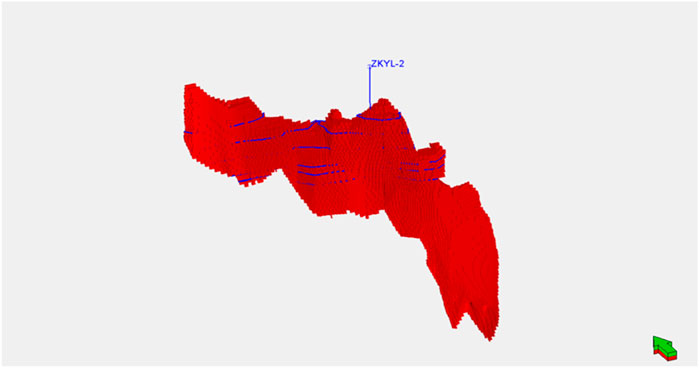
FIGURE 2. Schematic diagram of relative position between well logging and ore body.
According to the well-logging data, the lithology is mainly gray, gray–green andesite, tuff, and volcanic breccia. Copper ore is mainly distributed in chlorite sericite andesite or andesitic pyroclastic rock. The rock composition is mainly andesite, which has high rock physical and mechanical strength (Kui et al., 2005).
2.1 Statistical analysis of natural fractures
The ECLIPS-5700 series crossover dipole array acoustic logging was used in field logging. Well logging was primarily processed and interpreted using array sonic and electrical imaging methods and the ELAN program on the LEAD 4.0 processing and interpretation platform. The fracture length refers to the linear distance of the fracture in a specific direction. The fracture width refers to the maximum distance between the two sides of the fracture. Fracture density refers to the quantity or distribution of fracture within a specific area, and in this article, it is expressed as the number of fractures per unit well distance. The logging fracture development is shown in Table 1. The development degree of natural fracture length, fracture opening, and fracture density in the shallow strata of the Tongshan mine is much greater than that in the deep strata, indicating that natural fractures are more developed in the shallow strata of the Tongshan mine than in the deep strata. Figure 3 reveals that there is no apparent dominant trend in the fractures.
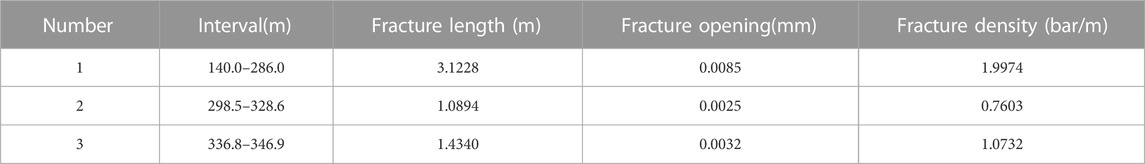
TABLE 1. Natural fracture development.
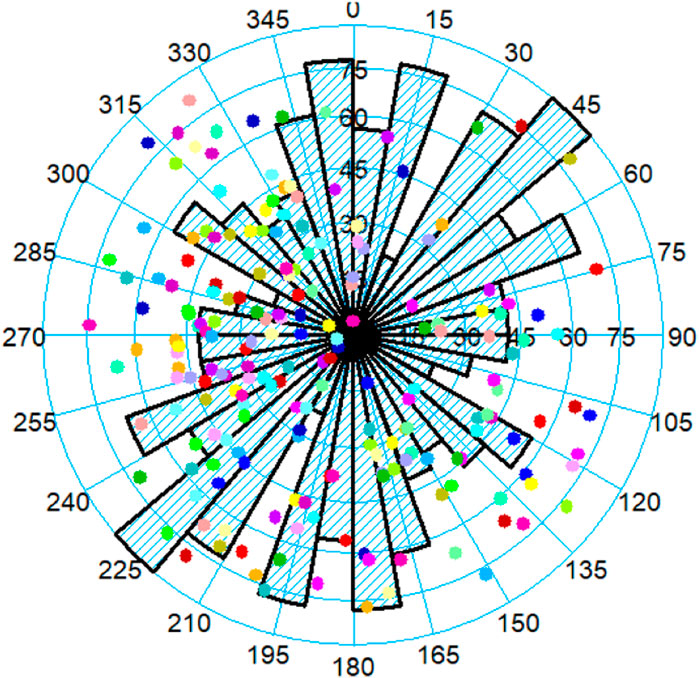
FIGURE 3. Natural fracture strike rose diagram.
2.2 Test of rock physical and mechanical parameters
The maximum horizontal principal stress direction of the Tongshan mine was determined to be between 115° and 130°, and the dominant direction is 125°, according to the imaging induction fracture of logging and the fast shear wave azimuths of the subarray acoustic logging instrument. The average horizontal maximum principal stress is 9.77 MPa. The mean value of the minimum horizontal principal stress is 8.13 MPa. Vertical stress is also one of the primary stresses, and it is related to the depth of the rock mass. Vertical stress falls between the maximum horizontal principal stress and the minimum horizontal principal stress.
The physical parameters of rock include rock permeability and rock porosity. Porosity and permeability were obtained through on-site routine well logging. The on-site well logging is shown in Figure 4. The data obtained from well logging were processed and interpreted using the ELAN program on the array sonic and LEAD 4.0 processing and interpretation platform. The obtained rock has an average permeability of 0.0035 mD and an average porosity of 2.93%. The rock mechanical parameters were mainly obtained through laboratory tests. Uniaxial compressive strength, elastic modulus, Poisson’s ratio, and other parameters were obtained through laboratory uniaxial and triaxial tests. The mean uniaxial compressive strength, elastic modulus, Poisson’s ratio, and uniaxial tensile strength obtained by the test are 59.98 MPa, 59.8 GPa, 0.29, and 6.78 MPa, respectively, as numerical simulation parameters.
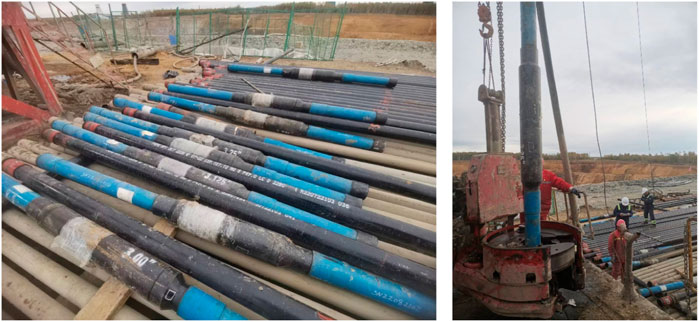
FIGURE 4. The on-site well-logging construction process.
3 Feasibility analysis of hydraulic fracturing
Whether the hydraulic fracturing passes through the natural fracture or not is related to the horizontal principal stress, the approximation angle, and the mechanical parameters of the natural fracture. Opening and expanding natural fractures is the key to implementing hydraulic fracturing. After the intersection of hydraulic fracturing and natural fractures, the initiation and extension of branch fractures have an important influence on the geometric size and complexity of the complex fracture network (Figure 5).
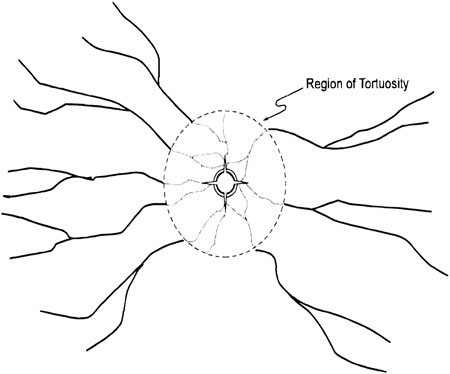
FIGURE 5. Schematic diagram of natural fracturing and hydraulic fracturing formation.
The conditions for the formation of hydraulic fracturing are closely related to geological factors, among which rock brittleness coefficient, horizontal ground stress difference, and the degree of natural fracture development are key influencing factors. Rock mechanics parameters refer to Young’s modulus and Poisson’s ratio of rocks. It is generally believed that the larger Young’s modulus and the smaller Poisson’s ratio, the better the brittleness of the rock, and the easier hydraulic fracturing is to form. Moreover, the smaller the difference between the maximum and minimum horizontal principal stresses, the easier it is to form hydraulic fracturing. On the contrary, the larger the difference in horizontal stress, the easier it is to form a single symmetrical double-wing slot.
To demonstrate the influence of differential stress on fracture propagation, this study used data obtained through well logging and conducted numerical modeling using Petrel software. The average Young’s modulus of the rock is 59.8 GPa, the average Poisson’s ratio is 0.29, the average uniaxial compressive strength is 59.98 MPa, the average uniaxial tensile strength is 6.78 MPa, the average cohesion is 11.48 MPa, the average internal friction angle is 44.51°, the average pore pressure is 1.74 MPa, the average maximum horizontal principal stress is 9.77 MPa, the average minimum horizontal principal stress is 8.13 MPa, the average vertical stress is 4.71 MPa, and the average pore pressure is 1.74 MPa. The simulation introduced the discrete fracture network (DFN) module, which directly incorporates randomly generated fracture segments to represent the fracture system. The generated fracture model is depicted in Figure 6. The model is based on the fault polygons of the horizontal sections of Tongshan from an elevation of 500 m to −600 m to establish the fault model. Taking the ground elevation as the top, from the elevation of 480 m to the elevation of −430 m, the horizon model was established with the elevation data of every 10 m, and a total of 92 zones were formed. For the construction of the grid model, the precision of the plane grid was 6×6 m, and the precision of the vertical grid was 10 m. The total grid was 8281625.
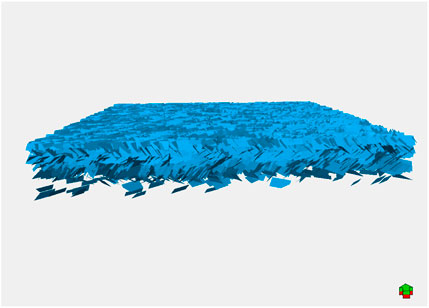
FIGURE 6. The fracturing model generated by DFN.
Two cases with differential horizontal stress of 0.35 MPa and 3.45 MPa were simulated separately, as shown in Figure 7. As seen in Figure 7A, when the differential horizontal stress is relatively small, hydraulic fracturing generates a larger fracture propagation area. In Figure 7B, it can be observed that when the differential horizontal stress is relatively large, hydraulic fracturing produces a smaller fracture propagation area.
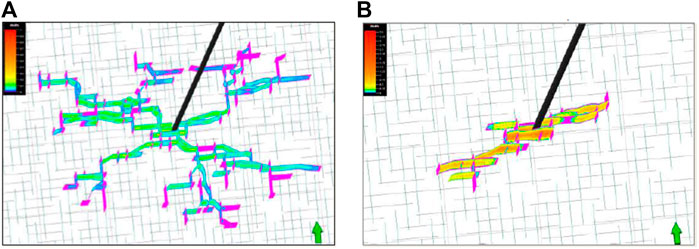
FIGURE 7. Numerical verification of the difference in stress between two directions (A) Horizontal stress difference = 0.35 MPa (B) Horizontal stress difference = 3.45 MPa.
When the difference in horizontal stress is ≤4 MPa or the coefficient of stress difference between the two directions is less than 0.3, the possibility of forming a hydraulic fracturing network is higher, as shown in Figure 8, where Kh is the coefficient of stress difference between the two directions. The expansion of hydraulic fracturing is mainly formed by the communication between artificial fractures and natural fractures, so the development degree and direction of natural fractures will affect the extension of artificial fractures and the formation of fracture networks.
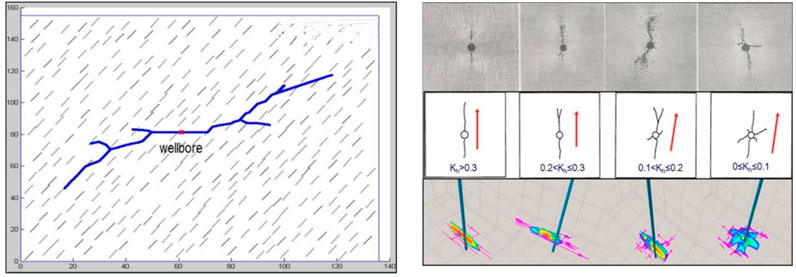
FIGURE 8. The relationship between the coefficient of bi-directional stress difference and fracture morphology.
The rock brittleness index of the Tongshan mine is 0.45, belonging to a medium preference brittle formation, and the fractures formed are between hydraulic fracturing and symmetrical double-wing fractures. The average horizontal stress difference is 1.64 MPa, which is less than 4 MPa. The coefficient of stress difference is about 0.18, which is less than 0.3, indicating a high possibility of hydraulic fracturing forming a fracture network. Moreover, logging fractures are relatively developed in some layers, with low-angle fractures, oblique intersection fractures, and high-angle fractures developed, which are easily activated and have the conditions to form hydraulic fracturing.
4 Materials and methods
4.1 True triaxial fracturing test
The test materials were taken from on-site rock samples, which were processed into four 300 mm×300 mm×300 mm core samples for fracturing. The maximum horizontal in situ stress of the rock samples was 9.59 MPa, the minimum horizontal in situ stress was 8.02 MPa, and the vertical stress was 8.47 MPa; moreover, the fluid environment was clean water, and the injection rate was 50 mL/min. The true triaxial fracturing test adopted the QKX-ZSZ-4000 rock mass true triaxial dynamic and static load test system (Figure 9).
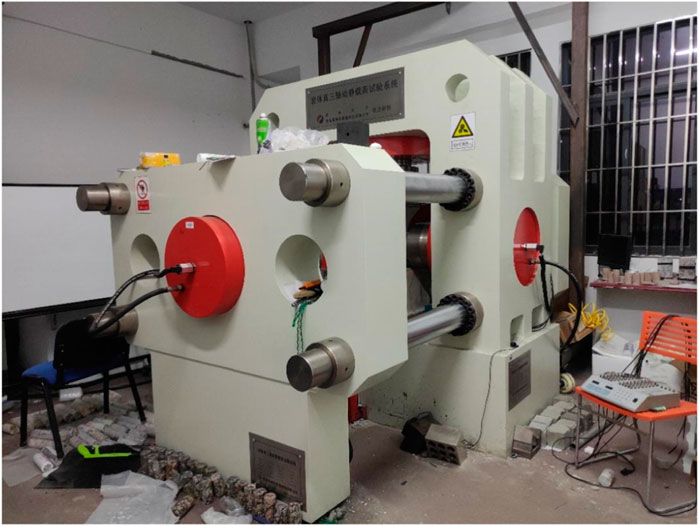
FIGURE 9. True triaxial dynamic and static load test system of QKX-ZZ-4000 rock mass.
4.2 Modeling methods
After undergoing complex geological changes such as sedimentation, diagenesis, and tectonic movements, the distribution patterns of underground strata become extremely intricate. It is very challenging to accurately comprehend the hidden and complex underground geological conditions. However, even in the most complex geological situations, the physical characteristics within a specific area are often determinable.
Deterministic modeling and stochastic modeling are two primary methods for three-dimensional geological modeling. Deterministic methods primarily use borehole data to perform mathematical interpolation for the unknown space between wells, and this interpolation is conducted through specific mathematical algorithms, resulting in a deterministic interpolation. Therefore, deterministic modeling produces a definite and unique three-dimensional model. Stochastic methods, on the other hand, primarily use known well data to stochastically simulate the unknown space between wells. Multiple stochastic simulation models are generated with equal probabilities, and the optimal solution is selected from among them. Deterministic modeling has the advantage of accuracy, but it can easily overlook small-scale spatial variations and struggles to capture spatial uncertainty. Stochastic modeling, on the other hand, introduces randomness during model creation, simulating random variations in the subsurface between wells. This approach adds geological significance to the modeling results, even though it inherently contains uncertainty. The sequential Gaussian simulation algorithm is the method used in stochastic modeling (Ferina, 2019). The distribution of ore bodies underground is complex and a result of various geological structural processes. Using both deterministic modeling and stochastic modeling can accurately simulate the three-dimensional spatial distribution of ore body physical properties.
The numerical model was modeled by the software Petrel. The specific modeling process involved using data from boreholes, well logs, Copper Mountain cross-sections, and the Copper Mountain II ore body model. Based on the fault polygons in the Copper Mountain cross-sections, fault pillars were created to establish the spatial distribution of faults in the mining area and develop a structural model. Using different elevation level cross-sectional ore body shapes from the Copper Mountain II ore body model, ore body shape trend surfaces were generated, and a deterministic modeling approach was used to create lithofacies attribute models. The sequential Gaussian simulation algorithm was employed to separately establish models for porosity and permeability. Fracture modeling was established by randomly modeling fractures based on imaging log fracture interpretation results to create a fracture model.
4.3 Modeling process
1) Structural model
The Copper Mountain II ore body is relatively irregular as a whole, appearing as a narrow and elongated strip on the plane, oriented at about 40° east–southeast, with a length of approximately 1820 m. Its vertical distribution extends from an elevation of +490 m above sea level to −430 m below sea level. The modeling encompassed both the mine pit and the Copper Mountain II ore body on the plane, resulting in a modeling plane boundary of 1.7 km×1.9 km. Faults were represented using a 6 m×6 m grid in the horizontal direction. In the vertical direction, the fracturing requirements dictated that the block size should be below 1.2 m, with the primary fracturing occurring between elevations of +180 and +350 m above sea level. Therefore, the grid subdivision in the target interval needed to be finer than 1.2 m.
The vertical grid resolution was designed with a gradient approach, where the target interval was subdivided at 1 m intervals, and the non-target intervals gradually coarsened to 2.5 m using 1-m fine subdivisions. The vertical grid subdivision method was carried out proportionally. The total grid dimensions were 27285775 grid cells. The constructed model is shown in Figure 10.
2) Lithofacies attribute model
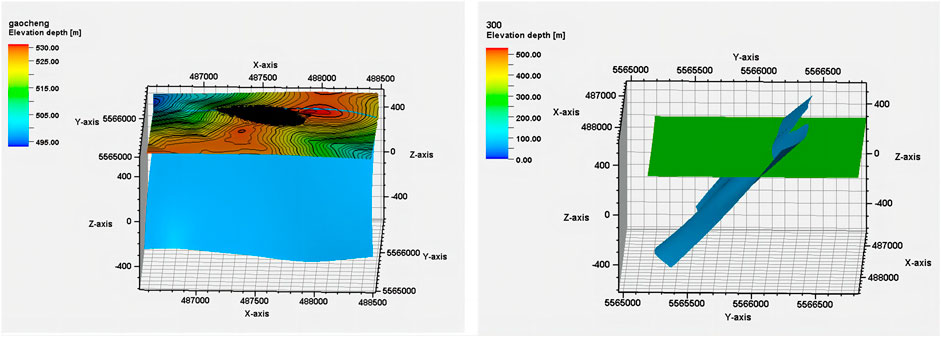
FIGURE 10. Structural model 3D view.
Copper ore primarily develops within andesite and tuff, and there is no significant difference in lithology from the rocks without copper ore; the difference lies only in the copper content. Therefore, when dividing lithofacies, a simplified approach was used, categorizing them into two lithofacies: ore body and surrounding rocks. Lithofacies were constrained by the plane distribution of the ore body in cross-sectional maps at different elevations. This was complemented with conventional well log data, including porosity, permeability, and density curves, which were normalized, outlier values and anomalies were removed, and the curves were sampled at grid points intersected by well trajectories. The sequential Gaussian simulation algorithm based on isotropic co-kriging was employed, with the variogram functions controlling attribute variations on the plane, ultimately leading to the establishment of the lithofacies attribute model. The constructed model is shown in Figure 11 and Figure 12.
3) Natural fracture model
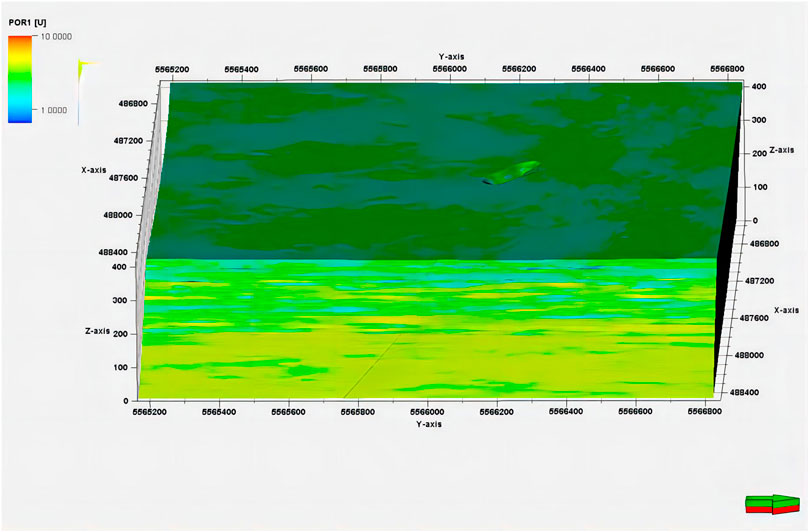
FIGURE 11. The established porosity model.
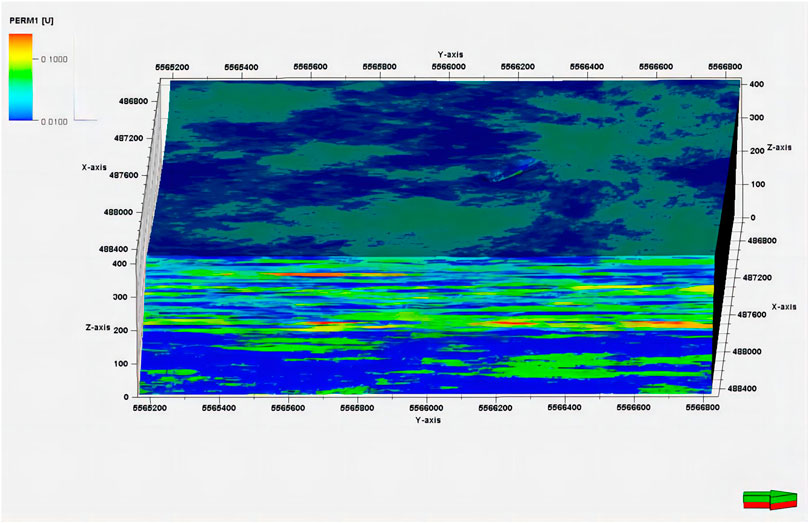
FIGURE 12. The established permeability model.
The fracture model was created using a stochastic modeling approach. This involved the analysis of prior fracture interpretation results in the mining area. Imaging data from drilling were utilized for borehole fracture interpretation, which included fracture dip, orientation, length, aperture, and fracture type. Based on this information, a fracture development intensity curve was generated. Finally, the fracture development intensity attribute was established using attribute-based stochastic modeling methods, and a discrete fracture network model was generated using the stochastic modeling approach. The constructed model is shown in Figure 13.
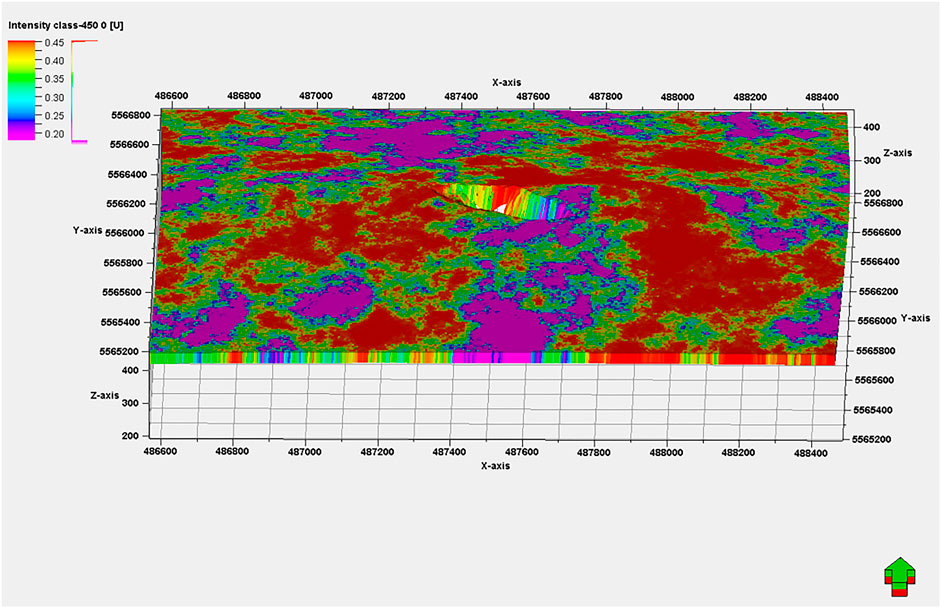
FIGURE 13. The established fracture intensity model.
5 Results and discussion
5.1 Cavability verification
The test results of the most representative core samples were selected for discussion. Core samples were taken from the field, and the stresses applied matched the on-site measurements, with horizontal principal stresses of 9.59 MPa and 8.02 MPa and a vertical stress of 8.47 MPa. The comparison before and after fracturing of the core samples is shown in Figure 14, and the curve variation of injection fracturing rate and time is shown in Figure 14. Before hydraulic fracturing of the sample, the integrity of end faces 1 and 2 was good, and no obvious fracture distribution was visible in the sample. After hydraulic fracturing in the test, obvious pressure fractures appeared on face 1 and face 2. Among them, the shape of the pressure fracture on end face 1 was relatively simple, while that on end face 2 was relatively divergent, indicating that in the true triaxial fracturing test, the fractures in the sample turned and spread along natural fractures. As can be seen from Figure 15, the curve of the injection pressure of the rock sample over time can be divided into three stages: the first stage is the fracture initiation stage, in which the injection pressure was 14.74 MPa. The second stage is the fracture initiation–gentle propagation stage, in which the injection pressure fluctuated steadily in the range of 9.20–15.11 MPa. The third stage is the slow fracture penetration stage, when the injection pressure slowly dropped to 7.64 MPa, and the fracture expanded to the rock face. This indicates that the ore body had good cavability, and the injection pressure was 14.74 MPa. The rock was broken, and the injection pressure was maintained between 9.00 and 15.00 MPa. There were obvious pressure fluctuations from fracture initiation to propagation, and the propagation direction of the reaction hydraulic fracturing diverged, forming a number of complex fractures.
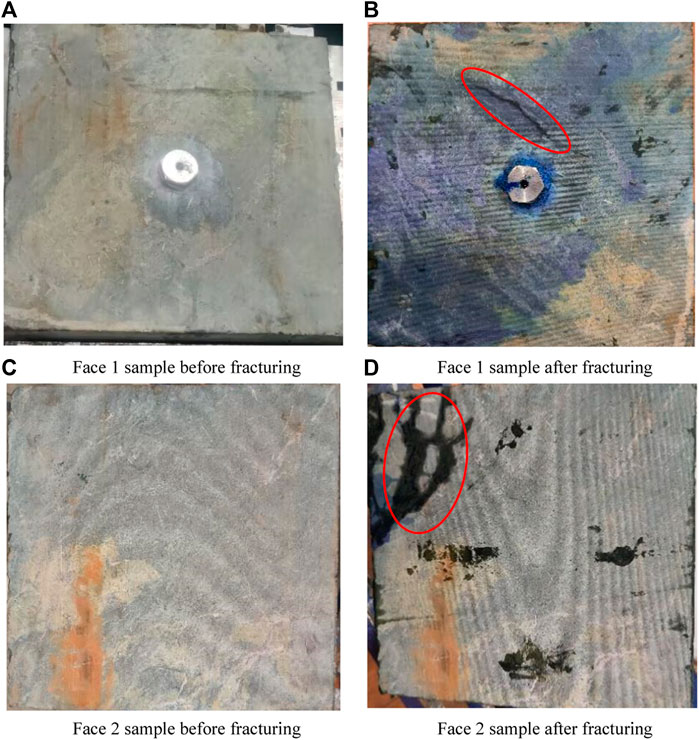
FIGURE 14. Comparison of rock samples before and after fracturing (A) Face 1 sample before fracturing (B) Face 1 sample after fracturing (C) Face 2 sample before fracturing(D) Face 2 sample after fracturing.
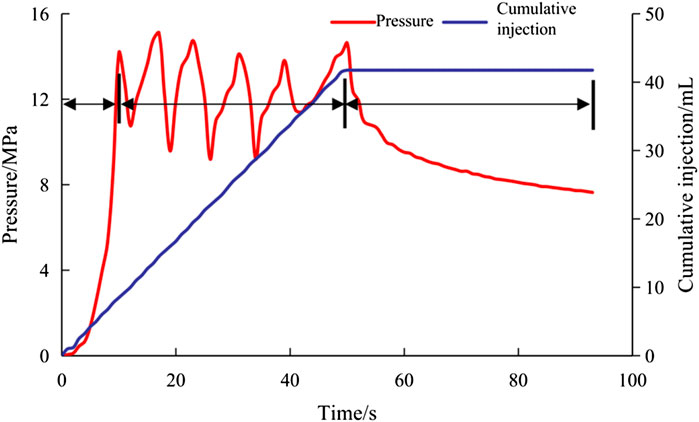
FIGURE 15. Variation of injection pressure with time in the process of fracture propagation of rock samples.
5.2 Influence of cluster number on hydraulic fracturing
The deep blue curve represents the wellbore trajectory (ZKYL-2), while the light blue curve represents the extended fractures. Under the conditions of a liquid volume of 400 m3 and section length of 20 m, the fracture propagation under the conditions of one cluster, two clusters, three clusters, and four clusters was simulated. The results are shown in Figure 16 and Figure 17. Under different cluster spacing conditions, certain hydraulic fracturing networks could be formed. The fracture radius was negatively correlated with the number of clusters and gradually decreased with the increase of the number of clusters. The average fracture radius was 151.1 m under the condition of one cluster and 61.4 m under the condition of four clusters. However, the fracture weakening area increased with the increase in the number of clusters. Under the condition of one cluster, the fracture weakening area was 10,012 m2, and under the condition of four clusters, the fracture weakening area was 12,866 m2, indicating that the volume reconstruction effect is good under the condition of multiple clusters. In other words, the smaller the fracture spacing, the more complex the ore body is cut and the larger the weakening volume is. However, when high-angle fractures are developed, the longitudinal connection can be achieved by activating natural fractures, even if the gap is large. The smaller the gap is, the more the overlap is. Therefore, in the strata with high-angle fractures, the fracture spacing can be appropriately increased, and in the strata without high-angle fractures, the fractures should be densely covered as far as possible.
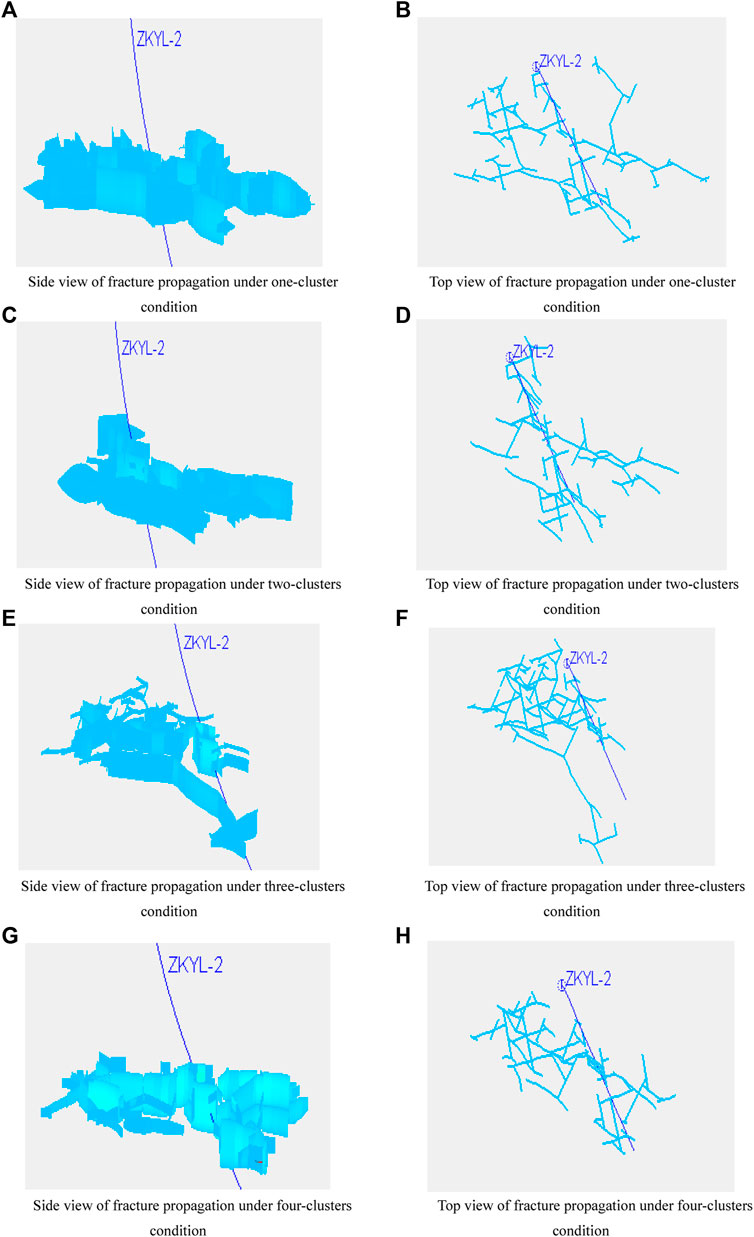
FIGURE 16. Hydraulic fracturing propagation under different cluster numbers (A) Side view of fracture propagation under one-cluster condition (B) Top view of fracture propagation under one-cluster condition (C) Side view of fracture propagation under two-clusters condition (D) Top view of fracture propagation under two-clusters condition (E) Side view of fracture propagation under three-clusters condition (F) Top view of fracture propagation under three-clusters condition (G) Side view of fracture propagation under four-clusters condition (H) Top view of fracture propagation under four-clusters condition.
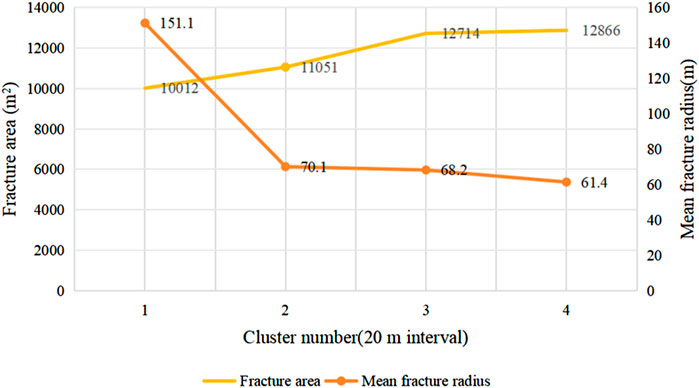
FIGURE 17. Fracture simulation results under different cluster numbers.
5.3 Influence of injecting rate on hydraulic fracturing
According to the conditions of 400 m3 liquid volume, 20 m section length, and three clusters, the fracture propagation was simulated under the conditions of 3 m3/min, 4 m3/min, 5 m3/min, and 6 m3/min. The results are shown in Figure 18 and Figure 19. The fracture weakening area increased with the increase of the injecting rate. Under the condition of 3.0 m3/min, the fracture weakening area was 12,242 m2, and under the condition of 6 m3/min, the fracture weakening area was 14,153 m2. In addition, the fracture radius increased first and then decreased. Under the condition of 3.0 m3/min rate, the average fracture radius was 72.8 m, and under the condition of 6.0 m3/min rate, the average fracture radius was 66.9 m. At the same time, Figure 20 shows that when the rate exceeded 4 m3/min, the net pressure exceeded 4 MPa, leading to a fracture direction transfer. When the rate exceeded 5 m3/min, the fracture area increased slowly. Therefore, when the injecting rate is between 4 and 5 m3/min, a better hydraulic fracturing weakening network can be formed.
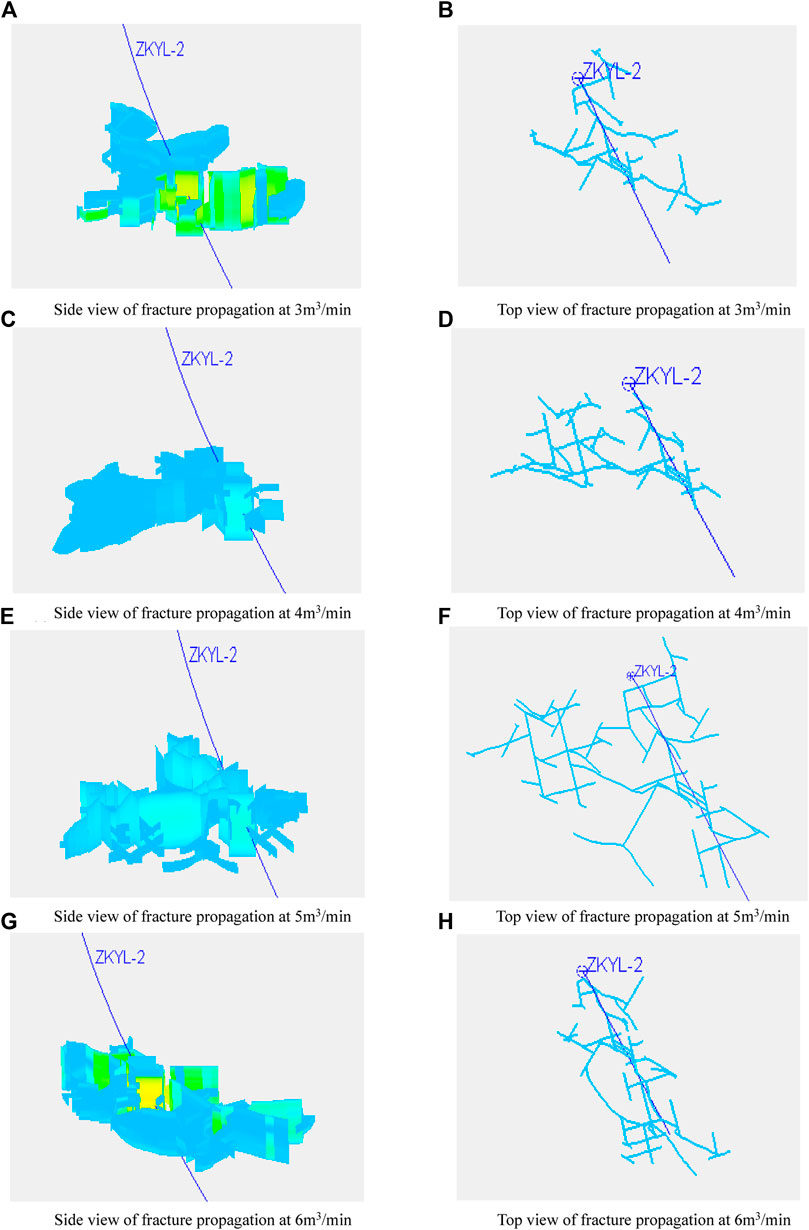
FIGURE 18. Hydraulic fracturing propagation under different rate conditions (A) Side view of fracture propagation at 3 m3/min (B) Top view of fracture propagation at 3 m3/min (C) Side view of fracture propagation at 4 m3/min (D) Top view of fracture propagation at 4 m3/min (E) Side view of fracture propagation at 5 m3/min (F) Top view of fracture propagation at 5 m3/min (G) Side view of fracture propagation at 6 m3/min (H) Top view of fracture propagation at 6 m3/min.
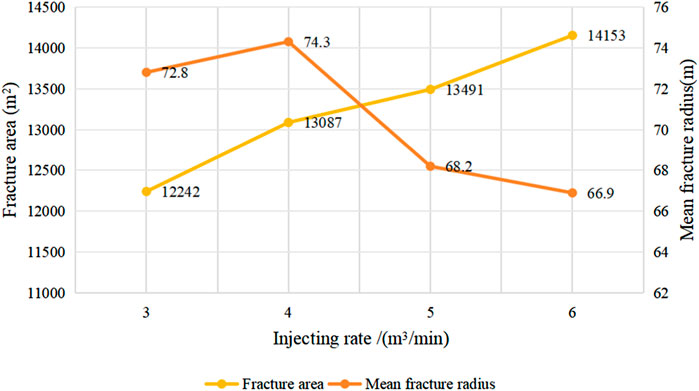
FIGURE 19. Fracture simulation results under different injecting rates.
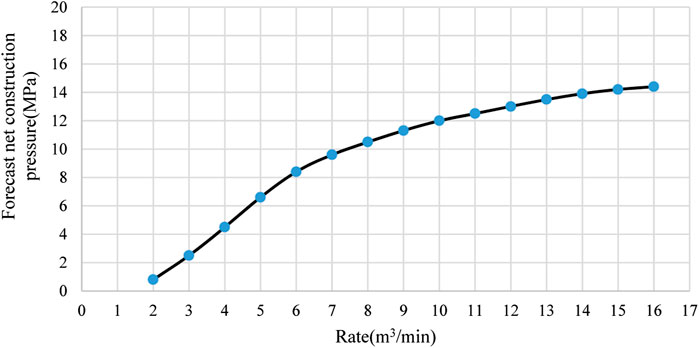
FIGURE 20. Static construction pressures under different injecting rate conditions.
5.4 Influence of liquid volume on hydraulic fracturing
When the hydraulic fracturing radius is 40–70 m, it brings about efficient weakening for hard rock masses. Under the condition of 40–70 m fracture radius, the fracture propagation under different injecting volume conditions was simulated, and the fracture propagation under the liquid volume of 350 m3, 400 m3, 450 m3, and 500 m3 was simulated. The results are shown in Figure 21 and Figure 22. It can be seen from the simulation results that the fracture weakening area and fracture radius increased with the increase of the liquid volume. When the liquid volume was 350 m3, the fracture weakening area was 10,962 m2, and the average fracture radius was 59 m. When the liquid volume was 500 m3, the fracture weakening area was 14,204 m2, and the average fracture radius was 73 m. According to the requirement of a 40–70 m fracture radius, the liquid volume of a single section can meet the requirements of hydraulic fracturing weakening in hard rock mines at 350–450 m3.
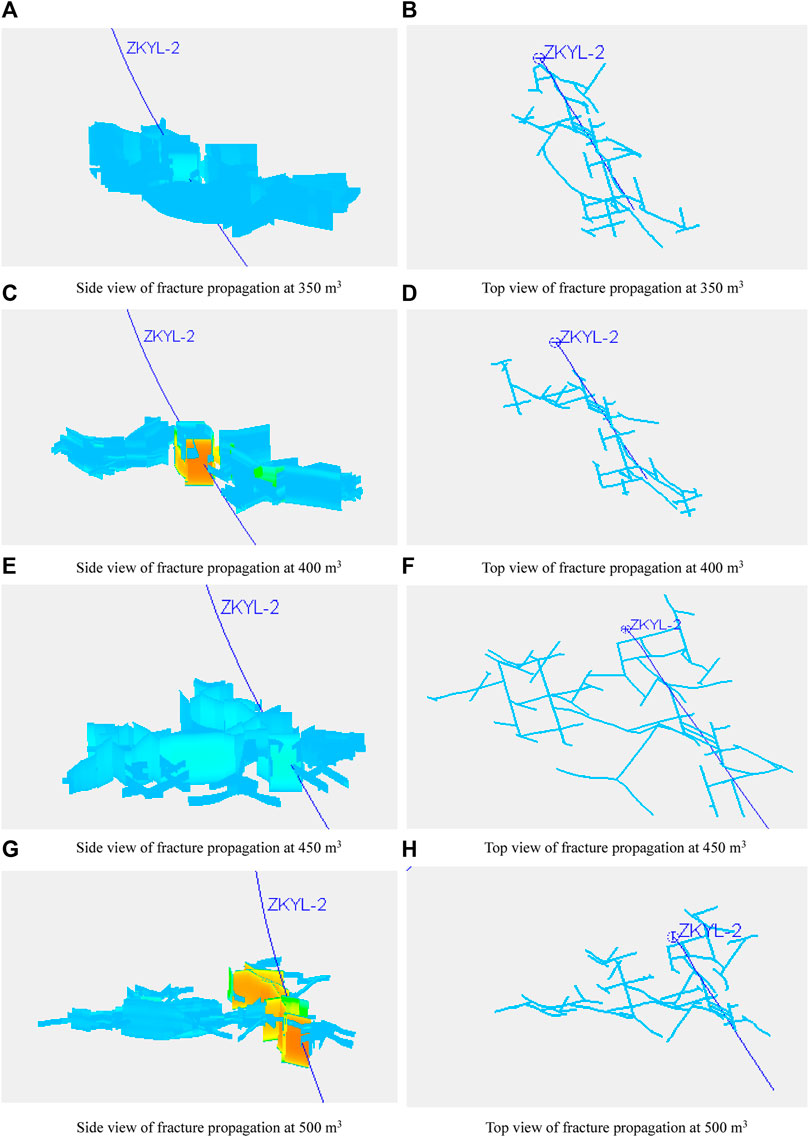
FIGURE 21. Hydraulic fracturing propagation under different liquid injecting volumes (A) Side view of fracture propagation at 350 m3 (B) Top view of fracture propagation at 350 m3 (C) Side view of fracture propagation at 400 m3 (D) Top view of fracture propagation at 400 m3 (E) Side view of fracture propagation at 450 m3 (F) Top view of fracture propagation at 450 m3 (G) Side view of fracture propagation at 500 m3 (H) Top view of fracture propagation at 500 m3.
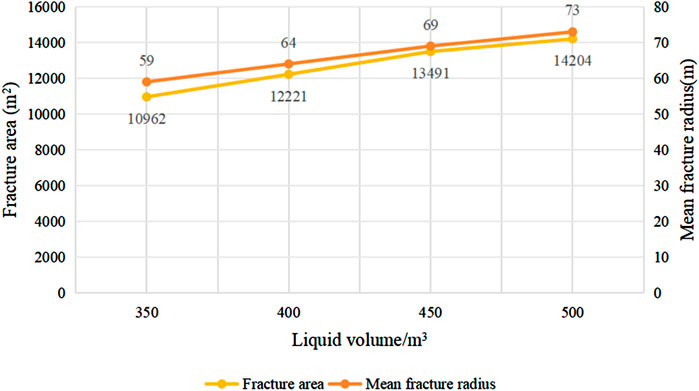
FIGURE 22. Fracture simulation results under different injecting volumes.
5.5 Field test and monitoring
According to the optimization results, the hydraulic fracturing produced under the conditions of four clusters, 4 m3/min displacement, and 500 m3 liquid volume has the best effect. Considering the complex factors in the field, the parameters of the on-site hydraulic fracturing wells are shown in Table 2, the on-site hydraulic fracturing results are shown in Table 3, and the inversion results are shown in Figure 23 through the numerical model. It can be seen from the figure that the hydraulic fracturing propagation is ideal. The effect of hard rock weakening caused by artificial fractures and natural fractures can be realized.
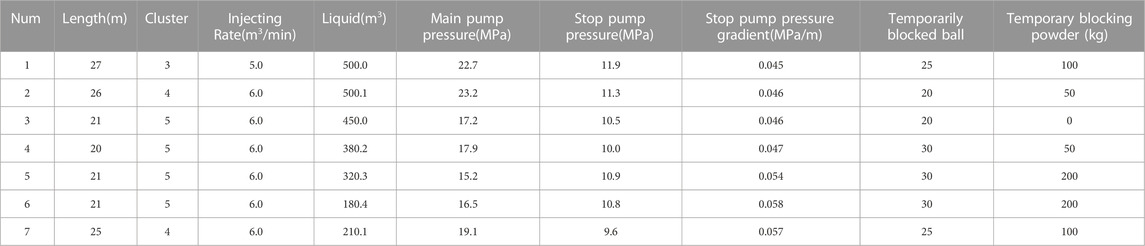
TABLE 2. Hydraulic fracturing well parameters.
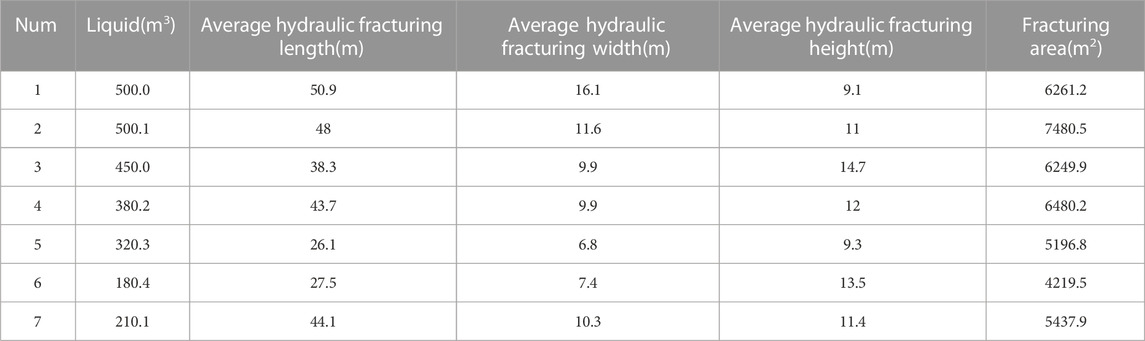
TABLE 3. Inversion of hydraulic fracture parameters after on-site fracturing.
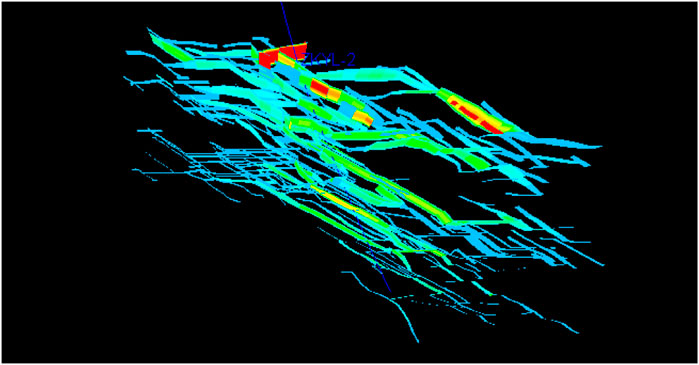
FIGURE 23. Numerical inversion of hydraulic fracturing.
Electromagnetic radiation will be released during the deformation and fracture of rock mass under load. The intensity, energy, and pulse of electromagnetic radiation are closely related to the load condition and deformation and fracture of rock mass. The electromagnetic radiation monitored technology can measure the propagation of hydraulic fracturing wells.
The comparison between the simulation results and electromagnetic monitored results is shown in Table 4. From Table 4, it can be observed that the electromagnetic monitored results are slightly smaller than the simulation results. This may be due to the fact that the wide-range electromagnetic monitoring primarily detects the locations affected by the liquid, but in cases with very small liquid volumes and extremely narrow and shallow fractures, it may be interpreted as the artificial fractures not being affected.
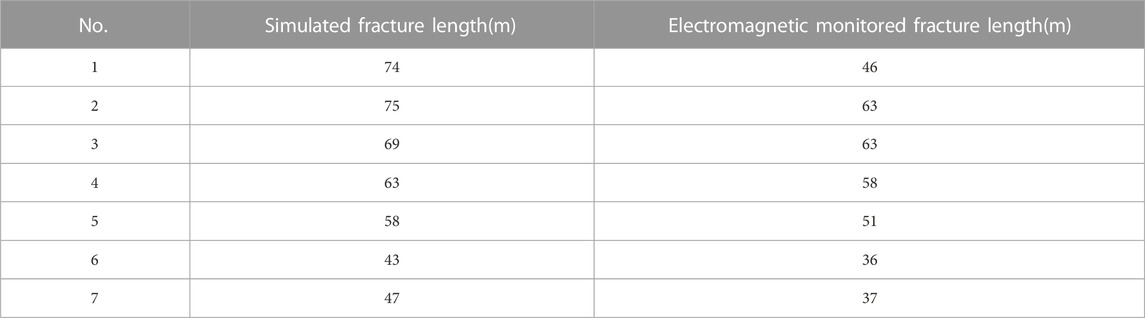
TABLE 4. Comparison of simulation and electromagnetic monitored results.
The electromagnetic monitored results are shown in Figure 24. The main fractures diverging along the wellbore were mainly distributed in the near east–west direction, and the east–west direction was the dominant expansion direction. The expansion speed in other areas was slow, and no obvious new main fractures were produced in the middle and late period. The direction of the maximum principal stress in the mine area was near east–west, so it can be seen that the pressure fracture tended to expand along the direction of the maximum horizontal principal stress. In addition, in the initial stage of fracturing, the swept area per square liquid volume was the smallest, while the swept length per square liquid volume was the largest, indicating that the influence of each square liquid volume on the length was far greater than the impact on the area, and the main fractures were concentrated in this stage. At the same time, the wide-area electromagnetic fracture monitoring shows that the hydraulic fracturing extended in multiple directions, the extension direction diverged, and the hydraulic fracturing complexity was high, thus realizing the weakening of the ore body.
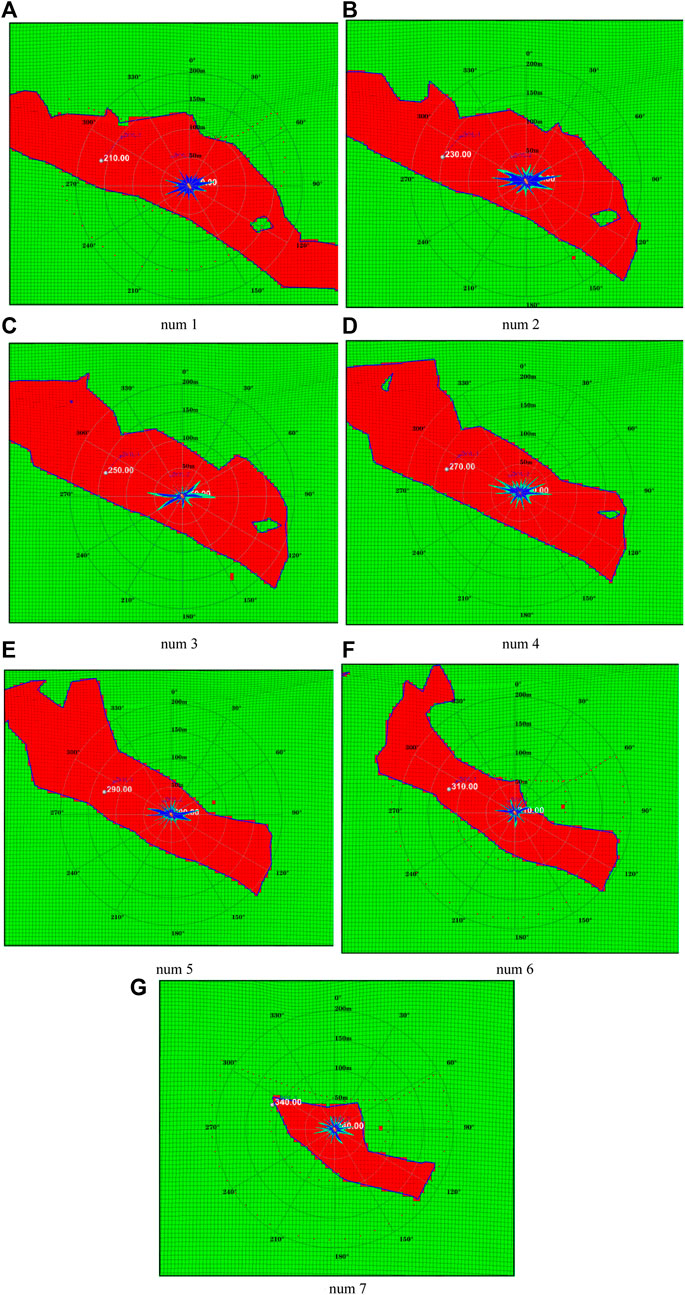
FIGURE 24. Distribution map of superimposed copper deposits in the electromagnetic monitoring range of the fracturing section (A) num 1 (B) num 2 (C) num 3 (D) num 4 (E) num 5 (F) num 6 (G) num 7.
6 Conclusion
(1) The true triaxial fracturing test directly indicates the fracture distribution of the end faces of the sample before and after hydraulic fracturing, and the cavability of hard rock masses based on the curve of the injection pressure changing with time is discussed. The results show that after hydraulic fracturing, there are obvious pressure fractures extending along natural fractures on the end face of the sample. Moreover, the curve of injection pressure over time can be divided into three stages: the first stage is fracture initiation, the second stage is fracture initiation and gentle propagation, and the third stage is slow fracture penetration and fracture extension to the end face of the rock. When the injection pressure is 14.74 MPa, the rock is fractured, and multiple complex fractures are formed from fracture initiation to expansion, which indicates that the ore body has good cavability.
(2) Through numerical simulation of hydraulic fracturing, the influences of cluster number, injecting rate, and liquid volume on hydraulic fracturing in hard rock mines are discussed. The results show that the fracture radius is negatively correlated with the number of clusters and gradually decreases with the increase of the number of clusters. The average fracture radius is 151.1 m under the condition of one cluster and 61.4 m with four clusters. However, the fracture weakening area increases with the increase of cluster number; the fracture weakening areas are 10,012 m2 and 12,866 m2 for one cluster and four clusters, respectively. The fracture weakening areas increase with the increase of injecting rates, which are 12,242 m2 and 14,153 m2 under the conditions of 3.0 m3/min and 6 m3/min, respectively. In addition, the fracture radius increases first and then decreases, which is characterized by a 72.8 m fracture radius with 3.0 m3/min and 66.9 m with a 6.0 m3/min injecting rate. The fracture weakening area and fracture radius increase with the increase of liquid volume. When the liquid volume is 350 m3, the fracture weakening area is 10,962 m2, and the average fracture radius is 59 m. When the liquid volume is 500 m3, the fracture weakening area and fracture radius increase to 14,204 m2 and 73 m, respectively.
(3) Based on the simulation optimization results, it is suggested that when adopting the hydraulic fracturing preconditioning in hard rock mines, the fracture spacing can be appropriately increased in the strata with high-angle fractures, and the dense fractures can be added in the strata without high-angle fractures. Moreover, 20–30 m interval can be adopted to realize the close cutting of multiple clusters. When the injecting rate exceeds 4 m3/min, it tends to fulfill the fracture direction transfer. When the rate exceeds 5 m3/min, the fracture area increases slowly. The injection rate in the range of 4 and 5 m3/min is beneficial to form a better complex fracture network.
(4) The optimized parameters are four clusters, injecting rate at 4 m3/min, and liquid volume at 500 m3. On this basis, on-site experiments were conducted and monitored through electromagnetic methods. The monitored results show that hydraulic fracturing extends in multiple directions, the extension direction diverges, and the hydraulic fracturing complexity is high, which realizes the weakening of the ore body. The optimized parameters can effectively achieve the expansion of hydraulic fracturing and achieve the goal of weakening hard rock.
Data availability statement
The original contributions presented in the study are included in the article/Supplementary material, further inquiries can be directed to the corresponding author.
Author contributions
MH: Conceptualization, Project administration, Software, Writing–review and editing. SC: Data curation, Validation, Visualization, Writing–original draft, Writing–review and editing. MqH: Formal Analysis, Supervision, Writing–original draft, Writing–review and editing. WX: Formal Analysis, Investigation, Supervision, Writing–review and editing.
Funding
The author(s) declare that no financial support was received for the research, authorship, and/or publication of this article.
Conflict of interest
Authors HM and CS were employed by Zijin Mining Group Co., Ltd.
The remaining authors declare that the research was conducted in the absence of any commercial or financial relationships that could be construed as a potential conflict of interest.
Publisher’s note
All claims expressed in this article are solely those of the authors and do not necessarily represent those of their affiliated organizations, or those of the publisher, the editors and the reviewers. Any product that may be evaluated in this article, or claim that may be made by its manufacturer, is not guaranteed or endorsed by the publisher.
References
As, A. V., and Jeffrey, R. (2004). Hydraulic fracturing used to precondition ore and reduce fragment size for block caving. Proc. Massmin 2004, 535–541.
Bao, L., Yan, J., and Mian, C. (2019). Influence of vugs in fractured-vuggy carbonate reservoirs on hydraulic fracture propagation based on laboratory experiments. J. Struct. Geol. 124, 143–150. doi:10.1016/j.jsg.2019.04.007
Bo, Z., Yao, L., Xue, Y., Shu, L., Chao, W., and Songa, J. (2023). Influence of size and location of a pre-existing fracture on hydraulic fracture propagation path. Geomechanics And Eng. 32 (3), 321–333. doi:10.12989/gae.2023.32.3.321
Brown, E. T. (2007). Block caving geomechanics. Indooroopilly, Australia, Julius Kruttschnitt Mineral Research Centre.
Catalan, A., Dunstan, G., and Morgan, M. (2016). Intensive preconditioning methodology developed for the Cadia East panel cave project, NSW, Australia. Proc. Massmin 2016, 1–5.
Chacon, E., Barrera, V., and Jeffrey, R. (2004). Hydraulic fracturing used to precondition ore and reduce fragment size for block caving. Proc. Massmin 2004, 529–534.
Chen, W., Liu, J., Peng, W., Zhao, Y., Luo, S., Wan, W., et al. (2023a). Lateral deformation and acoustic emission characteristics of dam bedrock under various river flow scouring rates. J. Mater. Res. Technol. 282, 3245–3271. doi:10.1016/j.jmrt.2023.08.050
Chen, W., Liu, J., Peng, W., Zhao, Y., Luo, S., Wan, W., et al. (2023b). Aging deterioration of mechanical properties on coal-rock combinations considering hydro-chemical corrosion. Energy 282, 128770. doi:10.1016/j.energy.2023.128770
Ferina, S., and Mohammad, A. (2019). Application of concentration-area fractal method in static modeling of hydrocarbon reservoirs. J. Petroleum Explor. Prod. Technol. 9 (2), 1197–1202. doi:10.1007/s13202-018-0554-0
Guang, L., Yu, L., Xiao, C., Xiao, C., Rao, S., Wen, L., et al. (2020). A study on the expansion of fractures in pretreated ores and rocks induced by water pressure in qianyanshan Iron mine. China Mine Eng. 49 (3), 20–25. doi:10.19607/j.cnki.cn11-5068/tf.2020.03.006
He, Q., Suorineni, F. T., and Oh, J. (2017). Strategies for creating prescribed hydraulic fractures in cave mining. Rock Mech. rock Eng. 50 (4), 967–993. doi:10.1007/s00603-016-1141-7
Im, H., Jang, H., Topal, E., and Nehring, M. (2022). Long and short-term strategies for estimation of hydraulic fracturing cost using fuzzy logic. Minerals 12 (6), 715. doi:10.3390/min12060715
Jun, Z., Yu, J., Fei, T., Jiahe, L., and Qiang, Z. (2021). Complex hydraulic-fracture-network propagation in a naturally fractured reservoir. Comput. And Geotechnics 135, 104165. doi:10.1016/j.compgeo.2021.104165
Kui, Z., Jie, J., Kang, Z., Yu, R., and Xiao, W. (2005). Experimental study on determining uniaxial compressive strength of rock using point load index. Min. Res. Dev. 26, 32–33. doi:10.13827/j.cnki.kyyk.2005.06.012
Laubscher, D. H. (2000). Block caving manual, prepared for international caving study. Brisbane, Australia: JKMRC and Itasca Consulting Group, Inc.
Leiva, C. E., and Duran, I. (2003). Pre-caving, drilling and blasting in the esmeralda sector of the El teniente mine. Fragblast 7 (2), 87–104. doi:10.1076/frag.7.2.87.15896
Rafiee, R., Ataei, M., KhalooKakaie, R., Jalali, S. E., Sereshiki, F., and Noroozi, M. (2018). Numerical modeling of influence parameters in cavabililty of rock mass in block caving mines. Int. J. rock Mech. Min. Sci. 105, 22–27. doi:10.1016/j.ijrmms.2018.03.001
Rong, H., Feng, R., Bao, T., Yang, L., Yu, F., and Ying, H. (2017). On induced collapse and natural collapse. Metal. Mine 3, 9–14. doi:10.3969/j.issn.1001-1250.2017.03.002
Shakib, J. T., Ghaderi, A., and Shahri, A. A. (2012). Analysis of hydraulic fracturing in fractured reservoir: interaction between hydraulic fracture and natural fractures. Life Sci. Journal-acta Zhengzhou Univ. Overseas Ed. 9 (4), 1854–1862.
Someehneshin, J., Oraee-Mirzamani, B., and Oraee, K. (2015). Analytical model determining the optimal block size in the block caving mining method. Indian Geotechnical J. 45 (2), 156–168. doi:10.1007/s40098-014-0119-1
Wei, C., Zhang, B., Li, Sc., Fan, Zx., and Li, C. X. (2021). Interaction between hydraulic fracture and pre-existing fracture under pulse hydraulic fracturing. Spe Prod. Operations 36 (3), 1–19. doi:10.2118/205387-PA
Yu, L. (2020). Block caving mining theory and technology. Dongcheng, China, Metallurigcal Industry Press.
Yu, L., Wen, L., Xiao, C., Chang, X., Wen, F., and Xiu, G. (2018). Research on rock pretreatment technology in block caving mining of hard rock metal mines. China Mine Eng. 47 (3), 59–63. doi:10.19607/j.cnki.cn11-5068/tf.2018.03.018
Yu, L., Wen, L., Xin, W., Chang, X., Kai, B., Yan, W., et al. (2022). Hydraulic fracturing rock pretreatment technology and its application in natural caving mines. China Mine Eng. 51 (3), 26–32. doi:10.19607/j.cnki.cn11-5068/tf.2022.03.011
Yu, L., Xiao, C., Hua, P., Guang, L., Xiao, C., Wen, L., et al. (2020). On site experimental study on hydraulic fracturing of hard rock metal ore and rock pretreatment. China Mine Eng. 49 (2), 1–4. doi:10.19607/j.cnki.cn11-5068/tf.2020.02.001
Yue, L., Xian, Z., Xian, P., Ye, Z., Hong, C., and Jian, H. (2022). Influence of natural fractures on propagation of hydraulic fractures in tight reservoirs during hydraulic fracturing. Mar. And Petroleum Geol. 138, 105505. doi:10.1016/j.marpetgeo.2021.105505
Keywords: hydraulic fracturing, block caving, fractures, numerical simulation, electromagnetic monitoring
Citation: Min H, Sijie C, Mingqing H and Xiaojun W (2023) Preconditioning optimization of hydraulic fracturing in block caving of hard rock mass. Front. Earth Sci. 11:1287210. doi: 10.3389/feart.2023.1287210
Received: 01 September 2023; Accepted: 04 December 2023;
Published: 29 December 2023.
Edited by:
Yong Wang, Southwest Petroleum University, ChinaReviewed by:
Guofa Ji, Yangtze University, ChinaWen Wan, Hunan University of Science and Technology, China
Copyright © 2023 Min, Sijie, Mingqing and Xiaojun. This is an open-access article distributed under the terms of the Creative Commons Attribution License (CC BY). The use, distribution or reproduction in other forums is permitted, provided the original author(s) and the copyright owner(s) are credited and that the original publication in this journal is cited, in accordance with accepted academic practice. No use, distribution or reproduction is permitted which does not comply with these terms.
*Correspondence: Huang Mingqing, c2VhbmdvQGZ6dS5lZHUuY24=