 Xingui Zhou
 Zhongbao Ye2
- 1CAS Key Laboratory of Mechanical Behavior and Design of Materials, University of Science and Technology of China, Hefei, China
- 2Anhui Province Key Laboratory of Building Structure and Underground Engineering, Anhui Jianzhu University, Hefei, China
To fulfill the requirement for deformation measurement within the failure area during rock failure, a newly developed digital image algorithm, known as the corner correlation method, was implemented. A corner correlation measurement system was established by utilizing a Split Hopkinson Pressure Bar (SHPB) and a high-speed camera. The study focused on monitoring the deformation and failure characteristics of sandstone samples under dynamic loading. The results show that the corner correlation method has its unique advantages in rock dynamic mechanics experiments, and can obtain the deformation of the failure region during the rock failure process. Specifically, the initiation, extension, and contraction processes of surface cracks on sandstone were examined. Parameters such as crack width, width propagation rate, and extension shrinkage rate were measured. The entire crack development process was analyzed, including crack width, crack initiation point, crack extension and contraction trajectory, elongation and contraction velocity, width expansion rate, and longitudinal crack penetration, which were obtained at any given time on the surface of the rock sample. Additionally, the attenuation law of stress, characterized by an exponential decay of the stress peak value, was obtained through numerical simulation using a similar model.
1 Introduction
As a natural brittle material, rock is interleaved with cracks, joints, faults and other structural planes of different scales, resulting in complex mechanical responses of rock mass. The deterioration and structural failure of rocks are closely related to the tiny cracks inside them, which will expand and extend when affected (Tian, 2021; Guo, 2022). Experimental research on rock fracture is crucial to the observation of rock force deformation. From a relatively limited perspective, we gain insight into the interaction among defects in rock masses. This understanding significantly aids in evaluating the mechanical behavior of engineering rock masses, ensuring slope stability, designing mining engineering projects, predicting water flow in fractured rock masses, and formulating tunnel support designs, among other engineering challenges (Zhang and Zhao, 2013; Dai et al., 2021; Oparin, 2022; Chen et al., 2023; Chu et al., 2023). On a broader scale, in order to better understand the causes of earthquakes (Zhang Y. B. et al., 2021), it is particularly important for geologists to understand the compressive deformation of continental plates, and the surface deformation of brittle materials is of great help to this. Describing the entire process of crack initiation, propagation, and cessation is the central challenge in rock failure. Therefore, real-time monitoring of crack evolution during rock loading holds paramount importance.
At present, domestic and foreign scholars have conducted extensive research on surface crack propagation during rock failure and obtained many valuable research results (Wang et al., 2016; Zhao et al., 2018a; Liu et al., 2018; Xing et al., 2018; Wei et al., 2019; Liu et al., 2020; Xi et al., 2020; Li et al., 2021a; Zhang et al., 2021b; Jin et al., 2021; Sikka et al., 2021; Zhou et al., 2022a; Hu et al., 2022; Liu et al., 2022; Pan and Wang, 2022; Wu et al., 2022; Gong et al., 2023; Zhang et al., 2023). With the rapid advancement of computer technology, numerical simulation has emerged as a crucial tool for effectively addressing complex issues in rock engineering. Common numerical simulation methods for fracture treatment include Discontinuous Deformation Analysis (DDA), the Discrete Element Method (DEM), and the Finite Element Discrete Element Coupling Method (FDEM). Presently, FDEM stands as a relatively mature numerical simulation method that combines the advantages of both continuum and discontinuum methods, enabling the accurate simulation of block fracture and movement during rock failure. EarE. Knight and Esteban Rougier have utilized FDEM to simulate rock impact experiments with random cracks, investigating the influence of cracks on rock mechanical behavior and failure path (Rougier et al., 2014; Chau et al., 2020). Their innovations in FDEM theory and algorithm have led to its widespread application across various projects (Knight et al., 2020; Munjiza et al., 2020).
Zhang Ya-bin studied the crack propagation law of rocks with prefabricated cracks under cyclic impact by numerical simulation, and obtained the relationship between the peak failure strength of rocks and the angle and number of prefabricated cracks (Zhang et al., 2021c). Song Yi-min carried out a quantitative study on rock displacement field evolution and crack dynamic fracture parameters under impact load using a drop hammer impact testing machine and a digital speckle correlation method, and obtained the relationship between the stress intensity factor at the crack tip and crack propagation (Song et al., 2015). Pan Hong-yu studied the global strain field of rock mass under uniaxial compression by using the correlation method of digital images, and analyzed the law of crack propagation during the loading process of rock mass (Pan et al., 2018). Alneasan used HDDM to evaluate the validity of classical fracture criteria to predict the crack growth path of infinite internal cracks under I-II composite loading (Alneasan et al., 2020). Li conducted uniaxial compression experiments on prefabricated rock-like specimens with different types of defects, and obtained the crack initiation sequence, propagation phenomenon and failure mode of different defective rock-like specimens (Li et al., 2021b). Zhao Chen employed DIC technology to obtain the global strain field of the specimens. Through quantitative analysis at the mesoscopic level, the law of crack initiation and propagation, as well as the evolution characteristics of rock deformation and damage, were summarized (Zhao et al., 2015; Zhao et al., 2018b). Guo Wei-yao monitored the entire crack propagation process using acoustic emission (AE) and digital image correlation (DIC) techniques. The influence of loading rate on the mode-I crack propagation mechanism was investigated (Guo et al., 2023). The aforementioned research findings hold significant importance in comprehending the dynamic failure characteristics of rocks. Particularly, digital image correlation technology (DIC) has garnered increasing attention and experimentation by researchers. It is evident that DIC technology is primarily utilized for measuring strain and displacement fields in static rock tests. However, severe damage to the speckle field on the model’s surface poses substantial challenges for DIC technology in matching relevant sub-regions. Previous studies have predominantly concentrated on the causes and influencing factors of crack initiation and propagation in rocks, with limited reporting on the specific crack propagation process and failure characteristics during dynamic failure. Hence, investigating the dynamic evolution characteristics of rock cracks in dynamic tests holds immense significance.
The study of stress wave attenuation law is of great significance to the application of seismic exploration, underground engineering, geotechnical engineering and so on. Feng Xiao-jun utilized COMSOL Multiphysics to establish six 3D models in order to investigate the impact of two preexisting faults with different orientations on the propagation process of explosion-induced stress waves and their reflection effect. The interactive effect between faults of varying sizes was also examined, taking into account the propagation process of stress waves (Feng et al., 2019). Li Di-yuan conducted dynamic impact tests on red sandstone specimens with a single bonded planar joint at various angles, using a split Hopkinson pressure bar (SHPB). The objective was to analyze the stress wave propagation and fracturing evolution of specimens consisting of two blocks. The findings indicate that the presence of a bonded joint leads to a reduction in dynamic strength ranging from 3.10% to 32.13% compared to intact specimens (Li et al., 2019). Therefore, understanding the attenuation law of stress waves in the medium holds significance in providing a theoretical basis for underground structure detection and geological disaster prediction in seismic exploration. Furthermore, it can offer guidance for addressing engineering concerns such as vibration control and seismic safety assessment in underground projects.
This paper presents the development of a novel measurement system that combines the SHPB test device, a high-speed camera, and a self-improved digital image algorithm called the corner correlation method. An impact compression experiment is conducted on a complete rock sample, and the images captured during the experiment are processed and analyzed using the developed algorithm. The algorithm is utilized to analyze the dynamic evolution of cracks on the rock surface, while numerical simulations are employed to study the propagation of stress waves in rock. This comprehensive approach provides an effective means for studying the mechanisms of rock deformation and failure on both macro and micro scales, offering valuable insights for underground engineering design and construction.
2 Corner correlation method
Our research group has developed a novel digital image algorithm-corner correlation method in the previous work. Combining the corner extraction and digital image correlation method, this method first detects the integral pixel displacement of corner through the Harris algorithm (Harris and Stephens, 1988), and then the Newton iteration method (Bruck et al., 1989) is used to obtain the subpixel displacement after the initial integral pixel corner deformation, finally obtaining the displacement field of the measured object surface. The full-field strain is calculated based on the local least squares fitting of displacement field proposed by Pan Bin (Pan, 2007). In the preliminary work, numerical simulation test, static tensile test and dynamic uniaxial compression test were used to evaluate and verify the calculation accuracy of diagonal corner correlation algorithm. It was concluded that the displacement field of Newton iteration method was smoother and the calculation accuracy was optimal, and its accuracy was controlled below 0.01 pixel in 0.1–0.9 pixel displacement mode. The strain field is measured with the displacement field obtained by Newton iteration method, and the maximum error of strain is controlled within 2 × 10⁻⁴. By comparing the calculated values of the corner correlation method in static tensile test and dynamic uniaxial compression test with those measured by the strain gauge, the resolution of the strain measurement system is in the order of 10–4. The deformation field of the failure region can still be calculated when complex failure occurs on the surface of the model. The calculation error of the cross-crack speckle plot and the corner plot is compared, and the calculation error of the corner plot of transverse and longitudinal cracks is smaller than that of the speckle plot. The result as shown in Figure 1. The detailed introduction and accuracy evaluation of the corner correlation method can be found author’s article (Zhou et al., 2022b).
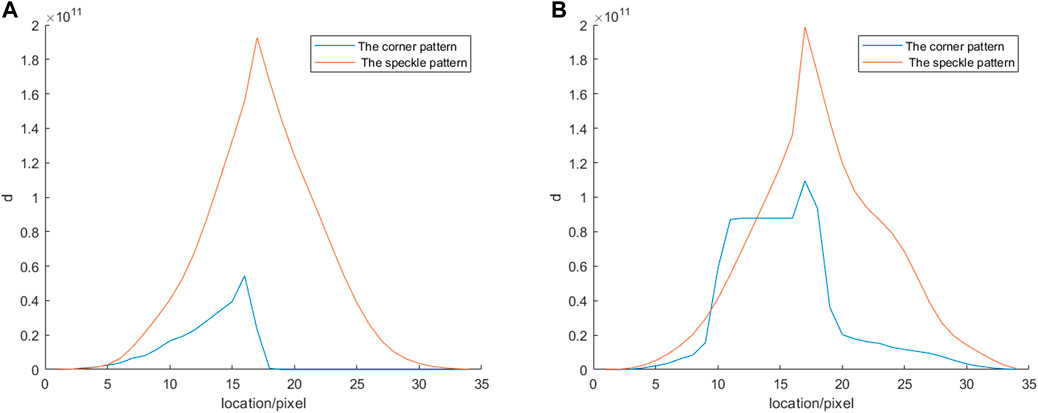
FIGURE 1. Curve of the relationship between crack position and error (Zhou et al., 2022b). (A) Longitudinal crack (B) Transverse crack.
3 Sample preparation and experimental setup
3.1 Sample preparation
The sandstone samples were taken from a mine in Sichuan, China. Thin section identification and scanning electron microscope analysis were conducted on the sandstone samples. The sandstone was mainly composed of clay, orthoclase, gypsum, plagioclase, quartz, calcite, and dolomite. The particles consist primarily of minerals like quartz and feldspar, exhibiting distinct cleavage development on the surface of the feldspar particles and a high degree of self-filling of chlorite between the particles. To ensure the reliability of the constitutive model in numerical analysis, strain gauges were affixed to the specimen. Additionally, the development process of surface cracks in rock was monitored using the corner correlation method. Cuboid sandstone samples with dimensions of 50 mm × 50 mm × 250 mm were prepared, adhering strictly to the test standards of rock mechanics. The parallelism and flatness of the sample’s cross section were carefully maintained, as depicted in Figure 2A. Grid marks in the form of spray paint points were arranged on the sample, with 4 rows and 25 columns of 5 mm × 5 mm grids placed on the shooting surface. Along the longitudinal symmetry axis, 25 strain gauges were applied to the rear surface of the rock, with each strain gauge corresponding to a specific grid. The strain gauge model employed was BE120-3AA, featuring dimensions of 6.4 mm × 3.5 mm and a resistance of 120 ± 0.1 Ω, as illustrated in Figure 2B.
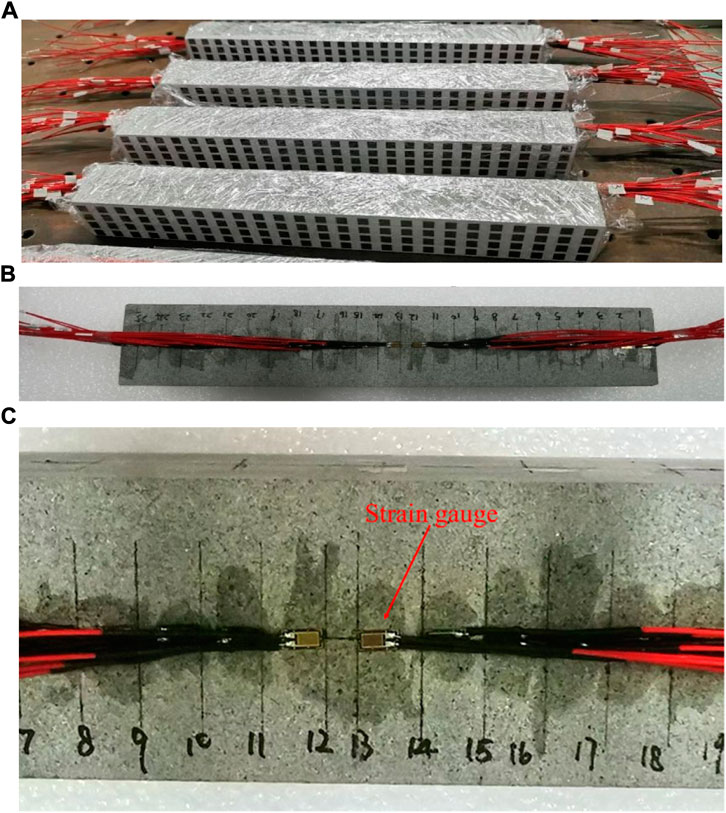
FIGURE 2. Rock sample. (A) Rock sample (B) Diagram of strain gauge adhesive position (C) Zoom of strain gauge.
3.2 Experimental system and scheme
The rock sample underwent a uniaxial impact compression test using the Split Hopkinson Pressure Bar (SHPB) test device with a rod diameter of 50 mm, located in the Impact Mechanics Laboratory of the University of Science and Technology of China. The incident and transmission bars of the experimental apparatus are both 100 cm in length and are made of steel. The impact speed was set at 8.08 m/s, resulting in a strain rate of 98 s−1. The sample experienced complete damage during the test. The entire dynamic impact process was captured using a high-speed camera known as the Thousand-eye Wolf X213. The frame rate of the camera was configured at 50,000 fps, capturing an image every 11 μs. The experimental system, as shown in Figure 3. To ensure uniform loading and prevent damage to the ends of the rock sample caused by uneven force, a steel plate was inserted between the rock sample and the incident and transmission rods. This steel plate compensates for the difference in cross-sectional area between the rock sample and the rods. Importantly, the area of the steel plate exceeds that of the rock sample. To minimize interface friction, petroleum jelly was evenly applied to both sides of the steel plate, ensuring optimal contact between the rock sample, steel plate, and rods.
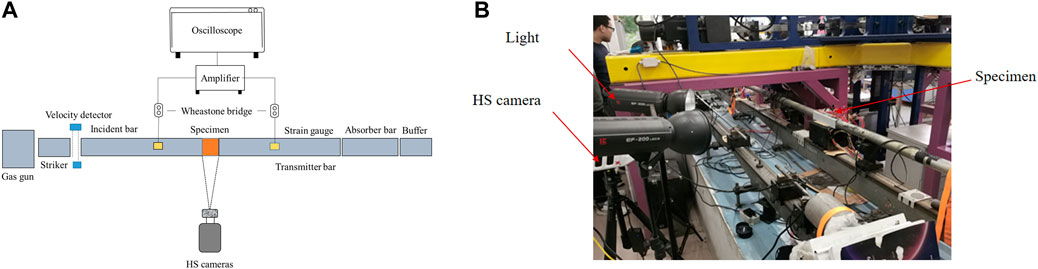
FIGURE 3. Experimental system. (A) Schematic diagram of the experimental system (B) Physical diagram of the experimental system.
4 Analysis of experimental results
4.1 Specimen crack picture results
Throughout the experiment, a high-speed camera captured images of the sample every 11 μs. The experimental images selected depict several key times when the crack width changes, as illustrated in Figure 4. Furthermore, Figure 5 provides zoomed-ins of the crack localization zone.
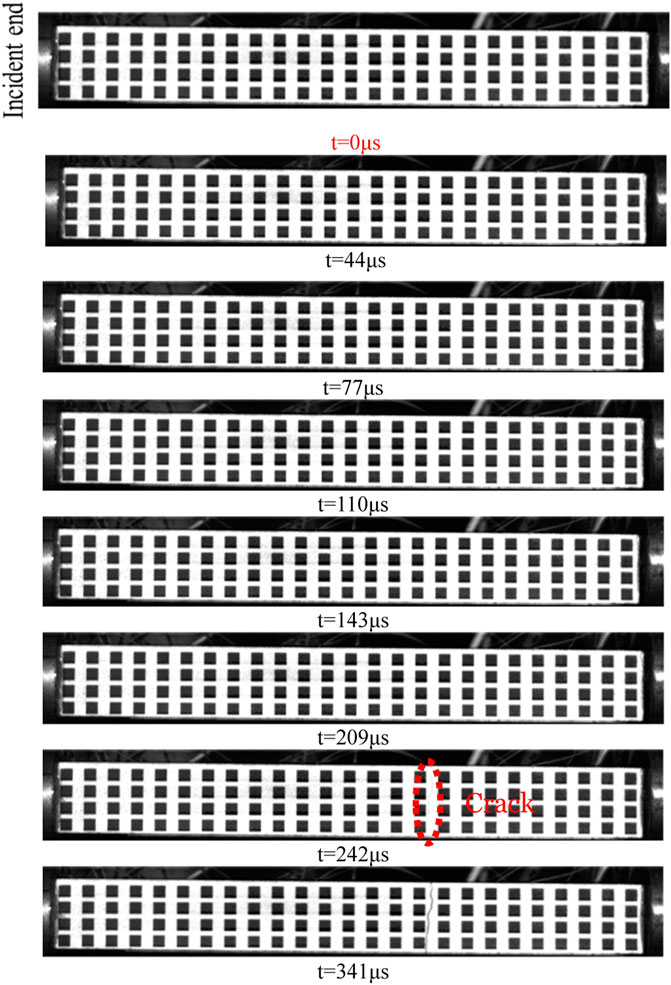
FIGURE 4. Experimental pictures.
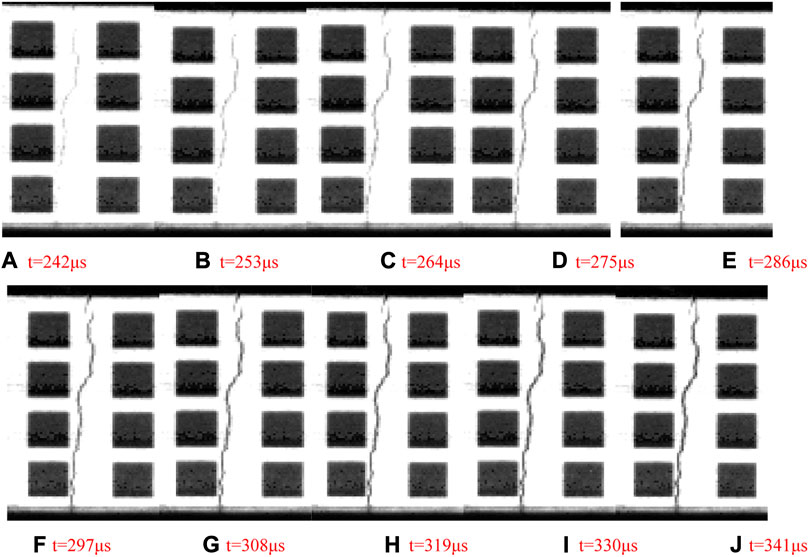
FIGURE 5. Zoom-ins of the crack localization zone. (A) t = 242 μs (B) t = 253 μs (C) t = 264 μs (D) t = 275 μs (E) t = 286 μs (F) t = 297 μs (G) t = 308 μs (H) t = 319 μs (I) t = 330 μs (J) t = 341 μs.
Figure 4 illustrates that no significant changes occurred on the sample’s surface between 77 and 143 μs. During this period, the internal micro-cracks of the sample were extruded and opened, resulting in small macroscopic cracks on the surface, a process imperceptible to the naked eye. From 143 to 231 µs, with the action of stress waves, the micro-cracks inside the sample gradually extend and reach the elastic limit. As depicted in Figure 5A, a micro-crack becomes visible to the naked eye when it reaches the surface of the specimen. At this stage, the crack expansion is minimal, and the sample’s strength does not reach the limit value. Subsequently, from 242 to 341 µs, as shown in Figures 5B–J, the crack accelerated due to the repeated reflection of stress waves and the impact of the incident and transmission rods, leading to the imminent penetrate of the internal crack of the sample. Ultimately, when the stress value of the sample reached the compressive strength limit, the crack spread throughout the entire sample, resulting in its destruction.
4.2 Surface displacement field
The axial displacement field of the crack region was calculated by the corner correlation method, as shown in Figure 6.
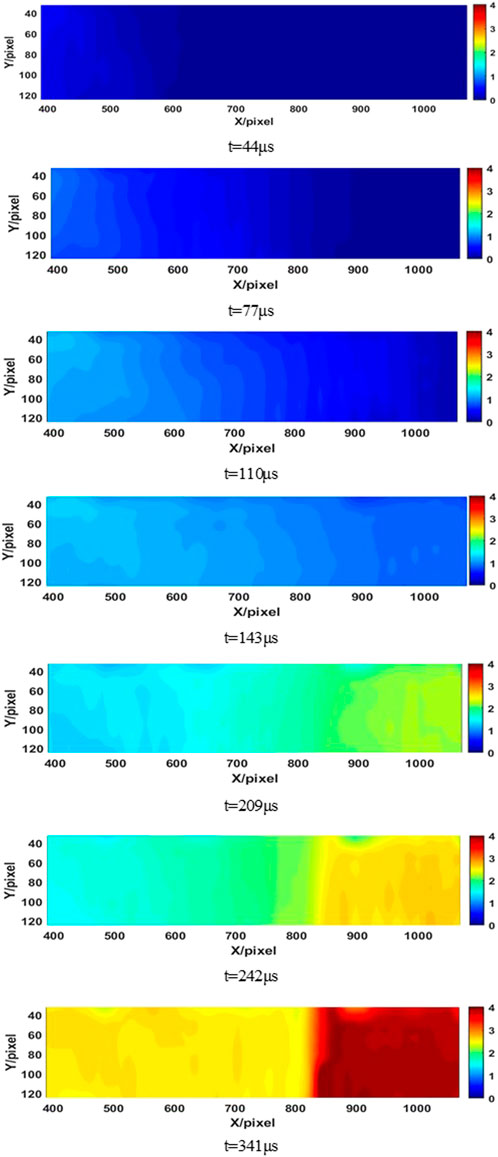
FIGURE 6. Axial displacement field.
When the crack initiates and starts to propagate, the axial displacement exhibits a consistently positive trend, indicating a continuous compression process within the sample. Figure 6 clearly illustrates the development of displacement from the incident end towards the transmitted end, with the displacement field continuously evolving. Eventually, a concentration phenomenon occurs at the crack site, as depicted in Figure 6. At 77 µs, the displacement on both sides of the initiation point begins to increase, reaching approximately 0.017 mm by 110 μs. Starting from 143 µs, the crack progressively expands and extends, leading to a gradual increase in displacement at the crack site. By 242 µs, the displacement on both sides of the crack reaches roughly 0.1 mm. At 341 µs, the displacement field becomes concentrated within the crack region, resulting in rapid crack width expansion and a displacement value of approximately 0.51 mm on both sides.
4.3 Crack development process
Corner points on both sides of the region where the crack is located are taken, and the distance between each two-corner points is 5 mm. The numbers 1–8 represent eight cross sections. The displacement difference between the left and right corner points of each section is represented by the crack width. The crack width calculation diagram, as shown in Figure 7, and the crack width time curve, as shown in Figure 8.
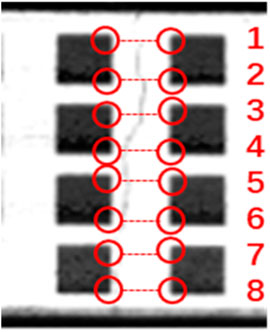
FIGURE 7. Schematic diagram of crack width calculation.
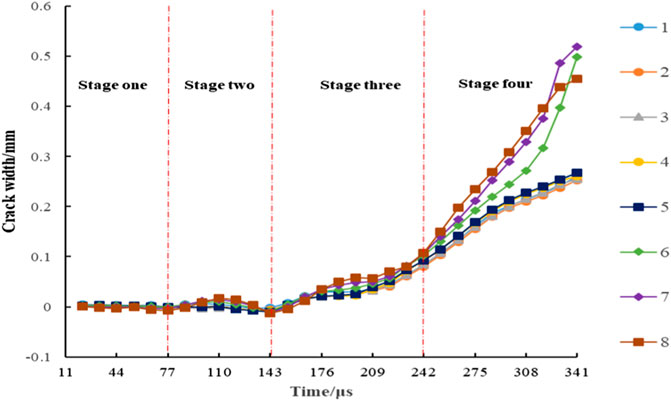
FIGURE 8. Crack width time curve.
Figure 8 presents the crack width time curve, while Figure 9 illustrates the evolution process of the axial strain field. Throughout the loading process, the crack width variation curve with time was delineated into four stages. The first stage is the loading stage, during which no cracks manifest on the sample’s surface, and it undergoes elastic deformation, as depicted in Figure 8. The sample experiences compression, compacting tiny cracks within, yet without significant expansion, signifying the gradual input of external energy and internal stress readjustment, as shown in Figure 9. In the second stage, at 77 µs, external input energy accumulates within the sample in the form of elastic strain energy. All curves exhibit a slight increase, indicating the onset of internal micro-crack expansion, with a small crack emerging on the surface, imperceptible to the naked eye, as evident in Figure 8. At this time, it can be seen from the strain diagram that stress concentration has occurred at the failure site, and the elastic strain energy has begun to be used for crack expansion. The internal micro-crack deformation reaches the elastic limit value, followed by a drop to approximately 0 at 143 µs, signifying the accumulation of elastic strain energy once again due to stress wave reflection within the sample. As mentioned above, “the stress wave propagates in the sample once is about 60 µs,” indicating that cracks have appeared in the sample during the first propagation of stress waves. Subsequently, in the third stage, post-143 µs, all curves exhibit a steady upward trend, indicating the reappearance and development of surface cracks during stress wave reflection. At this juncture, internal micro-cracks once again reach the elastic limit value, commencing expansion and extension. The strain diagram reflects the elastic strain energy stored inside the sample is released. Stress concentration at the failure site becomes pronounced, with a portion of the stored elastic strain energy utilized for crack propagation and extension, while the remainder contributes to radiation energy and frictional heat generation. Finally, in the fourth stage, at 242 µs, all curves demonstrate a marked increase, signifying the commencement of rapid expansion of micro-cracks within the sample, culminating in the formation of through cracks. At this stage, the complete release of elastic strain occurs, leading to a rapid increase in dissipation energy, ultimately contributing to the sample’s fracture failure.
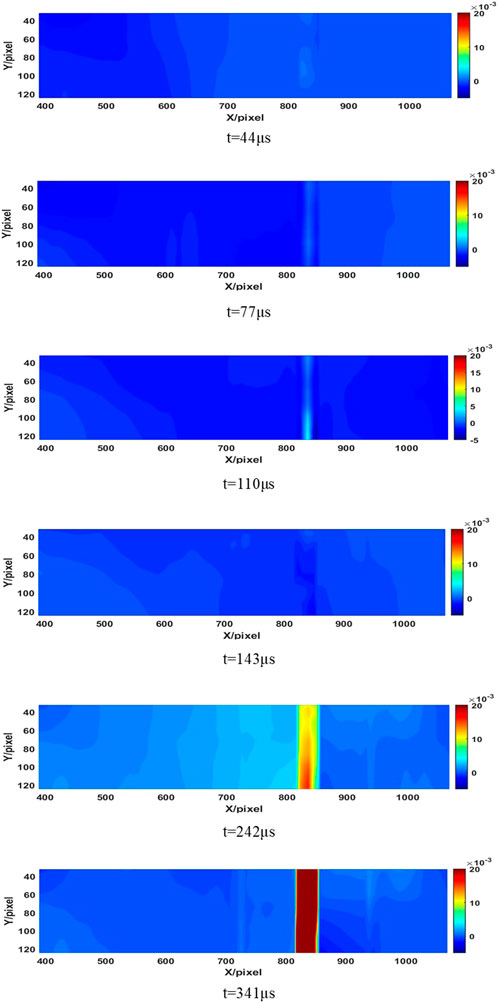
FIGURE 9. Axial strain field.
The axial strain field’s evolutionary process demonstrates that the strain in the failure zone exhibits compressive strain before 77 µs, as depicted in Figure 9, reflecting the entire compression stage. From 77 to 143 µs, the failure zone strain transforms into tensile strain, with a concentrated appearance towards the failure zone. By 242 µs, a concentrated zone has formed, and with the crack’s expansion, the strain color in the crack region deepens and expands, signifying the rapid macroscopic crack expansion. Stages 2 and 3 of Figure 8 are respectively magnified in Figure 10 and Figure 11.
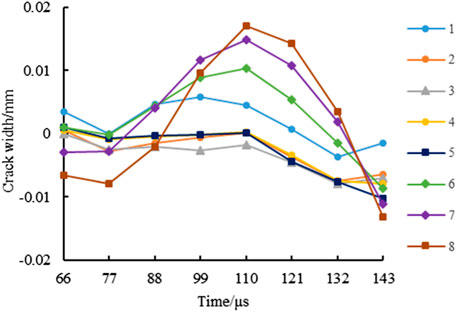
FIGURE 10. 66–143 μs crack width time curve (Stage 2).
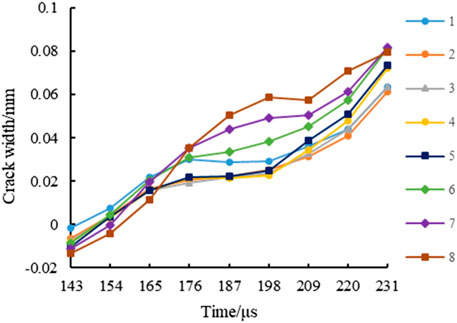
FIGURE 11. 143–231 μs crack width time curve (Stage 3).
The crack widths of section 1 and sections 6-8 exhibit significant increases from 77 μs onwards, while the crack widths of other sections show minimal change. This suggests that the crack initiation point of the observation plane is at the upper and lower ends, and the crack progresses from these points towards the middle region, as illustrated in Figure 10. Following 110 µs, the crack widths of all sections decrease, attributed to the accumulation of strain energy resulting from stress wave reflection. In addition, at the initial stage, the specimen contains a small number of micro-cracks and has a large elastic modulus, leading to a gradual reduction in the original crack widths. By 143 µs, the crack width values of all sections are negative, representing the local deformation of the specimen under the compressive force of stress waves.
As depicted in Figure 11, between 143 and 154 μs, the crack widths of sections 1–8 are observed to increase, suggesting the extension of the crack to the entire observation area during this period. The distance of section 1–8 is measured at 35 mm. Consequently, the calculated average crack propagation velocity is approximately 3,182 m/s. The crack width exhibits a gradual decrease in the order of sections 8-1, indicating that more cracks penetrated from front to back at the lower end of the observation area during this stage.
The crack width growth rate presents a fluctuating property, which is a nonlinear change of the crack growth rate caused by the reflection and transmission of stress waves. It can be seen from Figure 12 that the crack width growth rate is negative at 110–143 µs, indicating that the crack width gradually decreases at this stage. The crack width growth rate of section 7 is the highest at 319 µs (10.04 m/s), and the crack width growth rate of section 6 is the highest at 330 µs (9.22 m/s), indicating that the damage of the two sections is more serious and the damage progress is the fastest at the above two times.
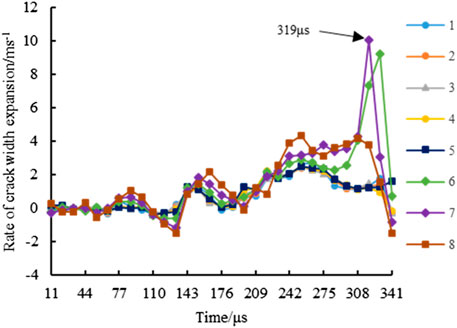
FIGURE 12. Time curve of crack width growth rate.
5 Numerical simulation of stress wave attenuation law
5.1 Calculation model
The rock density measures approximately 2.2 g/cm^3, with a porosity ranging from 12% to 14%. The calculation model, as illustrated in Figure 13, is based on the ANSYS/LS-DYNA18.1 power display calculation method. A linear elastic constitutive model is employed for the bullet and the incident bar, with a density of 7.9 g/cm, an elastic modulus of 210GPa, and a Poisson’s ratio of 0.3. The bullet is in contact with the incident rod, and the incident rod is in contact with the specimen. The bullet speed is 8.08 m/s, with the specimen section size measuring 5 cm × 5 cm and the unit surface size at 0.5 cm × 0.5 cm, as depicted in Figure 13.
FIGURE 13. Calculation model.
5.2 Material parameter
This paper adopts the RHT constitutive model (Riedel-Hiermaier-Thoma), a mechanical model extensively utilized to characterize the dynamic response of rock and concrete materials under high strain rate and substantial deformation conditions, such as explosion impact and projectile penetration. The model incorporates the failure surface equation, elastic limit surface equation, and residual stress surface equation to define the failure surface. While the parameter determination of the model is more intricate, it offers better simulation adaptability. Consequently, it has found widespread application in numerical simulation, with relevant material parameters detailed in Table 1.
TABLE 1. RHT Material parameter (Units: cm-g-μs).
5.3 Reliability verification of numerical simulation results
The measured value and calculated value of the strain time history curve at the same position on the rock specimen at the impact velocity of 8.08 m/s are compared. The strain time history curve is analyzed at the measuring points 5, 15, and 30 mm away from the impact end, as depicted in Figure 14. The numerical simulation results exhibit a strong agreement with the measured results in terms of stress wave peak value and pulse width, indicating the reliability of the numerical simulation outcomes. This also underscores the capability of the RHT constitutive model of rock and the selected material parameters to effectively characterize the pertinent properties of the rock materials used in the experiment. Consequently, this model and set of parameters can be confidently employed for further numerical simulations involving this type of rock.
FIGURE 14. Comparison of experimental waveforms and numerical simulation waveforms at different positions. (A) d = 5 mm (B) d = 15 mm (C) d = 30 mm.
5.4 Numerical simulation of one-dimensional stress wave propagation in rocks
To minimize the superposition of trans-reflective waves, we modified the experimental conditions by increasing the length of the specimen to 100 cm. We then selected points every 10 cm along a straight line beginning 1.5 cm away from the impact end face, as illustrated in Figure 15. All other experimental parameters remained unchanged.
FIGURE 15. Sketch of numerical model.
5.4.1 Stress diagram
When the end of a rectangular section rod is subjected to left-lateral impact load, the peak stress in the rod presents an obvious decreasing trend with the increase of the distance from the rod end, as shown in Figure 16.
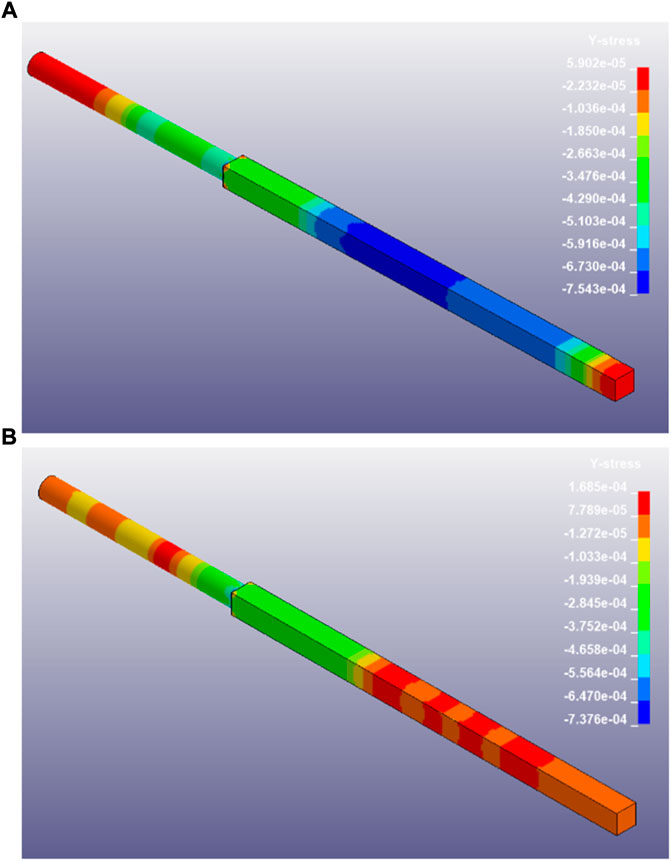
FIGURE 16. Typical temporal stress diagram. (A) T = 150 μs (B) T = 200 μs.
5.4.2 Typical position stress time history curve of Z-axis
The stress time-history curve at a typical position of the Y-axis, as shown in Figure 17. Under the impact load, the stress wave closer to the rod end presents a strong stress wave, and its steepness is larger, indicating that the duration of the rising edge is less and the pulse width is smaller. Due to the visco-plastic effect of the rock material, the steepness of the stress wave from the far end of the bar is small, which indicates that the rising duration is longer and the pulse width is increased.
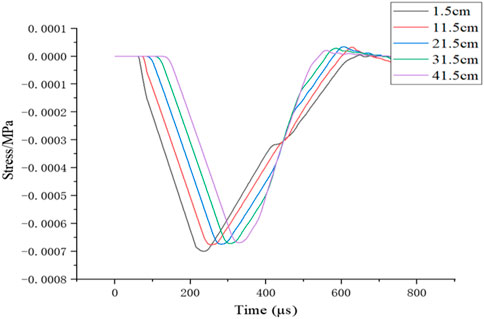
FIGURE 17. Y-axis typical time stress time history curve.
5.4.3 Stress wave attenuation law
Based on the experimental data, it is found that the attenuation law of exponential form is satisfied by the basic equation and characteristic relation of one-dimensional strain bar and numerical simulation analysis. The peak stress in the rectangular cross-section bar shows an obvious attenuation trend during the propagation from the near to the far end of the load, which obviously satisfies the attenuation law in exponential form, as shown in Figure 17. Try to fit the peak stress at typical moments at different positions in the form of a function, as shown in Table 2. The fitting curve of stress wave attenuation law, as shown in Figure 18. According to the theory of least square method, the fitting curve is reasonable and meets the accuracy requirements.

TABLE 2. Fitting parameter (Units: SI).
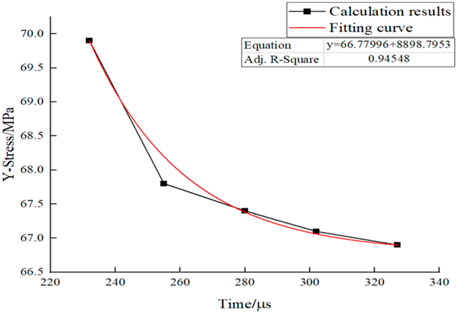
FIGURE 18. Attenuation law of stress wave.
6 Conclusion
To investigate the dynamic evolution characteristics of rock surface deformation under impact loading, dynamic failure tests were conducted on sandstone. The image was obtained through calculations using the self-developed corner correlation method. Additionally, a numerical simulation of a similar model was conducted to investigate the attenuation law of stress waves in sandstone under impact loading, leading to the following conclusions:
1) The adjustment law governing the elastic strain energy during the process of crack propagation can be determined using the corner correlation method. Initially, during the loading stage, the presence of a minute crack within the sample results in compaction. This signifies the gradual input of external energy and the subsequent re-adjustment of internal stress within the sample. The second stage involves the accumulation of elastic strain energy within the sample. At this point, a small crack emerges on the surface of the sample, followed by a renewed accumulation of elastic strain energy within the sample due to the reflection of stress waves. In the third stage, the crack begins to expand and extend. During this stage, a portion of the energy is consumed by the expansion and extension of the crack, while the remaining energy is utilized for other forms of energy consumption. The fourth stage is characterized by the rapid expansion of micro-cracks within the sample, eventually leading to the gradual formation of through cracks. In this stage, the elastic strain is fully released, primarily contributing to the fracture failure of the sample.
2) The crack system is monitored by the corner correlation method, and the crack width, crack starting point, crack extension and contraction trajectory, extension and contraction speed, width expansion rate and longitudinal penetration of the crack are analyzed at any time and any position.
3) The law of stress wave evolution is obviously affected by the constitutive model of the material. It is reasonable to adopt the classical HJC constitutive in this paper, and a more reasonable equivalent constitutive of sandstone needs to be studied later. Visco-plastic materials have obvious dispersion and attenuation of stress waves, which is the root cause of exponential attenuation of stress peak value in rock materials.
Data availability statement
The original contributions presented in the study are included in the article/supplementary material, further inquiries can be directed to the corresponding author.
Author contributions
XZ: Writing–original draft, Formal Analysis, Methodology. ZY: Writing–review and editing. HM: Writing–review and editing. WL: Writing–original draft. XW: Writing–review and editing. CL: Software, Writing–review and editing.
Funding
The author(s) declare financial support was received for the research, authorship, and/or publication of this article. This research was funded by National Natural Science Foundation of China (Grant no. 11732009, 11890683).
Acknowledgments
The authors thank the reviewers for their insightful comments.
Conflict of interest
The authors declare that the research was conducted in the absence of any commercial or financial relationships that could be construed as a potential conflict of interest.
Publisher’s note
All claims expressed in this article are solely those of the authors and do not necessarily represent those of their affiliated organizations, or those of the publisher, the editors and the reviewers. Any product that may be evaluated in this article, or claim that may be made by its manufacturer, is not guaranteed or endorsed by the publisher.
References
Alneasan, M., Behnia, M., and Bagherpour, R. (2020). Applicability of the classical fracture mechanics criteria to predict the crack propagation path in rock under compression. Eur. J. Environ. Civ. Eng. 24 (11), 1761–1784. doi:10.1080/19648189.2018.1485597
Bruck, H., Mcneill, S., Sutton, M., and Peters, W. (1989). Digital image correlation using Newton-raphson method of partial differential correction. Exp. Mech. 29 (3), 261–267. doi:10.1007/BF02321405
Chau, V., Rougier, E., Lei, Z., Knight, E. E., Gao, K., Hunter, A., et al. (2020). Numerical analysis of flyer plate experiments in granite via the combined finite–discrete element method. Comput. Part. Mech. 7, 1005–1016. doi:10.1007/s40571-019-00300-w
Chen, S. Y., Liu, Q. Y., Liu, P. X., and Zhuo, Y. Q. (2023). Prospect and research progress of detecting dynamic change in crustal stress by bedrock temperature. Geohazard Mech. 1 (2), 119–127. doi:10.1016/j.ghm.2023.04.002
Chu, Y. Y., Ren, G. F., Zhang, C. R., Zheng, Y., and Li, D. (2023). Acoustic emission parameters and energy dissipation law of cyclic load and unload damage of dihydrate gypsum under different loading rate. Geohazard Mech. 1 (2), 185–193. doi:10.1016/j.ghm.2023.06.001
Dai, L., Pan, Y., Li, Z., Wang, A., Xiao, Y., Liu, F., et al. (2021). Quantitative mechanism of roadway rock bursts in deep extra-thick coal seams: theory and case histories. Tunn. Undergr. Space Technol. 111, 103861–107798. doi:10.1016/j.tust.2021.103861
Feng, X., Zhang, Q., and Ali, M. (2019). Explosion-induced stress wave propagation in interacting fault system: numerical modeling and implications for chaoyang coal mine. Shock Vib. 1, 1–12. doi:10.1155/2019/5856080
Gong, F., Wang, Y., and Wang, Q. (2023). Peak-strength strain energy storage index for evaluating coal burst liability based on the linear energy storage law. Geohazard Mech. 1 (2), 153–161. doi:10.1016/j.ghm.2023.03.003
Guo, W., Chen, L., Yin, L., Zhang, L., Lu, D., Kong, B., et al. (2023). Experimental study on the influence of loading rate on the directional propagation law of rock mode-I cracks. Theor. Appl. Fract. Mech. 125, 103873. doi:10.1016/j.tafmec.2023.103873
Guo, Y. (2022). Failure mechanism and fracture development law of heterogeneous brittle rock. Saf. Coal Mines 53 (05), 67–72+80. doi:10.13347/j.cnki.mkaq.2022.05.011
Harris, C., and Stephens, M. (1988). A combined corner and edge detector. Manchester, UK: Proceedings of the 4th Alvey Vision Conference, University of Sheffield Printing Unit, 147–151.
Hu, Y., Yang, S., Zhong, Z., Wang, X., Zhang, T., and Zhou, R. (2022). Experimental study on unsaturated flow properties through a single limestone fracture under confining pressure. J. Rock Mech. Eng. 41 (S1), 2846–2856. doi:10.13722/j.cnki.jrme.2021.0823
Jin, Z., Peng, Y., Wen-Bo, L., Ming, C., and Gao-Hui, W. (2021). Propagation mechanism of fracture zones in single-hole rock mass under high in-situ stress. IOP Conf. Ser. Earth Environ. Sci. 861 (7), 072089. doi:10.1088/1755-1315/861/7/072089
Knight, E., Rougier, E., Lei, Z., Euser, B., Chau, V., Boyce, S. H., et al. (2020). HOSS: an implementation of the combined finite-discrete element method. Comput. Part. Mech. 7, 765–787. doi:10.1007/s40571-020-00349-y
Li, D., Han, Z., Zhu, Q., Zhang, Y., and Ranjith, P. (2019). Stress wave propagation and dynamic behavior of red sandstone with single bonded planar joint at various angles. Int. J. Rock Mech. Min. Sci. 117, 162–170. doi:10.1016/j.ijrmms.2019.03.011
Li, X., Bai, Y., Chen, X., Zhao, X., and Lv, M. (2021b). Experimental and numerical study on crack propagation and coalescence in rock-like materials under compression. J. Strain Analysis Eng. Des. 56 (8), 548–562. doi:10.1177/0309324720986913
Li, X., Zhu, Z., Wang, M., Wan, D., Zhou, L., and Liu, R. (2021a). Numerical study on the behavior of blasting in deep rock masses. Tunn. Undergr. Space Technol. 113, 103968. doi:10.1016/j.tust.2021.103968
Liu, J., Li, Z., Li, T., and Li, Z. (2020). Visualization study on seepage law considering the effects of multiple factors on sandstone fissures. China Civ. Eng. J. 53 (10), 106–119. doi:10.15951/j.tmgcxb.2020.10.011
Liu, X., Zhu, W., Liu, Y., and Guan, K. (2022). Reconstruction of rough rock joints: 2D profiles and 3D surfaces. Int. J. Rock Mech. Min. Sci. 156, 105113. doi:10.1016/j.ijrmms.2022.105113
Liu, Y., Pan, K., and Zhou, X. (2018). Study on impact failure properties of post-peak cracked standstone. J. West Anhui Univ. 34 (02), 123–127.
Munjiza, A., Rougier, E., Lei, Z., and Knight, E. E. (2020). FSIS: a novel fluid–solid interaction solver for fracturing and fragmenting solids. Comput. Part. Mech. 7, 789–805. doi:10.1007/s40571-020-00314-9
Oparin, V. N. (2022). Pendulum waves and basics of geomechanical thermodynamics. Geohazard Mech. 1 (1), 38–52. doi:10.1016/j.ghm.2022.12.001
Pan, B. (2007). Digital image correlation method and its application in experimental mechanics. Doctoral Dissertation. Tsinghua: Tsinghua University.
Pan, H. Y., Ge, D., Zhang, T., Dong, X., Zhang, L., and Zhou, A. (2018). Influence of strain rate on the rock fracture propagation law. J. China Coal Soc. 43 (03), 675–683. doi:10.13225/j.cnki.jccs.2017.1145
Pan, Y., and Wang, A. (2022). Disturbance response instability theory of rock bursts in coal mines and its application. Geohazard Mech. 1 (1), 1–17. doi:10.1016/j.ghm.2022.12.002
Rougier, E., Knight, S., Broome, A., Sussman, A. M., and Munjiza, A. (2014). Validation of a three-dimensional finite-discrete element method using experimental results of the split Hopkinson pressure bar test. Int. J. Rock Mech. Min. Sci. 70, 101–108. doi:10.1016/j.ijrmms.2014.03.011
Sikka, P., Asati, A., and Chandra, S. (2021). Real time FPGA implementation of a high speed and area optimized harris corner detection algorithm. Microprocess. Microsystems 80, 103514. doi:10.1016/j.micpro.2020.103514
Song, Y., He, A., Wang, Z., and Chen, H. (2015). Experiment study of the dynamic fractures of rock under impact loading. Rock Soil Mech. 36 (04), 965–970. doi:10.16285/j.rsm.2015.04.008
Tian, Y. (2021). Evolution characteristics of crack propagation under different confining pressure unloading rates. Low. Temp. Archit. Technol. 43 (10), 98–101. doi:10.13905/j.cnki.dwjz.2021.10.023
Wang, H., Xu, J., Liu, S., and Fang, X. (2016). Research on the dynamic strength criteria of rock with a single fissure based on numerical simulation. Metal. Mine (02), 7–12. doi:10.3969/j.issn.1001-1250.2016.02.002
Wei, L., Zhu, Z., Meng, Q., Jing, H., Su, H., and He, M. (2019). Dynamic characteristics of marble damaged by cyclic loading. Explos. Shock Waves 39 (08), 63–73. doi:10.11883/bzycj-2019-0164
Wu, X., Zheng, H., and Jiang, Y. (2022). Study on the evolution law of rock joint shear stiffness during shearing process through loading-unloading tests. Tunn. Undergr. Space Technol. 127, 104584. doi:10.1016/j.tust.2022.104584
Xi, X., Wu, X., Guo, Q., and Cai, M. (2020). Experimental investigation and numerical simulation on the crack initiation and propagation of rock with pre-existing cracks. IEEE Access 2020 (99), 129636–129644. doi:10.1109/ACCESS.2020.3009230
Xing, H., Zhang, Q., Ruan, D., Dehkhoda, S., Lu, G., and Zhao, J. (2018). Full-field measurement and fracture characterisations of rocks under dynamic loads using high-speed three-dimensional digital image correlation. Int. J. Impact Eng. 113, 61–72. doi:10.1016/j.ijimpeng.2017.11.011
Zhang, B., Liu, G., Li, Y., and Lin, Z. (2023). Experimental study on the seepage mutation of natural karst collapse pillar (KCP) fillings over mass outflow. Environ. Sci. Pollut. Res. 30, 110995–111007. doi:10.1007/s11356-023-30230-3
Zhang, Q., and Zhao, J. (2013). Determination of mechanical properties and full-field strain measurements of rock material under dynamic loads. Int. J. Rock Mech. Min. Sci. 60, 423–439. doi:10.1016/j.ijrmms.2013.01.005
Zhang, Y., Ai, R., and Tan, Z. (2021b). Study on crack propagation law of limestone under impact load. Min. Res. Dev. 41 (10), 79–83. doi:10.13827/j.cnki.kyyk.2021.10.014
Zhang, Y., Li, J., Yan, Y., and Li, H. (2021c). Experimental study on dynamic damage characteristics of roughness joint surface based on SHPB. Rock Soil Mech. 42 (02), 491–500. doi:10.16285/j.rsm.2020.0715
Zhang, Y. B., Yu, T., Zhang, T., Liu, S., and Zhou, J. (2021a). Experimental study of the permeability evolution of fractured mudstone under complex stress paths. J. Univ. Sci. Technol. 43 (07), 903–914. doi:10.13374/j.issn2095-9389.2020.05.27.005
Zhao, C., Tian, J., Song, T., Zhao, C., and Bao, C. (2015). Study on crack propagation and damage evolution characteristics of rock under uniaxial compression based on global strain field analysis. J. Rock Mech. Eng. 34 (04), 763–769. doi:10.13722/j.cnki.jrme.2015.04.013
Zhao, C., Zhou, Y., and Zhao, C. (2018a). Cracking processes and coalescence modes in rock-like specimens with two parallel pre-existing crack. Rock Mech. Rock Eng. 51 (11), 377–383 393. doi:10.1007/s00603-018-1525-y
Zhao, C., Zhou, Y., Zhao, C., and Bao, C. (2018b). Cracking processes and coalescence modes in rock-like specimens with two parallel pre-existing cracks. Rock Mech. Rock Eng. 51 (11), 3377–3383 393. doi:10.1007/s00603-018-1525-y
Zhou, X., Li, W., Liu, Y., Miao, H., Zhang, R., Xu, J., et al. (2022b). Establishment of the corner correlation method and its application in rock dynamic test. KSCE J. Civ. Eng. 26 (9), 4168–4177. doi:10.1007/s12205-022-0117-2
Keywords: rock, optical measurement, corner correlation, dynamic impact, crack propagation
Citation: Zhou X, Ye Z, Miao H, Li W, Wang X and Li C (2023) Dynamic evolution and numerical analysis of rock deformation under impact failure based on corner correlation method. Front. Earth Sci. 11:1320069. doi: 10.3389/feart.2023.1320069
Received: 11 October 2023; Accepted: 08 December 2023;
Published: 29 December 2023.
Edited by:
Pengjiao Jia, Soochow University, ChinaReviewed by:
Qian Bai, Northeastern University, ChinaAntonio Munjiza, University of London, United Kingdom
Copyright © 2023 Zhou, Ye, Miao, Li, Wang and Li. This is an open-access article distributed under the terms of the Creative Commons Attribution License (CC BY). The use, distribution or reproduction in other forums is permitted, provided the original author(s) and the copyright owner(s) are credited and that the original publication in this journal is cited, in accordance with accepted academic practice. No use, distribution or reproduction is permitted which does not comply with these terms.
*Correspondence: Hong Miao, bWlhb2hvbmdAdXN0Yy5lZHUuY24=