 C. Kettler
 E. Phillips
 K. Pichler1
 D. P. Le Heron
- 1Department of Geology, University of Vienna, Vienna, Austria
- 2British Geological Survey, The Lyell Centre, Edinburgh, United Kingdom
- 3Fachbereich Geowissenschaften der Universität Bremen, Bremen, Germany
- 4Department of Earth Sciences, Royal Holloway University of London, London, United Kingdom
The Cryogenian interval (720–635 Ma) is famous for a rich archive of diamictites, many of which were deposited during glaciations. Classic examples are exposed in the Kingston Peak Formation of the Valjean Hills, near Death Valley (United States), with previous work pointing to multiple glacial cycles in other outcrop belts. Within any glacial period, diamictites are widespread, and in addition, their mechanics of deposition are highly variable. Some are massive in appearance at outcrop or in hand specimens and apparently lack any information that allows their mode of emplacement to be elucidated. Yet, the correct interpretation for deep-time successions in this area is especially important, since it is debated whether the diamictites are either associated with a tectonically driven origin, associated with rifting at the south-western Laurentian margin alongside slope-controlled gravitational mass movement, or predominantly deposited as (sub)glacial diamictites. In this paper, we demonstrate how diamictite texture can be objectively quantified based on clast orientations, at both macroscale and microscale (micromorphology), guiding interpretations. Our method is based on a technique used for Quaternary sediments, by mapping the apparent longest axes of skeleton grains (ranging from fine-grained sand to fine-grained pebbles) in oriented thin sections and reconstructing their microfabric in a 3D space coupled with macrofabric data for each diamictite. In this way, we could identify a bimodal signal in the orientation of the longest axes for each sample. Evidence for shearing and soft sediment deformation supports either subaqueous or subglacial deposition with deformation induced by basal sliding with a paleoflow directed toward the southeast. Our combined approach of micro- and macrofabric analyses can also encourage acquiring accurate fabric data for seemingly structureless diamictites from other deep-time rock archives in an objective manner.
1 Introduction
1.1 Micromorphology in the “Snowball Earth” debate
Diamictites are unsorted sedimentary rocks that typically include a spectrum of grain sizes from clay particles to boulders (Moncrieff, 1989) through deposits that bear blocks and megablocks (Terry and Goff, 2014). Some of the diamictites in the Cryogenian are argued to have been deposited in an exclusively non-glacial context as olistostromes or slope deposits (Nascimento et al., 2016, Damara Orogen, Namibia), whereas many are interpreted to contain a mixed slope-glacial signature (Macdonald et al., 2013; Le Heron et al., 2017). In the Cryogenian glacial record of Death Valley, California (United States), Busfield and Le Heron (2016) pointed to the repeated occurrence of lonestones associated with impact structures in shales, which they interpreted as ice-rafted dropstones. A similar pattern was observed in the central Kingston Range (Le Heron et al., 2014) and in the southern Kingston Range (California, United States) where dropstone-bearing horizons are intimately associated with both stratified and massive diamictites. It is this context that allowed them to emphasize a strong glacial influence on sedimentation, although further studies in the southern part of that range by Le Heron et al. (2018) demonstrated pervasive evidence for a glacial influence on sedimentation. Latterly, Kennedy and Eyles (2021) took a much more skeptical view, arguing that “dropstones” across a number of outcrops in the eastern Death Valley region could be ascribed to deflated debris, left behind while the main flow moves downslope. Although this might be regarded as a somewhat controversial view, the interpretations of Kennedy and Eyles (2021) challenge glacial geologists to consider the very foundations of evidence for a glaciogenic signature in Earth’s glacial record. Consequently, a careful outcrop description should ideally be supplemented with a quantifiable approach to determine the origin of diamictites as precisely as possible. In this paper, we demonstrate how diamictite texture can be objectively quantified based on clast orientations, at both macroscale and microscale (micromorphology), guiding interpretations. We carry out this using a hitherto undescribed section from the Valjean Hills area of Death Valley.
With few exceptions (Denis et al., 2010; Fleming et al., 2016; Busfield and Le Heron, 2018), there have been very few attempts to integrate micromorphology into the interpretation of Neoproterozoic diamictites or deep-time diamictites in general in spite of the technique being of proven value in the interpretation of Quaternary diamictons (Lachniet et al., 2001; van der Meer and Menzies, 2011). For sections that were long considered to be of glaciogenic origin, Delpomdor et al. (2017) showed that micromorphology allowed a mass flow interpretation to be supported on account of the relationship of ductile and brittle deformation, grain-to-grain relationships, and high strain rates. Similarly, for the Grand Conglomérat (within the Congo Basin), Kennedy et al. (2019) identified a dominant mass flow influence on sedimentation by analyzing an extensive core dataset. Consequently, stepping beyond the confines of mere outcrop description is essential for the rigorous interpretation of unsorted deposits in deep time. The problem is a vital one to solve, owing to the potential for erroneous interpretation of paleoclimate when the sedimentary textures are not properly understood. Here, we show how microfacies analyses can supplement a better understanding.
1.2 Neoproterozoic overview of the Death Valley region
The Valjean Hills belong to an area of mountain ranges in the Death Valley region, which consist of tilted blocks associated with rifting of the south-western Laurentian margin during the Neoproterozoic. According to Calzia and Troxel (2002), the southern parts expose Late Proterozoic rocks from the Johnnie Formation overlain by Miocene carbonate breccias. The northeastern parts comprise the Noonday Dolomite and the upper member of the Neoproterozoic Kingston Peak Formation (KPF). Overall, the KPF, as described by Prave (1999), Macdonald et al. (2013), and Le Heron et al. (2014), is subdivided into four members (KP1–KP4). These consist of the basal KP1 pre-glacial succession, followed by Cryogenian aged rocks of the Sturtian glaciation (KP2 and KP3), and finish with glacial rocks of the Marinoan (KP4).
Deposition of the KPF in both the Sperry Wash region (Busfield and Le Heron, 2016) as well as in the central (Le Heron et al., 2014) and southern Kingston Range (Le Heron et al., 2018) illustrates a common SE-oriented paleoslope on the basis of sediment structures like current ripples, flute casts, grooves, and slump folding. This is also underpinned by regional thickness changes which increase progressively toward the southeast (Macdonald et al., 2013; Lechte et al., 2018). In contrast, the Silurian Hill section illustrates paleocurrent flow in an opposite orientation (toward the north), which in conjunction with compositional differences of clasts (the northern and southern facies of Troxel, 1966 and Troxel, 1982) was interpreted by Le Heron et al. (2017) to represent the convergence of ice masses flowing in opposite orientations. This interpretation developed the regional paleogeographic model of a Mojave upland to the south and a Nopah upland to the north by Wright et al. (1974) (Figure 13). The Valjean Hills comprise an outlier of the KPF that is overlain by breccia facies of the Noonday Dolomite (Calzia and Troxel, 2002) (Figure 1; see Figure 2A for further details). The overall character of the Valjean Hills section (red, iron rich, and dominated by turbidite–debrite intercalations) closely resembles that described in both the Sperry Wash section (Busfield and Le Heron, 2016; Kennedy and Eyles, 2021) and the sections of the Saddle Peak Hills (Macdonald et al., 2013; Le Heron et al., 2019; Le Heron and Vandyk, 2019). Interpretations of these sections range from glaciomarine to non-glacial debris flow deposits for Sperry Wash and (distal) glacial to non-glacial slope failure deposits at the Saddle Peak Hills. Thus, a key question is how the Valjean Hills section fits into this paleogeographic framework.
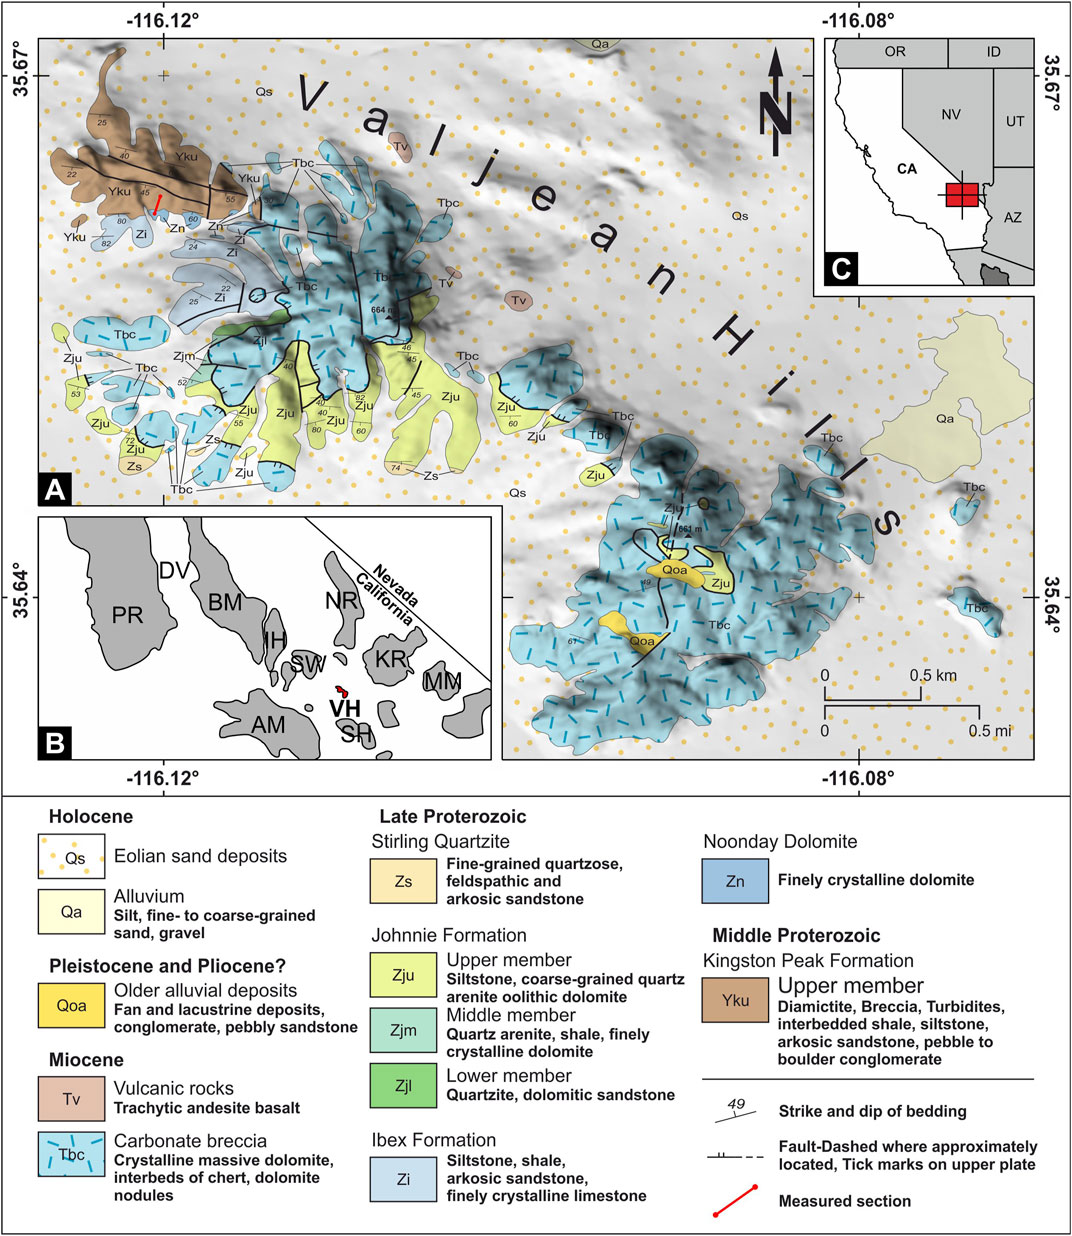
FIGURE 1. Geological map of the Valjean Hills modified after Calzia and Troxel (2002). (A) Geology of the Valjean Hills; the logged section is indicated with red line. (B) Position of the Valjean Hills in the Death Valley region and other relevant Neoproterozoic outcrop locations (AM, the Avawatz Mountains; BM, the Black Mountains; DV, Death Valley; IH, the Ibex Hills; KR, the Kingston Range; MM, the Mesquite Mountains; NR, the Nopah Range; SH, the Silurian Hills; SW, Sperry Wash; and VH, the Valjean Hills). (C) Study area.

FIGURE 2. Valjean Hills logged section and lithofacies’ detail photographs. (A) Top end of the logged section showing the contact between the brecciated dolostone of the Noonday Dolomite and upper member of the Kingston Peak Formation. (B) Details of the uppermost diamictite layer (UD). (C) Intermediate diamictite (MD) and contact to underlying heterolithics, (D) lower diamictite (LD). Note the rectangular markers indicate the relative position of diamictite samples in the stratigraphy. Rectangular black markers in the log show dip and dip direction of the strata. Size of the numbered labels in the photographs is 5 cm × 5 cm, and numbers refer to units in the log.
2 Materials and methods
2.1 Microfabric mapping
The technique of tracing the longest axes (or a-axes) of grains to interpret the spatial relationship of fabrics presented in this study uses a refined methodological approach originally proposed by Phillips et al. (2011) and further exemplified by Gehrmann et al. (2017) and Phillips et al. (2018) in Quaternary studies. We apply this method to three samples from Neoproterozoic diamictites from the Valjean Hills (35.662322° and −116.120398°), systematically analyzing the 2D fabric on three perpendicularly oriented thin sections. These are finally assembled into a 3D representation as a sample cube to reveal the true fabric in a graphical depiction and acquire fabric data that are plotted in a stereographic projection.
Samples have been collected from the base of three diamictite beds along the measured section (Figure 2). During sampling, areas of seemingly homogeneous diamictite were chosen, to minimize the potential effect on the microfabric caused by large boulders. Three oriented thin sections were cut from a single sample (in x-, y-, and z-direction). One thin section is oriented N–S, and the second is oriented perpendicular to that in an E–W orientation. Both with the bottom and top edges oriented horizontally. Perpendicular to these, a top view thin section was cut horizontally with edges exactly oriented north to south and east to west. In the following discussion, these three views are referred to as NS, EW, and TOP. When reassembled, the three 2D planes act as the basis for the fabric reconstruction, being a representation of the sample cube.
Each thin section was scanned with 2400 dpi via a 9000F Mark II CanoScan flatbed scanner under transmitted light. The color-corrected images were imported to a vector graphics software (CorelDRAW) to trace the longest axis of each individual skeleton grain (>0.05 mm, depending on scan resolution) with a vector line by hand. This enabled the systematic surveying of grain-fabric associations within the diamictite. It is noteworthy that all such axes of skeleton grains on a thin section only represent the apparent a-axes and not true in situ a-axes, thus constituting an artifact of the cutting orientation of the thin section. The basic workflow is subdivided into seven steps (Figure 3):
(1) Tracing of the apparent a-axes of skeleton grains on a high-resolution scan of an oriented thin section (Figure 3, step 1): Skeletal grains comprise all components larger than 35 µm that are clearly distinguishable from the plasma. Together, all grains represent the S-matrix. Particles smaller than 35 µm form the plasma or plasmic microfabric (van der Meer and Menzies, 2011). Only well-visible clasts with a length/width ratio >1.1 have been traced. The next step involves systematic surveying of clast orientations to map possible microstructures. If observable, structural features like rotational structures, folds, faults, and textural characteristics like layering, clast shape, and clast distribution are used to define a potential depositional or deformation history, and the nomenclature of Menzies and Meer (2018) is followed.
(2) Exporting the traced axes of the skeleton grains as 2D lines and calculating dipping angles (NS and EW) and trend (TOP): This step takes advantage of the fact that 2D vector lines can be exported as an SVG-file (scalable vector format) with exact values of x- and y-coordinate of the start and endpoint as well as a color value for each line. This file type is relatively easy to modify with a standard text editor and enables easy interchangeability between several programs. All unnecessary data from the SVG-file (file header, etc.) are removed by using a text editor, and the remaining point coordinates for each line (x1, y1 and x2, y2) are imported into Microsoft Excel. A formula for a simple slope calculation is applied to each line data for obtaining an initial angle αi by calculating the inverse tangent of the slope. This initial angle represents the angle under the horizon and would give false readings in a rose plot (e.g., αi of −45° should equal 135° in the rose plot). Therefore, all angles are normalized to values between 0° and 180° (αn), including error correction if the slope becomes infinite (equals an exactly vertical line) (Figure 3, step 2).
(3) Plotting rose diagrams for each thin section based on the calculated angles for the bulk amount of data, specific regions, or different grain size classes: It should be noted that when plotting a rose diagram with the values generated in step 2, only one half of a rose diagram is displayed, but since all clast a-axes are bidirectional, the rose can be duplicated, mirrored, and flipped to obtain a full rose diagram (Figure 3, step 3).
(4) An algorithm is applied to color-code all data points (lines) based on their associated angle in one-degree steps to visually support fabric recognition. This step involves the assignment of a color value to each calculated angle that replaces the color value in the existing SVG-file that is used in step 2. This new file is then imported back into CorelDRAW to facilitate step 5 (Figure 3, step 4).
(5) Importing all color-coded lines back into the vector graphics software and analyzing the fabric patterns or distribution based on areas of similar grain orientation by drawing polygons around them and, thereby, defining fabric domains: This step involves the classification following the terminology proposed by Phillips et al. (2011) (Figure 3). Skeleton grains are hereby grouped according to their similarity in orientation and spatial distribution in domains or domain polygons, whereas areas of seemingly chaotic clast orientations represent microlithons (Passchier and Trouw, 2005). Identification of the spatial relationship (e.g., cross-cutting relationships) between individual clast domains allows the interpretation of a potential deformation history (Figure 3, step 5). Defining the same domain across all three thin sections of a sample is based on the cross-cutting relationship. For example, if the dominating domains crosscut the less-dominant domains, then they belong to the same foliation pattern, and vice versa.
(6) Tracing the orientations of associated domain polygons and calculating the mean angle (analog to step 2) enable the assertion of a final fabric orientation (Figure 3, step 6).
(7) If strong fabrics (one or more groups of dominant orientations of clasts) are present in the sample, the mean orientations (dip and trend) of associated domains are plotted in a stereographic projection to identify the three-dimensional foliation pattern (planar vs. linear vs. chaotic foliation or in other words, girdle vs. cluster vs. isotropic). A linear fabric is recognizable in the stereonet as a clustering of the plotted points, or more precisely, if all plotted great circles crosscut each other. However, a planar fabric is indicated by points lying on a common great circle (see Figure 3, step 7).
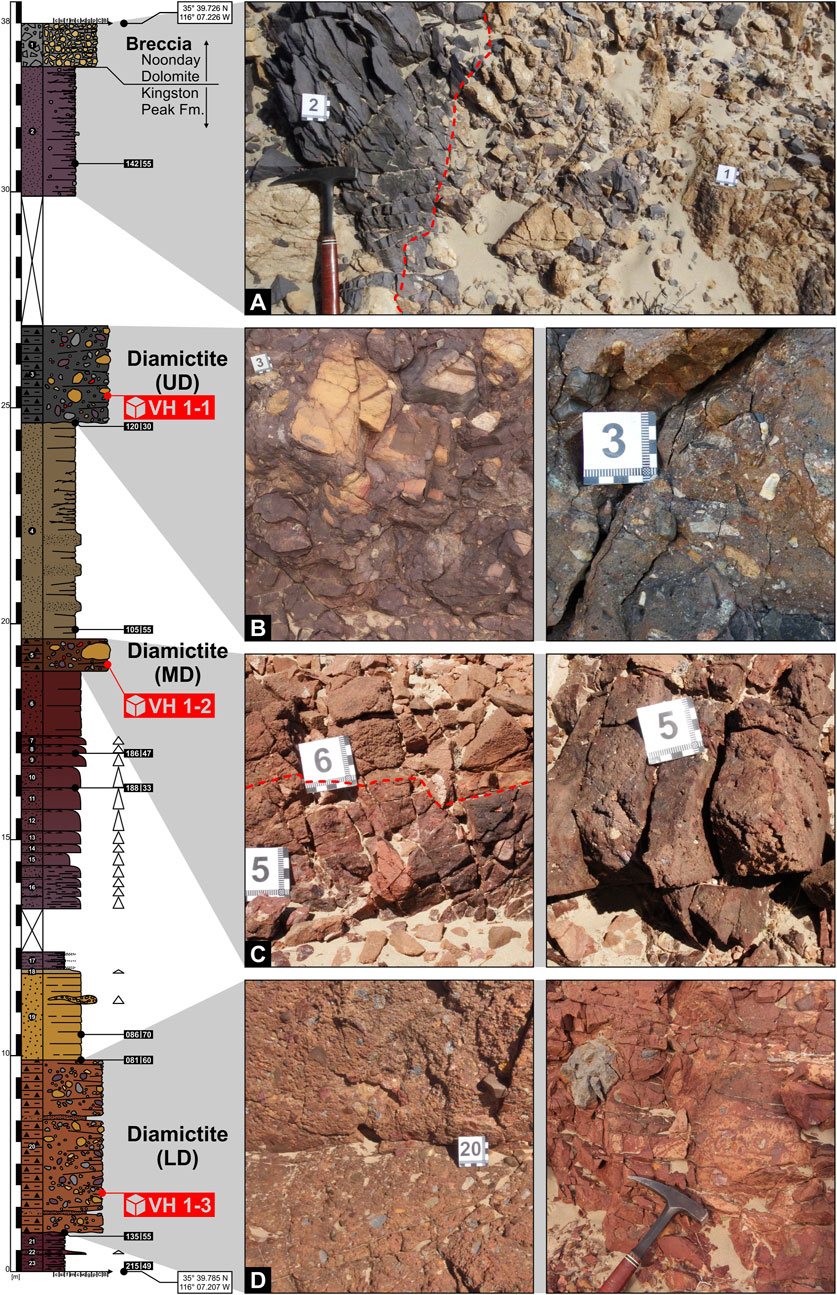
FIGURE 3. Methodological steps for fabric analysis in this study. Step 1: Tracing the apparent longest axes of individual grains on a thin section and exporting as an SVG-file to access X and Y values for each line. Step 2: Calculation of the initial angle αi from two points of a line and subsequent normalization for values that correspond to a compass rose (αn). Step 3: Plotting of all αn values in a rose plot. Step 4: Exporting all lines back to CorelDRAW including a color that corresponds to the angle by inserting a color value in the SVG-file for each line. Step 5: Grouping lines of similar angles (or color) in fabric domains and checking for the cross-cutting relationship between these. Step 6: Tracing the longest axes of domain polygons to acquire a mean orientation of a given fabric domain. Step 7: By repeating steps 1 to 6 for three sides of a sample block, all fabric domain orientations are plotted in a stereonet to reconstruct the three-dimensional microfabric.
After completing every step, a fabric interpretation and derivation of possible depositional or deformation directions is possible.
2.2 Obtaining macrofabric data from 3D models
To maximize fabric data, we deploy the use of outcrop-scale fabric data from diamictites, obtained through terrestrial structure from motion (TSfM) photogrammetry models, which complement and develop the micromorphological approach. Acquiring measurements from well-lithified rock outcrops is a laborious and time-consuming part, yet the diamictites in the study area have an advantage as they exhibit well-weathered-out clasts and a general appearance that enable virtual measurements. Therefore, meter-scale ground-based photogrammetry models of three outcrops corresponding to the exact location of the sampled diamictites have been computed. All of these models serve the purpose of extracting macroscopic clast orientations for comparison with the microfabric mapping. Several precautions need to be taken into consideration, since the correct dimensions and real-world orientations are crucial for obtaining solid data from virtual outcrop models. For that purpose, a 40 cm-long, horizontally laid out level, oriented exactly north, was placed on the outcrop, accompanied by labels that are marked with the dip and dip direction directly drawn onto the rock. These arrangements served as markers to orient and scale the models according to the real-world properties. Several hundred photos were taken with a 16MP Fujifilm S1 digital camera from a variety of viewing angles to recreate a representation of the actual outcrop topology. For the generation of the 3D outcrop models, the software Agisoft Metashape version 1.7.4 was used. The general workflow for TSfM photogrammetry (and its advantages over traditional compass-clino measurements) was well discussed by Cawood et al. (2017) and can be subdivided into an initial alignment of all photos and a computation of a tie-point cloud, followed by the computation of a dense cloud. This dense cloud acts as the basis for the following computation of a textured polygon mesh that was used to analyze the macrofabric. Measurement of clast orientation was performed in CloudCompare (2022) by importing the mesh and using the compass plugin (Thiele et al., 2017). The build-in lineation tool allows measuring the longest axis of each representative clast and provides accurate readings of dip and dip direction.
3 Results
3.1 Field work observations
Unlike the well-exposed and coherent sedimentary successions that crop out at Sperry Wash or in the type section of the KPF (Macdonald et al., 2013; Busfield and Le Heron, 2016; Kennedy and Eyles, 2021), exposed rocks in the Kingston Range in the northern Valjean Hills have a more fragmentary record. As the Valjean Hills section is dissected by numerous medium- to small-scale faults (offset ranging from <dm to >m), compiling a composite section of accurate thickness is challenging. However, in spite of the evidence for faulting and some structural complexity, many beds like those in Sperry Wash have a pristine character making them excellent candidates for thin-section-based fabric analysis. This is in stark contrast to the greenschist to amphibolite grade metamorphism and highly strained characteristic of the KPF in the Panamint Range (Hodges et al., 1990; Petterson et al., 2011).
Underlying carbonate platform deposits of the Beck Spring Dolomite do not crop out as in other Death Valley outcrop areas (Le Heron and Vandyk, 2019). The upper erosional contact with the overlying Noonday Dolomite is, however, present and was mapped by Calzia and Troxel (2002). The surveyed rocks on the southerly exposed valley flank (see Figure 1 for section locality; Figure 4 for a schematic overview) dip within the outcrop toward the south or a southeasterly direction with angles between 30° and 70°. Although fault surfaces themselves are rare, their presence is suggested by highly variable dips across the outcrop belt. Incisions in between valley flanks mark hidden faults, with horizontal offsets exceeding tens of meters and varying inclinations and tilt of beds. Therefore, bedwise recording of the orientation is especially important for the reconstruction of the true thickness and possible depositional directions. Generally, three main types of lithofacies associations are distinguished across the outcrop:
(1) Breccia of light ochre angular to very angular dolostones with a mean grain size of very coarse pebbles and dark gray matrix cement (Figure 2A): Dolostones are finely crystalline and featureless under freshly hammered conditions; otherwise, they exhibit microkarst weathering in exposed areas. These correspond to the Noonday Dolomite.
(2) Interbedded heterolithics comprise featureless or stratified fine- to coarse-grained sandstones and clay to siltstones with variable colors ranging from dark purple to ochre: They generally fine upward, feature pristine parallel lamination, and exhibit or transition into current ripples at the top of the beds. This is especially well visible in weathered sections, affected by aeolian erosion. The argillaceous intervals are usually recorded as shales and exhibit slate-like cleavage. Although generally sparse, few lonestones, coarse-grained wisps, or dropstone-like features with grain sizes of up to 2 cm are present (Figure 5E).
(3) Diamictites of varying thickness (ca. 2–10 m) and color and sheet-like appearance: In total, three prominent beds of diamictite are discernible (Figures 2, 5), which we refer to as LD (lower diamictite, sample VH 1-1), MD (middle diamictite, sample VH 1-2), and UD (upper diamictite, sample VH 1-3). Each of them serves as a landmark, cropping out of the generally more leveled and eroded heterolithic successions. Even though fine-grained units in the outcrop show moderate schistosity, diamictites exhibit outstanding preservation. The rocks show the typical bimodal distribution of silty to sandy matrix and matrix-supported pebble-sized clasts with few (<5%) outsized boulders (>25 cm).
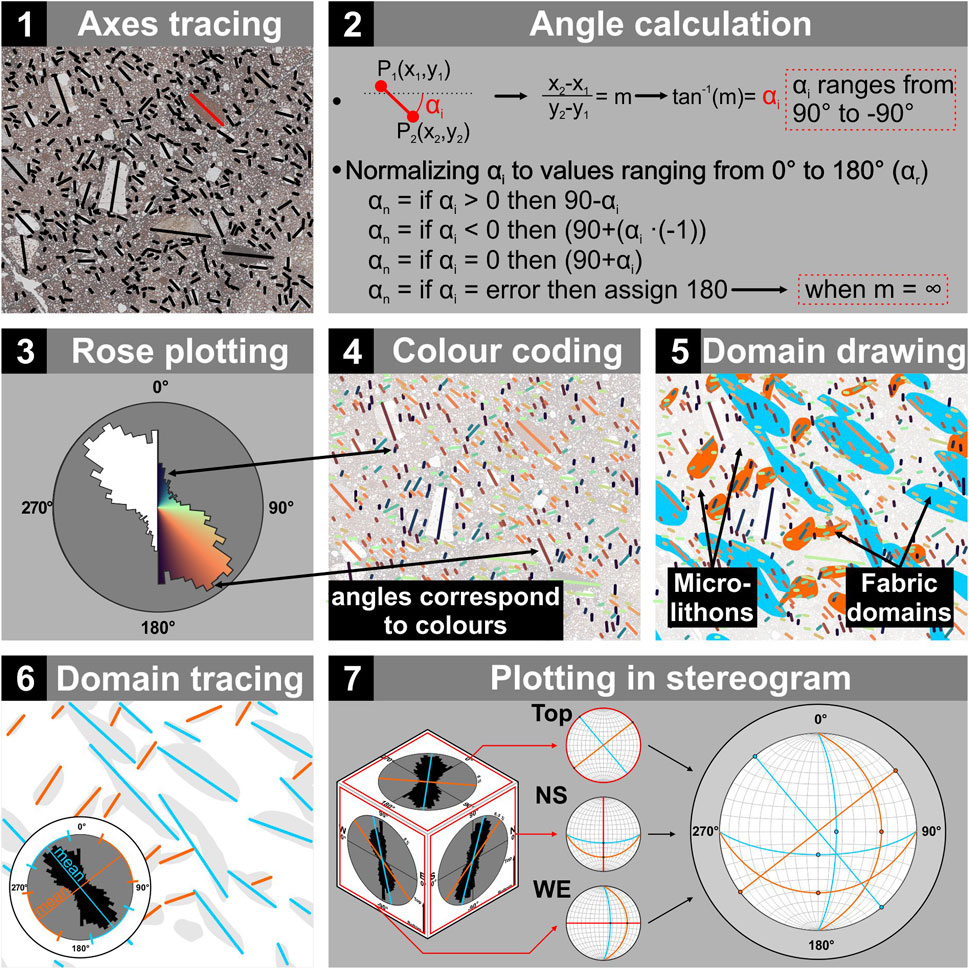
FIGURE 4. Valjean Hills section overview, viewing direction toward the NW (note Death Valley in the distance between the Panamint Mountains and the Black Mountains). (A) Uncrewed aerial vehicle image of the northern part of the Valjean Hills; (B) schematized bedding relationship of the logged units; note that the top of the section is located at a lower elevation than the bottom due to the regional dip of the strata toward S–SE.
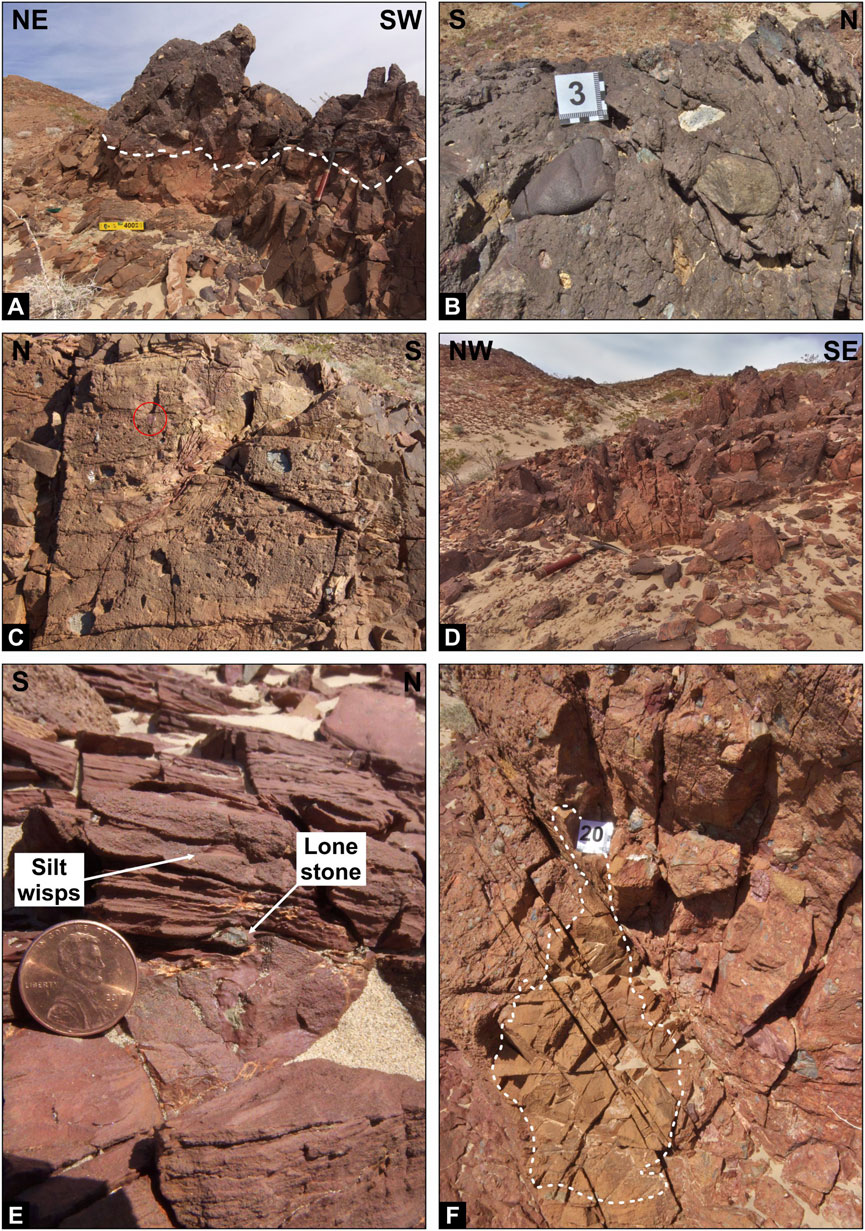
FIGURE 5. Outcrop photographs showing the excellent character of the rock record. (A) Uppermost diamictite (UD) in irregular contact with coarse sandstone, (B) weathered-out, faceted sandstone clast (dark violet), quartzite, and light dolostone boulders in the upper diamictite, and (C) stratified and deformed siltstone lenses (center) surrounded by reworked diamict material of section 19 of Figure 2; note coin (19 mm Ø) indicated by the red circle. (D) Middle diamictite (MD) sampling location. (E) Laminated siltstones and wisps of fine-grained sand of unit 17 of Figure 2; note coin for scale (19 mm Ø). (F) Deformed sandstone lens; note the pervasive set of vertical joints dissecting both the diamictite as well as the intraclast (numbered labels in the photographs are 5 cm × 5 cm).
Diamictite LD (Figures 2D, 5F) shows approximately 86% red matrix supporting angular to subangular clasts of varying lithologies. Dominant clasts are siltstone, sandstone, dolostone, and quartzite. Additionally, a variety of igneous rocks are recorded: basalt, diabase, and granitoid. Separated by ca. 18 m of stratigraphy, the overlying MD (Figures 2C, Figures 5C, D) shows a similar composition regarding the aforementioned lithologies. Clast shapes match the lower diamictite, although grain sizes are generally smaller, on average ranging from medium- to coarse-grained gravel, with one prominent dolostone outlier (70 cm). The red iron-rich matrix (93%) is massive and lacks internal structures. Solid information on spatial extent is vague due to limited exposure of this unit.
Diamictite UD is massive at the top, red to dark gray, and variably matrix- to clast-supported, making it hard to estimate the matrix/clast ratio (Figures 2B, Figures 5A, B). Clasts range in size between very coarse gravel and cobbles. Contact to the directly underlying sandstone is undulating and gradational in a 10 cm-thick band (see Figure 5A). Clasts are generally better rounded and show distinct facetting and striations. The majority of lithologies are light yellow dolostones, silt and sandstones, quartzites, and accessory components in the form of igneous rocks like diabase, basalt, and granites. As a whole, from a purely lithological standpoint, the three present diamictites are very similar.
3.2 Microstructures of diamictites
3.2.1 Textural analysis
Examination of thin sections of all three sample blocks reveals a pattern of increasing grain size from the stratigraphically low-lying LD to the topmost UD. Consequently, the amount of plasma decreases from the bottom to the top of the section (Figure 6). In numbers, sample VH 1-3 (LD) exhibits 73% of omnisepic plasma (no preferred alignment of clay particles) that supports the clasts. Examination under cross-polarized light does not show crenulation or banding of the plasma. It is ferrous-red and forms dark-to-almost opaque areas around bigger clasts, tracing symmetrical strain shadows. An additional patchy network of darker plasma is mostly related to fractures, joints, and grain–plasma boundaries (Figure 6C, around the clast), thus indicating diagenetic precipitation induced by circulating crevice water (Figure 7, unaltered thin sections). Skeleton grains show an angular-to-subangular shape, dependent on their lithology (Figures 6A–C). Quartz grains or sedimentary fragments are generally more rounded than dolostones. The abundance of bullet-shaped clasts is highest amongst metasedimentary grains, like quartzites and dolostones (Figure 6C). As a remarkable feature, monomineralic quartz (indicated by undulose extinction) exhibits an internal granular structure (“caster sugar” appearance, compare Figure 6E). Whether that relates to possible diagenetic overprinting remains questionable. This characteristic, however, is omnipresent in all samples. Overall, clast lithologies mirror what is perceived in macroscopic observations. Most commonly (>90%), monomineralic quartz, (meta)pelites, psammites, and dolostone grains occur. Igneous and unidentifiable, highly altered rock fragments constitute the remaining 10%.
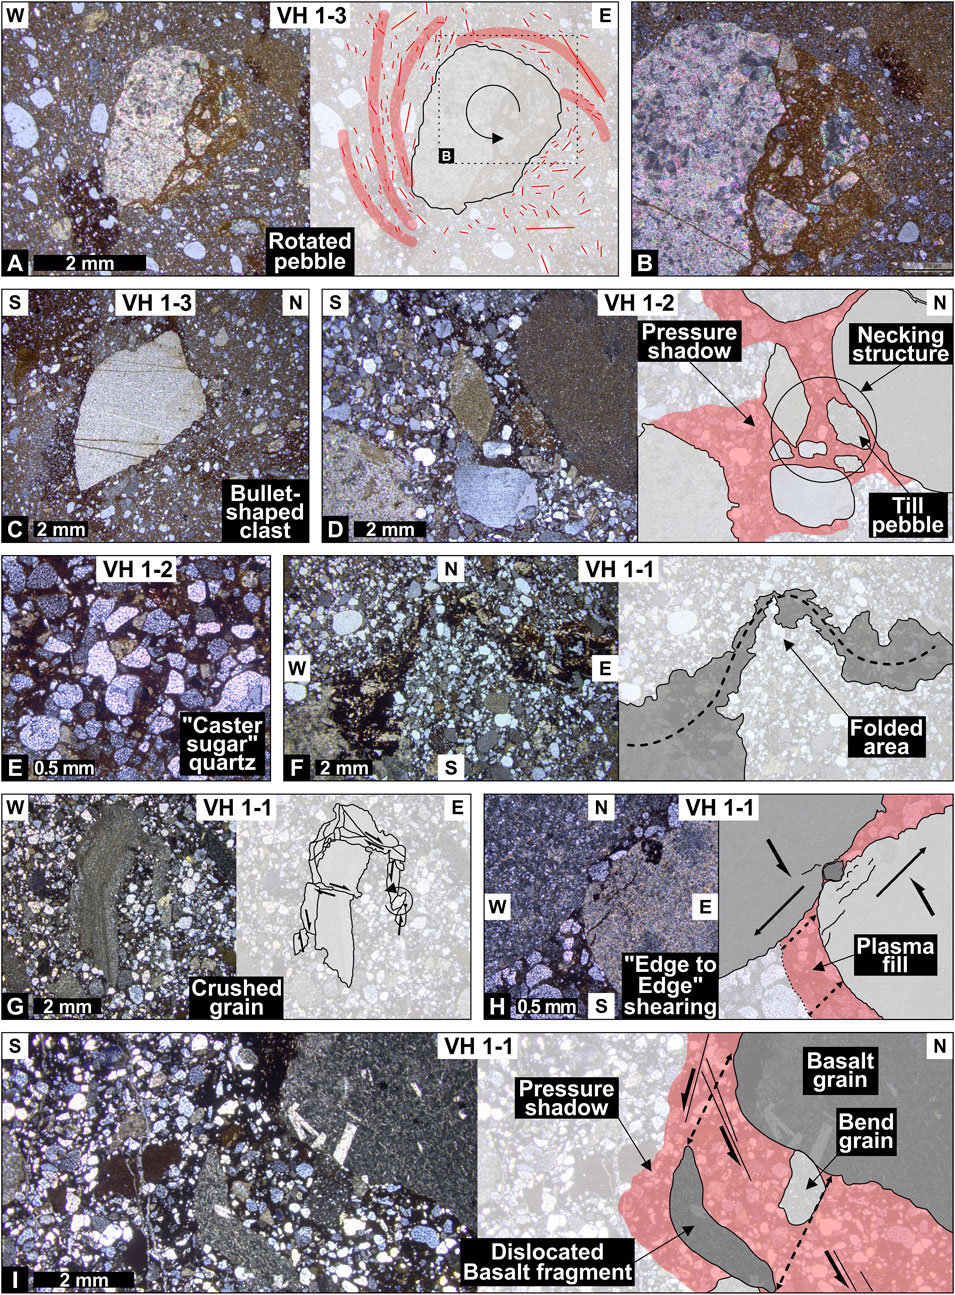
FIGURE 6. Paired thin-section photographs (crossed polars) of the three studied diamictites. (A–C) Microstructural elements of the lower diamictite sample VH 1-3. (A) Clockwise rotated dolostone grain with attached diamict material; red lines mark the apparent a-axes of clasts, and bold red lines highlight the sense of rotation. (B) Close-up view of the pebble in (A). (C) Quartzite fragment as an example of abundantly occurring bullet-shaped clasts (note the alignment of smaller clasts around the quartzite fragment forming a rational structure). (D, E) Examples of the middle diamictite sample VH 1-2. (D) Necking structure and narrow grain boundaries enclose areas with higher plasma content. (E) Plasma-depleted, coarse-grained texture showing mostly quartz grains with internal granular structure and narrow grain boundaries. (F–I) Coarse-grained diamictite of the upper diamictite sample VH 1-1 with evidence of brittle and ductile deformation in the form of shattered, dislocated, and sheared clasts and folded areas. (F) Folded, smeared, and highly altered domain (folding axis indicated by a dashed line). (G) Internally fractured and dislocated siltstone grain. (H) Narrow “edge-to-edge” crushed grain contact and plasma accumulation in the resulting lee side of the dislocated grains (note the undulating internal shear fractures in the right grain). (I) Sheared-off basalt fragment with resulting shear-horizons and plasma enrichment formed in protected areas.
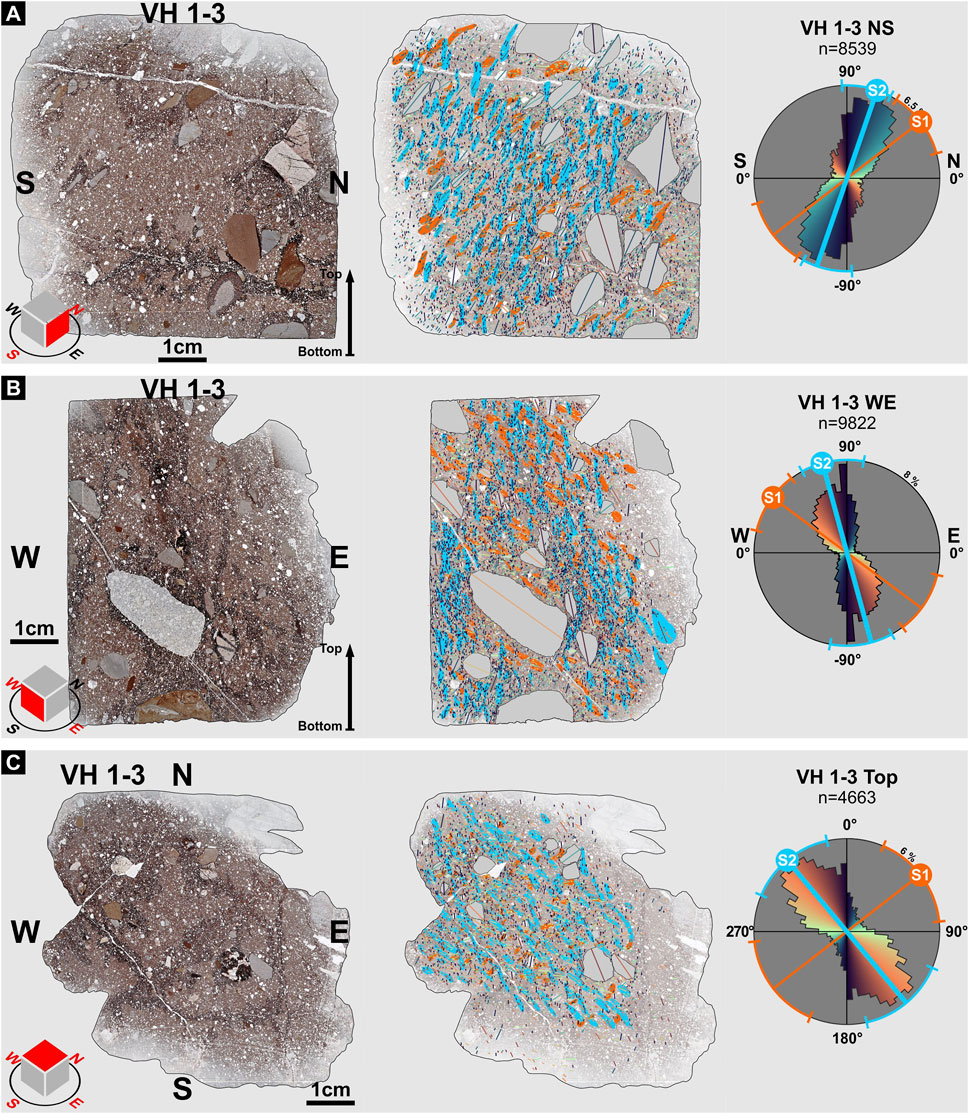
FIGURE 7. Thin sections of the lower diamictite (sample VH 1-3), their associated fabric assemblages, and rose plots showing the bulk orientation of skeleton grains. All traced skeleton grains are color-coded, and areas of similar orientation are grouped with colored polygons. For better visualization, clasts >2 mm are highlighted. Blue and orange lines and circular segments in the rose plots show the mean and range of orientation of each detected fabric domain. (A) S–N-oriented thin section with dominant S2 fabric (blue) and subordinate S1 fabric (orange), both dipping south. (B) W–E-oriented thin section with both fabric components dipping toward the east. (C) Top view thin section showing an orthogonal-oriented fabric relationship trending NW–SE (blue) and NE–SW accordingly (orange). Note the strong signal in the overall grain orientation displayed by the narrow rose plots.
There are no major compositional differences between the samples in terms of clast content, apart from diamict intraclasts, resembling type III till pebbles (van der Meer, 1993). These are more abundant in the lower stratigraphy and show a different internal color, composition, and plasmic fabric (compare Figures 6A, B, D). MD and UD differ in the amount of plasma compared to the lowermost diamictite. Sample VH 1-2 has an amount of 67% plasma. The uppermost sample, VH 1-1, shows 66%. Bigger patches only occur in the vesicles and protected lee sides of bigger grains (Figures 6H, I, red shaded areas). No internal features such as banding or kinking are discernible. Overall distribution of plasma in the two upper samples is limited to the surroundings of grains and is classified as skelsepic plasmic fabric (Menzies and Meer, 2018). Tracing the apparent a-axes on each thin section provides an approximate estimate on grain sizes. For the sample VH 1-1 (UD), the average grain size is 0.29 mm, VH 1-2 (MD) amounts to 0.32 mm, and the lowermost sample VH 1-3 (LD) also averages in the size of medium-grained sand with 0.26 mm.
3.2.2 Structural analysis
Observable microstructures within the S-matrix as well as in the plasma are frequent throughout all analyzed samples. Figure 6 gives an overview. Most common features such as close grain contacts (e–e events, cf., Menzies and Meer, 2018) are abundant but increase in the upper diamictites. In all thin sections, pressure shadows are mostly symmetrical and show a preferred orientation perpendicular to the dominant orientation of the a-axes. Throughout all samples, the presence of pressure or strain shadows is discernible, especially around larger clasts. The plasma is condensed in those areas that appear darker than the surrounding host material. Areas in between larger clasts preserve higher amounts of plasma, which can be related to the shielding effect during deformation and porewater migration (Figure 6D). Soft sediment clasts are spherical to elongate. Signs for brittle deformation are very abundant in the form of crushed, sheared, and dislocated skeleton grains (see Figures 6D, G–I). Notably, the axis of shearing is perpendicularly oriented toward the dominant grain orientation.
In addition to structures related to brittle deformation, folded or bent intraclasts are present, usually linked to fine-grained lithologies, like silt and mudstones (Figures 6F, I). Especially around larger skeletal grains, circular alignment of smaller clasts is present in all thin sections and relates to turbate or rotational movement during plastic deformation (Figure 6A).
3.3 Microfabric of the Valjean Hills diamictites
3.3.1 Lower diamictite
Microfabric mapping for this sample block (VH 1-3, Figure 7) reveals a strong preferred orientation of clasts illustrated by narrow rose plots for each thin section. The majority of the skeletal grains show a very steep dip on the vertically oriented thin sections and a NW–SE trend on the horizontal thin section. By color-coding the skeletal grains according to their angle of dip, two distinct fabrics become apparent. Even though both only differ slightly in angle in the vertical thin sections, a poorly developed S1 foliation (orange) and a dominant S2 foliation (blue) are distinguishable (c.f., Figure 7). The subordinate foliation is discontinuous in shape and shows comparatively small and patchy clast microfabric domains. These are crosscut and framed by a dominant, anastomosing, and subparallel foliation, occupying most of the thin-section area. The spacing of the S2 foliation is regular (2–5 mm) and gently curves around bigger clasts (c.f., Figure 7B). Areas where no fabric allocation is possible are confined to pebble-sized grains, which usually show a distinct rotational fabric and are excluded from the fabric mapping.
3.3.2 Middle diamictite
Similar to the underlying diamictite, this collection of samples exhibits the same two-fold fabric composition and an overall very narrow axes orientation in the vertical thin sections (Figure 8). In contrast, the horizontally oriented thin section shows a bimodal distribution of clast orientation. A poorly preserved S1 foliation (orange) is present in all thin sections with discontinuous and small domain polygons, occupying less than 10% of the thin sections. It is crosscut by dominant S2 foliation (blue). Domain polygons have an irregular spacing and are connected to form a parallel to anastomosing pattern. Microlithons occur less frequently compared to the LD samples (VH 1-3), due to a coarser texture and packing density.
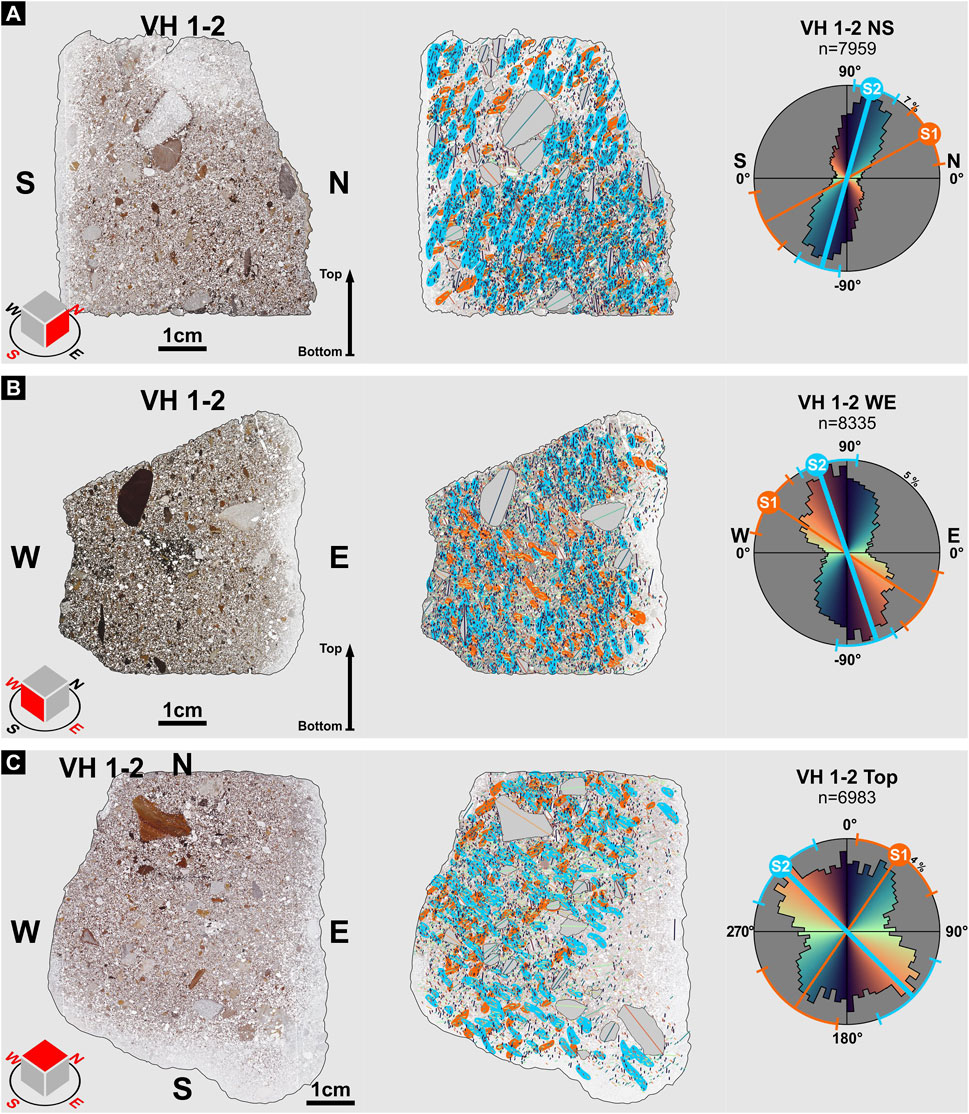
FIGURE 8. Thin sections of the middle diamictite (sample VH 1-2), their associated fabric assemblages, and rose plots showing the bulk orientation of skeleton grains. All traced skeleton grains are color-coded, and areas of similar orientation are grouped with colored polygons. For better visualization, clasts >2 mm are highlighted. Blue and orange lines and circular segments in the rose plots show the mean and range of orientation of each detected fabric domain. (A) S–N-oriented thin section with dominant S2 fabric (blue) and subordinate S1 fabric (orange), both dipping south. (B) W–E-oriented thin section with both fabric components dipping toward the east. (C) Top view thin section showing an orthogonal-oriented fabric relationship trending NW–SE (blue) and NE–SW accordingly (orange).
3.3.3 Upper diamictite
The uppermost diamictite in the section (UD, VH 1-1) reveals an inhomogeneous composition (Figure 9). The central parts are occupied by a band of well-sorted and well-rounded fine-grained sandstone. The lower and upper parts of the thin section are composed of identical diamict material, due to similarities in composition and equal grain orientation. That indicates a synsedimentary incorporation and ductile deformation of other sedimentary units during the deposition of the diamictite. Overall, the fabric composition in the analyzed samples is equal to both LD and MD. Two foliations are present: a subordinate, gently dipping S1 foliation (orange) that is crosscut by dominant, steeply dipping S2 foliation (blue). Especially in the vertical thin section, this foliation follows the outer shape of the sandstone layer, hinting toward a progressive soft sediment deformation.
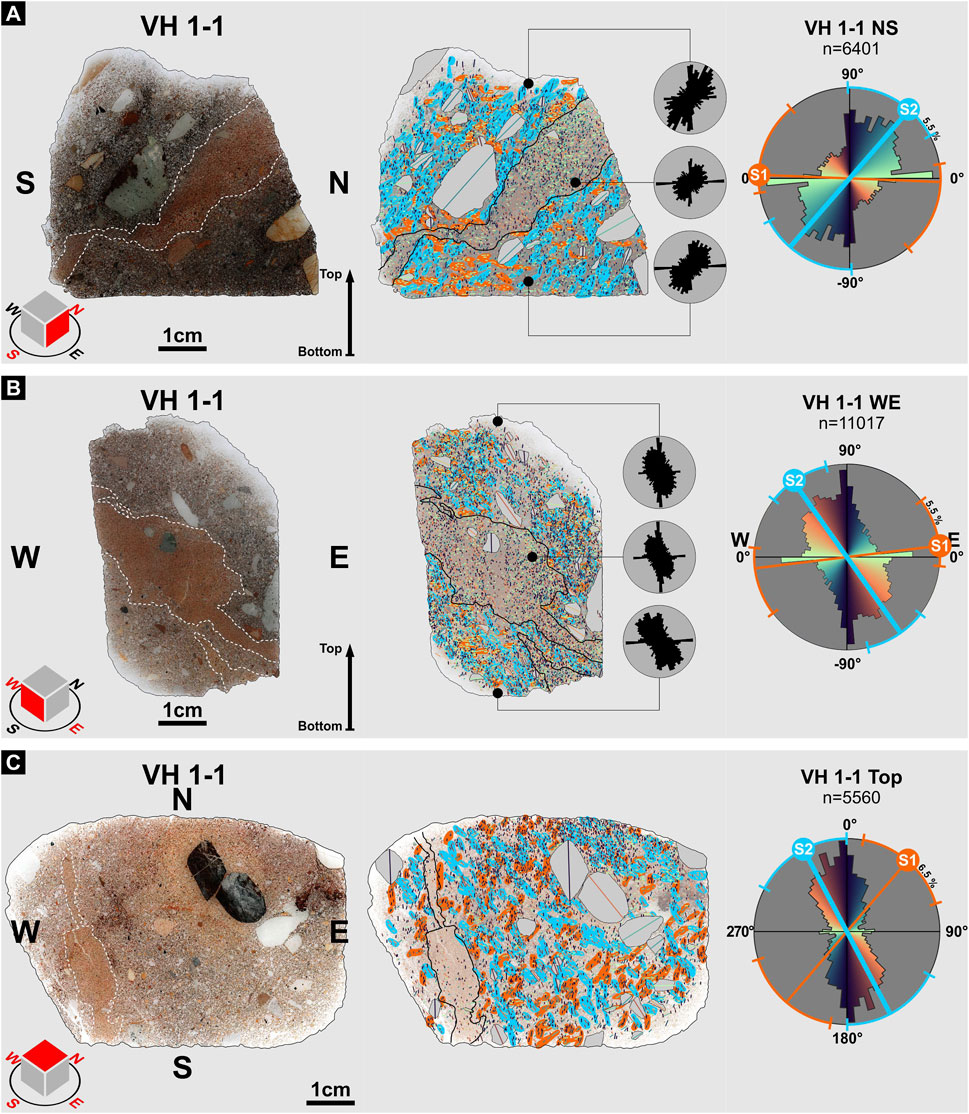
FIGURE 9. Thin sections of the upper diamictite (sample VH 1-1), their associated fabric assemblages, and rose plots showing the bulk orientation of skeleton grains. All traced skeleton grains are color-coded, and areas of similar orientation are grouped with colored polygons. For better visualization, clasts >2 mm are highlighted. Blue and orange lines and circular segments in the rose plots show the mean and range of orientation of each detected fabric domain. (A) S–N-oriented thin section with dominant S2 fabric (blue) dipping toward S and subordinate S1 fabric (orange) dipping very shallow toward N. (B) W–E-oriented thin section with the dominant fabric component dipping toward the east and the minor fabric domain dipping gently toward the W. (C) Top view thin section showing a cross-cutting fabric relationship trending NW–SE (blue) and NE–SW (orange). Vertical thin sections show a prominent layer of very well-sorted, fine-grained sandstone interlayer. Fabric analysis was excluded within these areas due to the roundness and insufficient length/width ratio of the skeleton grains.
3.4 Microfabric relationships
Reassembling the thin section into a “sample cube” allows the spatial relationship of each fabric component to be revealed (see Figure 10). To acquire a mean orientation for each fabric component, all domain polygons are represented by a line matching the longest axis of a domain polygon. By plotting the average orientation of these lines of every fabric component (S1 and S2) as great circles and linears into stereographic projection, all three sample blocks show that the S1 foliation forms a planar fabric (all linears lie on a great circle). However, the orientation of the S2 foliation always plots in one quadrant and, thus, forms a linear or cluster fabric, indicated by the area where the great circles intersect. The dip and dip direction of both fabric components show a similar orientation for the in situ position as well as after bedding correction for each diamictite. The linear component is oriented toward the SE, whereas the planar component is oriented toward NW to W.
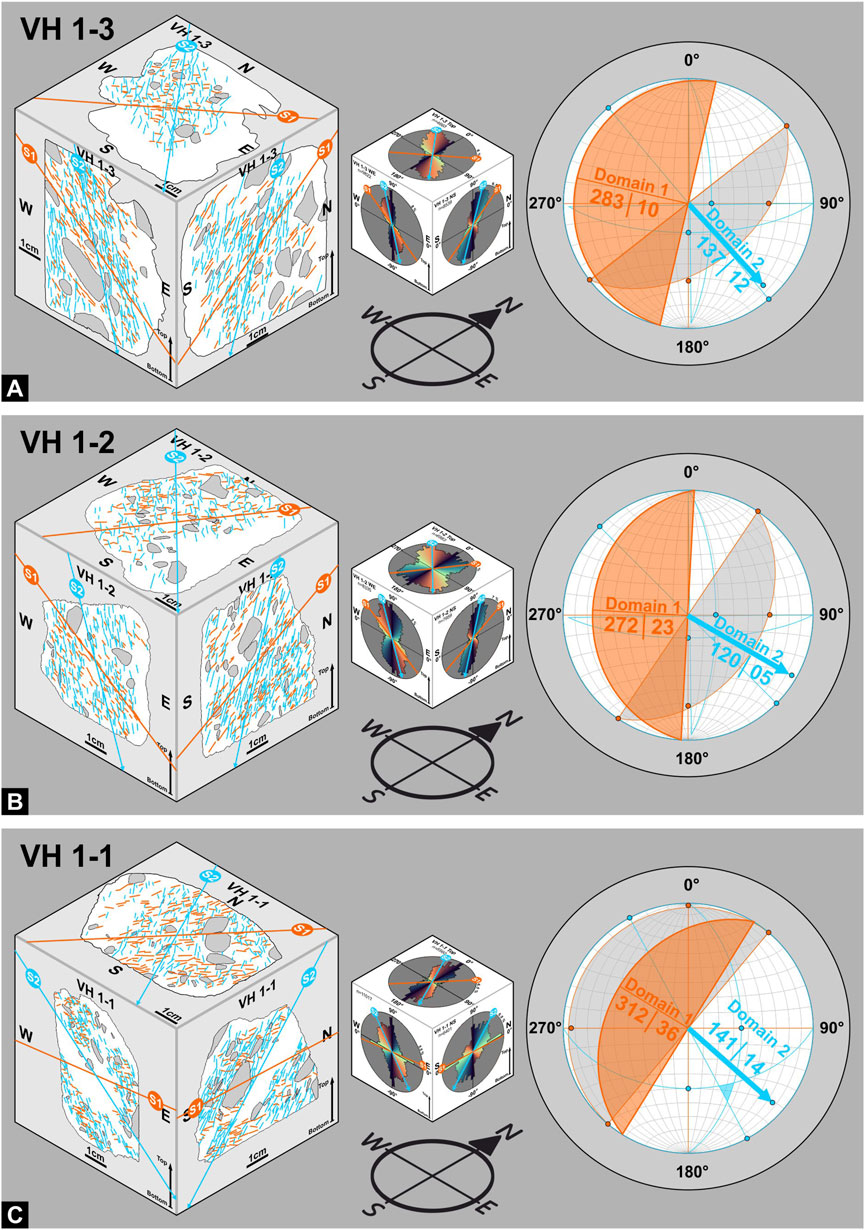
FIGURE 10. Reconstruction of the fabric pattern for all three diamictite samples (A–C) showing the mean orientation of the domain polygons on each thin section for the S1 (orange lines) and S2 (blue lines) fabric domains that are plotted in the stereoplot (left). Mean fabric orientations on a reconstructed “cube” showing the rose plots of the bulk grain orientation for each thin section (middle). Reconstructed fabric relationship in a stereoplot is shown (right). Blue arrow (inferred direction of shearing) and orange plane show the bedding-corrected orientation of each fabric component. Intersections of the three S2 fabric orientations symbolized by a blue triangle and the gray plane (S1 orientations plotting on a great circle) show the in situ orientation of each fabric for a given sample.
3.5 Macrofabric of virtual outcrop models
Since the microfabric analyses of thin sections only provide a small glimpse of the overall outcrop situation, macroscopic measurements of clast orientations were carried out for all three diamictites in the section that were also sampled (Figure 11). The stereographic plots show an overall similar result compared to the microfabric mapping. All three diamictites exhibit a dominant linear clast orientation dipping toward the SE. Compared with the bedding of each diamictite unit, the linear component lies almost in the same level as the bedding or few degrees below the bedding plane (see stereoplots of Figure 10). In contrast to the two observable fabric components of the thin sections samples, only a clustering is notable.
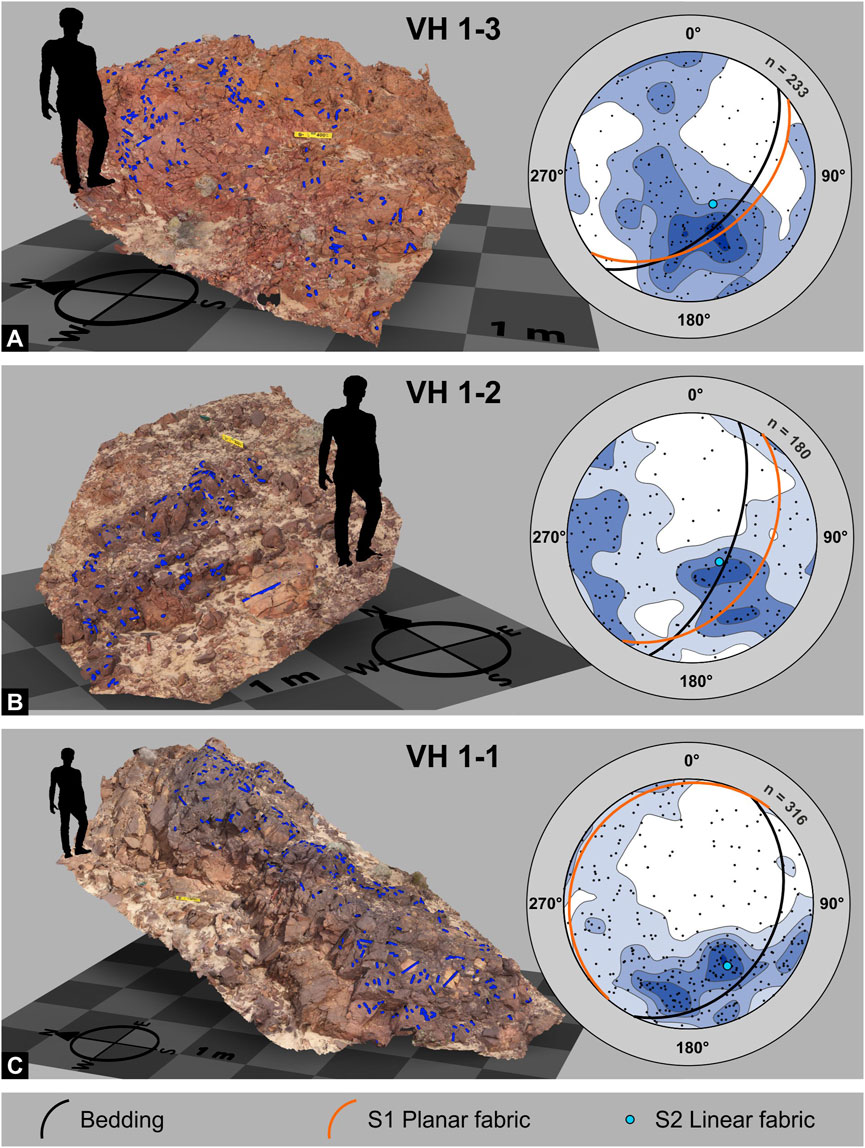
FIGURE 11. Virtual in situ macrofabric measurements of clast a-axes from photogrammetry outcrop models of the three diamictites present at the Valjean Hills section, with (A) the lower diamictite, (B) middle diamictite, and (C) upper diamictite. Blue lines in the 3D models mark the position and orientation of the longest axes of measured clasts that enable the placing of a line in the 3D geometry (e.g., well-weathered-out or eroded clasts). S1 and S2 fabric of each associated sample in the stereoplots show the in situ orientations. Note the yellow level in each outcrop model; it is precisely oriented toward magnetic north and placed horizontally to facilitate accurate measurements in the 3D space according to the real-world orientation and size of the outcrop.
4 Interpretations
Integrating observations from outcrop and thin sections illustrates that diamictites that appear massive or featureless at outcrop reveal substantial heterogeneity such that a pronounced fabric can be identified. Evidence in the form of downslope dipping linear fabrics, broken or dislodged clasts, and rotational structures that are present in the thin sections of all three samples reveals shear-related deformation. Similar markers for deformation and mechanical mixing, in the form of incorporated and distorted lenses of sand- or mudstone, reworked diamict material, or broken clasts, are also observable on a macroscopic scale (Figures 5C, F). This poses an interpretative challenge, since diamictites of both mass flow and subglacial origin may yield all of these features (Phillips et al., 2022), thus provoking the misconception that diamictites equal tills.
However, the presence of a two-fold fabric amalgamated with a variety of microstructures points to a temporal evolution of deformation associated with any form of basal shearing, similar to that discussed by Menzies et al. (2016) in subglacial tills. Microlithons in the thin sections, where clast orientations are seemingly chaotic, represent areas of initially high porewater content, where clasts are suspended in the deforming material and, thus, free to rotate (Figure 12A). As the relative shear intensity increases, subsequent dewatering leads to changes in rheology causing dominantly ductile deformation to form rotational structures and microfolds visible in the thin sections (Figures 5A, F). During an increase in the shear intensity, a steep compressional S1 foliation develops that dips against the direction of shearing (similar to what is described by Iverson et al., 2008; Phillips et al., 2022). In conjunction with the compressional component and progressive dewatering and solidification, an extensional S2 foliation forms (Figure 12B). The linear S2 fabric dips subhorizontally toward the direction of shearing in all three samples and is well developed, indicating relatively high shear intensity. This is supported by only fragmentary occurring remnants of the S1 foliation, progressively cannibalized in between the discrete shear zones of the S2 foliation (Figure 12C). Further evidence for a transformation from ductile to brittle deformation is dislocated clasts and brecciation of individual grains. The geometric relationship between S1 and S2 foliation between each sample (angle steepening upward from LD to UD) is most likely attributed to differences in water content and post-depositional processes like overburdening during subsequent deposition of overlying strata (Figure 12).
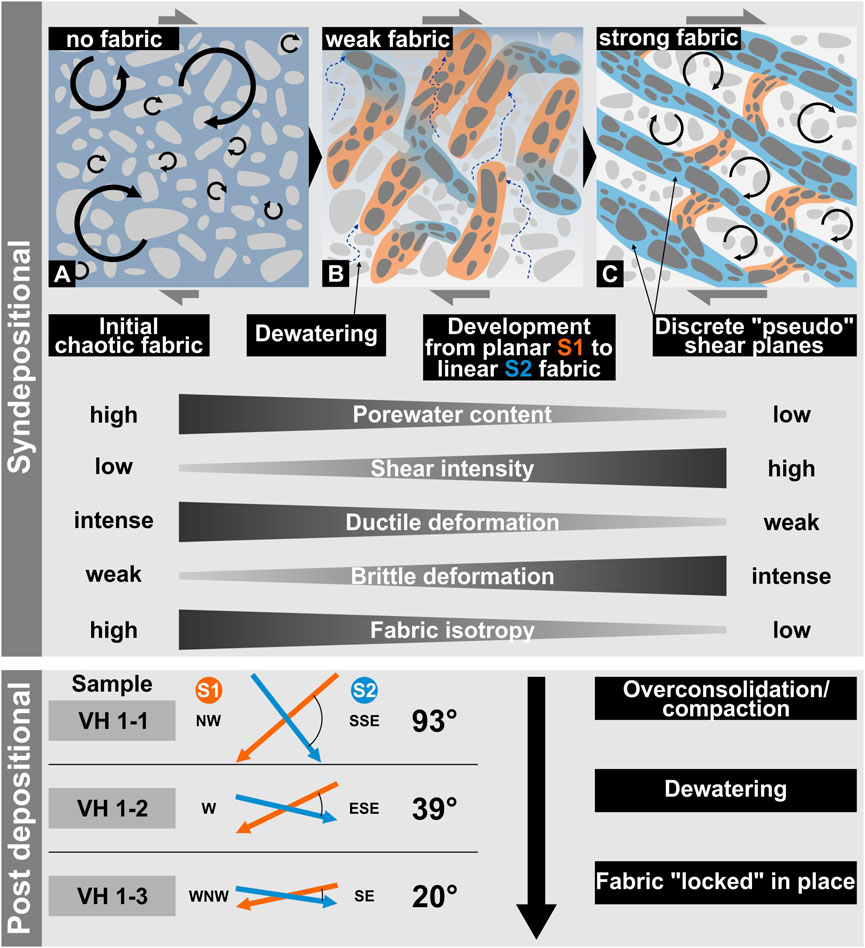
FIGURE 12. Schematic interpretation for the observed S1 (orange) and S2 (blue) fabric in the Valjean Hills diamictites and their relationship between each other as a product of syn- and post depositional overprinting. Syndepositional fabric development takes place during the continuous exposure to shearing coupled with dewatering, where initially chaotic clast orientations (A) transform progressively (B) into a well-developed unidirectional fabric (C). Fabric development “freezes” after deposition, and the fabric arrangement as a whole is only deformed by subsequent dewatering and overconsolidation.
If put into context to other diamictite deposits in the Death Valley area or the Neoproterozoic diamictite record in general, carbonate-dominated olistostromes accompanied by turbidites are generally abundant (Prave, 1999; Arnaud and Eyles, 2002; Le Heron et al., 2017; Arnaud et al., 2011). In the Valjean Hills, olistostromes appear to be missing, but a similar signature of diamictites sandwiched between turbidites is observed, in common with other correlative Death Valley successions. These facies may imply deposition relatively distal from an ice margin under subaqueous conditions. There is little indisputable diagnostic evidence to support or reject a direct glaciogenic origin for the diamictites in the Valjean Hills, since there is evidence for faceted clasts (Figure 5B), reworked glaciogenic material, and a generally diverse spectrum of lithologies in the diamictites originating from the lower units of the KPF, indicating a wider provenance and a possible glacial origin of the freighted clasts.
5 Discussion
5.1 Tillite versus debrite
For the Silurian Hills region, Le Heron et al. (2017) proposed that diamictites ultimately derived from a glacial source could be differentiated from those of non-glacial (gravitational collapse) origin on the basis of composition. In that region, dropstones were shown to be of basement crystalline composition (schists, granites, and gneisses). On account of them being sandwiched between diamictites with compositionally identical clasts, a glaciogenic origin was proposed, and they were interpreted as glaciogenic debris flow (GDF) deposits. Mantling the basement, and directly below the KPF in that range, a dolostone-dominated carbonate platform crops out. Thus, large (up to 50 m long) blocks of carbonate were interpreted as olistoliths, in a similar way to the much larger (up to 1 km long: Macdonald et al., 2013) examples in the central Kingston Range. It should be noted that the logic of these interpretations cannot be applied to the Valjean Hills owing to the compositional similarity between the three principal diamictite levels noted previously.
More recent work (Kennedy and Eyles, 2021) has sharply questioned a glaciogenic influence on diamictite deposition, most particularly at Sperry Wash sections. A key question remains whether glaciogenic versus non-glaciogenic diamictites can be differentiated from one another on textural (specifically micromorphological) grounds. The famous catalog of microstructures developed by van der Meer (1993) and Menzies et al. (2006) and later iterations (Menzies, 2012; Menzies and Meer, 2018) show that key structures can be found in both diamictites regardless of their mode of emplacement and, thus, likely only play a supporting role in the development of a final interpretation which must fully consider the geological context. Indeed, investigations of mass flow diamictons in glacial environments show that they may be impossible to differentiate from their glaciogenic counterparts (Phillips et al., 2022). This is also true for moraines that have been remobilized by mass flows (Phillips and Kearsey, 2020). Thus, the study of these “tectonomicts” (Menzies et al., 2006; Menzies, 2012) may play a vital role in understanding the deformation process but may be less useful in resolving the deep-time controversy about glaciogenic influence in deep time, unless the glacial context is already firmly established (Busfield and Le Heron, 2018). There have been few attempts to highlight the formation of cross-cutting fabrics in laboratory experiments (Iverson et al., 2008) to quantify strain rates and clast orientations; the latter is very similar to the findings described within this study. Thus, based on the current understanding of the fabric evolution of modern and Quaternary “tectonomicts,” there is little to support a direct glaciogenic origin for the diamictites in the Valjean Hills.
5.2 Diamictite fabrics as paleoslope and paleoflow proxy
The real power of fabric analysis of diamictites is their role in piecing together complex paleogeographic puzzles. Our results illustrate that both microfabric and macrofabric analyses of three diamictite intervals in the Valjean Hills reveal a strongly developed SE-oriented linear clast orientation. In neighboring outcrop belts, such as the Sperry Wash sections (Busfield and Le Heron, 2016) and in the central and southern Kingston Range (Le Heron and Busfield, 2016; Le Heron et al., 2018), a strongly preferred SE paleoflow orientation is recognized. In these previous studies, paleoflow was determined specifically from the crest orientation of current ripples or the 3D expression of cross laminae in sandstone beds. In those locations, whose stratigraphy was interpreted as a combination of debrites, hyperconcentrated flow deposits, and turbidites, evidence of emplacement orientation of apparently massive diamictites was lacking. Our new fabric data demonstrate that the linear clast orientation in diamictites—expressed equally well at the micro- and macroscale—can be used to proxy paleoslope, or at least paleoflow. This approach provides a vital data point in the schematic paleogeographic reconstruction (Figure 13). Moreover, we propose that this method—teasing out a well-expressed fabric orientation from deposits that superficially appear structureless—may have a significant role to play in the interpretation of other diamictite-rich successions. This approach may be adopted to solve a number of paleogeographic problems throughout a wide spectrum of the deep-time record. For example, in the Late Paleozoic record of South Africa, Dietrich and Hoffmann (2019) proposed a new model of grounding zone wedge deposition for stacked diamictites that show some similarity to the Valjean Hills succession described herein. Nevertheless, information on ice flow direction and paleoslope orientation is largely missing or anecdotal, yet could potentially be resolved with quantitative fabric analysis. A similar problem concerns basin configuration during deposition of the Grand Conglomérat (Cryogenian) of the Congo Basin, a succession dominated by mass flow diamictites (Kennedy et al., 2019).
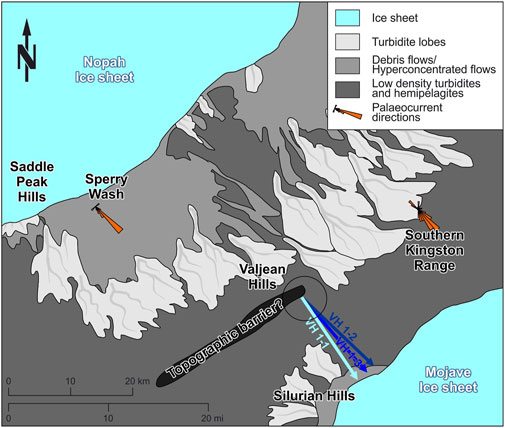
FIGURE 13. Paleogeographic depositional setting during the formation of the Cryogenian Kingston Peak Formation in the southeastern Death Valley area with the assumed position of the Valjean Hills indicated by the circle (modified after Le Heron & Busfield, 2016). Based on the internal fabric pattern in each sample, the dominant linear fabric indicates a direction of deposition toward the SE.
6 Conclusion
• A novel integrated approach incorporating both outcrop and thin-section scale (i.e., micromorphology) approaches to diamictites of the KPF in the Valjean Hills (California, United States) reveals considerable heterogeneity and the development of a pronounced fabric in deposits that would otherwise be dismissed as structureless. This underscores the value of quantitative structural measurements in complex sedimentary rocks to maximize data generation.
• Fabric analysis reveals that diamictites were likely emplaced as a series of debris flows with substantial fluid involvement. However, the degree of glacial influence remains ambiguous. The three studied diamictites share morphological and compositional similarities.
• For the first time, we present evidence that a paleoslope orientation can be inferred from diamictite fabric, an approach that is corroborated by paleocurrent data measurements collected independently in previous studies. An SE-oriented paleoslope is recognized, allowing the Valjean Hills to be placed within a clear paleogeographic framework. This approach, thus, has the potential to be applied to other diamictite-dominated records and, thus, aid in paleogeographic analysis.
• We promote the fabric analysis of diamictites as the best practice in the deep-time record. Field measurements of clast orientations usually lack sufficient quantity and precision, whereas reconstructed (3D) fabric models provide an easy way to further study outcrops under time-restricted field work conditions with unparalleled accuracy.
• In summary, it is hoped that this study has illuminated how the quantitative analysis of diamictites of both glacial and non-glacial origins has the potential to inform us about regional paleoslope orientations. This approach should, therefore, have wide applicability to other paleogeographic studies in deep time and more recent strata alike.
Data availability statement
The original contributions presented in the study are included in the article/Supplementary Material; further inquiries can be directed to the corresponding author.
Author contributions
CK wrote the initial draft, designed the study, and analyzed most of the samples. DL contributed in writing and refining individual sections and heavily shaped the conception of the study. KP partially analyzed samples. DL, EP, DS, and TV contributed to revision, reading, and approval of the submitted version. All authors contributed to the article and approved the submitted version.
Funding
This study was funded by the University of Vienna.
Acknowledgments
The authors thank three reviewers for very constructive comments, which helped to improve their paper. Additionally, they would like to thank Marie E. Busfield for her editorial work. They wish to thank Cynthia Kienitz for her hospitality, hosting their group for their field seasons in Death Valley over the last decade. They also wish to thank the University of Vienna for funding this work via a PraeDoc position to CK.
Conflict of interest
The authors declare that the research was conducted in the absence of any commercial or financial relationships that could be construed as a potential conflict of interest.
Publisher’s note
All claims expressed in this article are solely those of the authors and do not necessarily represent those of their affiliated organizations, or those of the publisher, the editors, and the reviewers. Any product that may be evaluated in this article, or claim that may be made by its manufacturer, is not guaranteed or endorsed by the publisher.
References
Arnaud, E., and Eyles, C. H. (2002). Glacial influence on neoproterozoic sedimentation: The smalfjord formation, northern Norway. Sedimentology 49, 765–788. doi:10.1046/j.1365-3091.2002.00466.x
Arnaud, E., Halverson, G. P., and Shields-Zhou, G. (2011). “Chapter 1, the Geological record of the Neoproterozoic ice ages,” in The geological record of neoproterozoic glaciations. Editors E. Arnaud, G. P. Halverson, and G. Shields-Zhou (London: Geological Society), 1–16. doi:10.1144/M36.1
Busfield, M. E., and Le Heron, D. P. (2016). A Neoproterozoic ice advance sequence, Sperry Wash, California. Sedimentology 63, 307–330. doi:10.1111/sed.12210
Busfield, M. E., and Le Heron, D. P. (2018). Snowball Earth under the microscope. J. Sediment. Res. 88 (5), 659–677. doi:10.2110/jsr.2018.34
Calzia, J. P., and Troxel, B. W. (2002). Geologic map of the valjean Hills 7.5’ quadrangle, san bernardino county, California. United States Geological Survey.
Cawood, A. J., Bond, C. E., Howell, J. A., Butler, R. W. H., and Totake, Y. (2017). LiDAR, UAV or compass-clinometer? Accuracy, coverage and the effects on structural models. J. Struct. Geol. 98, 67–82. doi:10.1016/j.jsg.2017.04.004
CloudCompare (2022). Cloudcompare – 2.11.3 (anoia). Available at: http://cloudcompare.org/.
Delpomdor, F. R. A., Tack, L., and Préat, A. R. (2017). Facies and micromorphology of the neoproterozoic upper diamictite Formation in the democratic republic of Congo: New evidence of sediment gravity flow. Geol. Belg. 20, 69–79. doi:10.20341/gb.2017.004
Denis, M., Guiraud, M., Konaté, M., and Buoncristiani, J. F. (2010). Subglacial deformation and water-pressure cycles as a key for understanding ice stream dynamics: Evidence from the late ordovician succession of the djado basin (Niger). Int. J. Earth Sci. Geol. Rundschau) 99, 1399–1425. doi:10.1007/s00531-009-0455-z
Dietrich, P., and Hoffmann, A. (2019). Ice-margin fluctuation sequences and grounding zone wedges: The record of the late palaeozoic ice age in the eastern karoo basin (dwyka group, south Africa). Depositional Rec. 5, 247–271. doi:10.1002/dep2.74
Fleming, E. J., Benn, D. I., Stevenson, C. T. E., Petronis, M. S., Hambrey, M. J., and Fairchild, I. J. (2016). Glacitectonism, subglacial and glacilacustrine processes during a Neoproterozoic panglaciation, north-east Svalbard. Sedimentology 63, 411–442. doi:10.1111/sed.12251
Gehrmann, A., Hüneke, H., Meschede, M., and Phillips, E. (2017). 3D microstructural architecture of deformed glacigenic sediments associated with large-scale glacitectonism, Jasmund Peninsula (NE Rügen), Germany. J. Quat. Sci. 32 (2), 213–230. doi:10.1002/jqs.2843
Hodges, K. V., McKenna, L. W., and Harding, M. B. (1990). “Chapter 19: Structural unroofing of the central Panamint mountains, Death Valley region, southeastern California,” in Basin and range extensional tectonics near the latitude of las vegas, Nevada. Editor B. P. Wernicke, 176, 377–390. GSA Memoirs. doi:10.1130/MEM176-p377
Iverson, N. R., Hooyer, T. S., Thomason, J. F., Graesch, M., and Shumway, J. R. (2008). The experimental basis for interpreting particle and magnetic fabrics of sheared till. Earth Surf. Process. Landforms 33, 627–645. doi:10.1002/esp.1666
Kennedy, K., and Eyles, N. (2021). Syn-rift mass flow generated ‘tectonofacies’ and ‘tectonosequences’ of the Kingston Peak Formation, Death Valley, California, and their bearing on supposed Neoproterozoic panglacial climates. Sedimentology 68, 352–381. doi:10.1111/sed.12781
Kennedy, K., Eyles, N., and Broughton, D. (2019). Basinal setting and origin of thick (1·8 km) mass-flow dominated Grand Conglomérat diamictites, Kamoa, Democratic Republic of Congo: Resolving climate and tectonic controls during Neoproterozoic glaciations. Sedimentology 66 (2), 556–589. doi:10.1111/sed.12494
Lachniet, M. S., Larson, G. J., Lawson, D. E., Evenson, E. B., and Alley, R. B. (2001). Microstructures of sediment flow deposits and subglacial sediments: A comparison. Boreas 30, 254–262. doi:10.1080/030094801750424166
Le Heron, D. P., and Busfield, M. E. (2016). Pulsed iceberg delivery driven by Sturtian ice sheet dynamics: An example from Death Valley, California. Sedimentology 63, 331–349. doi:10.1111/sed.12225
Le Heron, D. P., Busfield, M. E., Ali, D. O., Vandyk, T. M., and Tofaif, S. A. (2019). A tale of two rift shoulders, and two ice masses: The cryogenian glaciated margin of Death Valley, California. Geol. Soc. Spec. Publ. 475, 35–52. Glaciated Margins - The Sedimentary and Geophysical Archive (eds. Le Heron, D.P., hogan, K.A., Phillips, E.R., Huuse, M., Busfield, M.E., Graham, A.G.C). doi:10.1144/SP475.11
Le Heron, D. P., Busfield, M. E., and Prave, A. R. (2014). Neoproterozoic ice sheets and olistoliths: Multiple glacial cycles in the Kingston Peak Formation, California. J. Geol. Soc. Lond. 171, 525–538. doi:10.1144/jgs2013-130
Le Heron, D. P., Tofaif, S., Vandyk, T., and Ali, D. O. (2017). A diamictite dichotomy: Glacial conveyor belts and olistostromes in the Neoproterozoic of Death Valley. Geology 45, 31–34. doi:10.1130/g38460.1
Le Heron, D. P., and Vandyk, T. M. (2019). A slippery slope for Cryogenian diamictites? Depositional Rec. 5, 306–321. doi:10.1002/dep2.67
Le HeronBusfield, D. P. M. E., Ali, D. O., Tofaif, S. A., and Vandyk, T. M. (2018). The Cryogenian record in the southern Kingston Range, California: The thickest Death Valley succession in the hunt for a GSSP. Precambrian Res. 319, 158–172. doi:10.1016/j.precamres.2017.07.017
Lechte, M. A., Wallace, M. W., Hood, A. v. S., and Planavsky, N. (2018). Cryogenian iron formations in the glaciogenic Kingston Peak Formation, California. Precambrian Res. 310, 443–462. doi:10.1016/j.precamres.2018.04.003
Macdonald, F. A., Prave, A. R., Petterson, R., Smith, E. F., Pruss, S. B., Oates, K., et al. (2013). The Laurentian record of Neoproterozoic glaciation, tectonism, and eukaryotic evolution in Death Valley, California. GSA Bull. 125, 1203–1223. doi:10.1130/b30789.1
Menzies, J. (2012). Strain pathways, till internal architecture and microstructures - perspectives on a general kinematic model - a ‘blueprint’ for till development. Quat. Sci. Rev. 50, 105–124. doi:10.1016/j.quascirev.2012.07.012
Menzies, J., and Meer, J. J. M. (2018). “Chapter 21-micromorphology and microsedimentology of glacial sediments,” in Past glacial environments. Editors J. Menzies, and J. J. M. van der Meer (Elsevier), 753–806. doi:10.1016/B978-0-08-100524-8.00036-1
Menzies, J., van der Meer, J. J. P., and Ravier, E. (2016). A kinematic unifying theory of microstructures in subglacial tills. Sediment. Geol. 344, 57–70. doi:10.1016/j.sedgeo.2016.03.024
Menzies, J., van der Meer, J. J. P., and Rose, J. (2006). Till - as a Glacial “Tectomict”, its internal architecture, and the development of a “typing” method for till differentiation. Geomorphology 75 (1), 172–200. doi:10.1016/j.geomorph.2004.02.017
Moncrieff, A. C. M. (1989). “The tillite group and related rocks of east Greenland: Implications for late proterozoic palaeogeography,” in The caledonide geology of scandinavia. Editor R. A. Gayer, 285–297. Graham and Troman.
Nascimento, D. B., Ribeiro, A., Trouw, R. A. J., Schmitt, R. S., and Passchier, C. W. (2016). Stratigraphy of the Neoproterozoic Damara Sequence in northwest Namibia: Slope to basin sub-marine mass-transport deposits and olistolith fields. Precambrian Res. 278, 108–125. doi:10.1016/j.precamres.2016.03.005
Passchier, C. W., and Trouw, R. A. J. (2005). Microtectonics. Berlin, Heidelberg: Springer Verlag Berlin Heidelberg.
Petterson, R., Prave, A. R., and Wernicke, B. P. (2011). Glaciogenic and related strata of the neoproterozoic Kingston Peak Formation in the Panamint range, Death Valley region, California. Geol. Soc. Lond. Mem. 36, 449–458. doi:10.1144/M36.41
Phillips, E., Carter, G., and Teasdale, T. (2022). Microscale evidence of the role of water during the emplacement of mass flows in glacial environments. Q. J. Eng. Geol. Hydrogeology 55, 1–20. doi:10.1144/qjegh2021-026
Phillips, E., and Kearsey, T. I. (2020). Mass flow and hydrofracturing during Late Devensian moraine emplacement, NE Scotland. Proc. Geol. Assoc. 131, 730–750. doi:10.1016/j.pgeola.2020.08.002
Phillips, E., Spagnolo, M., Pilmer, A. C. J., Rea, B. R., Piotrowski, J. A., Ely, C. J., et al. (2018). Progressive ductile shearing during till accretion within the deforming bed of a palaeo-ice stream. Quat. Sci. Rev. 193. doi:10.1016/j.quascirev.2018.06.009
Phillips, E., van der Meer, J. J. M., and Ferguson, A. (2011). A new ‘microstructural mapping’ methodology for the identification, analysis and interpretation of polyphase deformation within subglacial sediments:. Quat. Sci. Rev. 19-20, 2570–2596. doi:10.1016/j.quascirev.2011.04.024
Prave, A. R. (1999). Two diamictites, two cap carbonates, two δ13C excursions, two rifts: The neoproterozoic Kingston Peak Formation, Death Valley, California. Geology 27, 339–342. doi:10.1130/0091-7613(1999)027<0339:tdtcct>2.3.co;2
Terry, J. P., and Goff, J. (2014). Megaclasts: Proposed revised nomenclature at the coarse end of the udden-wentworth grain-size scale for sedimentary particles. J. Sediment. Res. 84, 192–197. doi:10.2110/jsr.2014.19
Thiele, S. T., Grose, L., Samsu, A., Micklethwaite, S., Vollgger, S. A., and Cruden, A. R. (2017). Rapid, semi-automatic fracture and contact mapping for point clouds, images and geophysical data. Solid earth. 8, 1241–1253. doi:10.5194/se-8-1241-2017
Troxel, B. W. (1982). “Description of the uppermost part of the Kingston Peak Formation, amargosa rim canyon, Death Valley region, California,” in Geology of selected areas in the san bernardino mountains, western Mojave desert, and southern great basin. Editors J. D. Cooper, B. W. Troxel, and L. A. Wright, 61–70. GSA Cordilleran Section Field Trip Guidebook and Volume. Death Valley Publishing Company, Shoshone, CA.California.
Troxel, B. W. (1966). Sedimentary features of the later precambrian Kingston peak formation, Death Valley, California. GSA. Spec. Pap. 101, 341.
van der Meer, J. J. M., and Menzies, J. (2011). The micromorphology of unconsolidated sediments. Sediment. Geol. 3-4, 213–232. doi:10.1016/j.sedgeo.2011.04.013
van der Meer, J. J. P. (1993). Microscopic evidence of subglacial deformation. Quat. Sci. Rev. 12, 553–587. doi:10.1016/0277-3791(93)90069-X
Wright, L. A., Troxel, B. W., Williams, E. G., Roberts, M. T., and Diehl, P. E. (1974). Precambrian sedimentary environments of the Death Valley region, eastern California and Nevada. Geol. Soc. Am., 27–35. Guidebook: Death Valley region, California and Nevada [Prepared for the 70th Annual Meeting of Cordilleran Section, Geological Society of America].
Keywords: Neoproterozoic, diamictite, fabric, micromorphology analysis, photogrammetry, paleoflow direction, paleoreconstruction, basal sliding
Citation: Kettler C, Phillips E, Pichler K, Smrzka D, Vandyk TM and Le Heron DP (2023) 3D macro- and microfabric analyses of Neoproterozoic diamictites from the Valjean Hills, California (United States). Front. Earth Sci. 11:929011. doi: 10.3389/feart.2023.929011
Received: 26 April 2022; Accepted: 19 April 2023;
Published: 25 May 2023.
Edited by:
Marie Busfield, Aberystwyth University, United KingdomReviewed by:
Maxwell Lechte, McGill University, CanadaJohn L. Isbell, University of Wisconsin–Milwaukee, United States
Copyright © 2023 Kettler, Phillips, Pichler, Smrzka, Vandyk and Le Heron. This is an open-access article distributed under the terms of the Creative Commons Attribution License (CC BY). The use, distribution or reproduction in other forums is permitted, provided the original author(s) and the copyright owner(s) are credited and that the original publication in this journal is cited, in accordance with accepted academic practice. No use, distribution or reproduction is permitted which does not comply with these terms.
*Correspondence: C. Kettler, Y2hyaXN0b3BoLmtldHRsZXJAZ2Vvc3BoZXJlLmF0