 Minyeong Kim
 Seonghee Won
 Hyunsoo Lee
- National Typhoon Center, Forecast Bureau, Korea Meteorological Administration, Jeju, Republic of Korea
Introduction: When the forecasted typhoon track differs from the numerical model’s prediction, the estimated precipitation and wind from the model may not be reliable. Typically, forecasters receive numerical model forecasts with a delay of 4 h or more in calculation time. However, a more timely reference of precipitation and wind forecasts is required in an emergency with an approaching typhoon. Analyses of the observational data of typhoon-related characteristics, such as heavy rainfall and strong winds, from 1997 to 2021 revealed that their distribution areas are considerably affected by typhoon tracks. In this study, we developed a precipitation and wind prediction system based on the observational data of the typhoons that affected the Korean Peninsula.
Methods: Typhoon tracks were categorized into west-coast landfalls, southeast landfalls, and those passing the Korea Strait. Each category affects the Korean Peninsula differently in terms of rainfall and wind. We devised a system that predicts these patterns based on incoming typhoon tracks. We can make forecasts by comparing the approaching typhoons to previous instances and analyzing their center, movement direction, and size. Observations from these past typhoons were averaged to produce a forecast grid for each new typhoon.
Results: Our system, validated from 2019 to 2022, showed a wind speed root-mean-square error of 3.37 m/s and a precipitation accuracy index of 0.72. For comparison, traditional numerical models yielded 5.04 m/s and 0.75, respectively. This indicates that our system is comparably efficient and computationally less demanding.
Discussion: Our system’s strength is its ability to offer real-time typhoon forecasts, often faster than numerical models. However, its dependence on historical data limits its predictive power for atypical weather scenarios. It is essential to consider integrating ensemble models with these observations for enhanced accuracy. Since 2022, this system has been operational at the Korea Meteorological Administration, showing consistent reliability in forecasting.
1 Introduction
The Korea Meteorological Administration (KMA) issues a typhoon advisory when the center of a typhoon or its strong wind radius enters the emergency zone (north of 28°N, west of 132°E) and is expected to impact the land or sea of Korea. Detailed additional information on hazards, including heavy rain, wind gusts, and strong winds caused by typhoons, is provided to support decision-making and is classified as typhoon impact (National Typhoon Center, 2011). Among the various forecast elements, typhoon tracks have garnered notable social interest and a strong demand for accurate forecasts (Yamaguchi et al., 2017). The typhoon track largely determines the effects of other forecast elements, including precipitation, wind, and wave height (Kim et al., 2020; Wei and Chang, 2021; Bakker et al., 2022; Wang et al., 2023). The numerical models have continued to improve their predictions regarding precipitation and winds during typhoons (Demaria et al., 2013; Lin et al., 2015; Wu et al., 2018). Forecasting relies on numerical models to predict precipitation and winds during typhoon impacts. The typhoon track of the numerical model has a forecast error of approximately 200 km for a 3-day prediction and approximately 400 km for a 5-day prediction (Numerical Modeling Center, 2023). In case of an incorrect prediction of the typhoon track by the numerical model, a discrepancy occurs between the predicted track by the model and the forecasted track. This discrepancy poses a challenge in accurately predicting the distribution of the precipitation and wind that aligns with the typhoon forecast. Therefore, it is important to improve the prediction accuracy to achieve consistency between typhoon-track forecasts and precipitation and wind forecasts.
Herein, we investigated the different typhoon-related characteristics regarding the distribution of precipitation and winds across the Korean Peninsula based on the tracks of past typhoons that have affected the Korean Peninsula. Additionally, we developed a prediction system based on the analyzed typhoon tracks to support precipitation and wind forecasting in case the typhoon followed a similar track. To develop the prediction system, typhoons with similar characteristics were selected and used as predictive factors. Fang and Kuo (2013) conducted a study to forecast typhoon precipitation using outputs form an ensemble numerical model. In the present study, we adopted their method but with the reselection of similar members every 1 h. While previous research, such as that conducted by Kim et al. (2019) and Wang et al. (2023), has forecasted cumulative precipitation by selecting typhoons with analogous intensity and trajectories, there is potential for inaccuracies in the predictions as they used all the data from the entire duration of the selected typhoon. Following this, in this study, we further improved the accuracy of our forecasts by selecting past typhoon cases for each hourly forecasting time interval. Recently, typhoon-induced localized heavy rainfalls have caused landfall-related damages, prioritizing the need to improve the prediction accuracy of typhoon-induced precipitation. The typhoon HINNAMNOR occurred on 28 August 2022, and reached a super-strong stage with a central pressure of 915 hPa on 30 August 2022. On 6 September 2022, it passed over the Gyeongnam coast of the Korean Peninsula, causing heavy rainfall mainly in the Jeju and southern regions. A daily rainfall of 703 mm was recorded at Hallasan Mountain on Jeju Island, and 342.4 mm at Pohang, located in the southeastern peninsular region. The heavy rainfall in Pohang caused rivers to overflow, resulting in numerous casualties and notable property damage. The forecasting system developed in this study can generate precipitation and wind forecasts that align with the expected track of a typhoon when provided with the typhoon information. Unlike the time-taking global numerical models, this system can provide fast and accurate precipitation and wind predictions during typhoons, which can help reduce the loss of property and human life during a disaster.
2 Characterization of typhoon impacts
Usually, forecasts of strong winds and the distribution of precipitation areas rely on the results of the numerical models. However, when forecasters announce typhoon information, in addition to the numerical models, they also refer to various data sources, including satellites, observations, and forecast error trends of the numerical models. If the forecasted typhoon track aligns with the numerical model’s, the wind and precipitation predicted by the numerical model can serve as a good reference. However, if the predicted typhoon track differs from that forecasted typhoon track, the precipitation and wind predictions of the numerical model become unsuitable for forecasting.
In this study, past observations of the precipitation and wind patterns were analyzed to improve the accuracy of precipitation and wind predictions and make them consistent with the predicted typhoon track. The prediction method involved selecting past typhoon cases similar to the forecasted location of a developing typhoon and using those case-related observations to predict the incoming precipitation and wind. This method assumes that typhoons at similar locations and progression tracks will have similar precipitation and wind patterns. To apply this concept, it was necessary to conduct a detailed investigation regarding the effects of the typhoon track on the distribution of precipitation and wind across the Korean Peninsula. By analyzing the variations in the typhoon-track-specific precipitation and wind distributions, it might be possible to develop more accurate methods for predicting precipitation and wind patterns.
The past typhoon cases (627 cases) from 1997 to 2022 were selected and investigated for their intensity and distribution of wind and precipitation along the typhoon track (Figure 1). Adequate wind and precipitation observational data for the analysis have been available since 1997. Of the 627 typhoons that occurred in the northwest Pacific Ocean, 79 typhoons were active for >6 h in a specified area (from 32.6°N to 39°N and from 124°E to 132°E). The area categorization was determined based on the impact of the typhoon on the Korean Peninsula. The criterion of being in the specified area for >6 h implied that the typhoon’s center was in that area more than once. Although the actual typhoon remained in the area for >6 h, the track data were excluded if it did not exist in the area for >two points.
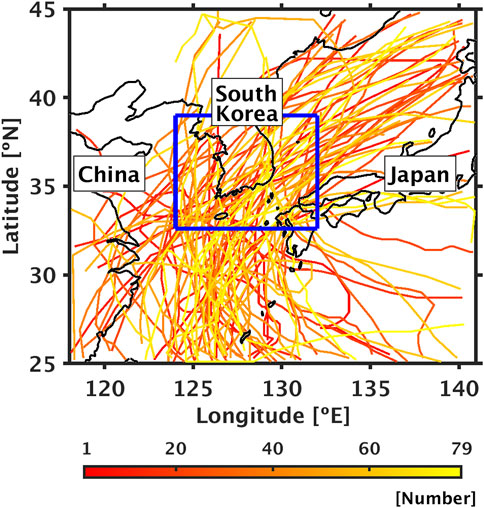
FIGURE 1. Boundary region for classifying typhoons used in the analysis (blue line) and tracks of classified typhoons (red to yellow colored lines).
The K-means clustering algorithm was used to classify the selected typhoon tracks that impacted the Korean Peninsula. The best tracks from the Regional Specialized Meteorological Center (RMSC), Tokyo were used to classify the typhoon tracks. To classify typhoon tracks using the k-means algorithm, it was necessary to determine the appropriate number of classifications. The results of comparing two to five typhoon track classifications were analyzed. In the case of >four classification categories, the data resulted in duplicate classifications of typhoon tracks; thus, it was deemed unsuitable as classification standards. The optimal typhoon track classification results were obtained when the k-means algorithm was applied to the three categories. The typhoon tracks were classified into the following three classification categories, with the smallest error values: those that caused landfall on the west coast (Figure 2A), those that caused landfall on the south coast (Figure 2B), and those that passed between Korea and Japan (Figure 2C).
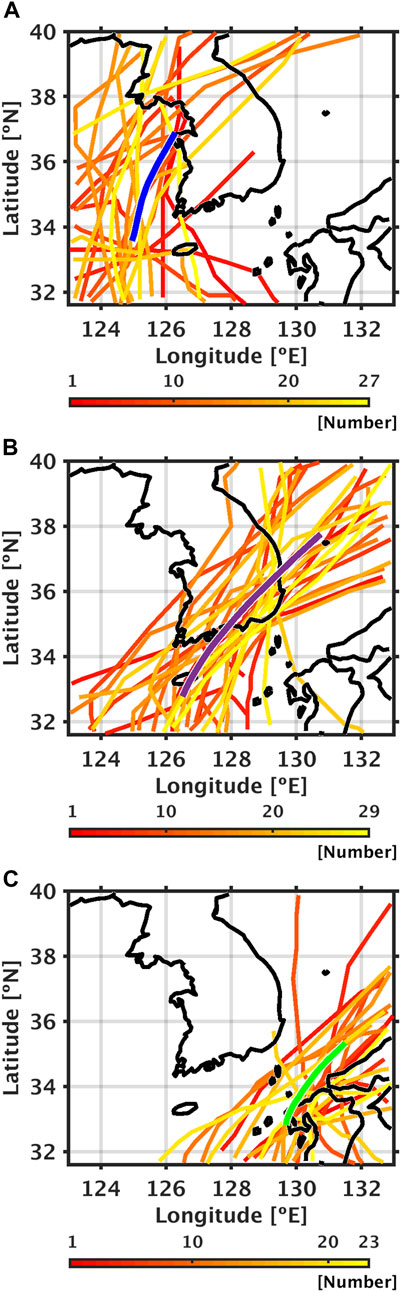
FIGURE 2. Tracks of three typhoons categorized into (A) typhoons entering the west coast (average track is blue line), (B) typhoons making landfall on the south coast (average track is purple line), and (C) typhoons crossing the Korea Strait between South Korea and Japan (average track is green line).
The distribution characteristics of wind and precipitation along the typhoon tracks of the three categories were analyzed using past observations. The past data used 10-min average wind speed values and 60-min cumulative precipitation values obtained from the Automatic Weather Station (AWS). The average maximum wind speed and cumulative precipitation during the typhoon impact period were calculated, which was defined as the period when the center of the typhoon was within the area of 124°E to 132°E and 32.6°N to 39°N. These calculations were performed for each track and averaged for the three classification categories. The maximum wind speed and cumulative precipitation values were calculated at each observation point. The results showed that each track’s distribution areas with strong winds were similar. Typhoons that caused landfall on the west coast showed an L-shaped distribution of average winds (Figure 3A). Typhoons that caused landfall on the southern coast showed a U-shaped distribution of average winds (Figure 3B). The typhoons between Korea and Japan showed a J-shaped distribution of average winds (Figure 3C).
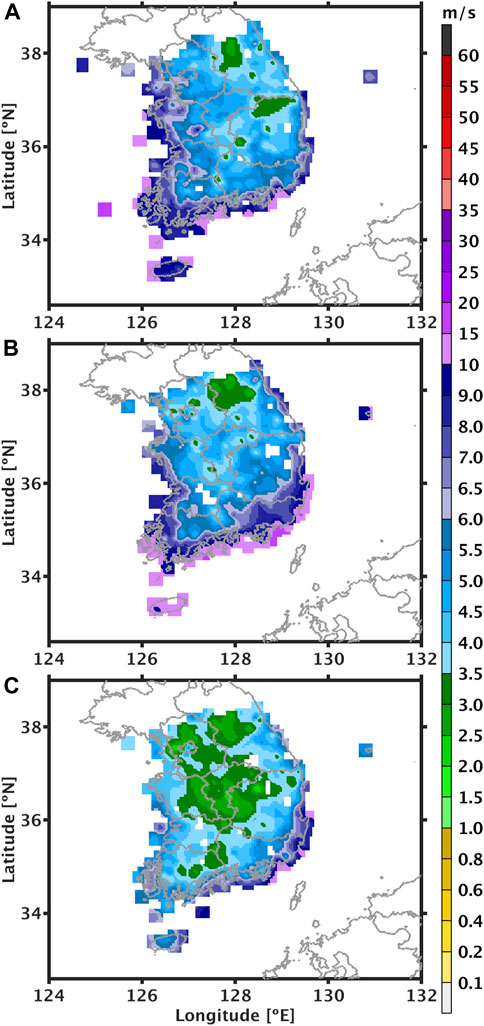
FIGURE 3. (A) Average wind speed distribution of typhoons along the west coast, (B) Average wind speed distribution of typhoons along the south coast, and (C) Average wind speed distribution of typhoons between Korea and Japan.
Strong winds tended to have different distributions along the categorized typhoon tracks. Similarly, the distribution of cumulative precipitation during the typhoon impact period varied along the track. For the typhoons that caused landfall, heavy precipitation zones appeared on the southwest coast (Figure 4A). For typhoons that caused landfall on the southern coast, heavy precipitation was observed in the central region of the southern coast and along the eastern coast (Figure 4B). The precipitation zones appeared on the southeastern coast of the Korean Peninsula for typhoons passing through the Korea Strait between South Korea and Japan (Figure 4C).
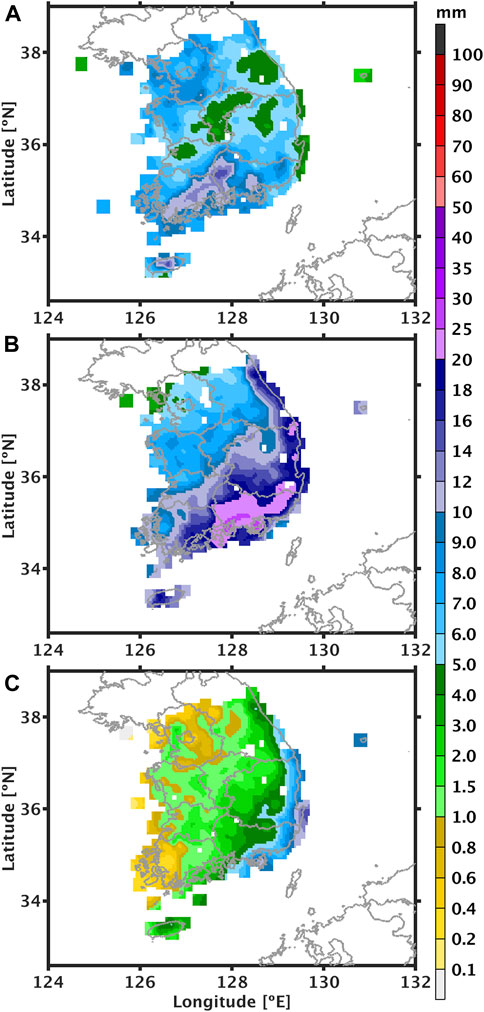
FIGURE 4. (A) Mean cumulative precipitation distribution for typhoons passing over the West Coast, (B) Mean cumulative precipitation distribution for typhoons passing over the South Coast, and (C) Mean cumulative precipitation distribution for typhoons passing between Korea and Japan.
The average wind and precipitation distributions were similar when categorized into similar typhoon tracks. However, in each category, there were cases in which the wind and precipitation distributions differed even with similar typhoon tracks. This was probably because even if the typhoon track within the impact area were similar, the track it takes before causing landfall, the moving speed, intensity, and size of the typhoon could have varied. However, the average wind and precipitation distributions were similar along the typhoon track. Therefore, this prediction system for forecasting typhoon precipitation and wind for the Korean Peninsula was developed by considering the typhoon size and direction of movement as additional selection criteria.
3 Data and forecasting methods
The typhoon tracks affecting the Korean Peninsula were classified into three patterns using historical observations. The average distribution of wind and precipitation for each category differed based on the classification of the typhoon track during this period. We developed a method for predicting wind and precipitation during the typhoon impact period using these typhoon-induced precipitation and distribution characteristics. By selecting past typhoon cases with centers that were most similar to the expected location of the typhoon, precipitation (or wind) intensity and distribution data were generated by averaging the precipitation (or maximum wind speed) at the observation point at that time. To select similar past typhoon cases, 1-hourly data for typhoons affecting the Korean Peninsula from 1997 to 2021 were used. By linearly extrapolating the 6-hourly data (best track of RSMC Tokyo) to 1-hourly intervals, the calculated 1-hourly typhoon center location and intensity were used for forecasting.
The factors that can be used to select similar typhoon cases are the typhoon’s center, direction of movement, size, intensity, and speed. The typhoon’s center, size, and intensity were linearly interpolated at 1-h intervals, and its direction of movement and speed were calculated using the hourly center location information. Precipitation and wind observations for selected periods of similar typhoon cases in the historical past were obtained from the observations of the KMA AWS. These data include 10-min average wind speed values and 1-h cumulative precipitation values stored between 1997 and 2021. In total, 761 automatic weather stations on the Korean Peninsula were used, with some showing no observations between 1997 and 2021.
To determine the results of producing wind forecasts through data synthesis using past similar typhoon cases, the developed technique was used for the impact period of Typhoon BAVI at 13:00 UTC on 26 August 2020. At that time, the typhoon was centered in the West Sea of the Korean Peninsula. The direction of the typhoon’s movement indicated a northward track (Figure 5). Among the typhoons from 1997 to 2021, 24 cases with similar centers were selected (Figure 5A). The 24 selected cases included the same typhoon but with different time centers interpolated at 1-h intervals. The same typhoon event, but with different precipitation data at different 1-h intervals from the typhoon center, represented different data. The selected typhoon cases with similar centers also included cases in which the typhoon moved in different directions. The average wind speeds of the 24 selected typhoons were higher along the western and southern coasts of the Korean Peninsula (Figure 5B). The average wind speed of a typhoon is calculated by averaging the 1-h maximum wind speed observations from selected similar cases. Nine cases had similar movement directions among the selected typhoons with similar centers (Figure 5C). The average wind speeds for these nine typhoons were relatively weak inland, whereas there were strong wind areas along the southwest coast and Jeju Island (Figure 5D). From the selected nine cases, typhoons with similar radii were reselected and seven similar typhoons were derived. Compared to the simple average of the 24 cases, the distribution of average wind speeds considering all three conditions (distance, direction, and size) revealed an expanded area of strong winds along the southwest coast. Individual cases selected as similar (yellow boxes) or excluded (red and blue boxes) cases for each condition are shown in Figure 6. Most cases that were excluded as similar cases, owing to differences in the direction of movement, exhibited either excessively strong or weak wind speeds. Typhoons that were excluded due to their size showed stronger wind fields on the southwest coast and were appropriately removed (Figure 6). We found that the forecast accurately predicted wind strength and distribution by comparing the wind forecasts produced with the observed wind speed values in the AWS at 13:00 UTC on 26 August 2020 (Figure 7).
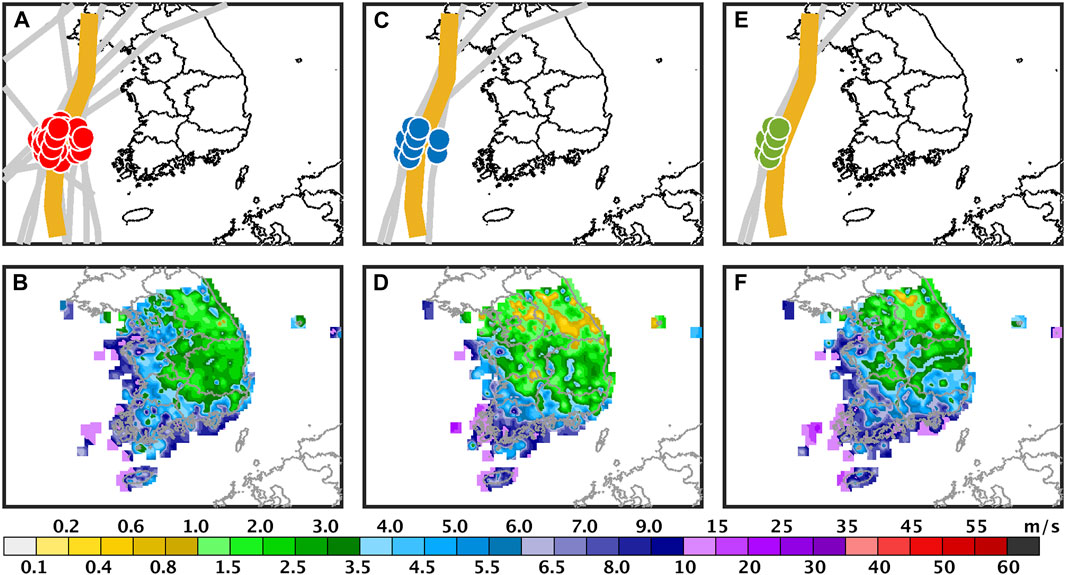
FIGURE 5. The yellow line is the track of Typhoon BAVI. (A) Tracks (gray lines) and centroids (red circles) of 24 typhoons classified by distance similarity. (B) represents the average wind speed distribution of the 24 classified tracks. (C) represents the tracks (gray lines) and centers (blue circles) of the nine similar cases, which are classified by distance and direction of movement. (D) is the average wind speed distribution of the nine classified cases. (E), the tracks (gray lines) and centers (green circles) of the seven best-case typhoons classified by distance, direction of movement, and typhoon size. (F) Average wind speed distribution of the 7 classified cases.
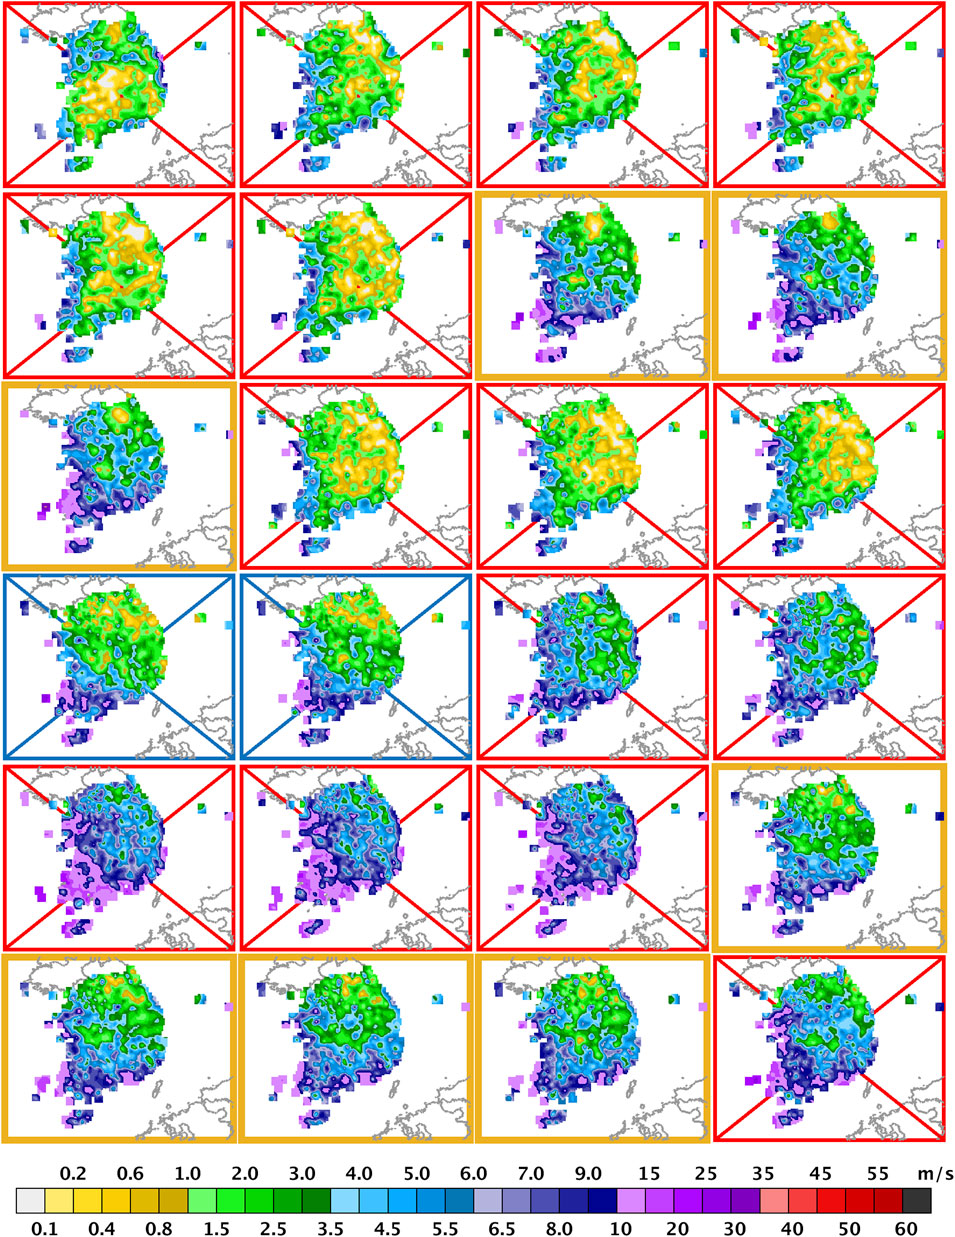
FIGURE 6. Sample of the forecast production process with 24 wind speed observations selected as similar cases. Red and blue lines show excluded cases with added classification conditions. The final selected similar cases are colored yellow.
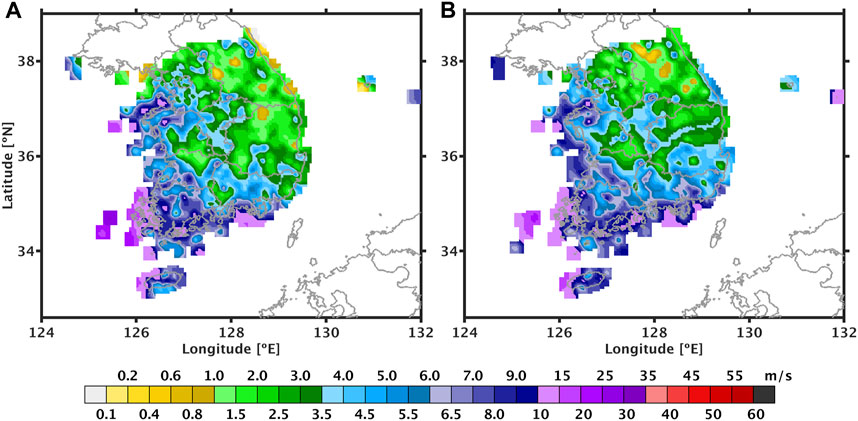
FIGURE 7. Distribution of observed wind speeds during Typhoon BAVI (A) and predicted wind speeds by averaging over similar cases (B).
This study extracts similar typhoon cases and uses the maximum observed wind speed and cumulative precipitation data from those instances. Observation points may be added or removed, resulting in periods without data. Additionally, partial data loss may occur due to issues with observation equipment. Predictions of maximum wind speed and cumulative precipitation derived from observations require validation from all observation points. The Multiquadric interpolation method (MQI) (Hardy, 1971) was used to interpolate forecasts at arbitrary points or convert them to gridded data. Eq. 1 shows H(X) as the spatially varying background field, Q as the relationship between observation point Xi and X, and αi as the weighting factor.
The MQI method models the relationship between observations as a hyperbolic function (Eq. 2), with c as an arbitrary, typically small constant.
The study employs a two-dimensional hyperbolic function, as shown in Eq. 3.
For each observation point (xj, yj), H is expressed by Eq. 4, and Q by Eq. 5.
The predicted values, H (xj, yj), correspond to a set of approximately 700, which is the number of materials produced, and ai is also of the same number. This is represented in matrix form as Eq. 6. Solving Eq. 6 for ai corresponds to Eq. 7.
To calculate the value for the point (xg, yg), which is denoted as Hg, multiply ai by the calculated Qgi (defined by Eq. 9) as shown in Eq. 8.
4 Sensitivity experiment
Sensitivity experiments were performed to determine the optimal objective criteria for selecting historical typhoon scenarios. For the objective selection of similar typhoon cases and improvement of prediction accuracy, the factors used to select similar cases included the distance between typhoon centers, the direction of typhoon movement, and the wind radius of the typhoon. Other factors, such as typhoon intensity (maximum wind speed and central pressure) and movement speed, were excluded from the analysis because they tend to significantly reduce the number of cases during the classification process. Sensitivity experiments were performed to determine the variables and threshold values for selecting similar typhoons. Experiments were performed separately for precipitation and wind forecasting. In the sensitivity experiment, the precipitation and wind forecast data for the typhoon period were compared with the observed data (AWS), and the root-mean-square error (RMSE) value was calculated to determine forecast performance. To reduce the excessive calculation time, the procedure used was to determine the value of one variable and then determine the next variable sequentially. The variables used in the calculation were the distance from the typhoon center, the direction of the typhoon movement, and the typhoon size. First, a sensitivity experiment was performed to predict the wind by changing the threshold for the distance from the typhoon center from 30 to 130 km in increments of 10 km (Figure 8). The results indicated that the best prediction accuracy was obtained by averaging the selected cases with the distance between typhoons within 50 km. We maintained the typhoon center distance criterion in the next experiment at 50 km. We incrementally increased the criterion for the difference in typhoon movement direction from 10° to 80° at an interval of 10°. If past typhoon cases are consistent with the current typhoon, there will be no difference in the direction of movement, which will be 0°. In this experiment, the highest accuracy was achieved by selecting similar typhoons when the angle between the direction of movement of the current forecast typhoon and that of past typhoons was within 40°. Sensitivity experiments related to typhoon size were performed by selecting typhoons within 50 km of each other and had angular differences in their directions of movement within 40°. The results showed that the best performance was achieved by excluding historical typhoons whose wind radius was less than 50% of the forecasted typhoon. There was no effect when historical cases with wind radii larger than those of the forecasted typhoon were excluded. Sensitivity experiments were performed for precipitation forecasts using the same methodology as the selection process for wind forecasts in the historical typhoon cases (Figure 9). The results showed that precipitation forecasts were most accurate when the distance between typhoons was within 70 km and the angle between their directions of movement was within 10°. The best results for predicting typhoon size were obtained when historical typhoons less than 70% of the predicted typhoon radii were excluded.
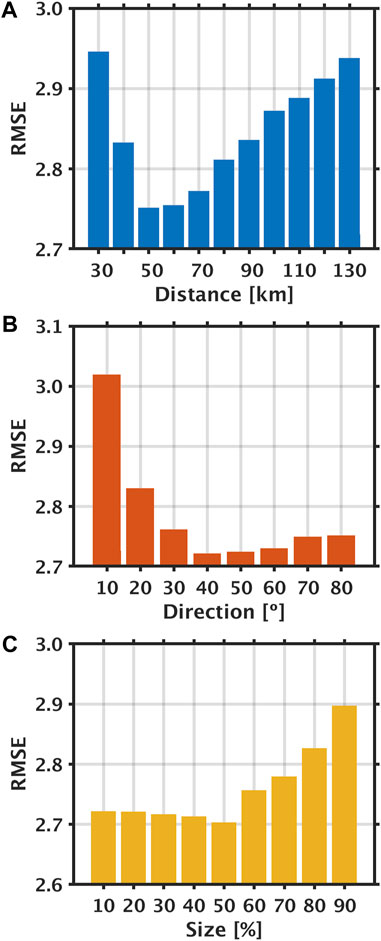
FIGURE 8. Results of sensitivity experiments for wind speed prediction during typhoons. Comparison of prediction accuracy as a function of the distance between typhoon centers (A), typhoon direction of movement (B), and typhoon size (C).
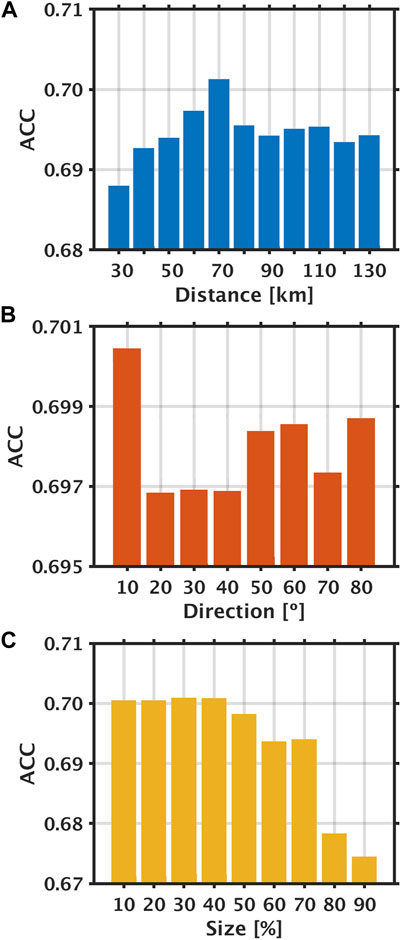
FIGURE 9. Results of sensitivity experiments for precipitation prediction during typhoons (larger ACC values lead to more accurate predictions). Accuracy as a function of the distance between typhoon centers (A), the direction of typhoon movement (B), and typhoon size (C).
5 Evaluation of forecast performance
Strong wind predictions for typhoons that passed through the region–124–132°E, 32.6–39°N were performed from 2019 to 2022. The data used for the forecast were the official typhoon forecast track of KMA, which was generated by assuming real-time forecasting. In selecting historical typhoon cases and combining observational data, typhoon cases or observations from later periods were excluded based on the forecast production time. Some differences were found between the real-time typhoon track of KMA and the best track. Based on this difference, we also verified the accuracy of the wind forecast during a typhoon, assuming that the forecast for the typhoon track was accurate. The wind forecasts were validated using three quantitative metrics: bias, RMSE, and correlation coefficient Eqs 10–12. These metrics were used to evaluate the accuracy and reliability of the forecasts.
In this study, wind forecasts based on the typhoon forecast track of KMA were validated for 13 typhoons that passed through a specified area. From the distribution of the predicted and observed values shown in Figure 10A, the deviation was calculated as −1.12, the RMSE was 3.72, and the correlation coefficient was 0.62. A best-track wind prediction experiment was performed for 12 typhoons, and the number of typhoons differed from the case using the typhoon forecast track of KMA. This is due to the difference in typhoons’ duration and center location between the forecast track and the best track. Because the typhoon cases for the experiment were selected based on whether the typhoon moved into the specified area, if the track of the reanalyzed typhoon was different, it may not have entered the area. Therefore, validating the results using the real-time forecast track and the Best Track cannot be compared for the same case. However, the overall average validation result indicates that the Best Track forecast has better accuracy. Figure 10B shows the distribution of the predicted and observed values for the forecast using the Best Track, with a deviation of −0.36, RMSE of 3.07, and a correlation coefficient of 0.71. When comparing the wind prediction results for each typhoon, the best track experiments showed smaller errors for most typhoons, except for a few cases (Tables 1, 2). This suggested that the more accurate the forecast track of a typhoon, the more accurate the wind prediction results.
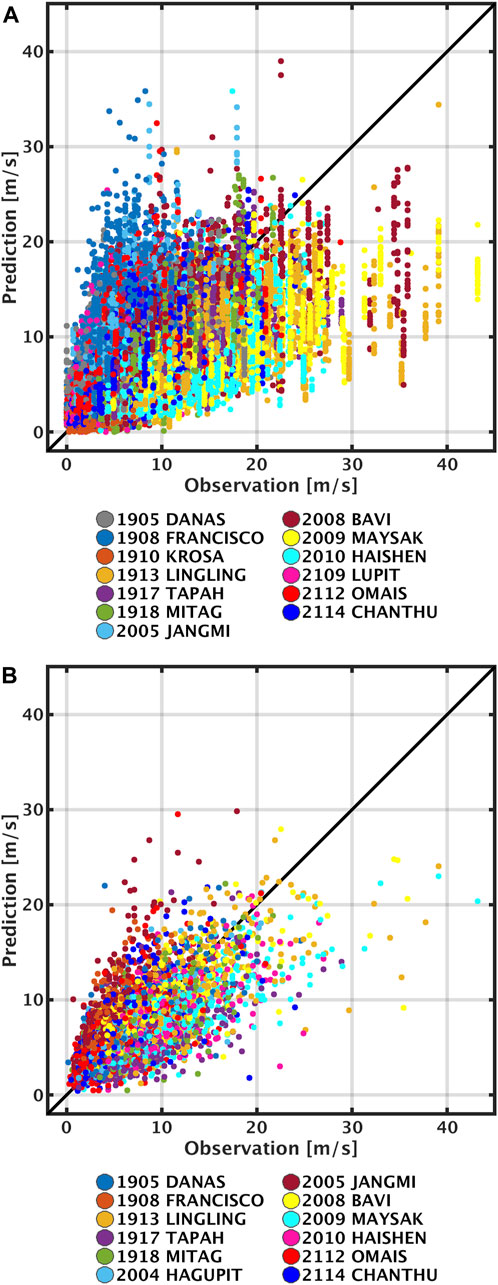
FIGURE 10. (A) Scatterplot of wind speed predictions produced using the typhoon track forecasted by the Korea Meteorological Administration and compared to AWS observations simultaneously. (B) Scatterplot of wind speed forecast results using Best track compared to AWS observations simultaneously.
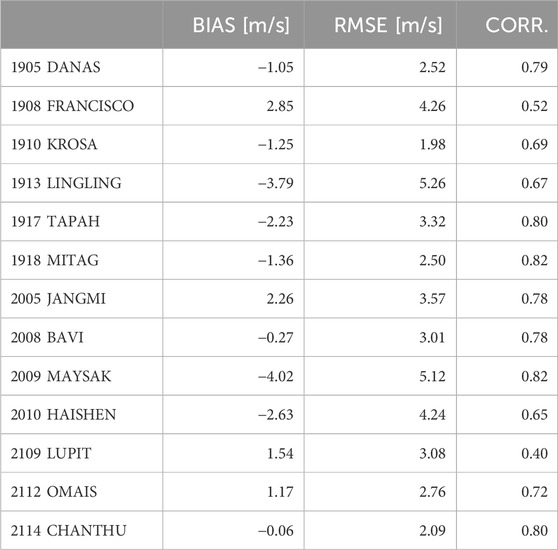
TABLE 1. Validation results of maximum wind speed prediction using the typhoon track forecasted by the Korea Meteorological Administration and the observations of the automatic weather station at the same time (BIAS: mean deviation, RMSE: root mean square error, CORR: correlation coefficient).
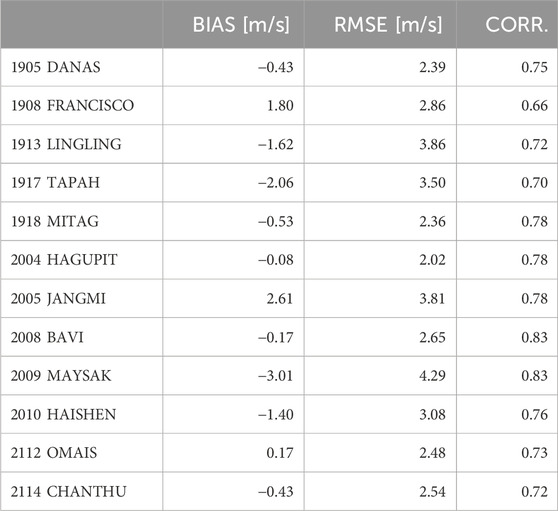
TABLE 2. Validation results of maximum wind speed using the best track and the automatic weather station observations simultaneously (BIAS: mean deviation, RMSE: root mean square error, CORR: correlation coefficient).
A categorical verification method was used for the forecasts of typhoon precipitation. This method verifies the accuracy by identifying the occurrences of precipitation based on a specific threshold. It uses a division table to differentiate between the observed and predicted values and evaluates performance using various forecast evaluation indices. The division table consists of “Hit” “Miss” “False alarm” and “Correct negative” (Table 3). A “Hit” occurs when an event is predicted and happens. A “Miss” occurs when an event is predicted not to happen, but it happens. A “false alarm” occurs when an event is predicted but does not happen. Lastly, a “Correct negative” occurs when an event is predicted not to happen, and it indeed does not happen.
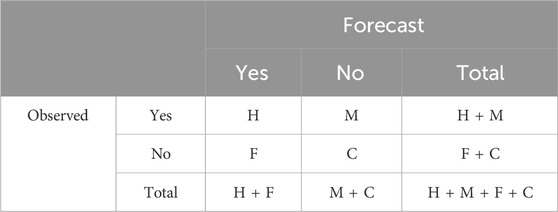
TABLE 3. Validation methods used to compare forecast accuracy (H: Hit, M: Miss, F: False alarm, C: Correct negative).
The forecast evaluation index is verified using accuracy, bias score, and the critical success index (CSI). Accuracy is an index that indicates the average level of agreement between the individual forecasts and observations. It is measured on a scale of 0–1, with a perfect forecast having a value of 1 (Eq. 13). Bias is an index measuring the agreement level between the average and the average forecasts. It ranges from zero to infinity, with a perfect forecast having a value of one (Eq. 14). The success threshold index is calculated by dividing the number of events by the sum of the total number of events associated with the occurrence of an event, whether forecasted or observed (Eq. 15). The value ranges from zero to one, with one representing a perfect forecast.
For each typhoon, the precipitation forecasts using the best track were generally better than those using the forecasted track, except for Typhoon DANAS (Category 5, 2019) and Typhoon BAVI (Category 8, 2020) (Tables 4, 5). This suggested that if typhoon forecast tracks become more accurate, it will be possible to achieve more accurate precipitation forecasts during typhoons, similar to the validation of wind forecasts.
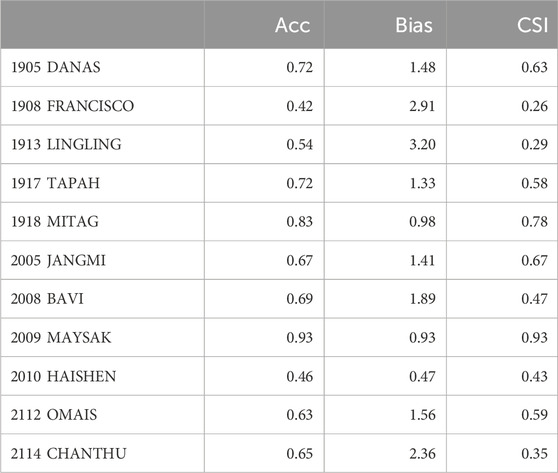
TABLE 4. Prediction of 1-h average precipitation using the typhoon track forecasted by the Korea Meteorological Administration and verification of results using the observations of the automatic weather station from the same period (Acc: accuracy, Bias: bias score, CSI: critical success index).

TABLE 5. Prediction of 1-h average precipitation using Best track and verification of results using the observations by the automatic weather station simultaneously (Acc: accuracy, Bias: bias score, CSI: critical success index).
6 Summary and conclusion
When a typhoon enters an emergency zone and is expected to affect the Korean Peninsula, the KMA enhances its response by issuing a special typhoon advisory and releasing additional detailed forecast information. These forecasts include information on the typhoon’s track, upcoming winds, and precipitation. However, for operational forecasters, wind and precipitation forecasts during typhoons highly depend on the NWPs. Particularly, difficulties occur in forecasting the distribution of wind and precipitation when there is a discrepancy between the track predicted by the NWP and that determined by the forecaster. In this study, we proposed a new methodology for predicting typhoon winds and precipitation to address these issues.
Typhoons that have affected the Korean Peninsula have exhibited various precipitation and wind distribution characteristics along their tracks. Under the assumption that a better understanding and use of these characteristics can lead to more accurate predictions of precipitation and wind distributions during typhoon events in the Korean Peninsula, we used the k-means clustering algorithm to classify historical typhoon data. Based on this, a system was developed to predict typhoon-induced precipitation and strong winds to forecast the duration of the impact of a typhoon on the Korean Peninsula. The prediction system generates data based on historical data, including the observed movement tracks of typhoons, their radii, wind speeds, and cumulative precipitation.
In this study, a method was developed to objectively select typhoon-similar cases and improve forecast accuracy. The variables used to select analogous cases and perform sensitivity experiments were also used to derive specific criteria. Through sensitivity experiments, we found that wind forecasts were most accurate when selecting similar cases with a distance of 50 km from the typhoon center, movement direction within 40°, and a typhoon size of at least 50%. For accurately forecasting precipitation, the best results were achieved when the distance from the typhoon’s center was 70 km and the direction of movement was within 10°. The forecast accuracy was improved by selecting similar cases with 70% or more typhoon sizes. Employing an accuracy reference value enhances the prediction performance compared to solely relying on existing empirical values (which are limited to 50 km for distance only). The accuracy of precipitation and wind forecasts increased by 2.94% and 22.69%, respectively. Such characteristics prove valuable for real-time typhoon forecasting. The research findings have been integrated into a real-time system to aid in practical forecasts. When a typhoon approaches the Korean Peninsula, the system automatically generates precipitation and wind forecast data based on the typhoon’s track. Although the accuracy of this approach might not surpass that of numerical model results, it boasts the benefit of minimal computational costs. Nonetheless, its reliance on historical observation data can constrain its predictive power for exceptionally strong or weak events. Efforts are underway to address these shortcomings by leveraging predictions from various ensemble models.
Data availability statement
Publicly available datasets were analyzed in this study. This data can be found here: (AWS, numerical model) for this study can be found in the (https://apihub.kma.go.kr). And (best-track data) can be found in the (https://www.jma.go.jp/jma/jma-eng/jma-center/rsmc-hp-pub-eg/besttrack.html).
Author contributions
MK: Conceptualization, Data curation, Formal Analysis, Methodology, Visualization, Writing–original draft. SW: Conceptualization, Formal Analysis, Supervision, Writing–original draft, Writing–review and editing. HL: Project administration, Supervision, Writing–review and editing.
Funding
The author(s) declare financial support was received for the research, authorship, and/or publication of this article. This research was supported by the project titled “Development of typhoon analysis and forecast technology (KMA2018-00722)” of the National Typhoon Center at the Korea Meteorological Administration.
Conflict of interest
The authors declare that the research was conducted in the absence of any commercial or financial relationships that could be construed as a potential conflict of interest.
Publisher’s note
All claims expressed in this article are solely those of the authors and do not necessarily represent those of their affiliated organizations, or those of the publisher, the editors and the reviewers. Any product that may be evaluated in this article, or claim that may be made by its manufacturer, is not guaranteed or endorsed by the publisher.
References
Bakker, T. M., Antolínez, J. A. A., Leijnse, T. W. B., Pearson, S. G., and Giardino, A. (2022). Estimating tropical cyclone-induced wind, waves, and surge: a general methodology based on representative tracks. Coast. Eng. 176, 104154. doi:10.1016/j.coastaleng.2022.104154
DeMaria, M., Knaff, J. A., Brennan, M. J., Brown, D., Knabb, R. D., DeMaria, R. T., et al. (2013). Improvements to the operational tropical cyclone wind speed probability model. Weather Forecast 28 (3), 586–602. doi:10.1175/waf-d-12-00116.1
Fang, X., and Kuo, Y. H. (2013). Improving ensemble-based quantitative precipitation forecasts for topography-enhanced typhoon heavy rainfall over taiwan with a modified probability-matching technique. Mon. Wea. Rev. 141, 3908–3932. doi:10.1175/mwr-d-13-00012.1
Hardy, R. L. (1971). Multiquadric equations of topography and other irregular surfaces. J. Geophys. Res. 76 (8), 1905–1915. doi:10.1029/jb076i008p01905
Kim, H. J., Moon, I. J., and Kim, M. (2019). Statistical prediction of typhoon-induced accumulated rainfall over the Korean Peninsula based on storm and rainfall data. Meteorol. Appl. 27, e1853. doi:10.1002/met.1853
Kim, J. S., Chen, A., Lee, J., Moon, I. J., and Moon, Y. I. (2020). Statistical prediction of typhoon-induced rainfall over China using historical rainfall, tracks, and intensity of typhoon in the Western North Pacific. Remote Sens. 12, 4133. doi:10.3390/rs12244133
Lin, Z. P., Zhou, S. W., and Wen, J. C. (2015). Application of ECMWF thin-grid 10m wind fields in “tiantu” heavy wind forecast. Meteorol. Hydrol. Mar. Instrum. 32 (3), 7–12. in Chinese. doi:10.19441/j.cnki.issn1006-009x.2015.03.002
National Typhoon Center (2011). The typhoon white book. Seoul, South Korea: Korea Meteorological Administration.
Numerical Modeling Center (2023). 2022 numerical forecast system verification. Seoul, South Korea: Korea Meteorological Administration.
Wang, C., Yoon, S. K., Chen, J., Chen, H., Xiong, L., and Kim, J. S. (2023). Statistical prediction of typhoon-induced total accumulated rainfall in the Western North Pacific using typhoon track similarity indices. Atmos. Res. 288, 106724. doi:10.1016/j.atmosres.2023.106724
Wei, C. C., and Chang, H. C. (2021). Forecasting of typhoon-induced wind-wave by using convolutional deep learning on fused data of remote sensing and ground measurements. Sensors 21, 5234. doi:10.3390/s21155234
Wu, M. C., Yang, S. C., Yang, T. H., and Kao, H. M. (2018). Typhoon rainfall forecasting by means of ensemble numerical weather predictions with a GA-based integration strategy. Atmosphere 9 (11), 425. doi:10.3390/atmos9110425
Keywords: landfalling typhoon, Korea meteorological administration, precipitation forecast, wind speed forecast, automatic weather station
Citation: Kim M, Won S and Lee H (2024) Development of a prediction system for precipitation- and wind-causing typhoons affecting the Korean peninsula using observational data. Front. Earth Sci. 12:1327170. doi: 10.3389/feart.2024.1327170
Received: 24 October 2023; Accepted: 04 January 2024;
Published: 18 January 2024.
Edited by:
Shu-Hua Chen, University of California, Davis, United StatesReviewed by:
Ching-Yuang Huang, National Central University, TaiwanChihYing Chen, Research Center for Environmental Change, Academia Sinica, Taiwan
Copyright © 2024 Kim, Won and Lee. This is an open-access article distributed under the terms of the Creative Commons Attribution License (CC BY). The use, distribution or reproduction in other forums is permitted, provided the original author(s) and the copyright owner(s) are credited and that the original publication in this journal is cited, in accordance with accepted academic practice. No use, distribution or reproduction is permitted which does not comply with these terms.
*Correspondence: Minyeong Kim, ZWxxd2l1QGtvcmVhLmty