 Hannah Vickers
 Tuomo Saloranta
 Morten Køltzow3
 Ward J. J. van Pelt
 Eirik Malnes
- 1NORCE Norwegian Research Centre AS, Bergen, Norway
- 2NVE Norwegian Water and Energy Directorate, Oslo, Norway
- 3Norwegian Meteorological Institute, Oslo, Norway
- 4Department of Earth Sciences, University of Uppsala, Uppsala, Sweden
Rain-on-snow (ROS) events are becoming an increasingly common feature of the wintertime climate Svalbard in the High Arctic due to a warming climate. Changes in the frequency, intensity, and spatial distribution of wintertime ROS events in Svalbard are important to understand and quantify due their wide-ranging impacts on the physical environment as well as on human activity. Due to the sparse nature of ground observations across Svalbard, tools for mapping and long-term monitoring of ROS events over large spatial areas are reliant on remote sensing, snow models and atmospheric reanalyses. However, different methods of identifying and measuring ROS events can often present different interpretations of ROS climatology. This study compares a recently published Synthetic Aperture Radar (SAR) based ROS dataset for Svalbard to ROS derived from two snow models and a reanalysis dataset for 2004–2020. Although the number of ROS events differs across the datasets, all datasets exhibit both similarities and differences in the geographical distribution of ROS across the largest island, Spitsbergen. Southern and western coastal areas experience ROS most frequently during the wintertime, with the early winter (November–December) experiencing overall most events compared to the spring (March–April). Moreover, we find that different temperature thresholds are required to obtain the best spatial agreement of ROS events in the model and reanalysis datasets with ground observations. The reanalysis dataset evaluated against ground observations was superior to the other datasets in terms of accuracy due to the assimilation of ground observations into the dataset. The SAR dataset consistently scored lowest in terms of its overall accuracy due to many more false detections, an issue which is most likely explained by the persistence of moisture in the snowpack following the end of a ROS event. Our study not only highlights some spatial differences in ROS frequency and trends but also how comparisons between different datasets can confirm knowledge about the climatic variations across Svalbard where in-situ observations are sparse.
1 Introduction
Rain-on-snow (ROS) events are most pronounced in high latitude and high-altitude regions where there exists snow cover. ROS events have wide-ranging consequences for nature and society. Amongst the numerous impacts of ROS events are short-term increased avalanche risk in mountainous areas (Eckerstorfer and Christiansen, 2012; Abermann et al., 2019), increased soil temperature and permafrost degradation (Westermann et al., 2011) and icing and damage to vegetation (Bjerke et al., 2014). Ground icing may impact ungulate populations by restricting access to food, which can result in increased mortality and large die-offs (e.g., Hansen et al., 2011; Hansen et al., 2014; Forbes et al., 2016). Pronounced wintertime warming across the Norwegian archipelago of Svalbard in the High Arctic has already been documented (Isaksen et al., 2016; Isaksen et al., 2022) as well as an increase in the frequency of wintertime ROS (Peeters et al., 2019). Ongoing climate warming is expected to result in a threefold increase in the frequency of winter warming events by 2100 (Vikhamar-Schuler et al., 2016; Hanssen-Bauer et al., 2019) leading to changes in wintertime rainfall, melting and refreezing with subsequent impacts on land and glaciers (Van Pelt et al., 2021). To understand which areas are most vulnerable to ROS impacts at present and in the future, reliable observations of the spatial and temporal variations in ROS activity are crucial.
Synthetic Aperture Radar (SAR) is an active microwave sensor that has been widely implemented for wet snow mapping (e.g., Nagler and Rott, 2000; Nagler et al., 2016; Karbou et al., 2021). This is possible due to its sensitivity to the presence of liquid water in the snowpack, which causes a strong attenuation of the backscattered radar signal. Recently, a SAR-based approach for detecting ROS events across Svalbard has been presented, based on SAR wet snow detection maps (Vickers et al., 2022). This approach was shown to detect the onset of ROS events well when compared against meteorological observations, however only a limited number of station observations were presented, and a more thorough examination of its representativity over archipelago-wide scales is needed. Amongst the available tools for comparing remote sensing observations of ROS events to, are ground (in-situ) observations, reanalysis datasets, snow, and regional climate models. Snowmelt is driven by land-atmosphere interactions that can be estimated using simple melt-air temperature relationships such as the positive-degree day model, or more sophisticated snow models that solve the surface energy balance and can simulate snow cover over longer time-periods and larger spatial domains than observational datasets. However, the definition of a ROS event is dependent on the variables available to detect ROS. Earlier model-based studies of ROS climatology across Norway have implemented thresholding approaches to variables such as air temperature, daily precipitation and snow cover or snow water equivalent based on the seNorge gridded dataset (Pall et al., 2019) and the Weather Research and Forecasting (WRF) regional climate model (Mooney and Li, 2021). The ROS climatology derived from such datasets is therefore also highly dependent on the thresholds chosen for these variables. Moreover, there has to date not been carried out studies of ROS climatology across Svalbard using these datasets, despite the significance of this climate sensitive region where ROS can result in serious societal and ecological impacts. Moreover, reliable forecasting and projections of future ROS events using climate models are becoming of increasing importance to quantify the future risks and consequences under ongoing changes in climate.
The primary objective of this study is therefore to compare the recently published SAR-based ROS climatology of Svalbard (Vickers et al., 2022) to ROS events across Svalbard derived from atmospheric reanalyses, snow model datasets and ground observations and examine their similarities and differences. Specifically, the Copernicus Arctic Regional Reanalysis (CARRA) dataset (Schyberg et al., 2020) and two independent snow models; the Energy balance—snow and firn model (EBFM; Van Pelt et al., 2019) and the seNorge snow model developed at the Norwegian Water Resources and Energy Directorate (Saloranta, 2016) that provide estimates of snow water equivalent (SWE), are used to provide estimates of ROS occurrence across Svalbard. ROS derived from these datasets are compared with those produced using the SAR approach (Vickers et al., 2022) to examine the temporal and spatial differences in ROS frequency between the remote sensing and model data, for the winter season. To produce results comparable to earlier studies on ROS across Norway, we apply the same methods of detection using the simulated seNorge gridded snow and weather data (Pall et al., 2019) to the CARRA reanalysis and EBFM output and examine the similarities and differences between the three model datasets as well as between the remote sensing and model detections for the overlapping period of data coverage.
2 Materials and methods
The SAR rain-on-snow dataset used in this study is described in detail by Vickers et al. (2022) such that only a brief summary of the dataset will be given here. The SAR ROS dataset is derived from wet snow maps produced on a grid with 100 m × 100 m pixel spacing using three different SAR sensors spanning the period 2004–2020, with the latest period (2014 onwards) providing frequent coverage by the Sentinel-1 satellites. ROS events are detected when the pixel classification in the wet snow maps changes from dry to wet, and the duration of an event is counted until the pixel is classified as dry snow again or in some cases, bare ground. Subsequently a major limitation of this approach is that ROS events can only be detected outside of the spring snowmelt season when the snowpack is not continuously wet. Moreover, SAR cannot determine whether the wet snow is due to rain or due to melt. The SAR dataset forms the basis for the comparisons of ROS obtained using the seNorge and EBFM snow models and the CARRA dataset. In Table 1 an overview of the different datasets and how ROS was calculated from the variables available, is provided.

TABLE 1. Dataset overview and ROS detection approach.
2.1 Study area
The Svalbard archipelago is located approximately halfway between the Norwegian mainland and the North Pole, and spans latitudes between 74 and 81°N and longitudes between 10 and 35°E. The archipelago covers a total area of 61,000 km2 of which 57% is glaciated (Nuth et al., 2013) and the remaining land area is covered by either barren rock or vegetation (Figure 1). The climate in the western part of the archipelago is influenced by the West Spitsbergen Current (Walczowski and Piechura, 2011) which produces a climate that is milder compared with that experienced at similar latitudes elsewhere. Meteorological data recorded at Svalbard Airport, close to Longyearbyen, show that the mean annual temperature in the period of study (2000–2023) ranges from −6.1°C (2003) to 0°C (2016), while annual precipitation ranges from a minimum of 121.8 mm (2021) up to 310 mm (2016). At Ny Ålesund in the northwest of the archipelago, the climate is substantially wetter, with total annual precipitation ranging from a minimum of 305 mm (2019) up to 749 mm (2018) while annual mean temperatures are similar to those measured at Longyearbyen. The onset of seasonal snow on land observed using optical remote sensing typically occurs from September onwards, while snow disappearance can take place from mid-May in low-lying central parts of the archipelago to July over mountainous areas and in northern areas in Svalbard (Vickers et al., 2020).
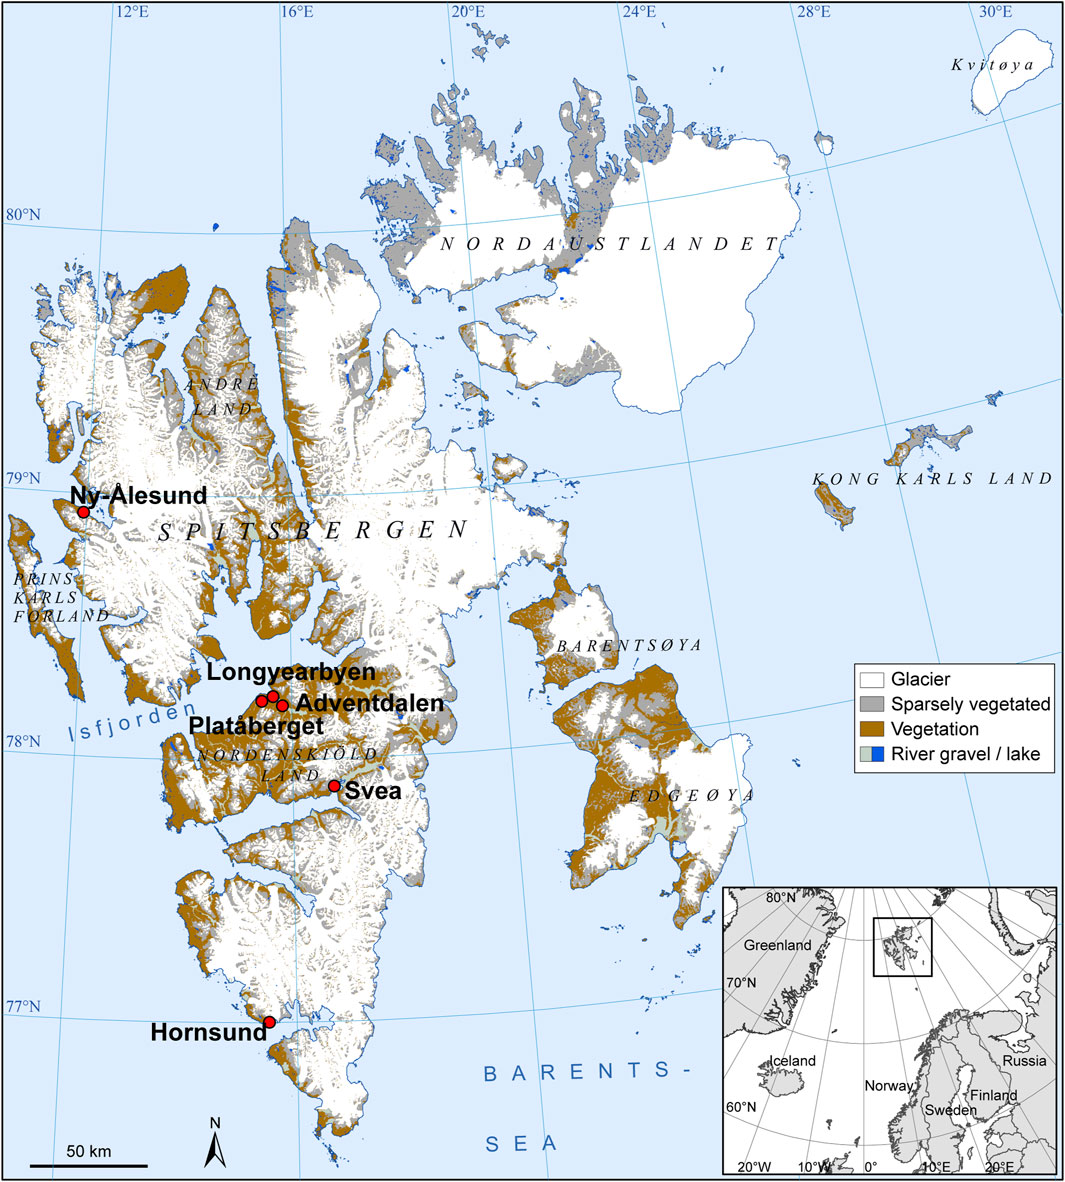
FIGURE 1. The Svalbard archipelago illustrated with land (brown/grey) and glaciers (white) shown. Ground observations made at Ny Ålesund, Longyearbyen and Hornsund are utilized in this study.
2.2 seNorge dataset
The seNorge snow model (Saloranta, 2016) is a relatively simple single-layer snow model which utilizes 3-hourly or daily mean air temperature and a sum of precipitation as input forcing. Solid precipitation is defined as precipitation occurring at when the 2 m air temperature is ≤0.5°C. Snow and ice melt are calculated using the extended degree-day model including air temperature and solar radiation terms. The two parameters of the melt algorithm have subsequently been estimated based on 3,356 quality controlled daily melt rates observed by the Norwegian snow pillow network (Saloranta, 2014). The sub-grid snow distribution algorithm in the model assumes a uniform probability distribution of snow amounts within the grid cells. The main effect of the sub-grid snow distribution is to reduce the grid cell average melting rates towards the late melt season rates when significant areas of bare ground are present in the grid. For the seNorge snow model application for Svalbard the 3-hourly input data are aggregated from the hourly meteorological forcing data obtained and downscaled to a 1 km × 1 km grid from the operational AROME Arctic numerical weather prediction model (NWP) (Müller et al., 2017). Input precipitation in the current model application is scaled by a factor 0.75, based on initial evaluation of the first model results. Model parameter values are set to the same values as those in the application for mainland Norway, except the spatial snow distribution parameter CF is increased from the default value of 0.5–0.85, giving larger variance for sub-grid snow distribution. The model application for Svalbard starts at bare ground initial conditions in September 2012. Following this, snow/firn older than 1 year is removed from the model’s snow store on 1 September each year. The two first snow seasons may therefore be considered as a model spin-up period at higher elevation areas with perennial snow. This study has utilized the operational seNorge temperature, precipitation, and snow water equivalent (SWE) products for the Svalbard area, updated daily and including a forecast for the two coming days.
2.3 CARRA dataset
The East domain of the Copernicus Arctic Regional Reanalysis (CARRA) dataset covers both Northern Norway and Svalbard and provides 3-hourly reanalyses and short-term hourly forecasts of atmospheric and surface meteorological variables at 2.5 km resolution, on 65 vertical levels (Schyberg et al., 2020; Yang et al., 2020). CARRA data has been evaluated and shows added value compared to other reanalysis datasets for Svalbard (e.g., Køltzow et al., 2022). For this study we obtained the 2 m air temperature and snow water equivalent (SWE) reanalyses at 3-hourly resolution, which were averaged to obtain daily values. Snow on the ground is modelled using the one-layer snow scheme of Douville et al. (1995) with falling precipitation divided into solid and liquid phases based on the processes in the atmosphere and not by a temperature threshold. In addition, an adjustment against observed snow depths once per day (usually 06 UTC) to produce the final SWE values. For precipitation data, to obtain the 24-h accumulated precipitation values we downloaded precipitation data at lead times of +6 and +30 h with initial time 00UT, equivalent to precipitation from 0600UTC to 0600UTC the following day. The +6 h lead time precipitation values were subtracted from the +30 h lead time values to obtain the 24-h precipitation for a given day. Observations of 2 m air temperature and snow depth are among the observations that are assimilated in CARRA and thereby constrain the dataset in the proximity of observation sites. However, observations of precipitation are not assimilated in CARRA. CARRA data are available from 1991 to the present year; we obtained data to overlap with the period of the SAR dataset (2004-2020).
2.4 EBFM dataset
The coupled energy balance—snow and firn model (EBFM) (Van Pelt et al., 2012) has been earlier used for studies of the long-term climatic mass balance of glaciers in Svalbard (Van Pelt et al., 2019; Van Pelt et al., 2021), as well as seasonal snow conditions and runoff on glaciers and land since 1957 and up to 2060. EBFM solves the surface energy balance to calculate surface melt and temperature, which provides upper boundary conditions for a snow and firn layer model, simulating the multi-layer evolution of snow density, temperature, and water content (Van Pelt et al., 2012). In Van Pelt et al. (2019), the model was forced by downscaled meteorological fields of precipitation, air temperature, relative humidity, wind speed, cloud cover and air pressure from the NORA10 hindcast dataset, generated with the High-Resolution Limited Area Model (HIRLAM) (Reistad et al., 2011). For calibration and validation of the model and meteorological downscaling, in situ on-glacier measurements of weather conditions, stake mass balance and subsurface density were utilized; no calibration or validation was performed for snow and weather conditions in non-glacier terrain, potentially deteriorating performance in these areas. From the large dataset presented in Van Pelt et al. (2019), SWE is extracted across Svalbard at 1 km × 1 km spatial resolution and daily temporal resolution overlapping the entire SAR period (2004-2020). These calculations are performed every 3 h; the 2 m air temperature is provided by the NORA10 dataset.
2.5 ROS detection
To detect ROS days from the EBFM, CARRA and seNorge datasets, a thresholding approach was applied to the daily mean temperature T, total daily precipitation RR and snow water equivalent SWE datasets, a methodology which has been applied in earlier studies of ROS (e.g., Pall et al., 2019; Wickström et al., 2020). The same thresholds were applied to total daily precipitation (1 mm) and SWE (3 mm) as was applied to meteorological data in Vickers et al. (2022) for consistency. For the temperature threshold, we used the temperature threshold intrinsic to the model datasets for partitioning rain and snow. As outlined in Sections 2.2, 2.4, the temperature threshold applied for detecting snow was T ≤ 0.5°C and T < 0.6°C in the seNorge and EBFM snow models, respectively. Therefore, for detecting ROS, we applied a threshold of T = 0.5°C. Solid and liquid precipitation in the CARRA dataset on the other hand are calculated from atmospheric processes and are thus not temperature dependent. For consistency in this study, we applied the same temperature threshold of 0.5°C to detect ROS days in the CARRA dataset. The ROS climatology derived using these thresholds was used as a first comparison to the SAR dataset. However, the temperature threshold at which the snow-rain transition occurs is known to vary across Norway (Jennings et al., 2018), with coastal climates typically experiencing a lower snow-rain transition temperature while inland areas with continental type climates experience a higher temperature threshold. Moreover, the snow-rain transition is not only determined by the surface temperature but also by the vertical profiles of temperature and humidity. To test the sensitivity of the ROS detections to the threshold applied to the daily mean temperature, we also computed a ROS climatology at five different temperature thresholds ranging from −1°C to +1°C in 0.5°C increments and compared the detections to ground observations of ROS. Moreover, this tuning allowed for an examination of the temperature threshold which produced a ROS climatology that agreed best with that obtained using ground observations. The method by which the accuracy of the different datasets at each temperature threshold were evaluated, is outlined in Section 2.6. In Section 3 we present the results obtained with the standard 0.5°C threshold, as well as those obtained with the temperature threshold that resulted in the highest accuracy with respect to the ground observations. In both cases a ROS event is defined as a series of consecutive days where the ROS criteria are met in order to compare the ROS climatologies to the SAR dataset. This approach was taken since SAR cannot distinguish individual consecutive days with rain once the snowpack is initially wet and therefore only detects the end of an event once the snowpack is classified as dry again. As such, a similar definition of a ROS event is required for the model and reanalysis data in order to make comparisons of the number of events per winter. To compare the SAR results with each of the model or reanalysis datasets, the SAR results are first resampled from the original grid at 100 m grid spacing, to the same grid as the models which have either 1 km or 2.5 km grid spacing using a nearest neighbor interpolation. This method of resampling therefore does not take into account the topography, which can potentially incur errors due to the binary nature of the wet snow maps.
2.6 In-situ observations
We utilized meteorological observations made at Ny Ålesund, Longyearbyen and Hornsund to evaluate the ROS detections obtained using the seNorge and EBFM snow models and CARRA data as well as to compare the temporal variations of ROS derived from the models with the SAR observations of wet snow. These in-situ observations were downloaded from the seklima database (https://seklima.met.no) managed by the Norwegian Centre for Climate Services (NCCS). The approach by which the meteorological observations of air temperature, precipitation and snow depth were applied to identify ROS events is described in Vickers et al. (2022). In this evaluation, we compare individually detected ROS days detected using the different temperature thresholds to determine the correct, missed, or false detected ROS days estimated by the model and reanalysis datasets. We use the seven winters with complete time series of mean air temperature, total daily precipitation, and snow depth at the three sites (2013–2020). In this study we have also chosen to evaluate the F1 score (Tharwat, 2018), which is widely used in the evaluation of machine learning models and is suited to binary classification problems with unbalanced classes. In this evaluation, there are many more non-ROS days than there are ROS days and as such, the F1 score is less affected by correct detection of non-ROS days and instead gives equal weight to the false detection of ROS days (false positives, FP) as well as the ROS days which were missed (false negatives, FN). The F1 score is defined in terms of the true positive (TP), false positive and false negative rate as,
The true positive, false positive, false negative and true negative rates, together with the overall F1 score are averaged over the seven winters and over all three sites to determine which temperature threshold produced the best F1 score for each dataset. The results of this temperature threshold sensitivity testing are shown in Figure 1A. The metrics obtained with the optimised temperature thresholds are presented for each meteorological station together with those for the temperature-independent SAR dataset in Tables 2–4 and described in Section 3.5.
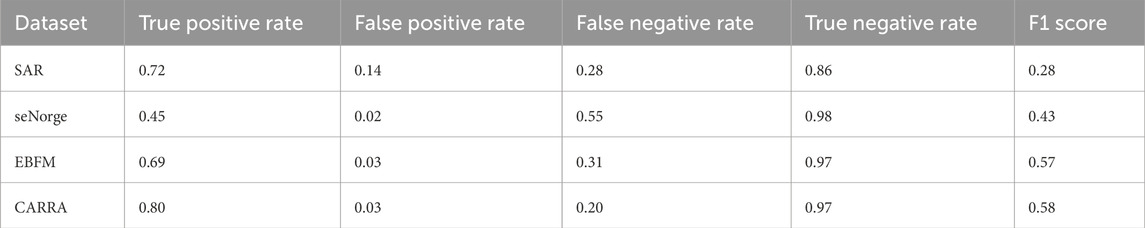
TABLE 2. Accuracy metrics evaluated at Ny Ålesund.
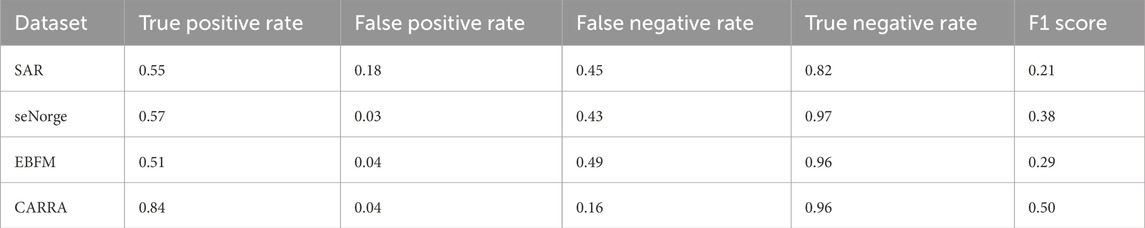
TABLE 3. Accuracy metrics evaluated at Longyearbyen.
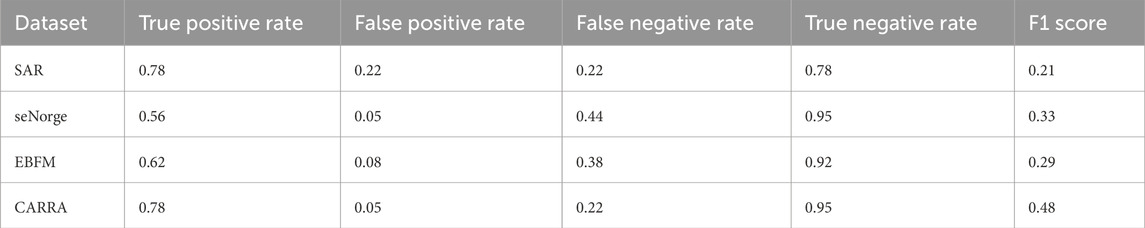
TABLE 4. Accuracy metrics evaluated at Hornsund.
3 Results
In this section we present results showing the winter ROS climatology derived from the seNorge, CARRA and EBFM datasets in Sections 3.1–3.3, respectively, compared with the SAR results averaged for the overlapping period, as well as the monthly ROS climatology averaged for the 2013–2019 period which overlaps all datasets (Section 3.4). Two examples where the datasets have been compared to ground observations are presented and described in Section 3.5.
3.1 seNorge
Figure 2A illustrates the ROS events detected by the SAR approach, averaged for the 2013–2019 period which overlaps with the seNorge dataset, which is shown in Figure 2B for the temperature threshold of 0.5°C. The mean difference between the SAR and seNorge datasets shown in Figure 2C shows that the SAR dataset exhibits a distinctly higher number of ROS events compared to seNorge, with the land areas having on average 1.79 events greater than in the seNorge dataset. Evaluation of the seNorge ROS day detection against ground observations indicated that the highest F1 score of 0.37, when averaged across all three measurement sites, was obtained with temperature thresholds of −1.0°C and also −0.5°C (Figure A1A). However, the mean true positive rate at −1.0°C was 6% higher than at −0.5°C while the false positive rate was only 1% greater. Therefore the −1.0°C threshold is taken to be the optimum threshold and results for this threshold are illustrated in Figures 3A–C. At this threshold there are similarities in the geographical distribution of ROS events produced using the SAR and seNorge datasets, with the highest number of events per winter found along the west and southern coasts of Svalbard. However, the primary difference in ROS climatology using the −1.0°C temperature threshold, is that the much higher number of ROS events in the seNorge dataset produced a somewhat better agreement with the SAR dataset, as indicated by the slightly lower RMSE of 1.62. for land areas. The mean differences in number of ROS events between the two ROS climatologies, shown in Figure 3C indicate that the largest differences occur in areas where there are already most ROS events in both datasets, along the west and southern coasts. These ROS events can largely be attributed to low elevation areas in the vicinity of ice-free sea due to the influence of the West Spitsbergen Current and milder winter climate. However, there are also notable differences in the number of detected ROS events across Edgeøya in the east and along the eastern coast of Nordaustlandet. At this temperature threshold, the SAR dataset detects several more events per winter in the northern and central parts of Edgeøya when compared to seNorge, while the seNorge dataset detects more ROS events along the western and southern coasts of Spitsbergen, as well as southern parts of Edgeøya and eastern parts of Nordaustlandet.
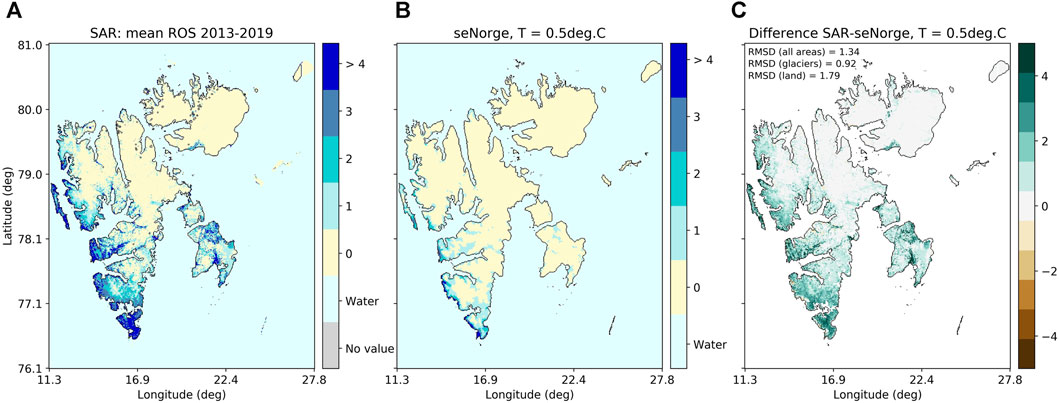
FIGURE 2. The average geographical distribution of ROS events for 2013–2019, detected using SAR (A) and seNorge dataset (B) when the seNorge temperature data were thresholded at 0.5°C to detect rainfall. This threshold is used in the seNorge snow model for partitioning rain and snow. The difference in number of events between the two (SAR—seNorge) is shown in (C).
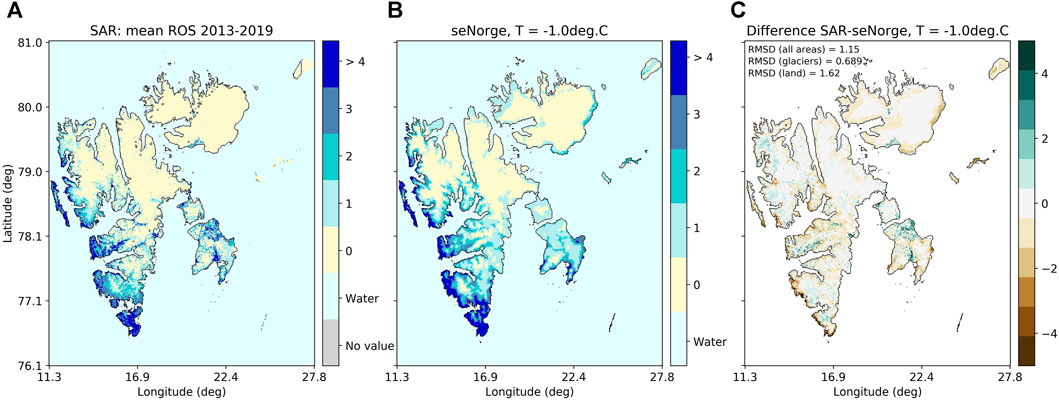
FIGURE 3. The average geographical distribution of ROS events for 2013–2019, detected using SAR (A) and seNorge dataset (B) when the seNorge temperature data were thresholded at the optimized threshold of −1.0°C to detect rainfall. The difference in number of events between the two (SAR—seNorge) for this threshold is shown in (C).
3.2 CARRA
Figure 4A shows the results for the SAR dataset averaged over 2004–2020 and re-projected from the native 100 m grid to the spatial resolution of the CARRA dataset (2.5 km). The corresponding CARRA results derived using the temperature threshold of 0.5°C are shown in Figure 4B and the mean differences between the SAR and CARRA ROS datasets are shown in Figure 4C. Unlike seNorge, the ROS climatology from CARRA exhibits more events than the SAR dataset along the coastal areas and also in some of the valleys across Nordenskiöld Land, while inland areas generally exhibit fewer ROS events than SAR. Like seNorge, there are also a lot more ROS events in SAR across Edgeøya when compared to CARRA.
The F1 score for the CARRA ROS dataset, with respect to the ground observations between 2013 and 2019, was highest and almost identical at temperature thresholds of 0°C (0.53) and −0.5°C (0.52). However, since the mean true positive rate at −0.5°C was around 10% higher than at 0°C (Figure A1B) we present the results obtained at a temperature threshold of −0.5°C. Coincidentally, this temperature threshold also resulted in the smallest RMSE with respect to the SAR dataset, when averaged over the entire time series of the dataset (2004–2020). The ROS climatology obtained using the temperature threshold of −0.5°C is shown in Figures 5A–C. At both temperature thresholds, ROS events detected by CARRA are most frequent in the southern and western parts of the archipelago, while much fewer events are detected in the east and north. The greatest difference between the SAR and CARRA datasets is again found on the northern end of Edgeøya, where there are on average no ROS events detected by CARRA, while SAR detects on average 2–3 events per winter. CARRA detects of the order of 1–2 more ROS events per winter than SAR in areas close to the southwestern coast, as indicated by the brown tones in this region in Figure 5C.
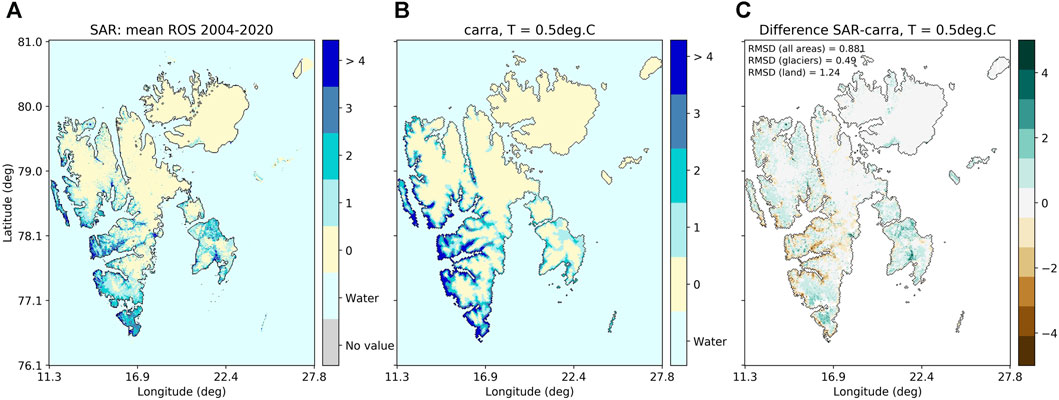
FIGURE 4. The average geographical distribution of ROS events for 2004–2020, detected using SAR (A) and the CARRA dataset (B) when the CARRA temperature data were thresholded at 0.5°C to detect rainfall. The difference in number of events between the two (SAR—CARRA) is shown in (C).
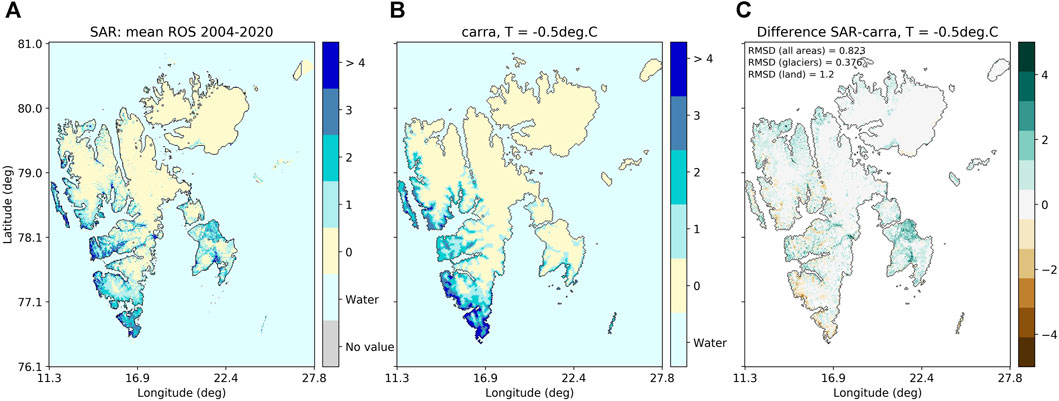
FIGURE 5. The average geographical distribution of ROS events for 2004–2020, detected using SAR (A) and the CARRA dataset (B) when the CARRA temperature data were thresholded at −0.5°C to detect rainfall. The difference in number of events between the two (SAR—CARRA) is shown in (C).
3.3 EBFM
The results for ROS detected using NORA10 and EBFM SWE data using the standard temperature threshold of 0.5°C to detect rain, are presented in Figures 6A–C. At this threshold Figure 6B shows an overall higher number of winter ROS events captured by the EBFM model compared to SAR, not only in the high-ROS areas along the southern and western coasts, but also more ROS further inland. Across Edgeøya there is in fact much better agreement between SAR and EBFM compared to the results from seNorge and CARRA, with respect to the distribution and intensity of ROS across Edgeøya. Nevertheless, the tuning of the temperature threshold to the ground observations showed that in fact, a threshold of 0.5°C produced the best F1 score when averaged over all three observation sites and seven winters of data (Figure A1C). The archipelago averaged RMSE of 0.998, with respect to SAR is slightly lower compared with that obtained for seNorge at the optimized temperature threshold of −1.0°C (1.15) and slightly higher than that for CARRA (0.823) at its optimised temperature threshold of −0.5°C. Figure 6C also shows that the greatest differences between EBFM and SAR are in fact located in the already high-ROS areas, i.e., EBFM detects more ROS events than SAR in the southern and western parts of Svalbard, which are areas where ROS occur most frequently in the winter.
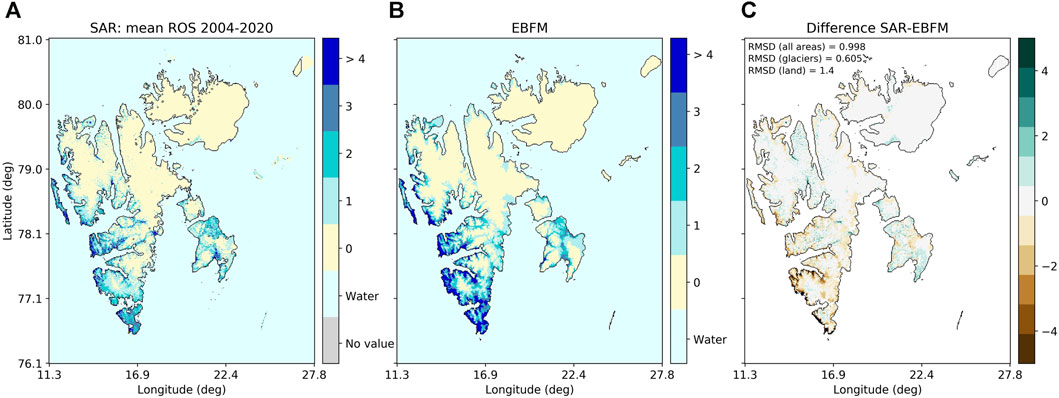
FIGURE 6. The geographical distribution of ROS events for 2004–2020, detected using SAR (A) and the EBFM dataset (B) when the temperature data were thresholded at 0.5°C. The difference in number of events between the two (SAR—EBFM) is shown in (C).
3.4 Mean monthly ROS events
In this section we present the monthly ROS climatology for the winter season (November-April), detected using the remote sensing, model, and reanalysis datasets. Here, ROS is detected using the F1 score-optimised temperature thresholds in the seNorge (−1.0°C), CARRA (−0.5°C), and EBFM (0.5°C), datasets. The number of ROS events per month has been averaged only over the period overlapping all datasets (2013–2019). Figure 7 illustrates the ROS events per month determined using SAR, seNorge, CARRA and EBFM. All datasets show that November stands out as the month with the greatest land area affected by ROS events. The geographical distribution of ROS events in November shows that the large majority of ROS events occur not only in the southern and western coastal areas, but also across inland areas in central and southern Spitsbergen. Across all datasets there are generally fewer ROS events in December compared with November, but nevertheless a higher number of ROS events compared with January. ROS events during January are confined to the south and west coast of Spitsbergen, but in the seNorge dataset the spatial extent of ROS events is confined to a much smaller region mostly in southern Spitsbergen.
The geographical distribution of ROS events in February is very similar to January in the SAR, EBFM and seNorge datasets, with the exception of Edgeøya where there are no ROS events in February in the EBFM dataset but a small increase in events over Edgeøya in the CARRA dataset. The CARRA dataset, however, suggests that ROS events are more widely spread in extent across Spitsbergen in February compared to January, as shown by the larger areas affected. During March there are in general very few or no ROS events in all datasets, although some ROS that are detected are confined to the west coast in the EBFM and CARRA datasets. In April there are on average virtually no ROS events over the entire archipelago in the SAR and seNorge datasets. However, the EBFM dataset exhibits a small number of ROS events confined to the east and west coast of Spitsbergen while CARRA exhibits a few events confined to the western coast.
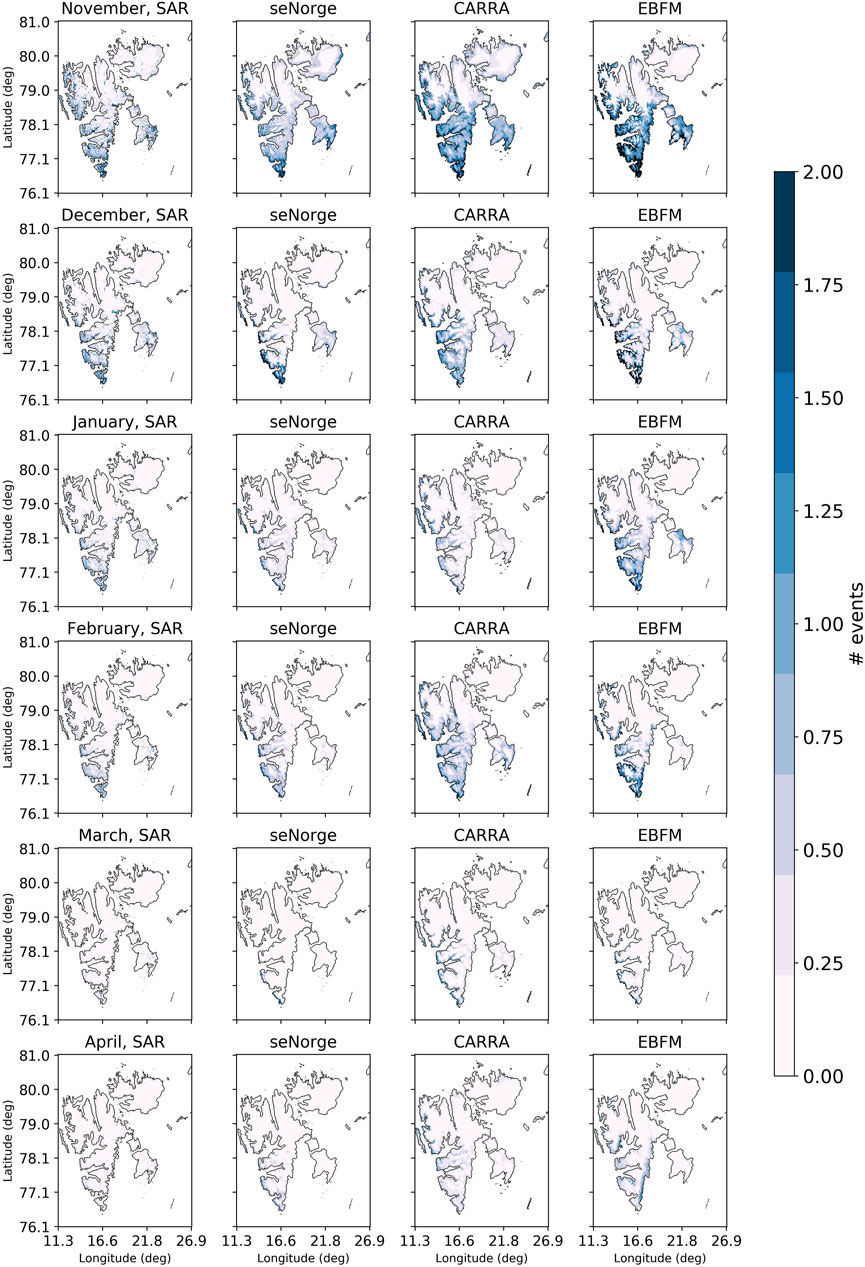
FIGURE 7. Monthly frequency of ROS events, averaged over the period 2013–2019, for all four datasets. From left to right are the results for the SAR, seNorge, CARRA and EBFM datasets respectively. For the seNorge, CARRA and EBFM datasets, ROS events have been detected using the optimized temperature thresholds.
3.5 Comparison with in-situ observations at the optimized temperature thresholds
Figure 8 compares time series of ROS precipitation and snow depth from in-situ observations at Ny Ålesund for the 2014–2015 winter with the SAR wet snow fraction (Figure 8A), and the time series of ROS precipitation and SWE determined from the seNorge (Figure 8B), EBFM (Figure 8C) and CARRA (Figure 8D) datasets at the pixels in which the Ny Ålesund observational site was located. In the case of the in-situ observations, the ROS precipitation is simply the total daily precipitation on days where the mean air temperature exceeded 0°C.
For the seNorge, EBFM and CARRA datasets we show the ROS time series obtained with the temperature threshold that produced the highest mean F1 score when tuned against the ground observations. During this winter season there were multiple ROS events detected in the ground observations; 2 days in November, 2 days in the second half of January, 1 day in February, 2 days in March and a day with a small amount of rain in mid-April. For all of these events there are increases in the wet snow fraction detected by SAR which coincide with the timing of the precipitation events in the ground data. Snow depths were transient and generally <20 cm in early winter (November–December) while generally >30 cm from February onwards. The SWE time series from the CARRA dataset show temporal variations that are qualitatively well correlated with the observed variations in snow depth at Ny Ålesund, despite that the CARRA data represent SWE in a 2.5 km × 2.5 km area.
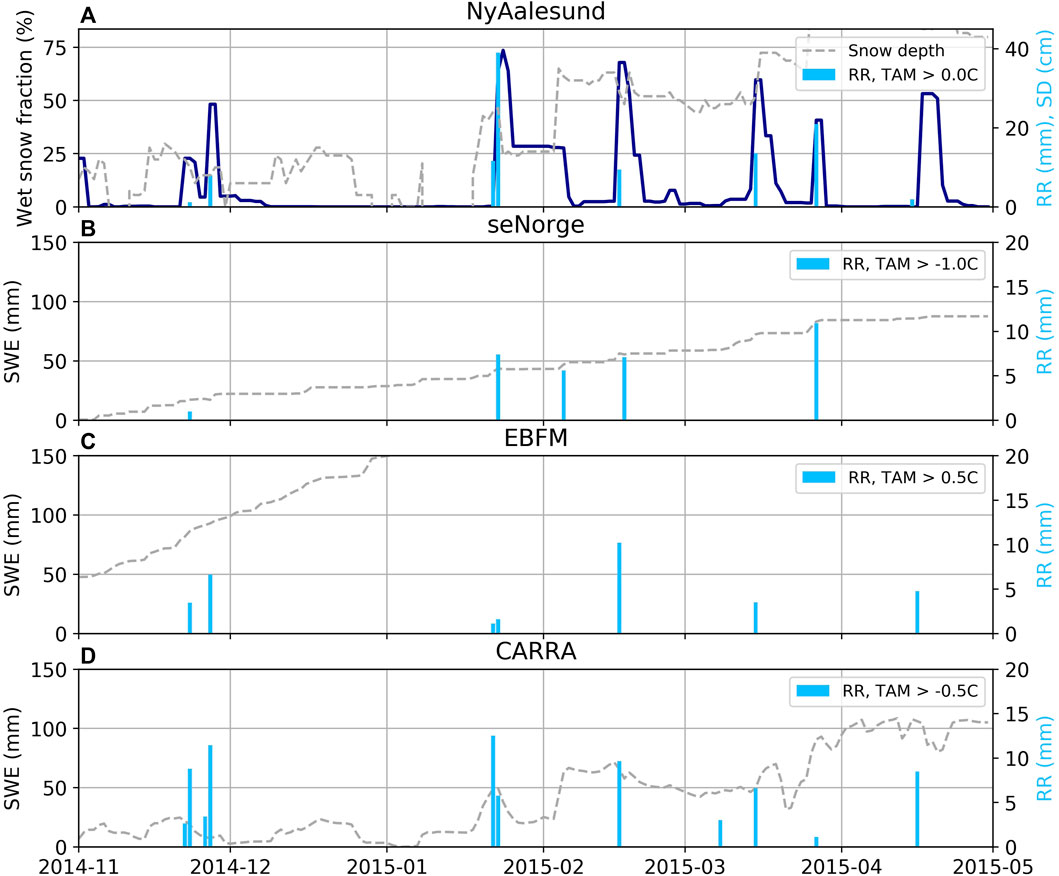
FIGURE 8. (A) Time series of the SAR wet snow fraction (dark blue), in-situ snow depth (grey) and ROS precipitation (light blue bars, daily precipitation on days where the mean daily temperature was >0°C) at Ny Ålesund followed by the time series of SWE (grey) and ROS precipitation for pixels within which the Ny Ålesund site was located, in the (B) seNorge, (C) EBFM and (D) CARRA datasets.
In contrast, both the seNorge and EBFM datasets do not reflect the same temporal variations in SWE that are seen in both the CARRA dataset and the in-situ observations of snow depth. The EBFM SWE time series exhibits much higher values than the seNorge and CARRA datasets from the beginning of the time series, indicating that the onset of snow cover began well before November. On the other hand, SWE is close to zero at the beginning of November in the seNorge dataset and increases very gradually over the course of the winter. Compared to the in-situ data, seNorge detected only one of the ROS days in November and March but did not detect the small event in April. The CARRA dataset detected all the ROS days across the winter that were also detected in the in-situ data. In addition, two more days with ROS were detected in CARRA in November that were not exhibited in the in-situ observations, but this may be attributed to the different temperature thresholds. The EBFM model, using the “tuned” temperature threshold of 0.5°C managed to capture almost all of the ROS days detected in the in-situ observations, while missing only one of the ROS days in March. The amount of rain detected at this threshold for the ROS event in January was, however, much smaller than the precipitation detected in the ground observations.
Figure 9 shows the same time series as Figure 8, but for the 2016–2017 winter season at Longyearbyen. During this winter the ground observations exhibit one main ROS event in the first half of February 2017, as shown by the increase in SAR wet snow fraction together with precipitation lasting 5 days. Again, the temporal variations in the SWE time series from the CARRA dataset (Figure 9D) follow closely the observed variations in snow depth, whereas SWE in the seNorge dataset is close to zero before December 2016 and overall lower than the SWE in CARRA during the latter part of the winter (Figure 9B). However, both the ROS events in December and the major ROS event during February 2017 were detected in the seNorge dataset, and in many more ROS days were detected in December compared to the ground observations when the tuned threshold of −1.0°C was applied to the seNorge data. By contrast, the EBFM dataset also detected a similar number of ROS days in December as the seNorge dataset at the rain temperature threshold 0.5°C, despite this threshold being 1.5°C greater than the seNorge temperature threshold. However, while the major ROS event during February 2017 was not completely captured by the EBFM dataset, there were in fact two additional ROS events in November 2016 detected in the EBFM dataset that were missed by the ground observations. All the ROS events detected in the in-situ data were also detected in the CARRA dataset, as well as the two additional events in early November 2016. These events corresponded to record precipitation measured at Svalbard airport; however, the snow depth may have been too low to be detected as a rain-on-snow event in the ground observations due to being below the threshold set on snow depth (2 cm). Like the 2014–2015 season at Ny Ålesund shown in Figure 8, there is much higher and earlier onset of SWE in the EBFM dataset compared with seNorge and CARRA.
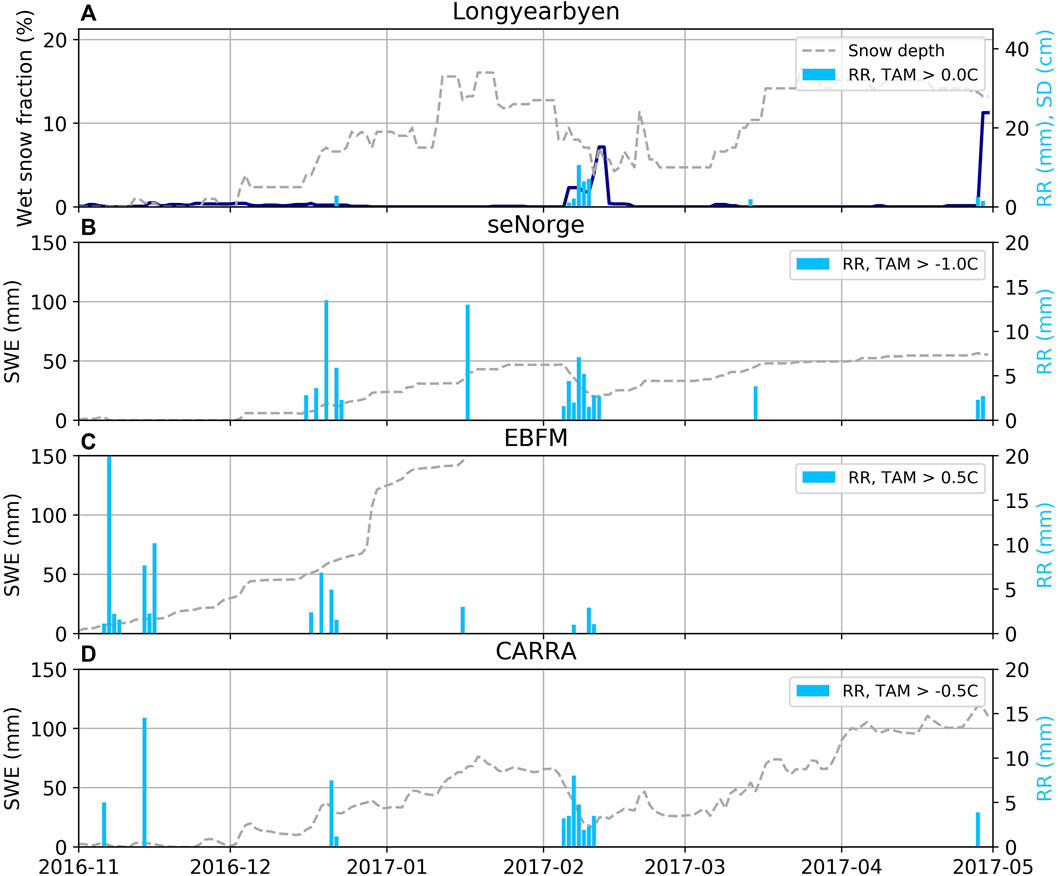
FIGURE 9. Same as for Figure 8, but for the 2016–2017 winter season at Longyearbyen. (A) SAR (B) seNorge (C): EBFM (D) CARRA.
As outlined in Section 2.6 a set of metrics were evaluated to 1) determine an optimized temperature threshold for detecting ROS events in each of the temperature-dependent datasets and 2) compare the ROS detection accuracy of each dataset against the in-situ data at three meteorological stations. In contrast to the preceding sections comparing the geographical similarities and differences in ROS detections, this evaluation provides an indication of the temporal accuracy of the different datasets at specific sites. A summary of the F1 score, true positive, false positive, false negative and true negative rates for each dataset is shown in Tables 2–4 for Ny Ålesund, Longyearbyen and Hornsund respectively. In general, both the SAR and CARRA datasets detect a larger percentage of the ROS days detected in the ground observations compared with seNorge and EBFM on average, as indicated by the higher true positive rate at all three sites evaluated. However, since rainwater in the snowpack does not refreeze immediately following a ROS event, wet snow can often be detected in the SAR dataset even several days after a ROS event finishes. This leads to a higher rate of false detections with respect to the ground data, leading to an overall lower F1 score for SAR at all sites. CARRA on the other hand scored highest with respect to the true positive rate of around 0.8 at all three sites, The seNorge and EBFM datasets on the other hand, correctly detects on average fewer ROS days compared to SAR and CARRA, with a true positive rate in the range 0.5–0.6 but with a correspondingly low false positive rate. As a result, the F1 score is highest for the CARRA dataset at all sites and lowest for the SAR dataset, while the F1 score for the seNorge and EBFM dataset are similar at all sites, except at Ny Ålesund where EBFM performed somewhat better due to a higher true positive rate and low false positive rate. Moreover, both seNorge and EBFM have a higher F1 score at all three sites compared to SAR despite the SAR dataset scoring higher true positives at two of the sites. As noted earlier, this is largely due to days with wet snow detected after the end of a rain event resulting from non-immediate freezing of the snowpack. Across all three sites evaluated, the F1 score for all datasets was highest at the northernmost station Ny Ålesund, and lowest at the southernmost station, Hornsund.
4 Discussion
4.1 Threshold sensitivity
For the temperature dependent datasets it was found that applying a daily mean temperature threshold of 0.5°C to partition rain and snow produced quite different detection of ROS events depending on the dataset. Fewest events were detected in the seNorge dataset, while the CARRA and EBFM datasets produced a ROS climatology that was spatially similar. Moreover, the ROS events detected in the EBFM dataset also agreed better with SAR over Edgeøya, where both seNorge and CARRA did not detect many events on average. The temperature sensitivity of the seNorge, CARRA and EBFM datasets was investigated by producing ROS climatologies at different temperature thresholds and comparing them to the SAR datasets. By tuning the temperature threshold against ground observations, the highest accuracy, as determined by the F1 score was obtained at a threshold of −0.5°C for the CARRA dataset, −1.0°C for the seNorge dataset, and at a threshold of +0.5°C for the EBFM dataset. This may support the work of Jennings et al. (2018) who found the rain-snow transition temperature was lower for maritime climates compared with continental climates due to the higher relative humidity. Since most ROS occur in the southern and western land areas of Svalbard, it is likely that the best-fit temperature threshold is influenced by the rain-snow transition temperature of these areas, which are characterized by predominantly maritime climates. Alternatively, the different temperature thresholds may be compensating for biases in the different air temperature forcings used by the datasets. Moreover, precipitation (and its elevation gradient) in EBFM is calibrated so that it matches well with observations of winter mass balance on glaciers. This may explain the higher temperature threshold required to produce better agreement with the ground observations due to the different climatic conditions over glaciated areas, However, the EBFM dataset also tended to detect events during the early part of the winter, which were not detected in the ground observations due to SWE values being a much greater.
Using the thresholding approach, ROS detection is also influenced by the precipitation thresholds applied to the datasets. Pall et al. (2019) investigated ROS across mainland Norway by applying a precipitation threshold of 5 mm, which they note is best adapted for flood impacts. The lower threshold of 1 mm was used in this study to produce comparable results to earlier work on winter ROS in Svalbard that apply this threshold (Wickström et al., 2020) and to capture multi-day ROS events; a disadvantage of the method by which we defined ROS events means that choosing a higher threshold may split a single long event (e.g., February 2017) into multiple single ROS days or events, as exhibited by the EBFM dataset (Figure 9) and therefore not represent very well the ROS events brought about by large-scale low-pressure systems lasting several days. Moreover, this definition of ROS event means that lower ROS temperature thresholds may actually result in a fewer number of overall events compared to those counted at a higher temperature threshold when multi-day events are split into single ROS days. This effect is demonstrated by the lower number of events along the west coast of Spitsbergen in the CARRA dataset at a threshold of −0.5°C (Figure 5) compared to the number of events at a threshold of +0.5°C (Figure 4). In addition, the generally lower precipitation amounts in the model datasets compared to the observed precipitation, means that a higher precipitation threshold would produce a ROS climatology with a lower number of ROS events in the model or reanalysis datasets compared to the ground observations. Several of the ROS events present in the in-situ data where the measured precipitation exceeded 5 mm/day were correctly detected by the models (CARRA, EBFM) even though the model/forecast precipitation was <5 mm in several of these events. These events would have been missed if a higher threshold of 5 mm had been applied. Therefore, we believe that the ROS climatology depicted by the models is better represented using the lower precipitation threshold. On the other hand, for future studies that are more focused on impactful ROS events, a higher precipitation threshold would be recommended. Overall, these considerations emphasise the difficulty in characterising and quantifying ROS events due to the sensitivity to thresholds and definition of a ROS “events” versus individual ROS days.
4.2 ROS climatology
The geographical pattern of ROS occurrence was generally consistent across all datasets for Spitsbergen, with ROS events occurring most frequently throughout the winter along the western and southern coastal land areas. Larger differences were found across Edgeøya, where there were fewer ROS events detected in both the seNorge and CARRA dataset compared to ROS detected in the SAR datasets. This may be explained by the fact that only temperature measurements are available at the meteorological station on Edgeøya; the lack of precipitation and snow depth data may thus contribute to poorer quality estimates of these two parameters in the seNorge and CARRA datasets, which incorporate ground measurements. On the other hand, there was better agreement between the spatial distribution of ROS on Edgeøya in the SAR dataset, with that exhibited by the EBFM dataset. Overall, the SAR, EBFM and CARRA datasets detected many more ROS events compared to the seNorge dataset when the standard temperature threshold of 0.5°C was applied. However, where the temperature threshold had been optimized against ground observations, the resulting ROS climatology also agreed better with the SAR ROS dataset.
These additional ROS events were not only detected across the coastal “ROS hotspot” areas, but also across inland areas. The precipitation in seNorge, EBFM and CARRA is based on various NWP systems and not explicitly constrained by observations. The sparse observation network for precipitation, and observation errors for existing measurements in Svalbard make it difficult to evaluate the quality of precipitation in these datasets. However, an attempt to evaluate the precipitation from the HARMONIE-AROME NWP, which is used by seNorge and CARRA, over mainland Norway has shown a tendency towards underestimation of winter precipitation in general and in coastal regions in particular (Køltzow et al., 2020).
4.3 Performance of the datasets
The comparison of all four datasets against in-situ measurements at three sites (Ny Ålesund, Longyearbyen and Hornsund) indicated that SAR and CARRA datasets tended to correctly detect the highest number of observed ROS events compared to EBFM and seNorge. However, it was also found that the EBFM dataset displayed much higher SWE across the entire winter season compared to the snow depth observations, which often resulted in more ROS events detected in late autumn. While some of these detected ROS events were also found in the in-situ data, there were also some falsely detected ROS events in the EBFM data due to the too-high SWE values. As noted earlier, the EBFM dataset is calibrated to match observations of winter mass balance on glaciers, which typically receive more accumulation than wind-exposed coastal sites. Hence, it is not surprising that EBFM overestimates snow accumulation and rainfall in Longyearbyen and Ny Ålesund. However, even though SAR correctly detected a greater number of ROS days than the EBFM dataset, the F1 score for SAR was lower due to many more falsely detected ROS days. These days were the result of the longer time needed for the snowpack to refreeze following a ROS event and wet snow being detected on non-ROS days following a ROS event, a problem highlighted in the earlier study of Vickers et al. (2022).
In contrast to EBFM, seNorge generally displayed too low SWE values compared to observed snow depths in early winter, while the CARRA dataset was found to reproduce temporal variations in SWE that correlated qualitatively very well with the observed temporal variations in snow depth at all three sites. Overall, CARRA scored highest with respect to the true positive rate as well as the F1 score due to its lower levels of false positives and missed events compared to EBFM and SAR, despite being the dataset with lowest spatial resolution of 2.5 km. These results indicate that while the geographical patterns of ROS are climatically similar across both model and remote sensing datasets, there is greater variation in the timing and intensity of the ROS events detected across the datasets. It should also be noted that for the CARRA dataset, there is also a high probability that the data agree quite well with station observations, since both 2 m air temperature and snow depth observations are assimilated into the CARRA dataset. Isaksen et al. (2022) compare CARRA data to both assimilated and unassimilated observations of temperature at Svalbard, finding that the non-systematic errors increase when the data are not assimilated. In comparison, data assimilation has not been done for the meteorological forcing (NORA10) of the EBFM dataset and is something that has evolved with time for the operational era of AROME-Arctic used to force seNorge. Our results thus highlight the need for more independent in-situ observations that can be used as ground truthing for, and improvement of model, reanalysis, and remote sensing datasets. In particular, snow profiles, including information on snow temperature and liquid water content would be a valuable resource for validation of wet snow maps and the presence of moisture within the snowpack. While the persistence of moisture in the snowpack following a ROS event presents a challenge in estimating the intensity and duration of an event using SAR, this information can nevertheless be highly valuable in hydrological applications such as those where surface runoff (e.g., Torralbo et al., 2023) and transport of nutrients into water courses are of interest. Moreover, the comparatively finer resolution of the SAR data lends itself well to ecological studies where the presence of wet snow can lead to the formation of ice crusts following a ROS event. This information may be useful, for example, in identifying areas which can pose challenges to reindeer grazing. The evaluation of the SAR dataset against ground observations, models and reanalyses indicates overall good correlations between the detection of wet snow and the onset of wintertime ROS events in Svalbard, where tundra ecosystems dominate, and wintertime mild weather events are often brief and followed by a return to sub-zero temperatures. Recent work combining multiple microwave satellite sensors to produce a circumpolar record of ROS events also concludes that the approach is most reliable over tundra biomes (Bartsch et al., 2010). This may be due to the absence of land use types that may complicate the interpretation of the backscattered radar signal.
4.4 ROS impacts and outlook
All datasets indicate that in the present climate, many winter ROS events are taking place in November, but southern and western areas are nevertheless also impacted by ROS during December to February. In contrast there were on average, very few ROS events during March and April across the archipelago, which also coincides with the months during which sea ice concentration around Svalbard reaches a maximum. These results lend support to the earlier study of Rinke et al. (2017) who found an increase in extreme winter warming events at Ny Ålesund especially during November and December, which was also attributed to the lower-than-average concentration of sea ice during these months. Links between low sea ice concentration and increased warming and precipitation on adjacent land areas has also been reported (Forbes et al., 2016). The implications of ROS events taking place at the beginning of the winter are largely negative for animals on Svalbard such as reindeer, since ice crusts formed at the base of the snowpack following a ROS event create a physical barrier to forage, which effectively means that food sources are locked away for the rest of the winter. On the other hand, during late autumn/early winter when snow cover is thin, ROS events, or above-zero temperatures alone may result in complete ablation of snow cover, which would increase accessibility to forage. Snow cover also acts as an insulator for the ground and permafrost; complete loss of snow cover due to a ROS event would re-expose the ground to cold temperatures following an event, which could also lead to negative impacts for vegetation but may offset the increased soil temperatures brought about by the ROS event. As ongoing changes in climate lead to a later onset of snow cover and a thinner snowpack in early winter, the consequences of ROS events on both the physical environment and ecosystems will depend on the resulting impact on the snow cover.
For a reliable assessment of ROS trends, long time series are needed. Of the datasets analysed in this study, the EBFM and CARRA datasets provide long enough time series for this purpose, without the temporal uncertainty associated with data gaps associated with the SAR data. Comparing trends in ROS events only for the period overlapping the earlier published SAR dataset (2004–2020), EBFM and CARRA indicate an overall increasing and significant trend in ROS along the eastern coast of Spitsbergen and in mountainous parts of the north (Figure A2). In these areas there are trends of up to 2 events per decade. Increasing trends of ROS in the same areas were earlier found in the SAR dataset but were not statistically significant. Here, significant and increasing trends in ROS were largely confined only to the western side of Spitsbergen. It is therefore unclear which areas are currently experiencing greatest increases in ROS due to differences in the methods by which ROS are defined. This highlights and re-emphasizes the need for analyses and comparisons between all types of datasets such as those presented in this study.
5 Conclusion
This study has utilized remote sensing, model, and reanalysis datasets to identify and compare rain-on-snow events across Svalbard between 2004 and 2020. There is a general agreement in the geographical distribution of ROS across Spitsbergen, with the southern and western coastal areas most frequently experiencing ROS during the wintertime. Moreover, there is consistency in the timing of ROS across all datasets, with the early winter (November–December) experiencing overall most events compared to the spring (March–April). Ground observations were utilized to test the temperature sensitivity to temperature thresholds and corresponding accuracy of ROS detections in the model and reanalysis datasets. For two of the datasets (CARRA, seNorge) the daily mean temperature threshold for rain producing best agreement with the ground data was below zero. A lower temperature threshold is consistent with a coastal climate where rain can fall during a day even with daily mean temperatures below freezing, as well as the vertical profiles of temperature and humidity playing a role in determining the rain-snow threshold. For the EBFM dataset on the other hand, which is calibrated to match glacier mass balance observations, the 0.5°C temperature threshold for partitioning rain and snow, intrinsic to the snow model was found to produce best agreement with observations. In all cases, the obtained optimum temperature threshold produced a ROS climatology that also agreed better with the SAR data. Overall, a quantitative evaluation of all datasets using ground observations made at Hornsund, Longyearbyen and Ny Ålesund indicated that the CARRA dataset was superior to all the other datasets in terms of accuracy (F1 score) even though CARRA had the lowest spatial resolution of all the datasets, also highlighting the importance of assimilating ground data into the dataset. It should be emphasized that the relative performance of CARRA compared to the other data sets away from from assimilated observations is uncertain. The SAR dataset consistently scored lowest in terms of its F1 score due to many more false positive ROS days, an issue which is most likely explained by the persistence of moisture in the snowpack following the end of a ROS event since stored water in the snowpack does not refreeze immediately. While this moisture is correctly detected as wet snow by SAR, it is incorrectly detected as a ROS day. On the other hand, seNorge often exhibited a too late onset of snow, on occasions leading to several missed events during early winter, while the EBFM dataset often exhibited too early onset of snow and much higher SWE, which on occasions led to false detections of ROS during early winter. Our study highlights the sensitivity of ROS climatology to temperature thresholds as well as differences in the geographical distribution of ROS between different datasets. Moreover, this study demonstrates how comparisons between different datasets can reveal or confirm knowledge about the climatic variations across Svalbard where in-situ observations are sparse.
Data availability statement
The datasets presented in this study can be found in online repositories. The names of the repository/repositories and accession number(s) can be found below: https://www.sios-svalbard.org/metadata_search and https://doi.org/10.6084/m9.figshare.13142840.v2.
Author contributions
HV: Conceptualization, Methodology, Validation, Writing–original draft, Writing–review and editing. TS: Data curation, Investigation, Writing–original draft, Writing–review and editing. MK: Investigation, Writing–original draft, Writing–review and editing. WvP: Data curation, Investigation, Writing–original draft, Writing–review and editing. EM: Funding acquisition, Writing–review and editing.
Funding
The authors declare financial support was received for the research, authorship, and/or publication of this article. This work was partly supported by the Research Council of Norway, project number 322387, Svalbard Integrated Arctic Earth Observing System-Knowledge Centre, operational phase 2022, Swedish National Space Agency (dnr 189/18).
Conflict of interest
The authors declare that the research was conducted in the absence of any commercial or financial relationships that could be construed as a potential conflict of interest.
Publisher’s note
All claims expressed in this article are solely those of the authors and do not necessarily represent those of their affiliated organizations, or those of the publisher, the editors and the reviewers. Any product that may be evaluated in this article, or claim that may be made by its manufacturer, is not guaranteed or endorsed by the publisher.
References
Abermann, J., Eckerstorfer, M., Malnes, E., and Hansen, B. U. (2019). A large wet snow avalanche cycle in West Greenland quantified using remote sensing and in situ observations. Nat. Hazards 97, 517–534. doi:10.1007/s11069-019-03655-8
Bartsch, A., Kumpula, T., Forbes, B. C., and Stammler, F. (2010). Detection of snow surface thawing and refreezing in the Eurasian Arctic with QuikSCAT: implications for reindeer herding. Ecol. Appl. 20, 2346–2358. doi:10.1890/09-1927.1
Bjerke, J. W., Karlsen, S. R., Høgda, K. A., Malnes, E., Jepsen, J. U., Lovibond, S., et al. (2014). Record-low primary productivity and high plant damage in the Nordic Arctic Region in 2012 caused by multiple weather events and pest outbreaks. Environ. Res. Lett. 9, 084006. doi:10.1088/1748-9326/9/8/084006
Douville, H., Royer, J.-F., and Mahfouf, J.-F. (1995). A new snow parameterization for the French community climate model. Part I: validation in stand-alone experiments. Clim. Dynam 12, 21–35. doi:10.1007/BF00208760
Eckerstorfer, M., and Christiansen, H. H. (2012). Meteorology, topography and snowpack conditions causing two extreme mid-winter slush and wet slab avalanche periods in high arctic maritime svalbard. Permafr. Periglac. Process. 23, 15–25. doi:10.1002/ppp.734
Forbes, B. C., Kumpula, T., Meschtyb, N., Laptander, R., Macias-Fauria, M., Zetterberg, P., et al. (2016). Sea ice, rain-on-snow and tundra reindeer nomadism in Arctic Russia. Biol. Lett. 12 (11), 20160466. doi:10.1098/rsbl.2016.0466
Hansen, B. B., Aanes, R., Herfindal, I., Kohler, J., and Sæther, B.-E. (2011). Climate, icing, and wild arctic reindeer: past relationships and future prospects. Ecology 92, 1917–1923. doi:10.1890/11-0095.1
Hanssen-Bauer, I., Førland, E. J., Hisdal, H., Mayer, S., Sandø, A. B., and Sorteberg, A. (2019). Climate in Svalbard 2100—a knowledge base for climate adaptation. NCCS Report No. 1/2019 (Oslo, Norway: Norwegian Meteorological Institute).
Hansen, B. B., Isaksen, K., Benestad, R. E., Kohler, J., Åshild, Ø. P., Loe, L. E., et al. (2014). Warmer and wetter winters: characteristics and implications of an extreme weather event in the High Arctic. Environ. Res. Lett. 9, 114021. doi:10.1088/1748-9326/9/11/114021
Isaksen, K., Nordli, Ø., Førland, E. J., Łupikasza, E., Eastwood, S., and Niedźwiedź, T. (2016). Recent warming on spitsbergen—influence of atmospheric circulation and sea ice cover. J. Geophys. Res. Atmos. 121, 11913–11931. doi:10.1002/2016jd025606
Isaksen, K., Nordli, Ø., Ivanov, B., Køltzow, M. A. Ø., Aaboe, S., Gjelten, H. M., et al. (2022). Exceptional warming over the Barents area. Sci. Rep. 12, 9371. doi:10.1038/s41598-022-13568-5
Jennings, K. S., Winchell, T. S., Livneh, B., and Molotch, N. P. (2018). Spatial variation of the rain–snow temperature threshold across the Northern Hemisphere. Nat. Commun. 9, 1148. doi:10.1038/s41467-018-03629-7
Karbou, F., Veyssière, G., Coleou, C., Dufour, A., Gouttevin, I., Durand, P., et al. (2021). Monitoring wet snow over an alpine region using sentinel-1 observations. Remote Sens. 13, 381. doi:10.3390/rs13030381
Køltzow, M., Casati, B., Haiden, T., and Valkonen, T. (2020). Verification of solid precipitation forecasts from numerical weather prediction models in Norway. Wea. Forecast. 35, 2279–2292. doi:10.1175/WAF-D-20-0060.1
Køltzow, M., Schyberg, H., Støylen, E., and Yang, X. (2022). Value of the Copernicus Arctic Regional Reanalysis (CARRA) in representing near-surface temperature and wind speed in the north-east European Arctic. Polar Res. 41, 8002. doi:10.33265/polar.v41.8002
Mooney, P. A., and Li, L. (2021). Near future changes to rain-on-snow events in Norway. Environ. Res. Lett. 16, 064039. doi:10.1088/1748-9326/abfdeb
Müller, M., Batrak, Y., Kristiansen, J., Køltzow, M. A. Ø., Noer, G., and Korosov, A. (2017). Characteristics of a convective-scale weather forecasting system for the European arctic. Mon. Wea. Rev. 145, 4771–4787. doi:10.1175/MWR-D-17-0194.1
Nagler, T., and Rott, H. (2000). Retrieval of wet snow by means of multitemporal SAR data. IEEE Trans. Geosci. Remote Sens. 38, 754–765. doi:10.1109/36.842004
Nagler, T., Rott, H., Ripper, E., Bippus, G., and Hetzenecker, M. (2016). Advancements for snowmelt monitoring by means of sentinel-1 SAR. Remote Sens. 8, 348. doi:10.3390/rs8040348
Nuth, C., Kohler, J., König, M., von Deschwanden, A., Hagen, J. O., Kääb, A., et al. (2013). Decadal changes from a multi-temporal glacier inventory of Svalbard. Cryosphere 7, 1603–1621. doi:10.5194/tc-7-1603-2013
Pall, P., Tallaksen, L. M., and Stordal, F. (2019). A climatology of rain-on-snow events for Norway. J. Clim. 32, 6995–7016. doi:10.1175/JCLI-D-18-0529.1
Peeters, B., Pedersen, A. O., Loe, L. E., Isaksen, K., Veiberg, V., Stien, A., et al. (2019). Spatiotemporal patterns of rain-on-snow and basal ice in high Arctic Svalbard: detection of a climate-cryosphere regime shift. Environ. Res. Lett. 14, 015002. doi:10.1088/1748-9326/aaefb3
Reistad, M., Breivik, Ø., Haakenstad, H., Aarnes, O. J., Furevik, B. R., and Bidlot, J.-R. (2011). A high resolution hindcast of wind and waves for the North Sea, the Norwegian Sea, and the Barents Sea. J. Geophys. Res. 116, C05019. doi:10.1029/2010jc006402
Rinke, A., Maturilli, M., Graham, R. M., Matthes, H., Handorf, D., Cohen, L., et al. (2017). Extreme cyclone events in the Arctic: Wintertime variability and trends. Environ. Res. Lett. 12, 094006. doi:10.1088/1748-9326/aa7def
Saloranta, T. M. (2014). New version (v1.1.1) of the seNorge snow model and snow maps for Norway. Rapport 6-2014. Oslo, Norway: Norwegian Water Resources and Energy Directorate.
Saloranta, T. M. (2016). Operational snow mapping with simplified data assimilation using the seNorge snow model. J. Hydrol. 538, 314–325. doi:10.1016/j.jhydrol.2016.03.061
Schyberg, H., Yang, X., Køltzow, M. A. Ø., Amstrup, B., Bakketun, Å., Bazile, E., et al. (2020). Arctic regional reanalysis on single levels from 1991 to present. Copernicus Climate Change Service. doi:10.24381/cds.713858f (Accessed January 29, 2024).
Tharwat, A. (2018). Classification assessment methods. Appl. Comput. Inf. 17, 168–192. doi:10.1016/j.aci.2018.08.003
Torralbo, P., Pimentel, R., Polo, M. J., and Notarnicola, C. (2023). Characterizing snow dynamics in semi-arid mountain regions with multitemporal sentinel-1 imagery: a case study in the sierra Nevada, Spain. Remote Sens. 15, 5365. doi:10.3390/rs15225365
Van Pelt, W., Schuler, T., Pohjola, V., and Pettersson, R. (2021). Accelerating future mass loss of Svalbard glaciers from a multi-model ensemble. J. Glaciol. 67 (263), 485–499. doi:10.1017/jog.2021.2
Van Pelt, W. J. J., Oerlemans, J., Reijmer, C. H., Pohjola, V. A., Pettersson, R., and van Angelen, J. H. (2012). Simulating melt, runoff and refreezing on Nordenskiöldbreen, Svalbard, using a coupled snow and energy balance model. Cryosphere 6, 641–659. doi:10.5194/tc-6-641-2012
Van Pelt, W. J. J., Pohjola, V. A., Pettersson, R., Marchenko, S., Kohler, J., Luks, B., et al. (2019). A long-term dataset of climatic mass balance, snow conditions and runoff in Svalbard (1957-2018). Cryosphere 13, 2259–2280. doi:10.5194/tc-13-2259-2019
Vickers, H., Karlsen, S. R., and Malnes, E. (2020). A 20-year MODIS-based snow cover dataset for svalbard and its link to phenological timing and sea ice variability. Remote Sens. 12, 1123. doi:10.3390/rs12071123
Vickers, H., Malnes, E., and Eckerstorfer, M. (2022). A synthetic aperture radar based method for long term monitoring of seasonal snowmelt and wintertime rain-on-snow events in svalbard. Front. Earth Sci. 10, 868945. doi:10.3389/feart.2022.868945
Vikhamar-Schuler, D., Isaksen, K., Haugen, J. E., Tømmervik, H., Luks, B., Schuler, T. V., et al. (2016). Changes in winter warming events in the nordic arctic region. J. Clim. 29 (17), 6223–6244. doi:10.1175/JCLI-D-15-0763.1
Walczowski, W., and Piechura, J. (2011). Influence of the West spitsbergen current on the local climate. Int. J. Climatol. 31, 1088–1093. doi:10.1002/joc.2338
Westermann, S., Boike, J., Langer, M., Schuler, T. V., and Etzelmüller, B. (2011). Modeling the impact of wintertime rain events on the thermal regime of permafrost. Cryosphere 5, 945–959. doi:10.5194/tc-5-945-2011
Wickström, S., Jonassen, M. O., Cassano, J. J., and Vihma, T. (2020). Present temperature, precipitation, and rain-on-snow climate in Svalbard. J. Geophys. Res. Atmos. 125, e2019JD032155. doi:10.1029/2019jd032155
Yang, X., Schyberg, H., Palmason, B., Bojarova, J., Box, J., Pagh Nielsen, K., et al. (2020). C3S Arctic regional reanalysis—full system documentation. Available at https://cds.climate.copernicus.eu/cdsapp#!/dataset/reanalysis-carra-single-levels?tab=doc (Accessed March 21, 2023).
Appendix A
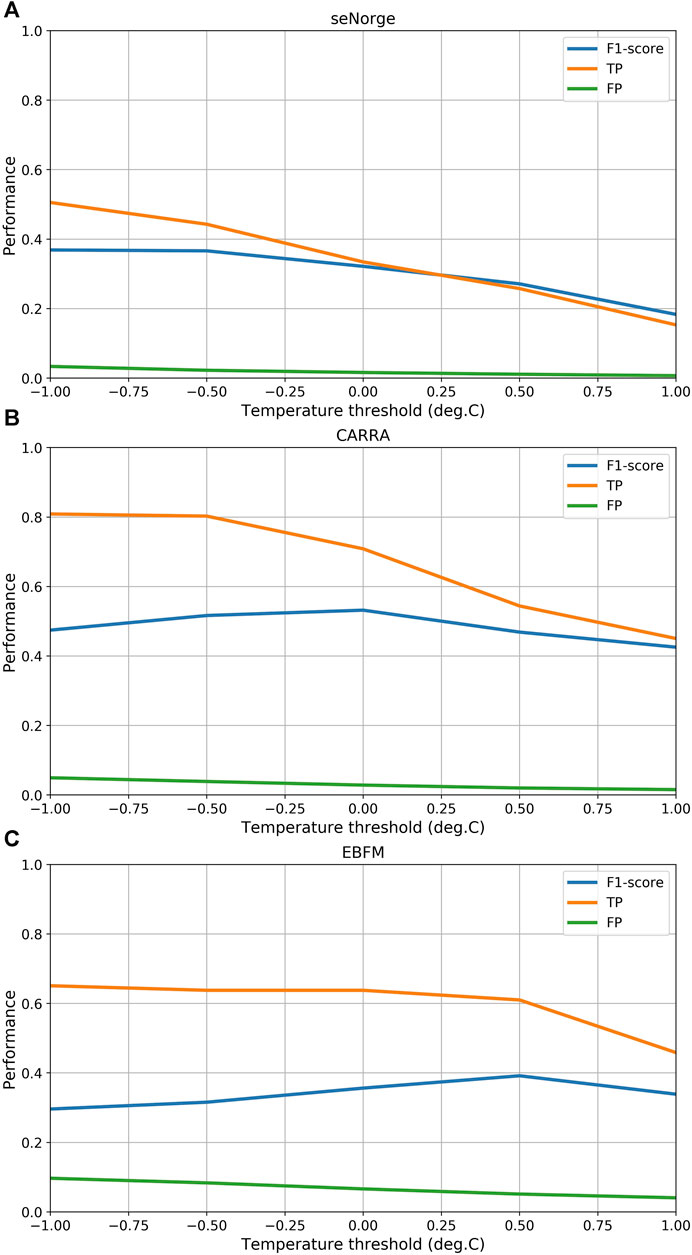
FIGURE A1. The F1 score, true positive rate (TP) and false positive rate (FP) calculated at five temperature thresholds for detecting rain, averaged over seven winters (2013–2019) and three meteorological sites for the (A) seNorge (B) CARRA and (C) EBFM datasets. This threshold sensitivity testing allowed for the optimum temperature threshold for detecting rain-on-snow to be determined.
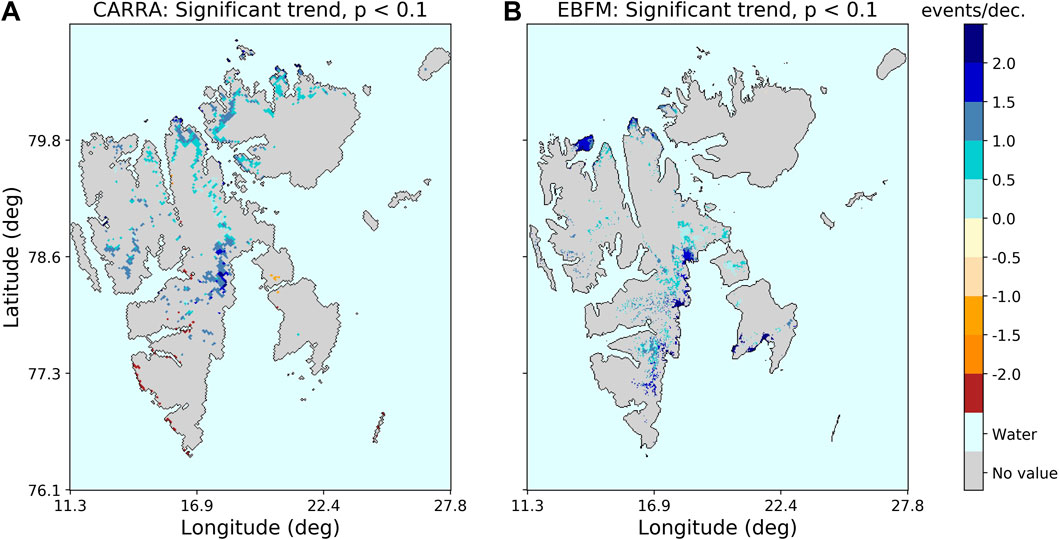
FIGURE A2. Significant trend in ROS over the SAR period (2004–2020) obtained using the (A) CARRA dataset (with temperature thresholded at −0.5°C to detect ROS) and (B) EBFM dataset.
Keywords: rain-on-snow, remote sensing, polar climate, climate models, snow cover
Citation: Vickers H, Saloranta T, Køltzow M, van Pelt WJJ and Malnes E (2024) An analysis of winter rain-on-snow climatology in Svalbard. Front. Earth Sci. 12:1342731. doi: 10.3389/feart.2024.1342731
Received: 22 November 2023; Accepted: 18 January 2024;
Published: 06 February 2024.
Edited by:
Mathias Bavay, WSL Institute for Snow and Avalanche Research SLF, SwitzerlandCopyright © 2024 Vickers, Saloranta, Køltzow, van Pelt and Malnes. This is an open-access article distributed under the terms of the Creative Commons Attribution License (CC BY). The use, distribution or reproduction in other forums is permitted, provided the original author(s) and the copyright owner(s) are credited and that the original publication in this journal is cited, in accordance with accepted academic practice. No use, distribution or reproduction is permitted which does not comply with these terms.
*Correspondence: Hannah Vickers, aGF2aUBub3JjZXJlc2VhcmNoLm5v