 Zheng Jian
 Guoyan Zhao1
 Ju Ma
Ju Ma- 1School of Resources and Safety Engineering, Central South University, Changsha, China
- 2Deep Min Lab Shandong Gold Grp Co. Ltd, Laizhou, China
- 3China Coal Research Institute, Beijing, China
Clustering methods aim to categorize data or samples into distinct groups based on their similarity. When applying clustering methods to earthquake events, it is crucial to establish a metric for quantifying the similarity between these events. Directly applying this clustering method to a catalog of mining-induced seismicity may lead to clustering earthquake events induced by different mining activities or accidents into the same group. To address this issue, a two-step clustering method has been proposed and applied for analyzing a catalog of mining-induced seismicity. The first step involves spatial distance-based clustering of seismic events, while the second step focuses on moment tensor analysis-based clustering of these events. The results obtained from the MT-based clustering method are visualized using Hudson Graphs, and box plots serve as an evaluation tool for assessing the quality of MT clustering. Most box plots demonstrate desirable quality in terms of MT cluster results, indicating successful outcomes. By the proposed two-step clustering method combined with actual mining activities, the potential accident locations and categories can be hypothesized while valuable recommendations provided for mining operations.
1 Introduction
Data clustering methods aim to categorize large datasets into distinct groups based on the similarity among the data points, with those within the same group exhibiting higher similarity compared to those in different groups. These clustering techniques find applications across various domains, including seismology. In seismology, they enable differentiation of diverse types of seismic activity, aiding seismologists in identifying dominant source mechanisms and classifying earthquake events. This facilitates a comprehensive understanding and analysis of earthquakes occurring in specific regions. Prominent clustering methods employed include K-means, hierarchical clustering, Density-Based Spatial Clustering of Applications with Noise (DBSCAN), among others. Each method necessitates a defined metric for measuring event similarity, which significantly influences the resulting clusters obtained. Furthermore, these clustering approaches can be effectively utilized for tasks such as data inversion, hydrofracturing characterization, identification of rock discontinuity sets, etc (Hammah and Curran, 1999; Jimenez, 2008; Li et al., 2015; Mukhopadhyay and Dasgupta, 2015; Sun and Li, 2017; Chen et al., 2018).
When applying clustering methods to earthquake events, it is essential to establish a suitable metric for measuring the similarity between these events. Earthquakes are characterized by various parameters such as occurrence time, spatial location, moment tensor, P and T axis, waveform, etc. Metrics based on occurrence time or spatial location can be easily defined (e.g., Euclidean distance between locations or temporal intervals), and many clustering techniques utilize these spatial or temporal distances (DiCaprio et al., 2008; Ouillon and Sornette, 2011; Zaliapin and Ben-Zion, 2016; Shang et al., 2018; Woodward et al., 2018; Fan and Xu, 2019; Vijay and Nanda, 2019; Lurka, 2021; Ortega-Romo and Chen, 2021).
The metric based on waveform similarities is also an important method. A lot of work has been done based on waveform similarity (Akuhara and Mochizuki, 2014; D’Alessandro et al., 2013; Igarashi et al., 2003; Matoza et al., 2013; Maurer and Deichmann, 1995; Petersen et al., 2021, P. Shearer et al., 2005, P. M. Shearer, 2012; Wang et al., 2020). Besides the spatio-temporal metric and the waveform similarity, The metric based on the moment tensor can also measure the similarity of the seismicity. Moment tensor is a common description for the focal mechanism under the point source assumption, and it is a symmetric matrix containing six independent elements. A widely adopted decomposition method for moment tensor decomposes the moment tensor into three components: ISO, DC, and CLVD (Knopoff and Randall, 1970). They respectively represent the volume change of the source, the shear failure of the source, and the compensation for the volume change.
Numerous scholars have extensively researched the metric based on the moment tensor. Kagan (1991) introduced the Kagan angle as a metric for comparing pure DC sources by considering the rotation of two DC sources. Willemann (1993) proposed representing the moment tensor as a vector in 6-dimensional space. Cesca et al. (2014) incorporated uncertainty in their metric by introducing a weighted cosine-based approach to account for moment solution variability. In contrast to these aforementioned approaches, Lasocki (2014) devised a novel method that transforms all parameters into an equivalent dimensional space and defines the metric within this equal dimensions space rather than its original form.
The MT-based clustering methods, which utilize metrics based on the moment tensor, have demonstrated favorable performance in previous studies. However, when applied to mining-induced seismicity, these methods may occasionally lead to misinterpretation of earthquake events. In order to elucidate the challenges encountered by MT-based clustering methods in analyzing mining-induced seismicity, it is imperative to identify the various types of mining-induced seismicity and ascertain the corresponding stress environments that give rise to them.
The mining-induced seismicity can be categorized into three types. The first type of seismicity is directly associated with mining activities. Excavation alters the stress state of the rock surrounding the stope, transitioning it from stable triaxial compression to unstable biaxial compression, thereby inducing seismic events. These earthquakes primarily occur in proximity to the stope. The second type of seismicity is indirectly associated with mining activities, where fault slip serves as the triggering mechanism. Excavation alters the stress distribution within the mining region, subsequently modifying the stress state of the surrounding rock near existing faults and potentially inducing fault slippage, leading to seismic events. These earthquakes primarily occur in close proximity to faults, with their moment tensors predominantly characterized by a DC component. The third type of earthquake is induced by the interaction of the two types beyond. The significant fault slip triggers the seismic wave, which carries the energy spreading to the rock around the stope. The wave disturbs the high-energy rock around the stope and causes the rock-burst.
Now, the potential issue that may arise with the MT-based clustering method has been illustrated. Consider the following example: Two faults in the same mining region have caused seismicity through slipping events. Based on empirical observations, it is evident that the moment tensors of seismicity induced by fault slip are predominantly characterized by the DC component. Given the complexity of mining-induced seismicity, direct application of the MT-based clustering method may result in clustering seismic events caused by different fault slips into a single group, which does not align with expected outcomes.
It is worth noting that all three types of induced seismicity have one thing in common: they all exhibit spatial aggregation. Specifically, The first and third types of induced seismicity are mainly located around the corresponding stope, and the second type of induced seismicity are mostly located near the related fault. This phenomenon reminds people that, before using the MT-based clustering methods to cluster the earthquake events, all the earthquake events should be spatially clustered into various groups to distinguish the earthquake groups induced by different stress environments. After doing this, the earthquake events in the same group are probably caused by a similar stress environment. Then, an MT-based clustering method can be applied within each group to cluster the moment tensors and figure out the local stress environment. That will do a great favor to the mining activity and will also be helpful for the identification and prediction of mining accidents.
A proposed scheme is presented here to address the aforementioned problem. Firstly, a spatial clustering method is employed to group earthquake events based on their spatial distances. Subsequently, an MT-based clustering method can be applied within each spatial group identified in the previous step. The outcomes of the MT clustering analysis can be utilized for analyzing and specifying the type of induced earthquakes, as well as identifying potential accidents.
2 Methodology
Clustering methods aim to automatically classify data into groups based on their similarity, necessitating the definition of a metric to quantify this similarity. Numerous clustering methods have been proposed by scholars and widely applied. However, it is crucial to carefully select an appropriate method as different approaches may yield disparate outcomes.
The distance-based method, which includes the K-means and hierarchical clustering methods, is one of commonly employed for clustering. The K-means clustering method offers the advantages of simplicity in calculation and ease of comprehension. In their study, Guo et al. (2021) proposed a machine learning approach based on the C5.0 decision tree (DT) model and the K-means cluster algorithm to generate a regional landslide susceptibility map. However, this method requires prior knowledge of the number of clusters, performs poorly when dealing with nonconvex sets, and is highly influenced by outliers. It is only effective when clustering data that roughly conforms to circular or spherical shapes. These characteristics render it unsuitable for spatial clustering since determining an appropriate number of clusters may be challenging in practice; moreover, fault or stope geometries can be irregular leading to irregular distribution patterns in seismicity around them. Additionally, random abnormal events are inevitable in induced-seismicity data and can significantly impact the performance of K-means clustering. Therefore, applying the K-means method to mining-induced seismicity may lead to misinterpretations.
To mitigate these issues, we employ a density-based clustering approach known as DBSCAN (Figure 1 illustrates the clustering process of DBSCAN). DBSCAN is a representative non-supervised machine learning method that identifies high-density regions and groups them accordingly, without being constrained by shape. Additionally, DBSCAN classifies points in sparse areas or far from high-density regions as noise, thereby excluding them from any clusters. This characteristic ensures that abnormal events have minimal impact on the outcome of DBSCAN, making it advantageous for handling numerous events including random occurrences. Prior to executing DBSCAN, two parameters must be specified: Eps (the Eps-neighborhood of a point) and MinPts. Based on these parameters, DBSCAN categorizes points into three groups: core points, boundary points, and noise points (as depicted in Figure 2). Core points are those with a greater number of neighbors than the given MinPts threshold. Boundary points refer to non-core points located within the neighborhood of core points. Any remaining unclassified point is considered a noise point.
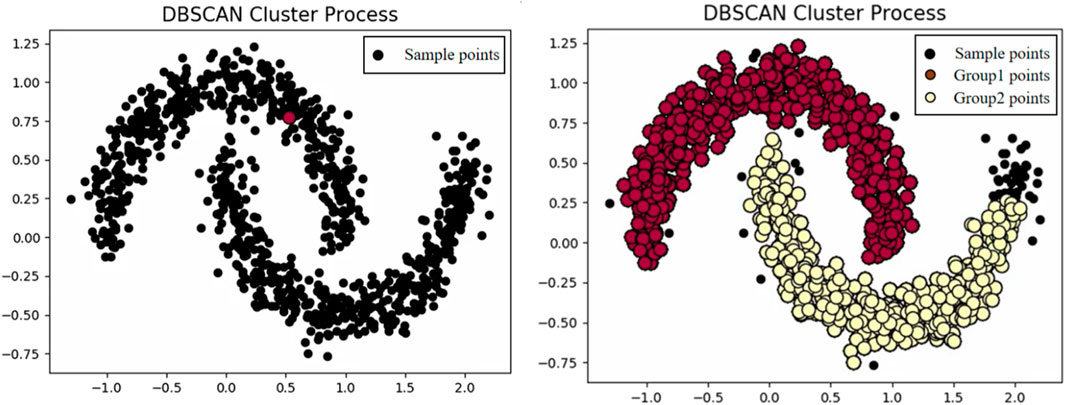
FIGURE 1. DBSCAN clustering process diagram. The left image shows before clustering, and the right image shows after clustering.
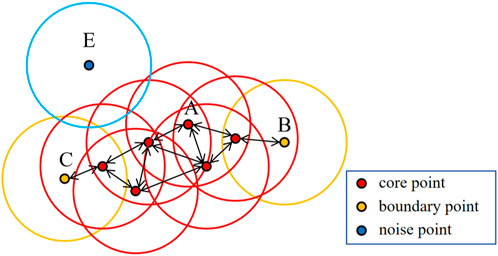
FIGURE 2. The three categories points divided by DBSCAN. A is the core point, B and C are the boundary points, and the E is the noise point.
DBSCAN defines the clusters as the maximal set of the density-connected points. Compared with the K-means method, the most significant difference is that DBSCAN does not need to input the number of groups K, and its most important advantage is that it can find groups of any shape, rather than K-means, which is generally only used for convex shape data. At the same time, it can discover noise while clustering and is insensitive to noise in data sets. In general, if the data set is dense and the data set is not convex shape, DBSCAN will perform much better than K-means clustering. But there are also some shortcomings of DBSCAN, and in some circumstances, DBSCAN is not suggested to be used:
(1) If the density of sample sets is not uniform and the cluster spacing difference is large, the cluster quality is poor, and DBSCAN clustering is generally unsuitable.
(2) Parameter tuning is more complex than k-means clustering methods, which mainly need to be adjusted for distance threshold Eps and MinPts. Different parameter combinations have a significant impact on the final clustering effect. Generally, the determination of these two parameters mainly depends on experience. If the result of empirical value clustering is unsatisfactory, the values of ϵ and MinPts can be adjusted appropriately, and the most appropriate parameter value can be selected after multiple iterations. If MinPts remains unchanged and Eps is too large, most points will cluster in the same cluster; if Eps is too small, many groups will occur. If ϵ remains unchanged, the value of MinPts is too large, leading to plenty of noise points; if MinPts is too small, that will lead to the discovery of many core points.
(3) It is unsuitable for high-dimensional data, so reducing the dimension first is a good choice.
2.1 Spatial clustering method
The spatial clustering should be prioritized to partition the entire dataset into distinct spatial clusters, as closely occurring events in space are likely influenced by similar stress environments. Prior to implementing the spatial clustering method, it is crucial to determine an appropriate spatial scope for clustering. Compared to the potential stress environment inducing seismicity, the overall mining region is excessively large. Analyzing the specific stress environment would not be suitable and considering the vast density of earthquake events across the entire mining region could lead to sensitivity issues with selected parameters. Therefore, applying the spatial clustering method on smaller areas rather than encompassing the entire mine site is more appropriate.
The stress field’s distribution law is closely associated with microseismic events, as indicated by numerous research findings. In regions characterized by high MaxHPS and Lateral Pressure Coefficient (LPC), there is a higher frequency of high-energy microseismic events (Ji et al., 2020; Tian et al., 2022; Cheng et al., 2023). Additionally, rock disasters such as rockbursts are typically triggered by high-energy tremors (Yu et al., 2020; Zhao et al., 2024). These studies suggest that large-magnitude events containing high-energy pose more severe risks to mining activities compared to lower magnitude. Therefore, this study focuses on big magnitude earthquake events and applies clustering methods in the vicinity of these locations to investigate the surrounding stress environment and gain insights into the larger magnitude earthquake event’s impact on the stress environment. This analysis aims to provide valuable recommendations for mining activities.
Furthermore, seismicity induced by fault slip (the second type of earthquake) typically exhibits larger magnitudes (Ye and Ghassemi, 2020; Wu, 2021; Cao et al., 2023; Sainoki et al., 2023; Wu et al., 2023). Therefore, selecting seismic events with relatively higher magnitudes and analyzing the stress environment in their vicinity can aid in identifying undetected faults, thus providing valuable insights for mining activities.
As previously mentioned, the determination of appropriate parameters is a complex task, as different combinations can yield varying clustering results. Generally, parameter selection relies heavily on experience, lacking a definitive criterion to assess the quality of outcomes. However, if Eps is set too small and MinPts too large, it may result in excessive noise and insignificant clusters. Conversely, setting Eps excessively large with MinPts too small may lead to minimal noise and an overly extensive cluster. Both scenarios are unsatisfactory; henceforth, a more scientifically-driven approach for parameter selection should be adopted to avoid such outcomes. Extensive research has been conducted by experts and scholars on methods for selecting optimal values of parameters Eps and MinPts (Ester et al., 1996; Gholizadeh et al., 2021; Li et al., 2021; Zhang and Zhou, 2023), among which the most widely utilized is the k-distance algorithm.
When applying the k-distance algorithm to determine the parameter Eps, the value of k is determined by Eq. (1):
Where the D is the dimension of the dataset. Then the distance from each point to its kth nearest neighbor can be calculated, and the resulting distances are sorted in descending order for visualization purposes, as illustrated in Figure 3. By examining the distance at the inflection point on the graph, Eps can be determined. Typically, MinPts is set to a value greater than or equal to the dimension of the dataset, and Eq. 2 is commonly employed to determine its specific value.
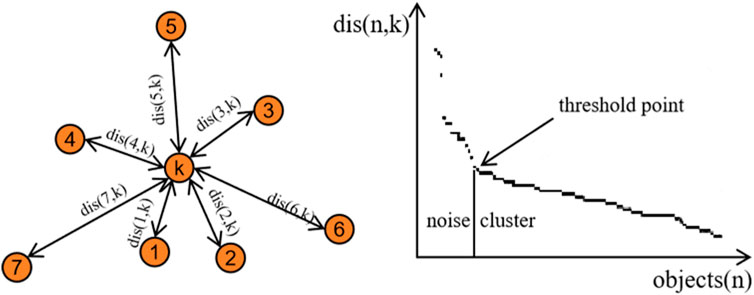
FIGURE 3. The schematic for selecting Eps by applying k-distance algorithm. The dis (n,k) is the distance from each point in the dataset to its k-th nearest neighbor and the dis (n,k) of the threshold point is Eps.
It is worth noting that the above methods are feasible ways to select MinPts and Eps, but the values obtained may not be optimal. Therefore, after selecting the parameter values, it is necessary to further observe the clustering results, and then make multiple attempts and adjustments before determining the final parameter values.
2.2 MT-based clustering method
After performing the spatial clustering using the DBSCAN, the earthquake events around the big-magnitude earthquake are divided into different groups. Still, some do not belong to any groups because they are marked as noise. For each group an MT-based clustering method can be used within each group.
Any cluster method needs a defined metric. Many metrics between the moment tensors are determined by the pure DC assumption, for example, the Kagan angle. Kagan defined the metric between the two pure DC focal mechanisms by the angle needed for rotating the first DC focal mechanism to the second one (Kagan, 1991). It is intuitive, easy to understand, and very suitable when analyzing natural seismicity because the moment tensor of the natural seismicity is usually dominated by the DC component.
However, the metric defined only by the DC component is unsuitable when describing the mining-induced seismicity because the mining-induced seismicity’ focal mechanisms are more complex than natural ones. Many seismicity are induced directly by mining activities. The mining engineering makes the stress environment very complicated, so the focal mechanisms of the mining-induced seismicity can not be explained only by the shear failure. The metric between the focal mechanisms defined by the DC component needs to be replaced.
Here, the cosine-based approach proposed by Tape and Tape (2012) can be adopt. The cosine-based method considers all the moment components, delivering a more comprehensive and credible measurement for analyzing mining-induced seismicity. Based on the Eq. 3 shown in Tape and Tape (2012), Cesca et al. (2014) considered that moment tensor is characterized by six independent moment tensor elements and suggested that the following metric should be regarded as upon Eq. 4 in Cesca et al. (2014):
Where
Notably, the cosine-based metric between two moment tensors will not change when the six independent elements of one moment tensor multiply a common positive constant. This character makes it easier to find the center of the moment tensor cluster. The center of the cluster is usually defined as the point whose sum of the metric to all the points in the cluster is the smallest. When searching for the group’s center, it can be assumed that the central moment tensor is normalized, meaning the sum of squares of the six independent components is 1.
After calculating the metric sum, it can be found that the minimum sum by taking the constraint of the normalized moment tensor into account and also find the normalized center moment center. The DBSCAN is also chosen as the clustering method. Being different from the spatial cluster, the cosine-based metric of the two moment tensor is adopted, and the combination of the parameters follows the same rules mentioned above.
As depicted in Figure 4, the first step of designed clustering method involves conducting spatial clustering for mining-induced seismicity using the two-step clustering method. The spatial coordinates of seismic events are utilized, and appropriate values for MinPts and Eps parameters are selected. Subsequently, the DBSCAN method is employed to cluster seismic events into distinct spatial groups. In the second step, a cosine-based metric of the two moment tensors is applied, followed by utilizing DBSCAN as the clustering method to further categorize events within each spatial group into different MT groups.
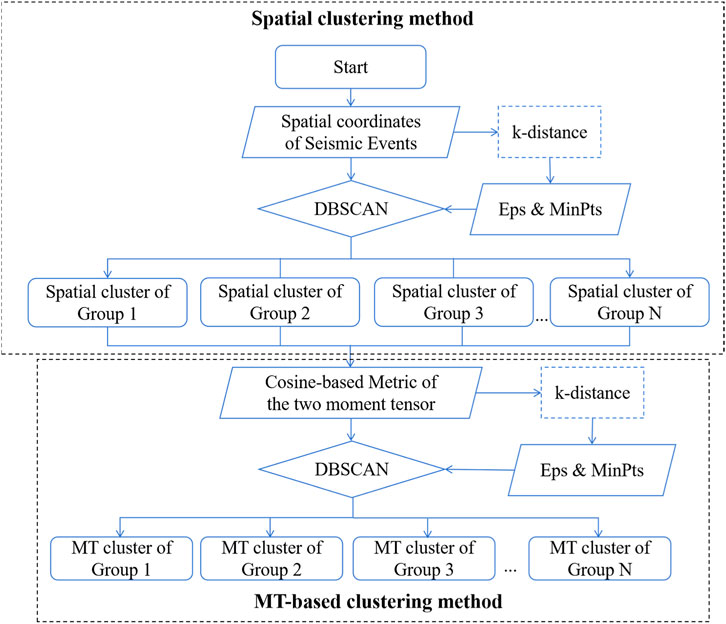
FIGURE 4. The flowchart of the two-step clustering method.
Table 1 lists the characteristics of K-means, DBSCAN and two-step clustering methods. Compared with the previous clustering methods (K-means and DBSCAN), the newly designed two-step clustering method overcomes the limitations of K-means in the case of non-circular or non-spherical data distribution. It can effectively deal with the randomness and irregularity of induced seismic data, and avoid the significant influence of outlier events on clustering results. On the other hand, this two-step clustering method conducts spatial and MT clustering of induced seismic events in sequence. Because different types of data features are took under consideration during the clustering process, this method enhances the accuracy of clustering results and reduces the clustering difficulty of high-dimensional or complex datasets.
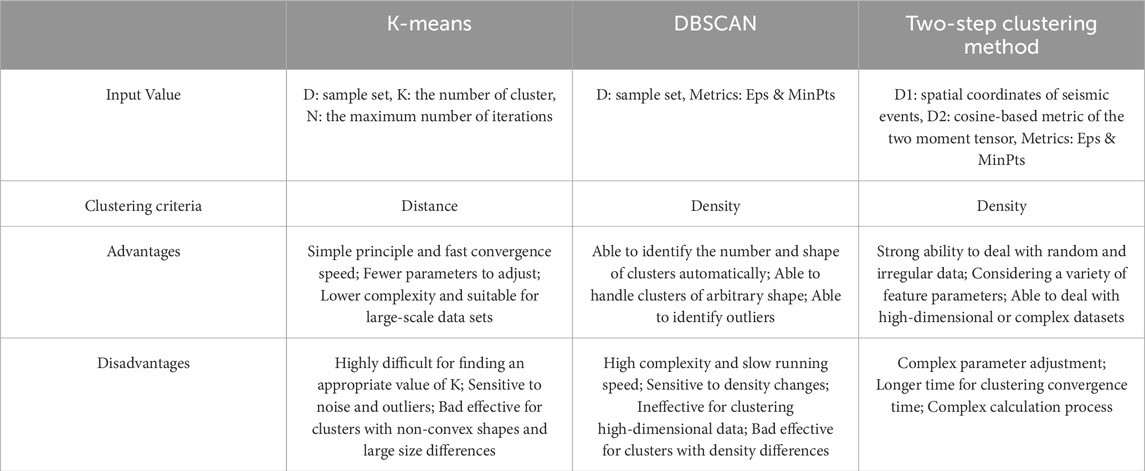
TABLE 1. The Parameters, features, and application scenarios of three clustering methods.
3 Materials and methods
3.1 Study area
This study was conducted in Yongshaba Mine, which belongs to Guizhou Kailin Group Mining Company, located in the development zone of the Wujiang River basin in the central part of Guizhou Province. Yongshaba Mine is the main mine of Guizhou Kailin Mining Limited Liability Company, with a production capacity of 2 million tons annually. The surface elevation of the mine is +1,400–+1700 m, the sloping path is exploited, and the sublevel filling method is used. The Yongshaba ore block has a more than 50 million tons geological reserve. The ore block has a complex topography, and the main composition of the rock is dolomite. Due to long-term weathering and rain erosion, the rock integrity is poor, the development of joints and fractures, and there are many faults. Serious potential ground pressure exists in the Yongshaba mine for phosphorus exploitation. With the completion of shallow mining, the ground pressure becomes more and more serious. Under the influence of the disorderly change of the stress state of the rock caused by the simultaneous mining disturbance of multiple sections, stress concentration occurs in the rock within the mining scope, which threatens the safety of underground mining and the normal production of the mine. Therefore, an IMS microseismic monitoring system was installed in the mine in 2013 to monitor underground accidents (the layout of the IMS shown as Figure 5).
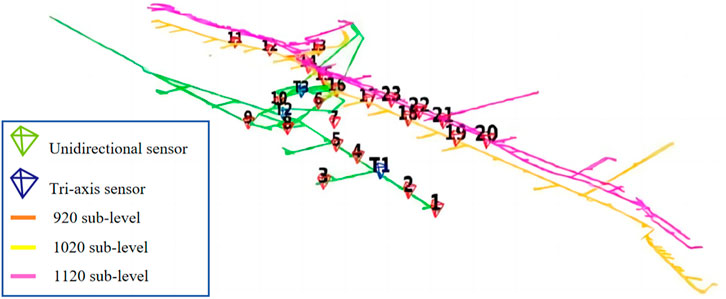
FIGURE 5. The layout of IMS microseismic monitoring system.
3.2 Data
The data used in this article comes from the Yongshaba Mine. Figure 6 shows the 3D distribution map of microseismic large events in the Yongshaba Mine. The second-largest magnitude earthquake event is selected and the earthquake events around it is under consideration. That is because no mining activities are near the largest earthquake event. In contrast, the second largest earthquake event is located in the region where mining activities occur frequently. The event is located at the point of (381520.711, 2997198.617, 1051.666). The three values in parentheses are the X, Y, and Z coordinates, and the magnitude is 1.65. Then, a region in which the x-coordinate is less than 200 m away from this point and the y-coordinate is less than 100 m away from this point is delimited, and the seismicity that occur in this region are considered. The number of the total earthquake events considered is 432 as shown in Figure 7, the magnitude of most earthquake events is about 0, and the events with a magnitude beyond 1 or less than −2 are very few.
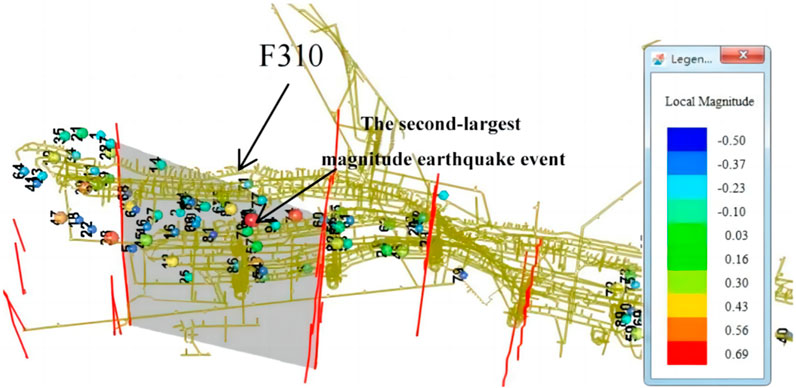
FIGURE 6. 3D distribution map of microseismic large events in the Yongshaba Mine.
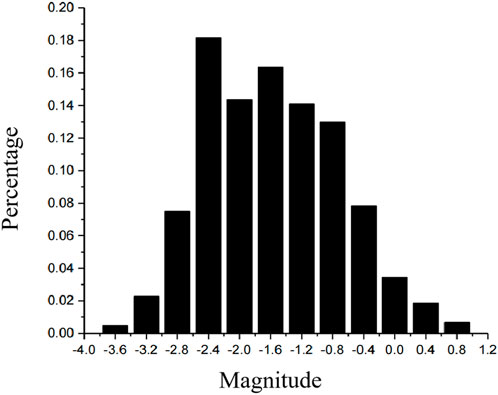
FIGURE 7. Mining-induced seismicity distribution map of Yongshaba Mine microseismic events.
4 Results
First, the spatial clustering method is applied to the seismicity events. They are divided into seven groups, and 249 events are considered noise. The parameters here chosen by authors are Eps = 30, MinPts = 8 based on the result of k-distance calculate shown as Figure 8. The result is illustrated in Figure 9, which is the planform of the mining region. The x-coordinate and the y-coordinate represent the x-coordinate and the y-coordinate of the mining area, respectively. Different groups are marked in different colors. The noise events are not plotted in Figure 9. The number of the events in the spatial group and their magnitude distribution, and the colors used to mark the groups are shown in Table 2.
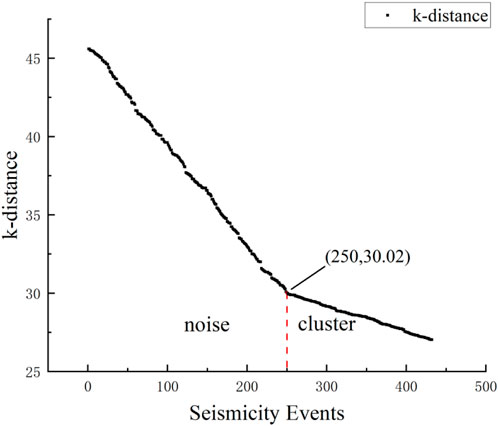
FIGURE 8. The curve chart of the k-distance calculate. According to the dimensions of the data set, the value of k is set to 3 and the k-distance curve chart can be plotted. It can be observed from the curve in the chart that there is a clear inflection point at the point (250, 30.02). Therefore, the parameter Eps can be determined to be 30 based on the location of this inflection point in the chart. Additionally, the value of MinPts can be determined to be 8 based on the clustering situation to ensure that noise points are excluded from clusters.
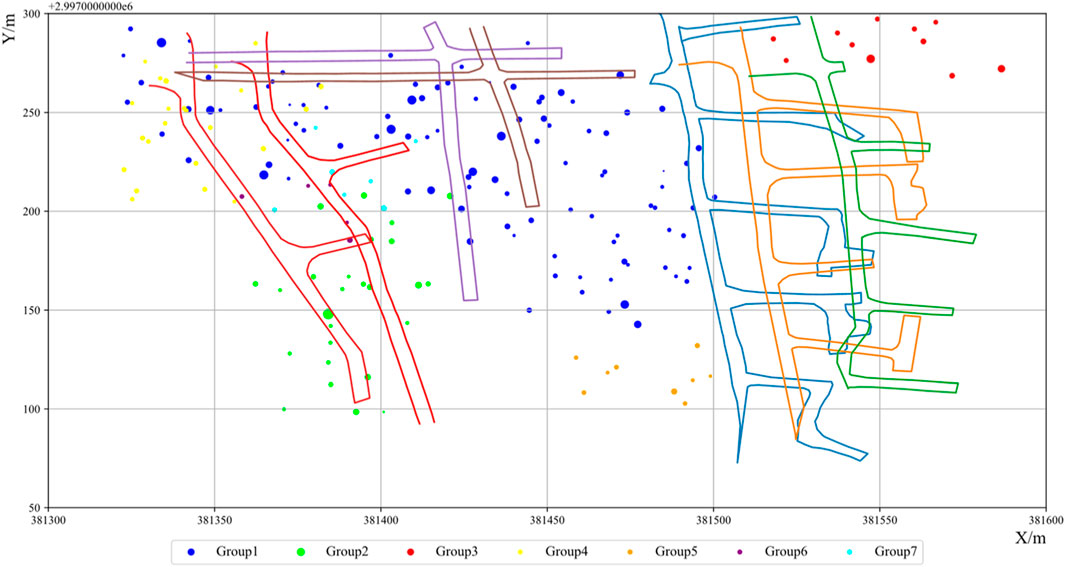
FIGURE 9. The result of the spatial clustering method and the distribution of the earthquake events in the mining region. Different spatial groups are marked by different colors. Seven tunnels from the left to the right are tunnel 940, tunnel 950, tunnel 970, tunnel 980, tunnel 1,000, tunnel 1,010, and tunnel 1,020, respectively.
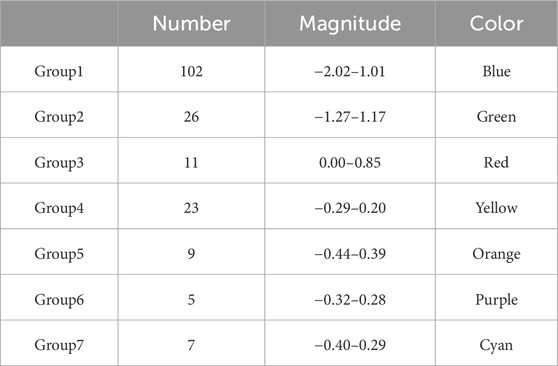
TABLE 2. The grouping of events and the number, magnitude and color information of each group.
Figure 9 also shows the spatial distribution of the groups. Group 1 is marked as blue and distributed among almost all the main tunnels, including tunnel 940, tunnel 950, tunnel 970, tunnel 980, and tunnel 1,000. Group 2 is marked as green color. It is distributed mainly among the below and the middle of tunnel 940 and tunnel 950. Group 3 is marked as red color. It is distributed near the tunnel 1,020. Group 4 is marked as a yellow color. It is distributed mainly among the top of tunnel 940 and tunnel 950. Group 5 is marked as orange, and no mining activities are near this group. Group 6 and Group 7 are marked as purple and cyan color, distributed in the middle of tunnel 940 and tunnel 950.
After the spatial clustering, the MT-based clustering method is applied within each spatial cluster. The metric is the cosine-based metric, and the clustering method is DBSCAN. The result is shown using the Hudson graph as shown in Figure 10. Hudson et al. (1989) described the moment tensor using two parameters. They are T and k. T represents the deviation part of the moment tensor, and k measures the volume change (Hudson J A et al., 1989). Although the Hudson graph does not take the direction of the rupture into account, T and k display the rupture type of the source very directly and could reveal the main rupture type clearly. That character makes it very suitable to analyze the main rupture type and the focal mechanism. The earthquake events’ moment tensors is displayed in the same spatial group on the Hudson Graph and uses different colors to mark the different clusters. The noise events are marked as black, and the center moment tensors of each cluster are also displayed in the Hudson Graph by the beach ball. Besides, the number of events in Group6 and Group7 is too small to perform the MT-based clustering method (less than 8), so the MT-based clustering method is performed within Group1, Group2, Group3, Group4, and Group5.
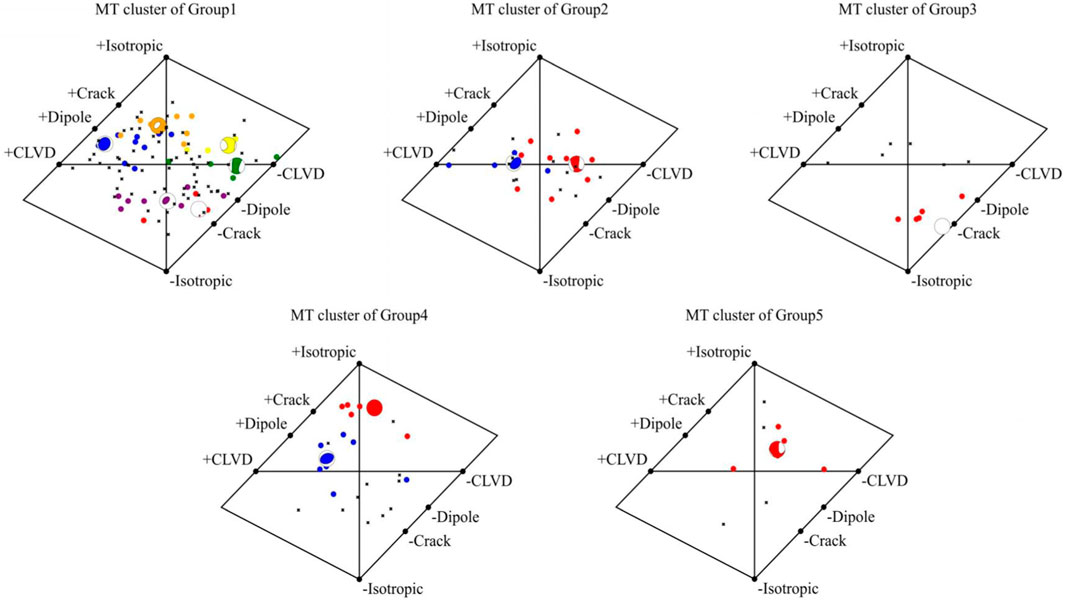
FIGURE 10. The result of the MT-based clustering method within each group is that different MT clusters are marked as different colors. The center MT of each cluster is shown by the beach ball and is marked as the same color as the corresponding cluster. The noise events are marked as the black ‘x’.
When performing DBSCAN, two parameters are needed: Eps and MinPts therefore, k-distance algorithm is also applied to obtain Groups 1 to 5 Eps and Minpts, as shown in the Table 3. The two parameters are chosen to perform the MT-based clustering method in different groups are as follows:
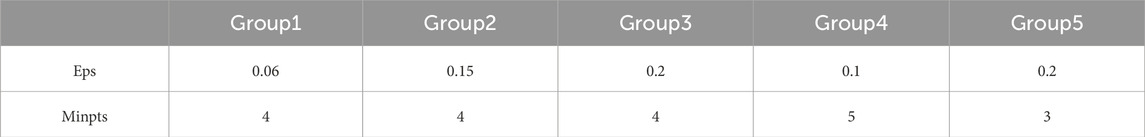
TABLE 3. Parameter selection of Eps and MinPts for different groups.
A box plot is used to evaluate the quality of the result of the MT-based clustering method. A box plot is a statistical chart used to show the dispersion of a set of data. The drawing method of the box plot is as follows: first find the lower quartile (Q1), median, and upper quartile (Q3) of a set of data, calculate the inter-quartile range (IQR = Q3-Q1), and then calculate the upper edge (Q3 + 1.5IQR) and the lower edge (Q1-1.5IQR) data larger than the upper edge or smaller than the lower edge are regarded as outliers. Then, connect the two quartiles to draw the box. In addition to the outliers, find the two values closest to the top and bottom edges and draw a line across the two values. The outliers are represented in this paper by the hollow circle.
The similarity of the MTs from the same MT cluster has been analyzed by the box plot. Specifically, each MT is decomposed into ISO, DC, and CLVD components and calculate the proportion of the three components and the rock rupture type of each earthquake events can be differentiated. Table 4 lists results of inversion of seismic moment tensor and analysis of rock mass rupture types in the large earthquake events. Then, the proportion of the three components can be displayed in the box plot, and the height of the box reflects the quality of the result of the MT-based clustering method. Suppose the height of the box is minimal. In that case, that means the data, in this paper, the proportion of the three components, is very concentrated. Hence, the three components of MTs in the same MT cluster are very similar, and the result of the MT-based clustering method is successful. On the contrary, if the height of the box is large, then the proportion of the three components is not very concentrated. The result of the MT-based clustering method is not desirable.
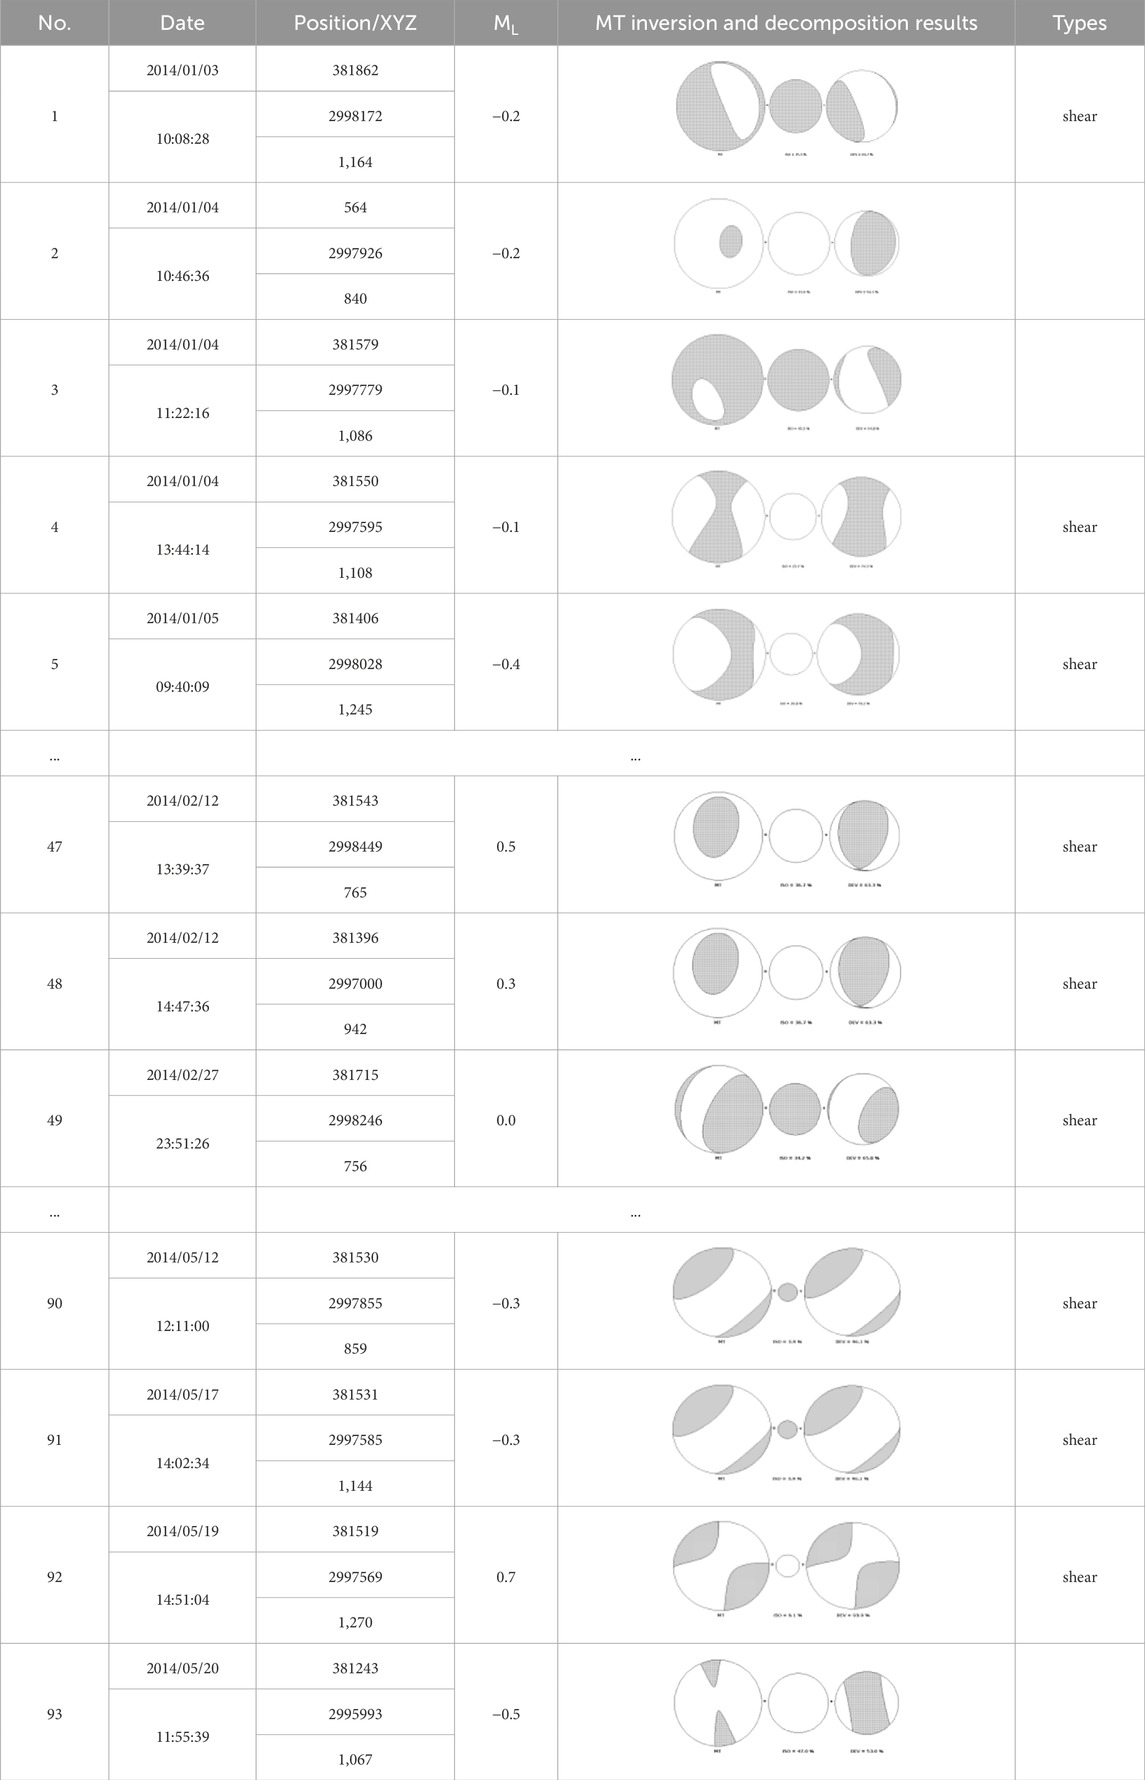
TABLE 4. Results of inversion of seismic moment tensor and analysis of rock mass rupture types in the large earthquake events.
To better display the aggregation of the clustering result, 0.5 IQR but not 1.5 IQR is chosen as the distance between the upper edge and the box and between the lower edge and the box. The box plot of each MT cluster is illustrated in Figure 11. The x-axis represents the component, and the y-axis represents the proportion.
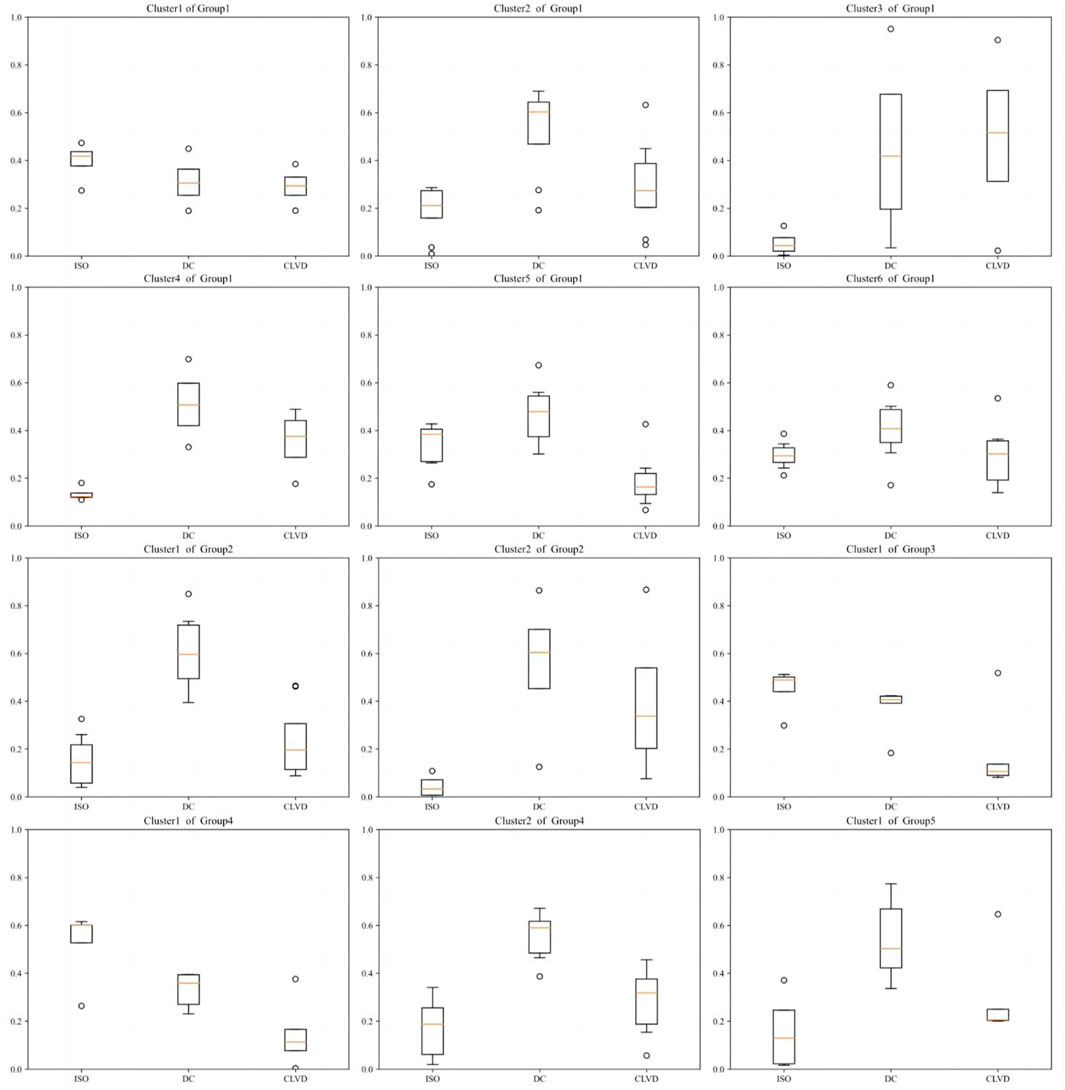
FIGURE 11. The box plot of ISO, DC, and CLVD components of each MT cluster, the outliers are marked as hollow circles.
5 Discussion
The application of the spatial clustering method to analyze the entire set of earthquake events enables their division into distinct spatial groups, with events within each group being induced by similar stress conditions. By examining the moment tensors of events within the same spatial group, it becomes possible to reveal local stress conditions and thereby distinguish between different rupture types. This approach proves valuable in assessing mining area stability, forecasting accidents, and detecting concealed faults.
Firstly, the moment tensors are analyzed in Group 1. The Hudson Graph of Group 1 reveals the presence of six distinct MT clusters, denoted as Cluster 1 (red), Cluster 2 (blue), Cluster 3 (green), Cluster 4 (yellow), Cluster 5 (orange), and Cluster 6 (purple). Sixty-six events are considered as noise. Based on the height of each box, it is evident that the results for Clusters 1, 2, 4, 5, and 6 exhibit desirable quality while the performance of Cluster 3 is comparatively inferior. In terms of rupture type characterization, these six clusters demonstrate significant variations. The centers of these clusters are dispersed throughout the Hudson Graph indicating an absence of dominant rupture types or primary focal mechanisms within this spatial group. None of these MT clusters exhibit characteristics indicative of shear ruptures. Furthermore, the locations of their cluster centers deviate from that at the center point representing pure shear rupture in the Hudson Graph; additionally, event density in this central region is lower compared to other areas. Considering induced seismicity types, it is likely that there is no fault activity within Group 1’s spatial area.
The Hudson Graph of Group 2 reveals that 2 MT clusters within Group 2 and 13 events are classified as noise. Cluster 1 is denoted by the color red, while Cluster 2 is represented by the color blue. The box plot provides insights into the clustering outcome; it is evident that the box plot for Cluster 1 exhibits higher concentration, whereas the box plot for Cluster 2 displays relatively greater dispersion. Consequently, in terms of the clustering result, Cluster 1 outperforms Cluster 2.
The centers of the 2 MT clusters on the Hudson Graph are located in close proximity to the graph’s center, with DC proportions of 0.64 and 0.73 respectively, surpassing the threshold of 0.6. This indicates that both central MTs are predominantly influenced by the DC component, suggesting shear rupture as the primary rupture type within Group 2’s spatial area. Group 2 is primarily distributed below and in the middle sections of tunnel 940 and tunnel 950. The clustering results from MT analysis suggest that shear ruptures occur near these two tunnels. In close proximity to stopes, roof collapse is mainly attributed to tensile rupture, while shear rupture dominates side wall failures. Therefore, it can be inferred that shear failure may occur in the side walls of these two tunnels, necessitating reinforcement measures for roadway side walls.
Analysis of Group 3’s Hudson Graph reveals a single MT cluster, with 6 events classified as noise. The central MT within this cluster exhibits characteristics indicative of compression rupture. Furthermore, examination of the box plot for this MT cluster demonstrates high concentration levels in ISO, DC, and CLVD components. This suggests excellent result quality, indicating strong similarity among the events within the cluster and confirming compression rupture as the predominant rupture type in Group 3. Consequently, accidents characterized by compression rupture (e.g., pillar collapsing) may occur more frequently. These findings provide valuable insights for implementing preventive measures against potential accidents.
From the Hudson Graph of Group 4, it is evident that 2 MT clusters exist: Cluster 1 is highlighted in red, while Cluster 2 is marked in blue. Additionally, 11 events are identified as noise. The box plots representing these clusters exhibit distinct variations in the quality of clustering outcomes. Notably, the clustering result for Cluster 1 demonstrates a high level of satisfaction; all ISO, DC, and CLVD components display significant concentration with ISO being the largest and CLVD being the smallest. In contrast, the clustering outcome for Cluster 2 is comparatively less satisfactory than that of Cluster 1. The three components within Cluster 2 show lower levels of concentration compared to those within Cluster 1; they exhibit wider ranges of variation. However, there remains a clear indication of a high DC component and a low ISO CLVD component in this cluster, suggesting shear rupture as the primary rupture type. Furthermore, notable dissimilarities can be observed between the two central MTs (Moment Tensors). The center MT in cluster 1 predominantly exhibits an ISO component which accounts for approximately 54 percent.
In contrast, the DC component dominates the central MT of cluster 2, constituting 56 percent of its proportion. The result analysis reveals the existence of two primary rupture types in Group 4: one type causing significant volume change and another characterized by shear rupture. Group 4 is predominantly distributed at the upper sections of tunnel 940 and tunnel 950. Considering the proximity of these ruptures to the stope, it can be inferred that earthquake events induced by roof collapse exhibit tensile cracks with a prominent ISO component. Simultaneously, failure in the side wall is primarily attributed to shear rupture, resulting in a substantial DC component. Based on this observation, it can be speculated that both roof and side wall reinforcements are necessary due to potential losses occurring in these areas.
From the Hudson Graph of Group 5, it is evident that only 1 MT cluster exists, while four events are considered as noise. The box plot of this MT cluster demonstrates a favorable clustering outcome. The DC component exhibits the highest proportion, followed by the CLVD component which shows significant concentration, whereas the ISO component displays the lowest proportion. This indicates that the moment tensors of these earthquake events possess remarkably similar CLVD components. The central MT is positioned near the center of the Hudson Graph and its standard decomposition reveals that the DC component accounts for more than 60 percent (62 percent), surpassing a threshold commonly used to determine shear rupture. Consequently, it can be inferred that shear rupture is likely to be the primary rupture type in this spatial area encompassing Group 5’s seismic activity. However, no mining activities have been reported within this region and no faults have been detected thus far. Considering induced seismicity types, it can be speculated that there may exist concealed faults in Group 5’s spatial area which experienced slip.
With the exception of Group 1, the five spatial groups exhibit distinct main rupture types. The MT-based clustering method applied to Group 1 merely indicates the absence of shear-dominated ruptures, providing less informative results compared to the other four groups. The reason behind that is worth considering, and here a guess can be proposed. There is a very distinct feature of Group 1 that Group 1 occupies a much larger spatial area, which may be too large. It can be supposed that the earthquake events happening closely in space are probably caused by a similar stress environment. The room of Group 1 is too large compared to the room containing a similar stress environment, so the stress environment changes in the space, and thus many different rupture types occur. That may be the underlying cause of the many other MT clusters. At the same time, it provides a counter-example to explain the importance and the necessity of the spatial clustering method performed before the MT-based clustering method.
The phenomenon also highlights the limitations of DBSCAN. One of its drawbacks is its poor performance in datasets with uneven density. Considering the nature of DBSCAN, it becomes evident that Group 1 exhibits a high event density across the entire spatial area, while other spaces do not. Consequently, when employing DBSCAN for spatial clustering, the uneven distribution of density may lead to unexpected groups, such as those occupying excessively large spatial areas. This poses a significant challenge for clustering methods; however, finding an effective solution remains elusive. Therefore, enhancing existing clustering techniques to ensure their suitability for analyzing induced earthquake events is a pertinent issue worth exploring.
In general, statistical analysis of the primary fracture types within each spatial group reveals that the proportion of pure shear events (%DC > 90) is relatively small. The majority of microseismic events exhibit a combination of volume change and pure shear, with the deviatoric moment tensor component for shear microseismic events in this mine not significantly exceeding the isotropic component. Microseismic events characterized by %ISO values ranging from 50–40 or %DC values ranging from 50 to 60 account for approximately 40% of all large-scale microseismic events.
6 Conclusion
Clustering methods are often used in seismology to categorize seismic events. Each clustering method requires a measure of similarity between data or samples. The metric defined by the moment tensor is a crucial way to distinguish between principal focusing mechanisms. However, using this metric alone to cluster seismic events may result in the classification of seismicity caused by different mining activities into the same group. This is clearly not the desired result. To avoid this phenomenon, a two-step clustering method has been proposed.
First, the spatial clustering is proposed to divide the earthquake events into different spatial groups, and the clustering method, whose metric is based on the moment tensor (MT-based clustering method), is performed within each spatial group. It is because that the seismicity happening closely in space are probably induced by a similar stress environment. After performing the spatial clustering, the earthquake events in the same spatial group are probably induced by a similar stress environment. Then, an MT-based clustering method is performed within each spatial group to calculate the dominant moment tensor and confirm the local stress environment.
Hudson Graph was used to present the results of the two-step clustering method and the quality of the results was evaluated by box-plot. If the height of the box is minimal, that indicates the quality of the MT clustering result is good. Most of the box-plot showed a desirable quality of the MT clustering result, which indicates the successful results. That means the moment tensors in the same MT cluster are very similar, and the successful results also verify the assumption as supposed.
Applying this two-step clustering approach to mining activities allows for the speculation of locations and categories of possible accidents, providing beneficial recommendations for mining activities.
Data availability statement
The raw data supporting the conclusion of this article will be made available by the authors, without undue reservation.
Author contributions
ZJ: Conceptualization, Formal Analysis, Methodology, Software, Validation, Writing–original draft, Writing–review and editing. GZ: Funding acquisition, Project administration, Supervision, Writing–review and editing. PW: Validation, Writing–review and editing. XL: Visualization, Writing–review and editing. MJ: Project administration, Writing–review and editing. LL: Data curation, Visualization, Writing–review and editing. JM: Resources, Software, Writing–review 0and editing.
Funding
The author(s) declare financial support was received for the research, authorship, and/or publication of this article. This research was funded by the National Key Research and Development Program of China (2018YFC0604606).
Conflict of interest
Author XL was employed by Deep Min Lab Shandong Gold Grp Co. Ltd.
The remaining authors declare that the research was conducted in the absence of any commercial or financial relationships that could be construed as a potential conflict of interest.
Publisher’s note
All claims expressed in this article are solely those of the authors and do not necessarily represent those of their affiliated organizations, or those of the publisher, the editors and the reviewers. Any product that may be evaluated in this article, or claim that may be made by its manufacturer, is not guaranteed or endorsed by the publisher.
References
Akuhara, T., and Mochizuki, K. (2014). Application of cluster analysis based on waveform cross-correlation coefficients to data recorded by ocean-bottom seismometers: results from off the Kii Peninsula. Earth Planets and Space 66, 80. doi:10.1186/1880-5981-66-80
Cao, W., Durucan, S., Cai, W., Shi, J. Q., Korre, A., Ratouis, T., et al. (2023). Probabilistic evaluation of susceptibility to fluid injection-induced seismicity based on statistics of fracture criticality. Rock Mech. Rock Eng. 56 (10), 7003–7025. doi:10.1007/s00603-022-03084-3
Cesca, S., Sen, A. T., and Dahm, T. (2014). Seismicity monitoring by cluster analysis of moment tensors. Geophys. J. Int. 196 (3), 1813–1826. doi:10.1093/gji/ggt492
Chen, X., Wang, R., Huang, W., Jiang, Y., and Yin, C. (2018). Clustering-based stress inversion from focal mechanisms in microseismic monitoring of hydrofracturing. Geophys. J. Int. 215 (3), 1887–1899. doi:10.1093/gji/ggy388
Cheng, X., Qiao, W., Dou, L., He, H., Ju, W., Zhang, J., et al. (2023). In-situ stress field inversion and its impact on mining-induced seismicity. Geomatics Nat. Hazards Risk 14 (1), 176–195. doi:10.1080/19475705.2022.2158377
D'Alessandro, A., Mangano, G., D’Anna, G., and Luzio, D. (2013). Waveforms clustering and single-station location of microearthquake multiplets recorded in the northern Sicilian offshore region. Geophys. J. Int. 194 (3), 1789–1809. doi:10.1093/gji/ggt192
DiCaprio, C. J., Simons, M., Kenner, S. J., and Williams, C. A. (2008). Post-seismic reloading and temporal clustering on a single fault. Geophys. J. Int. 172 (2), 581–592. doi:10.1111/j.1365-246x.2007.03622.x
Ester, M., Kriegel, H., Sander, J., and Xu, X. (1996). “A density-based algorithm for discovering clusters in large spatial databases with noise,” in 2nd International Conference on Knowledge Discovery and Data Mining, 226–231.
Fan, Z., and Xu, X. (2019). Application and visualization of typical clustering algorithms in seismic data analysis. Procedia Comput. Sci. 151, 171–178. doi:10.1016/j.procs.2019.04.026
Gholizadeh, N., Saadatfar, H., and Hanafi, N. (2021). K-DBSCAN: an improved DBSCAN algorithm for big data. J. Supercomput. 77 (6), 6214–6235. doi:10.1007/s11227-020-03524-3
Guo, Z., Shi, Y., Huang, F., Fan, X., and Huang, J. (2021). Landslide susceptibility zonation method based on C5.0 decision tree and K-means cluster algorithms to improve the efficiency of risk management. Geosci. Front. 12 (6), 101249. doi:10.1016/j.gsf.2021.101249
Hammah, R. E., and Curran, J. H. (1999). On distance measures for the fuzzy K-means algorithm for joint data. Rock Mech. and Rock Eng. 32 (1), 1–27. doi:10.1007/s006030050041
Hudson, J. A., Pearce, R. G., and Rogers, R. M. (1989). Source type plot for inversion of the moment tensor. J. Geophys. Res. Solid Earth 94 (B1), 765–774. doi:10.1029/jb094ib01p00765
Igarashi, T., Matsuzawa, T., and Hasegawa, A. (2003). Repeating earthquakes and interplate aseismic slip in the northeastern Japan subduction zone. J. of Geophys. Research-Solid Earth 108 (B5). doi:10.1029/2002jb001920
Ji, B., Xie, F., Wang, X., He, S., and Song, D. (2020). Investigate contribution of multi-microseismic data to rockburst risk prediction using support vector machine with genetic algorithm. Ieee Access 8, 58817–58828. doi:10.1109/access.2020.2982366
Jimenez, R. (2008). Fuzzy spectral clustering for identification of rock discontinuity sets. Rock Mech. and Rock Eng. 41 (6), 929–939. doi:10.1007/s00603-007-0155-6
Kagan, Y. Y. (1991). 3-D rotation of double-couple earthquake sources. Geophys. J. Int. 106 (3), 709–716. doi:10.1111/j.1365-246x.1991.tb06343.x
Knopoff, L., and Randall, M. J. (1970). The compensated linear-vector dipole: a possible mechanism for deep earthquakes. J. Geophys. Res. 75 (26), 4957–4963. doi:10.1029/jb075i026p04957
Lasocki, S. (2014). Transformation to equivalent dimensions-a new methodology to study earthquake clustering. Geophys. J. Int. 197 (2), 1224–1235. doi:10.1093/gji/ggu062
Li, M., Bi, X., Wang, L., and Han, X. (2021). A method of two-stage clustering learning based on improved DBSCAN and density peak algorithm. Comput. Commun. 167, 75–84. doi:10.1016/j.comcom.2020.12.019
Li, Y., Wang, Q., Chen, J., Xu, L., and Song, S. (2015). K-Means algorithm based on particle swarm optimization for the identification of rock discontinuity sets. Rock Mech. and Rock Eng. 48 (1), 375–385. doi:10.1007/s00603-014-0569-x
Lurka, A. (2021). Spatio-temporal hierarchical cluster analysis of mining-induced seismicity in coal mines using Ward's minimum variance method. J. of Appl. Geophys., 184.
Matoza, R. S., Shearer, P. M., Lin, G., Wolfe, C. J., and Okubo, P. G. (2013). Systematic relocation of seismicity on Hawaii Island from 1992 to 2009 using waveform cross correlation and cluster analysis. J. of Geophys. Research-Solid Earth 118 (5), 2275–2288. doi:10.1002/jgrb.50189
Maurer, H., and Deichmann, N. (1995). Microearthquake cluster detection based on waveform similarities, with an application to the western Swiss Alps. Geophys. J. Int. 123 (2), 588–600. doi:10.1111/j.1365-246x.1995.tb06873.x
Mukhopadhyay, B., and Dasgupta, S. (2015). Earthquake swarms near eastern himalayan syntaxis along jiali fault in tibet: a seismotectonic appraisal. Geosci. Front. 6 (5), 715–722. doi:10.1016/j.gsf.2014.12.009
Ortega-Romo, A. D., and Chen, X. (2021). Spatiotemporal clustering of seismicity during the 2018 kilauea volcanic eruption. Geophys. Res. Lett. 48 (8). doi:10.1029/2020gl090859
Ouillon, G., and Sornette, D. (2011). Segmentation of fault networks determined from spatial clustering of earthquakes. J. of Geophys. Research-Solid Earth 116, B02306. doi:10.1029/2010jb007752
Petersen, G. M., Niemz, P., Cesca, S., Mouslopoulou, V., and Bocchini, G. M. (2021). Clusty, the waveform-based network similarity clustering toolbox: concept and application to image complex faulting offshore Zakynthos (Greece). Geophys. J. Int. 224 (3), 2044–2059. doi:10.1093/gji/ggaa568
Sainoki, A., Schwartzkopff, A. K., Jiang, L., and Mitri, H. (2023). Numerical modelling of spatially and temporally distributed on-fault induced seismicity: implication for seismic hazards. Int. J. Coal Sci. Technol. 10 (1), 4. doi:10.1007/s40789-022-00560-7
Shang, X., Li, X., Morales-Esteban, A., Asencio-Cortés, G., and Wang, Z. (2018). Data field-based K-means clustering for spatio-temporal seismicity analysis and hazard assessment. Remote Sens. 10 (3), 461. doi:10.3390/rs10030461
Shearer, P., Hauksson, E., and Lin, G. Q. (2005). Southern California hypocenter relocation with waveform cross-correlation, part 2: results using source-specific station terms and cluster analysis. Bull. of Seismol. Soc. of Am. 95 (3), 904–915. doi:10.1785/0120040168
Shearer, P. M. (2012). Space-time clustering of seismicity in California and the distance dependence of earthquake triggering. J. of Geophys. Research-Solid Earth 117. doi:10.1029/2012jb009471
Sun, J., and Li, Y. (2017). Joint inversion of multiple geophysical and petrophysical data using generalized fuzzy clustering algorithms. Geophys. J. Int. 208 (2), 1201–1216. doi:10.1093/gji/ggw442
Tape, W., and Tape, C. (2012). Angle between principal axis triples. Geophys. J. Int. 191 (2), 813–831. doi:10.1111/j.1365-246x.2012.05658.x
Tian, J., Chen, D., Liu, Z., and Sun, W. (2022). Microseismic dynamic response and multi-source warning during rockburst monitoring based on weight decision analysis. Int. J. Environ. Res. Public Health 19 (23), 15698. doi:10.3390/ijerph192315698
Vijay, R. K., and Nanda, S. J. (2019). A variable ε-DBSCAN algorithm for declustering earthquake catalogs. Singapore: Springer Singapore.
Wang, K., Ellsworth, W., and Beroza, G. C. (2020). Revisiting the timpson induced earthquake sequence: a system of two parallel faults. Geophys. Res. Lett. 47 (15). doi:10.1029/2020gl089192
Willemann, R. J. (1993). Cluster analysis of seismic moment tensor orientations. Geophys. J. Int. 115 (3), 617–634. doi:10.1111/j.1365-246x.1993.tb01484.x
Woodward, K., Wesseloo, J., and Potvin, Y. (2018). A spatially focused clustering methodology for mining seismicity. Eng. Geol. 232, 104–113. doi:10.1016/j.enggeo.2017.11.015
Wu, W. (2021). A review of unloading-induced fault instability. Undergr. Space 6 (5), 528–538. doi:10.1016/j.undsp.2020.11.001
Wu, Z., Cui, W., Weng, L., and Liu, Q. (2023). Modeling geothermal heat extraction-induced potential fault activation by developing an FDEM-based THM coupling scheme. Rock Mech. Rock Eng. 56 (5), 3279–3299. doi:10.1007/s00603-023-03218-1
Ye, Z., and Ghassemi, A. (2020). Heterogeneous fracture slip and aseismic-seismic transition in a triaxial injection test. Geophys. Res. Lett. 47 (14). doi:10.1029/2020gl087739
Yu, G., Guanwen, C., Lianchong, L., Chunan, T., Bo, R., and Yunchun, H. (2020). Preliminary study on high-energy and low-energy microfracture event evolution characteristics in the development process of rock failure. London, United Kingdom: Hindawi, 2020.
Zaliapin, I., and Ben-Zion, Y. (2016). A global classification and characterization of earthquake clusters. Geophys. J. Int. 207 (1), 608–634. doi:10.1093/gji/ggw300
Zhang, X., and Zhou, S. (2023). WOA-DBSCAN: application of whale optimization algorithm in DBSCAN parameter adaption. Ieee Access 11, 91861–91878. doi:10.1109/access.2023.3307412
Keywords: clustering methods, mining-induced seismicity, spatial clustering, moment tensor clustering, box-plot evaluation
Citation: Jian Z, Zhao G, Wang P, Liu X, Jiang M, Liu L and Ma J (2024) Identification of the mining accidents by a two-step clustering method for the mining-induced seismicity. Front. Earth Sci. 12:1348698. doi: 10.3389/feart.2024.1348698
Received: 03 December 2023; Accepted: 04 March 2024;
Published: 19 March 2024.
Edited by:
Tao Wen, Yangtze University, ChinaReviewed by:
Xianggang Cheng, China University of Mining and Technology, ChinaYaxiong Peng, Hunan University of Science and Technology, China
Tao Chen, Tsinghua University, China
Copyright © 2024 Jian, Zhao, Wang, Liu, Jiang, Liu and Ma. This is an open-access article distributed under the terms of the Creative Commons Attribution License (CC BY). The use, distribution or reproduction in other forums is permitted, provided the original author(s) and the copyright owner(s) are credited and that the original publication in this journal is cited, in accordance with accepted academic practice. No use, distribution or reproduction is permitted which does not comply with these terms.
*Correspondence: Ju Ma, bWFqdWNzdUBjc3UuZWR1LmNu