 Chuang Lei
 Lingjian Meng1*
- 1Research Institute of Petroleum Exploration and Development, PetroChina Jidong Oilfield Company, Tangshan, China
- 2College of Mining Engineering, North China University of Science and Technology, Tangshan, China
- 3XDEC Mud Logging Brach Company (Geological Research Institute), Karamy, China
Introduction: The Qinnan Depression in the Bohai Bay Basin is lowly explored, where hydrocarbon generation potential of source rocks is required detailed investigation to identify hydrocarbon exploration potential and direction.
Methods: This study is based on organic geochemical analysis performed on the Paleogene source rocks. After that, the burial, thermal maturity, and hydrocarbon generation histories of the Paleogene source rocks at various sags were reconstructed on BasinMod software based on reasonable geological models and geological parameters derived from geological analogy.
Results: Results show that the 3rd member (Es3) and 1st member (Es1) of the Eocene Shahejie Formation are high-quality source rocks with a mixture of type I and II kerogen, whose organic matter was originated from aquatic organisms under a reducing environment. The 3rd member (Ed3) of the Oligocene Dongying Formation are fair-quality source rocks with type II kerogen and are dominated by mixed organic matter depositing in a weakly reducing environment. Clear differences in hydrocarbon generation were observed in these three source rocks owing to differential subsidence and sedimentation among the Eastern, Southeastern, and Western sags. Source rocks at the Eastern Sag were maturated early and lasted for a long time, which were currently at late mature (1.0–1.3%Ro) to high mature (1.3–2.0%Ro) stages. Two hydrocarbon generation events occurred in the Oligocene and Miocene, respectively, with intensive hydrocarbon generation capacity. Source rocks at the Southeastern Sag were maturated late and lasted for a short period, which were currently at a medium mature (0.7–1.0%Ro) stage. The major hydrocarbon generation event had occurred since the late Miocene, with intensive hydrocarbon generation capacity. Source rocks at the Western Sag were at an early mature (0.5–0.7%Ro) stage and began to generate hydrocarbon in the Pliocene, with weak hydrocarbon generation capacity. The hydrocarbon generation capacity of the Paleogene source rocks is as follows: Es3>Es1>Ed3.
Discussion: The Qinnan Depression has high oil and gas exploration potential, where exploration activities should focus on effective traps around depression and slope zones located at the Eastern and Southeastern sags.
1 Introduction
The exploration activities at petroliferous basins in China were developed after oil and gas survey in the 1960s and 1970s. After decades of development, oil and gas discovery varies greatly among different basins or depressions. Previous oil and gas exploration activities were performed at basins with good hydrocarbon accumulation conditions, which is currently limited by insufficient oil and gas reserve. As a result, low-exploration areas have been attracting increasing attention. The evaluation of source rocks is a key issue of early exploration in these areas. Numerous investigations show that the burial, thermal maturity, and hydrocarbon generation histories of source rocks are closely correlated with hydrocarbon accumulation, which is of great significance to fully understand exploration potential and direction at low-exploration areas (Makeen et al., 2016; Hadad et al., 2017; Hakimi et al., 2018; Hu et al., 2020; Gawad et al., 2021; Khaled et al., 2022; Gelman, 2023).
Oil and gas exploration of the Qinnan Depression in the Bohai Sea began in the 1976. Although 2D and 3D seismic explorations have been performed at the early stage, it is currently lowly explored and poorly understood with only 22 drillings in the slope zone. QHD29-2\2E oil-gas field with nearly 100 million tons of oil and gas (proven crude oil reserves of 6,550 × 104 m3, natural gas reserves of 180 × 108 m3) was discovered in the southeastern slope of the Qinnan Depression during 2009–2013, showing good exploration prospects. After that, several structural traps have been drilled around slopes at the south and north, with unsatisfied exploration results. The reasons for the failure can be summarized as follows: (1) Structural traps are not on oil and gas migration path, and (2) Poor understanding of hydrocarbon generation potential of the Paleogene source rocks in nearby sags misled the exploration direction. Therefore, it is essential to investigate hydrocarbon generation potential of source rocks in the Qinnan Depression. It is composed of three sags with different size, i.e., the Eastern Sag, Southeastern Sag, and Western Sag. Typical seismic responses such as strong amplitude, high continuity, and parallel reflection can be observed from source rocks on seismic profiles. The Qinnan Depression had experienced complex tectonic evolution in geological history, resulting in differential subsidence, sedimentation, and hydrocarbon generation potential of the Paleogene source rocks among the Eastern, Southeastern, and Western sags. Nevertheless, there are little or no published works on the geochemical and hydrocarbon generation characteristics of the Paleogene source rocks, and their differences among these three sags.
This study focuses on the evaluation of organic matter richness, type, thermal maturity, and deposition environment of the Paleogene source rocks in the Qinnan Depression through investigating their geochemical characteristics. In addition, geological analogy method was employed in this study, and the burial, thermal maturity, and hydrocarbon generation histories of the Paleogene source rocks were reconstructed on BasinMod software with reasonable geological models and parameters to understand hydrocarbon generation capacity and process at different sags, so as to provide insight into oil and gas exploration in the Qinnan Depression.
2 Geological and stratigraphical settings
The Bohai Bay Basin is an important petroliferous basin in the eastern China and has an area of approximately 18 × 104 km2 (Figure 1A). This basin developed as a back-arc basin during the Mesozoic and evolved into an intracratonic rift basin during the Cenozoic (Allen et al., 1997; Huang and Pearson, 1999), with a complex geological history. The Qinnan Depression, a secondary structure unit in the Bohai Bay Basin, is nearly EW extended and bounded by the Liaoxi, Shijiutuo, Matouying, Qinnan, and Liushouying uplifts (Figure 1B). It is approximately 2,300 km2 and is composed of the Eastern, Southeast, and Western sags. The Eastern Sag is the largest one with sedimentary thickness >8,500 m, followed by the Southeast Sag with sedimentary thickness >5,800 m. The Western Sag is the smallest one with thickness >5,500 m. Controlled by the Qinnan fault I and II, the Eastern and Southeastern sags are presented in dustpan-like patterns with faulting in the south and overtopping in the north. The West Sag is presented in a dustpan-like pattern with faulting in the north and overtopping in the south. The Mesozoic and Cenozoic strata were deposited on the Archean granite basement in the Qinnan Depression. The Mesozoic was filled by the Jurassic and Cretaceous sediments. The Cenozoic was well developed and divided into six stratigraphic intervals from bottom to top: the Paleogene Kongdian (Ek), Shahejie (Es), and Dongying (Ed) formations; Neogene Guantao (Ng) and Minghuazhen (Nm) formations; and Quaternary Pingyuan (Qp) Formation (Figure 2). Specifically, the Es can be subdivided into four intervals including Es4, Es3, Es2, Es1 and the Ed can be subdivided into three intervals including Ed3, Ed2, Ed1.
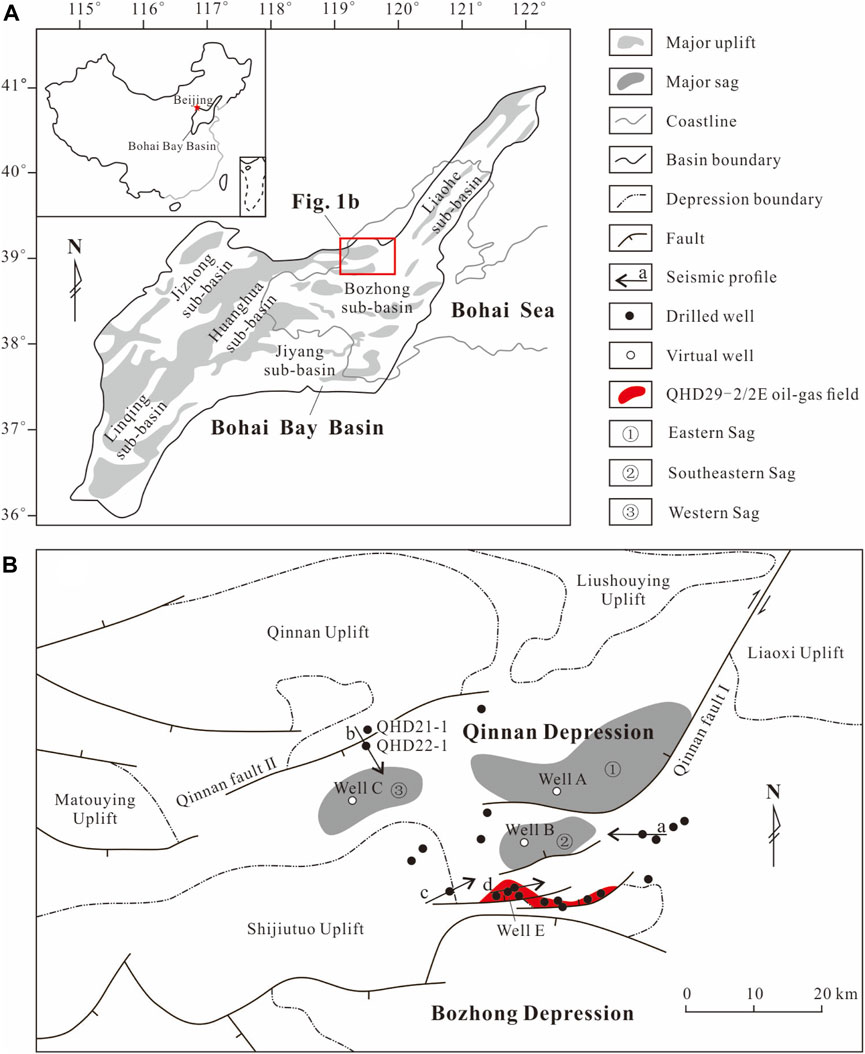
Figure 1. Location (A), tectonic units (B) of the Qinnan Depression and its adjacent area.
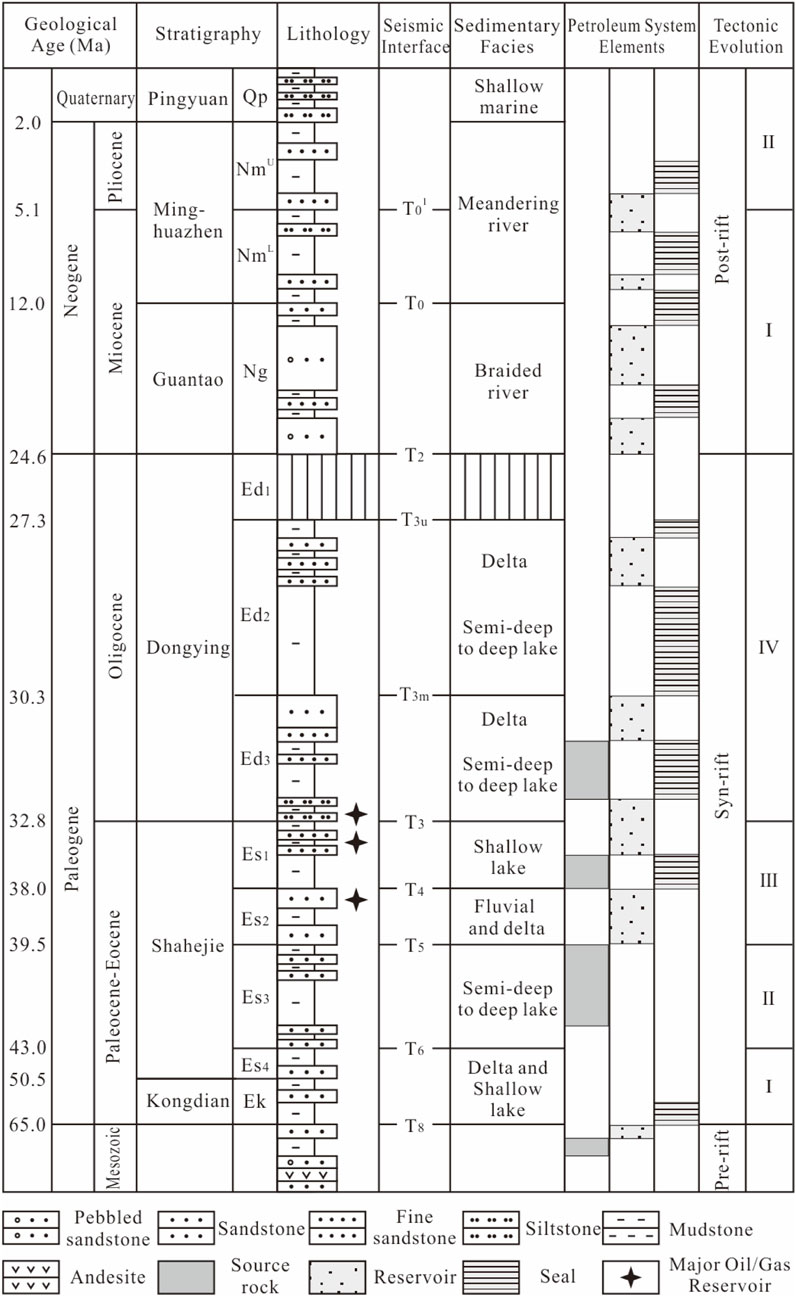
Figure 2. Generalized stratigraphic column of the Qinnan Depression (modified after Xu et al., 2018).
The Qinnan Depression successively experienced two stages of tectonic evolution: syn-rift in the Paleogene and post-rift since the Neogene (Qiu et al., 2015; Xu et al., 2018). The former can be further divided into phase I, II, III, and IV, and the latter can be further divided into phase I and II, based on tectonic intensities. Three potential source rocks, from bottom to top including the Es3, Es1, Ed3, were primarily deposited at the syn-rift stage (Shi et al., 2014). Previous investigations have shown that the Es3 was dominated by semi-deep/deep lake deposits with a mudstone thickness of 300–600 m (Liu, 2014). Fan delta and braided-river delta sediments identified in the Es1 were primarily developed at the steep slope and gentle slope zones in the Qinnan Depression, respectively. Small-scale semi-deep/deep lake deposits of the Es1 were only developed at the depression zone with a mudstone thickness of 50–200 m. The Ed3 was dominated by semi-deep/deep deposits with a mudstone thickness of 150–400 m. The new resource assessment reveals that the total hydrocarbon generation of the Paleogene source rocks in the Qinnan Depression is 70×108 t of oil equivalent.
3 Dataset and methodology
3.1 Geochemical analysis procedure
Thirty-six mudstone samples from the Es3, Es1, Ed3 were collected from Well E (well location shown in Figure 1B) at a depth of 2,960–3,860 m. The measured vitrinite reflectance (Ro) values of these samples are between 0.54% and 0.85%. All samples were crushed into fine powders using an agate mortar to <200 mesh. After that, these samples were pyrolyzed using a Rock-Eval instrument equipped with total organic carbon (TOC) measurement function.
Seventeen samples with high TOC content were chosen for further gas chromatography (GC) and gas chromatography/mass spectrometry (GC/MS) measurements. Chosen samples were extracted using chloroform solution to obtain the rock extraction. The rock extraction was separated into aliphatic, aromatic, and NSO compounds by column chromatography. Whereafter, aliphatic fraction was conducted for GC and GC/MS measurements using an Agilent 7,890 instrument (a PONA fused silica column, 60 m × 0.25 mm i.d., film thickness 0.25 μm) and an Agilent 7890A-GC/5975C-MS instrument coupled with a HP-5MS fused silica column (30 m × 0.25 mm i.d., film thickness 0.25 μm), respectively. Refer to Dong et al. (2015) for details of the operation process.
3.2 Basin modeling procedure
Basin modeling is an important approach to understand hydrocarbon generation of source rocks in petroliferous basins (Abu-Ali and Littke, 2006; Shalaby et al., 2011; Hadad et al., 2017; Jumat et al., 2018). Three virtual wells in the depression zones of the Eastern (Well A), Southeast (Well B), and Western (Well C) sags were selected to simulate the burial, thermal maturity, and hydrocarbon generation histories based on BasinMod software. For a low-exploration area with minor measured geological data, reasonably selecting geological parameters is the key to give accurate and reliable modeling results.
3.2.1 Seismic facies analysis
Geological analogy is a basic method of geological research and is applicable to any exploration stage and condition in petroliferous basins. Sufficient geological data can be obtained from 22 drillings in the slope zone, whereas no data can be acquired in the depression zone because of no drilling. The Qinnan Depression is fully covered by high-quality 3D seismic data, which can complement the sporadic well control. Therefore, geological analogy method was used to compare seismic facies/sedimentary facies and geological conditions (Cao et al., 2009). After that, the high-exploration slope zone was employed as reference to determine geological conditions of the low-exploration depression zone. Seismic facies are responded to sedimentary or geological bodies on a seismic profile bounded by specific seismic reflection parameters, e.g., internal reflection structure, external geometry, and amplitude, frequency, and continuity of seismic reflection axis (Sangree and Widmier, 1979; Roksandic, 2010). In general, similar seismic/sedimentary facies in a deposition unit are responded to similar geological conditions. The relationship between seismic and sedimentary facies of the Paleogene and their spatial distributions in the Qinnan Depression have been described systematically to support geological analogy. As published by Liu (2014), seismic facies in the steep slope zone were characterized by medium-weak amplitude, low continuity, and chaotic reflection structure (Figure 3A), representing fan delta facies. The gentle slope zone was dominated by medium amplitude, medium continuity, progradation or chaotic reflection (Figure 3B), corresponding to braided river delta facies. Seismic facies in the depression zone were characterized by strong amplitude, high continuity, and parallel reflection (indicating semi-deep/deep lake facies, Figure 3C), and medium amplitude, medium and high continuity, and subparallel to parallel reflection (indicating shore shallow lake facies, Figure 3D). In addition, the seismic facies of the Neogene were mainly variable amplitude, low continuity, and chaotic or subparallel to parallel reflection, representing braided river sediments of the Ng or meandering river sediments of the Nm. These identified seismic or sedimentary facies could be tracked and compared between the slope and depression zones. Hence, several geological parameters for the virtual wells (A, B, C) in the depression zone can refer to those in the slope zone.
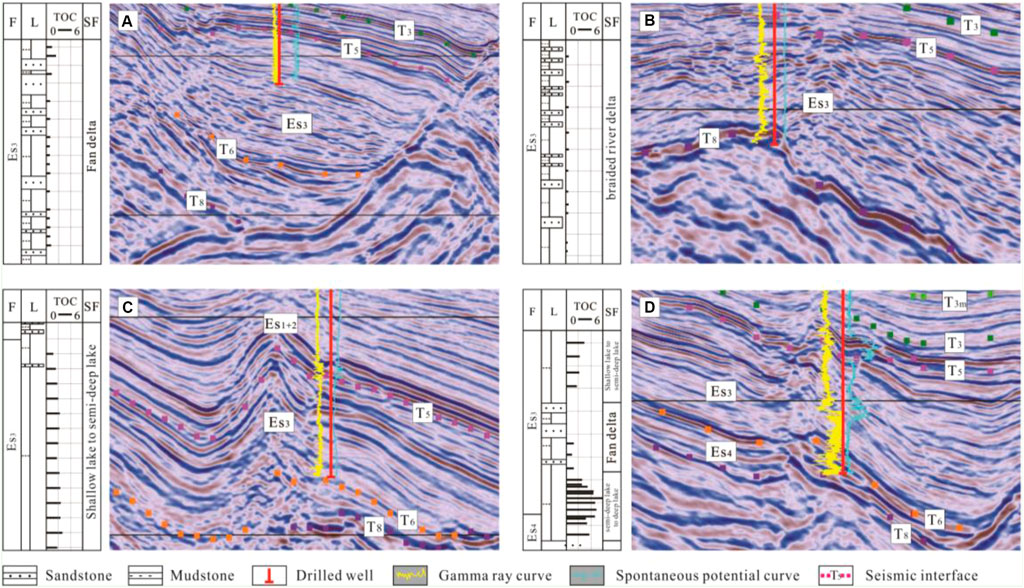
Figure 3. Seismic reflection characteristics of fan delta (A), braided river delta (B), semi-deep/deep lake (C), and shore shallow lake (D) facies of Es3 Formation in the Qinnan Depression.
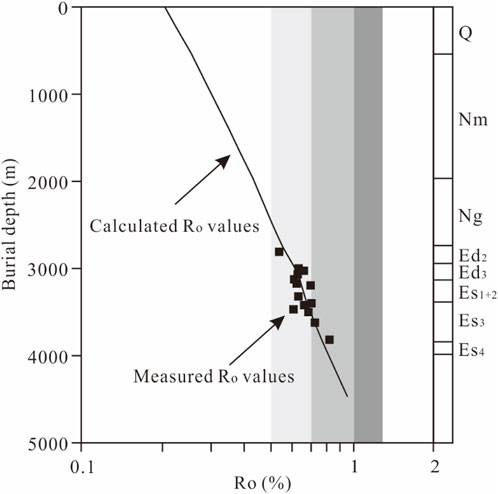
Figure 4. Calibration of measured and calculated vitrinite reflectance (Ro) of Well E in the Qinnan Depression.
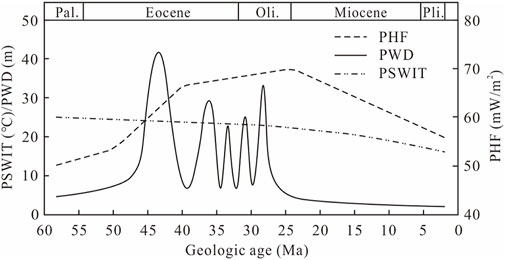
Figure 5. The variation curves of palaeo-heat flow, palaeo-water depth, and palaeo-sedimentary water interface temperature in the Qinnan Depression.
3.2.2 Petroleum system models
The stratigraphic horizon, deposition age, and erosion age involved in the model construction are presented in Table 1. The horizon thickness and the top and bottom depths were calculated based on time-depth conversion interpreted from seismic profiles. Reasonable geological parameters such as lithology, erosion thickness, source rock properties, and thermal boundary conditions in the geological model determine the accuracy of the simulation at low-exploration areas (Hakimi and Abdullah, 2015). In this study, geological parameters in the geological model were determined as follows based on geological characteristics of the Qinnan Depression and relationship between seismic/sedimentary facies and geological conditions.
(1) Lithology. The lithology of various sedimentary facies from more than 20 drilled wells in the slope zone was used to define that of virtual wells in the depression zone (Table 2). In terms of certain stratum, the distribution of regional sedimentary facies was referenced to specify lithology parameters along provenance direction based on the difference method, and assume lithology parameters perpendicular to provenance direction based on the approximation method.
(2)Erosion thickness. The Qinnan Depression had experienced three tectonic uplifts since the Cenozoic, which occurred at the end of the Es4, Es3, Ed1, respectively (Cai et al., 2019). Three angular unconformities such as T6, T5, T2 can be observed from seismic profiles. Several seismic profiles were selected to determine erosion thickness of these three unconformities via seismic stratigraphic trend extension method, since no geological and geochemical data. Refer to Wang et al. (2022) for the detailed operation process. Results show that the erosion thickness of the T6, T5, T2 are 120–300 m, 200–380 m, 200–600 m, respectively.
(3) Source rocks properties. It mainly includes total organic carbon (TOC), hydrogen index (HI), and kerogen type. Similarly, geochemical data from more than 20 drilled wells in the slope zone was used to define source rock properties of virtual wells in the depression zone. As shown in Table 2, the mudstones of the Es3 and Es1 are high in TOC content with a mixed Type I and Type II kerogen composition, followed by the Ed3 (TOC = 0.65–1.47%), and the Ed2 and Ed1 are low in TOC content with Type III kerogen composition. In terms of sedimentary facies, semi-deep/deep lake facies are high in total organic carbon content (TOC = 1.47–2.94%), followed by shore shallow lake facies (TOC=0.95–1.92%), while delta front facies are low in total organic carbon content (TOC = 0.48–0.65%). As mentioned above, the Paleogene sediments in the depression zone was dominated by semi-deep/deep lake and shore shallow lake facies. Therefore, geochemical attributes of source rocks horizons such as the Es3, Es1, Ed3 were assumed based on semi-deep to deep lake deposits, and those of non-source-rock horizons such as the Ed2 and Ed1 were given based on shore-shallow lake deposits. It is noteworthy that the Neogene and Quaternary have shallow burial and low organic matter abundance, which can exert minor impact on hydrocarbon supply in the Qinnan Depression, and thereby, their source rock properties are ignored in geological model.
(4) Thermal boundary conditions. It mainly includes paleo-heat flow (PHF), paleo-water depth (PWD), and paleo-sedimentary water interface temperature (PSWIT) (Perkins et al., 2023). The paleo-heat flow is the most important parameter affecting modeled thermal, maturity, and hydrocarbon generation histories (Johnsson et al., 1993; Yu et al., 2020). The paleo-heat flow in the study area was reconstructed as follows. Firstly, the current heat flow value referred to the measured current heat flow value in the Qinnan Depression, with a value of 56.0 mW/m2 (Wang et al., 2002). Secondly, Instantaneous Uniform Extension Model proposed by McKenzie (1978) was used to assess paleo-heat flow value in different geological history based on the tectonic evolution of the study area. This model emphasizes that paleo-heat flow only depends on stretching amount of the sedimentary basin, and a high value occurred in the syn-rift period but a low value in the post-rift period. After that, the simulated paleo-heat flow value was adjusted repeatedly until the calculated Ro values matching well with the measured values (Figure 4). The results show that the Qinnan Depression had experienced two paleo-heat flow stages (Figure 5), i.e., the continuous increasing in the syn-rift period and the gradual decreasing in the post-rift period. The highest heat flow value occurred at the end of the Oligocene, with a value of 70.0 mW/m2. Paleo-water depths of different geological history were estimated based on sedimentary facies. It is generally believed that the corresponding water depths of alluvial-fluvial, offshore lake, shallow lake, and semi-deep to deep lake facies are <2 m, 2–5 m, 5–20 m, and 20–100 m, respectively. As published by Xu et al. (2018), the Qinnan Depression was at lacustrine and fluvial environments during the Paleogene and Neogene, respectively, with paleo-water depth of 5–40 m and 0–2 m (Figure 5). The paleo-water interface temperature was determined based on current geographical location (39 ° N, East Asia in the Northern Hemisphere) and global unified water interface temperature variation curves established by Wygrala (1989), ranging from 16°C to 24°C (Figure 5).
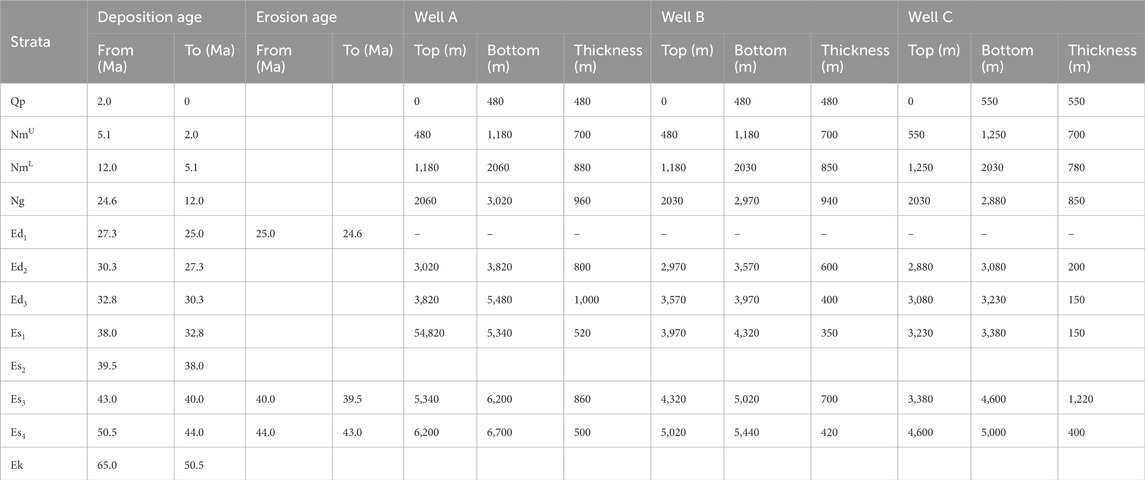
Table 1. Depositional and erosional events used in geological model.
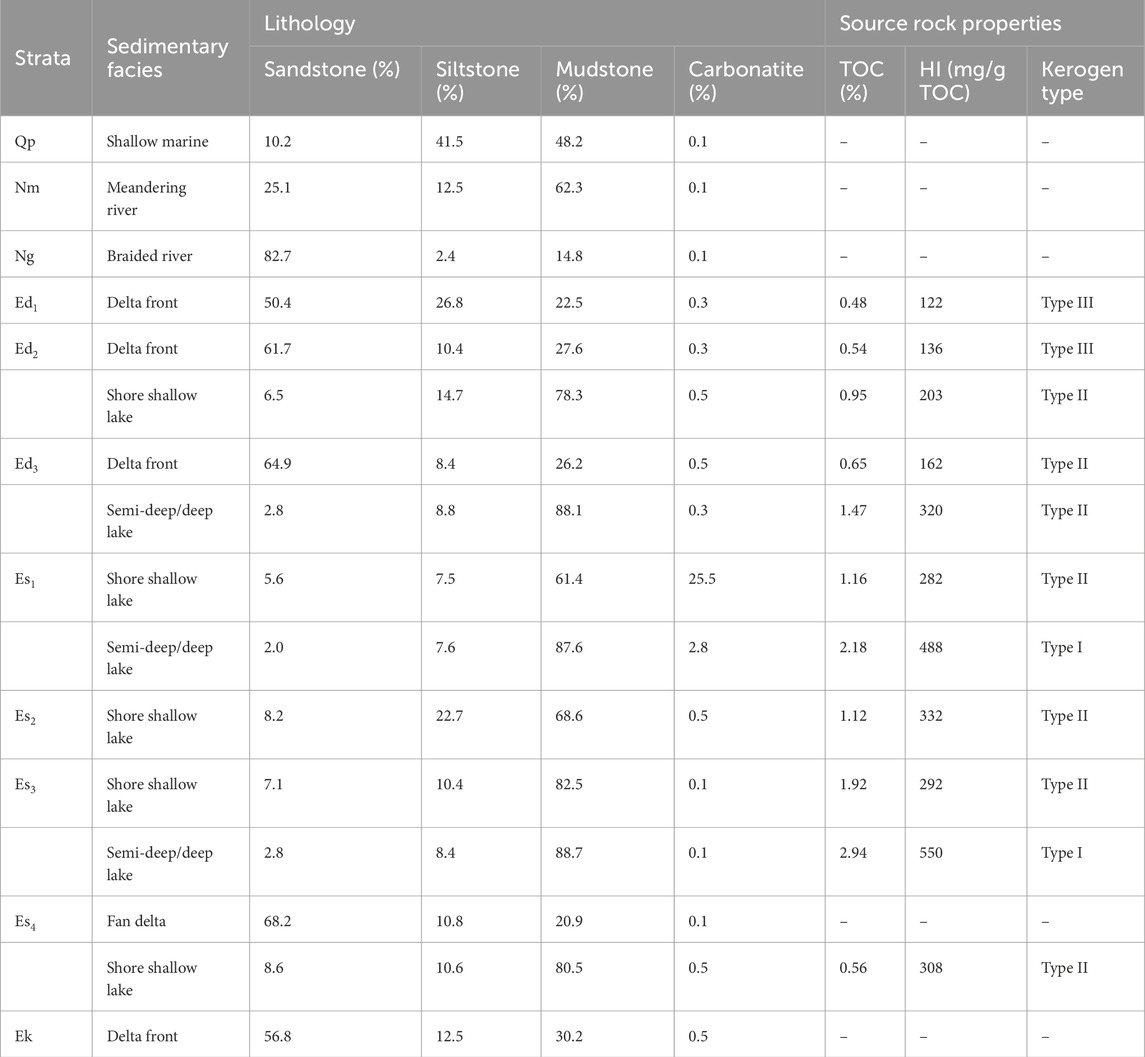
Table 2. Lithology and source rock properties of various sedimentary facies used in geological model.
In addition, reciprocal compaction model was employed for burial history simulation, steady-state constant heat flux model was used for thermal history simulation, and EASY% Ro chemical kinetic model was used to simulate maturity history. The vitrinite reflectance (Ro) calculated by this model was varied between 0.3% and 4.5%, which could be used for most sedimentary basins. The NULL kerogen kinetic model was used to simulate hydrocarbon generation history, where hydrocarbon generation potential varied with kerogen type as follows: type I > type II > type III. Refer to Braun and Burnham (1987), Falvey and Middleton (1981), Sweeney and Burnham (1990) for the mathematical formulas involved in geological model.
4 Results
4.1 Geochemistry of the source rocks
4.1.1 Bulk compositions
The abundance, type, and thermal maturity of organic matter are important indicators of the quality of source rocks (Peters, 1986). A total of 36 pyrolysis data from Well E (Figure 6) in the slope zone shows that the Es3 are 0.83%–2.94% in TOC, with an average of 1.96%, and are 2.86–14.19 mg/g in S1+S2, with an average of 8.68 mg/g, suggesting high-quality source rocks. TOC of the Es1 vary between 1.16% and 2.42% (average 1.62%), and S1+S2 vary between 3.04 and 13.11 mg/g (average 7.06 mg/g), indicating fair-quality source rocks. The Ed3 are 1.17%–1.81% in TOC (average 1.35%), and 3.36–7.54 mg/g in S1+S2 (average 4.35 mg/g), suggesting fair-quality source rocks. In general, hydrogen index (HI)> 400 mg/g TOC represents oil-prone kerogen (type I), 150–400 mg/g TOC is oil-gas kerogen (type II), and 50–150 mg/g TOC is gas-prone kerogen (type III). The HI values of these three source rocks in the Qinnan Depression are 252–598 mg/g TOC, 207–520 mg/g TOC, and 265–393 mg/g TOC, respectively. It implies that the Es3 and Es1 source rocks are dominated by a mixture of type I and II kerogen, and the Ed3 source rocks are dominated by type II kerogen. The Tmax values in all analyzed samples vary in a range of 432°C–443°C. It means that the thermal maturity of the analyzed samples ranges from just pre-oil window to mid-oil window thermogenic conditions for hydrocarbon generation (Peters, 1986). These source rocks are not the best-quality ones, since they are in the slope zone close to the provenance, rather than in the center of sedimentation and subsidence. It can be inferred that large-scale source rocks in the depression zone with semi-deep/deep lake facies are the best-quality ones.
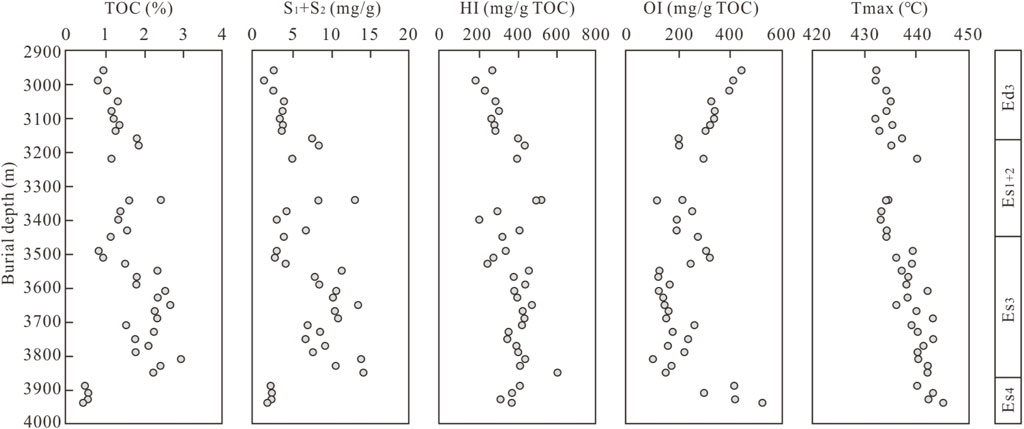
Figure 6. Comprehensive geochemical log of the Paleogene source rocks of Well E in the Qinnan Depression.
4.1.2 n-alkanes and isoprenoids
The identified n-alkanes in all analyzed samples are dominated by C12–C35 (Figure 7). The distribution pattern of n-alkanes is a good indicator of organic matter source (Sachsenhorfer et al., 2017). For immature to low mature samples, low-carbon number components (<nC20) are dominant in n-alkanes from planktonic algae and microorganisms, and high-carbon number components (>nC25) are dominant in n-alkanes from terrestrial higher plants (Volkman et al., 1990). The carbon number of n-alkanes in all analyzed samples are distributed in unimodal pattern with low and high carbon number is similar (represented by moderate C21−/C22+ ratios, Table 3), indicating that organic matter was sourced from both aquatic organisms and terrestrial higher plants. Furthermore, the analyzed samples have high CPI and OEP values of 1.16–2.23 and 1.18–1.69 (Table 3), suggesting immature to low-mature organic matter.
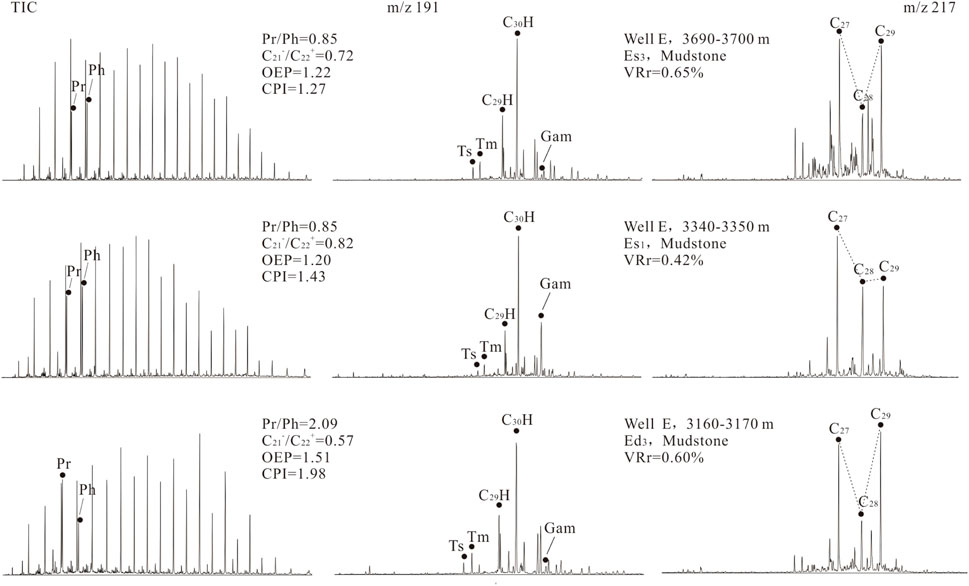
Figure 7. M/z 191 and m/z 217 mass chromatograms of saturate hydrocarbon for the Es3, Es1, Ed3 samples in the Qinnan Depression.
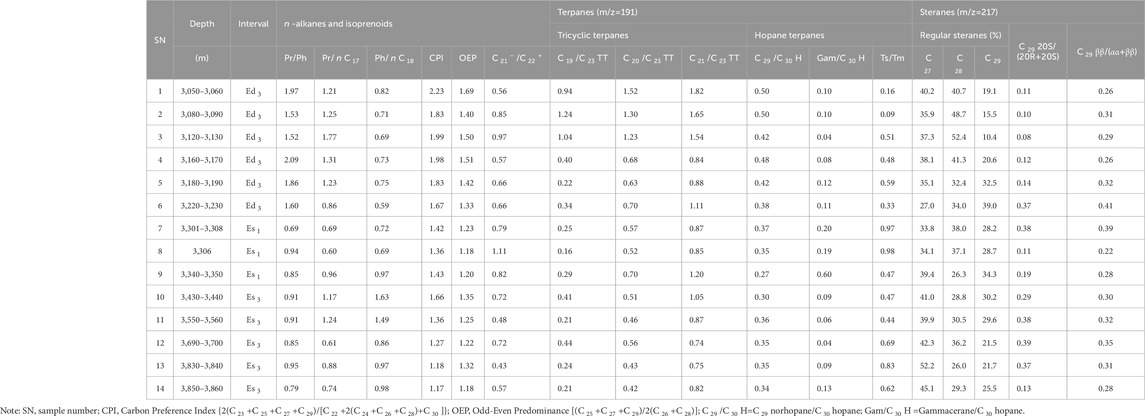
Table 3. Biomarker compound parameters for the Es 3, Es 1, Ed 3 samples in the Qinnan Depression.
Pristane (Pr) and phytane (Ph) are commonly employed to investigate deposition environment (Chandra et al., 1994; Lei et al., 2021). This is achieved by Pr/Ph values, e.g., <1.0 indicates a reducing condition, 1.0–3.0 suggests a weakly reducing condition, and >3.0 represents an oxidizing condition (Didyk et al., 1978). The influence of thermal maturity on Pr/Ph values could be excluded, since all analyzed samples are immature and low-mature. Considerable Pr and Ph appear in all samples, which are higher than adjacent normal alkanes with both Pr/nC17 and Ph/nC18 values greater than 1.0 (Table 3). In addition, the concentrations of Pr in the Es3, Es1, Ed3 samples are much higher than Ph, with Pr/Ph values in the range of 0.79–0.95, 0.69–0.94, 1.52–2.09, respectively. The low Pr/Ph values indicate that the Es3 and Es1 sediments were deposited under more reducing conditions compared to the Ed3 sediments. This is consistent with the deposition environment as indicated by the crossplot of Pr/nC17 and Ph/nC18 ratios (Figure 8A).
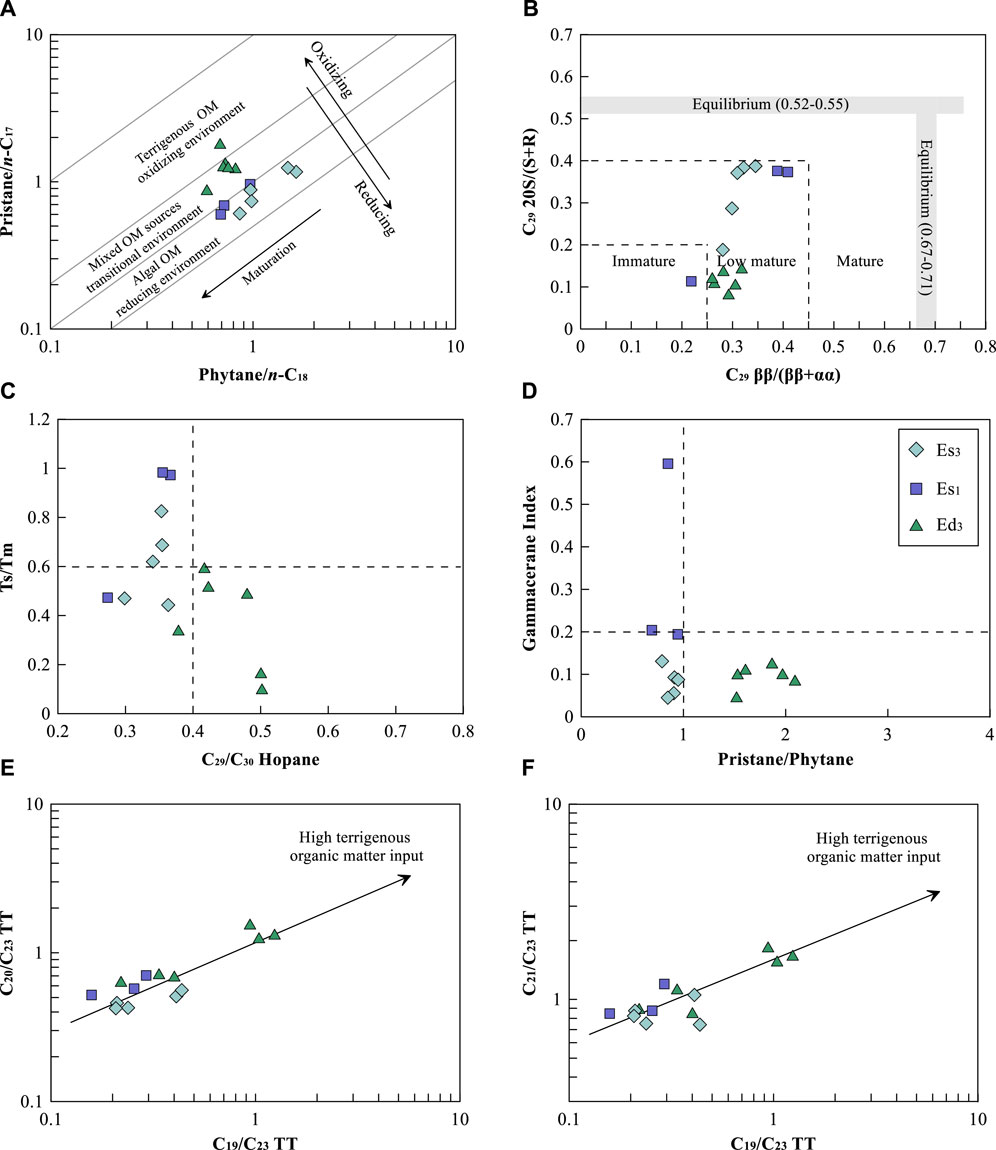
Figure 8. Correlation between various biomarker parameters for the Es3, Es1, Ed3 samples in the Qinnan Depression, displaying original organic matter input (A), thermal maturity (B), and deposition environment (C−F).
4.1.3 Steroids
Considerable steranes, diasteranes, and pregnanes can be detected from m/z 217 mass chromatograms (Figure 7). The relative concentrations of the C27-C29 regular steranes are commonly used to illustrate organic matter origin, e.g., C27 regular steranes are primarily derived from aquatic organism, C28 regular steranes are sourced from chlorophyll-c containing phytoplankton, and C29 regular steranes are primarily originated from terrestrial higher plant (Volkman, 1986; Peters et al., 2005). The relative concentrations of the C27-C29 regular steranes in the Es3 and Es1 samples range from 39.9% to 52.2%, 21.5%–30.1%, 26.2%–36.2% and 33.8%–39.4%, 28.1%–34.3%, 26.3%–38.0%, indicating considerable aquatic organic matter input. A similar phenomenon was observed in the lacustrine organic-matter-rich mudstone of the Upper Cretaceous Qingshankou Formation in the Songliao Basin and the Triassic Chang 7 Member in the Ordos Basin (Dong et al., 2015; Li et al., 2022; Zhang et al., 2021). The relative concentrations of the C27 and C29 regular steranes in the Ed3 samples are in a range of 26.9%–40.2% and 32.4%–52.3%, respectively. Typical “V” shape appearing in the Ed3 samples indicates that organic matter was sourced from both aquatic organisms and terrestrial higher plants.
The isomerization of sterane is primarily influenced by thermal maturity. Previous studies have shown that increasing thermal maturity can convert unstable “R” shape of sterane into stable “S” shape and transform unstable αα configuration to stable ββ configuration (Hanson et al., 2000). Hence, the C29 sterane 20S/(S+R) and C29 sterane ββ/(ββ+αα) will increase with increasing thermal maturity, with suggested thermodynamic equilibrium mixture at 0.52–0.55 and 0.67–0.71, respectively. The steranes in all analyzed samples had been weakly isomerized with these two ratios less than 0.38 and 0.41 (Figure 8B), suggesting that organic matter is present in immature to low-mature stage. This is consistent with interpreted thermal maturity from measured CPI, OEP, and Ro values.
4.1.4 Terpenoids
Terpanes, such as C27-18a(H)-tris-norneohopane (Ts), C27-17a(H)-tris-norhopane (Tm), C29 norhopane, C30 hopane, C31-C35 homohopane, gammacerane, C19-C26 tricyclic terpane, and C24 tetracyclic terpane, can be detected from m/z 191 GC/MS (Figure 7). The concentrations of C30 hopane are greater than that of C29 norhopane in the analyzed samples, with the ratios of C29/C30 hopane of 0.29–0.36, 0.27–0.36, 0.38–0.50, respectively (Figure 8C). Ts and Tm vary as a function of lithology, kerogen type, and thermal maturity (Moldowan et al., 1985). The analyzed samples are lower in Ts content compared with Tm content, with the ratios of Ts/Tm less than 1.0 (Figure 8D).
Gammacerane is believed to form by reduction of tetrahymanol (Damsté et al., 1995). The principal source of tetrahymanol appears to be bacterivorous ciliates, which presented in the interface between anoxic and oxic zones in a stratified water column (Ten Haven et al., 1989; Sepúlveda et al., 2009; Yuan et al., 2017). Therefore, abundant gammacerane in sediments suggests the presence of water column stratification. This compound was observed in all analyzed samples (Figure 7). Gammacerane indexs vary between 0.05 and 0.13 for the Es3 samples, increase to relatively high values (0.19–0.59) for the Es1 samples, and then decrease to relatively low values (0.04–0.12) for the Ed3 samples. Salinity is the most important mechanism of water stratification. (Hermansyah et al., 2017; Skudra and Lips, 2017). As published by Zheng et al. (2022), the 4th member of the Eocene Shahejie Formation in the Dongpu Depression formed in relatively stable hypersaline lake conditions has a high Gammacerane index >0.6. Therefore, freshwater lakes dominated during the deposition of the Es3 and Ed3, whereas saline lakes dominated during the deposition of the Es1.
Tricyclic terpanes such as C19, C20, C21 are important biomarkers representing terrestrial organic matter input (Hao et al., 2011). These compounds appeared in small proportions in all analyzed samples (Figure 7). High C19/C23 tricyclic terpane (C19/C23TT), C20/C23 tricyclic terpane (C20/C23TT), and C21/C23 tricyclic terpane (C21/C23TT) ratios suggest more contribution from terrigenous organic matter (Adegoke et al., 2015). As expected, the analyzed samples are characterized by low C19/C23TT, C20/C23TT, C21/C23TT ratios (Figures 8E, F), e.g., values in the Es3 and Es1 samples vary from 0.21 to 0.44, 0.42–0.56, 0.74–1.05 and 0.16–0.29, 0.52–0.70, 0.84–1.19, respectively, and values in the Ed3 samples range from 0.22 to 1.24, 0.62–1.52, 0.84–1.82. Such a biomarker combination indicates minor contributions from terrestrial organic matter, especially in the Es3 and Es1 sediments. This matches with the conclusions from relative concentrations of the C27-C29 regular steranes.
4.2 Basin modeling of the source rocks
4.2.1 Burial history modeling
The Qinnan Depression had experienced two subsidence stages, including rapid burial at syn-rift stage and slow burial at post-rift stage, both of which were characterized by clear episodic subsidence and episodic sedimentation (Figure 9). The Paleocene to Early Eocene was at the initial rifting stage (syn-rift phase I) with weak faulting. The tectonic subsidence rate was 25–35 m/Ma and sedimentation rate was 40–58 m/Ma, depositing the Ek and Es4 with thickness of 600–800 m. After that, these strata were eroded due to tectonic uplift associated with the Himalayan movement (Act I), with erosion thickness of 120–300 m. The middle Eocene was at the intensive rifting stage (syn-rift phase II) with tectonic subsidence rates of the Eastern, Southeast, and Western sags higher than 350 m/Ma and sedimentation rate greater than 700 m/Ma, providing considerable accommodation for the development of high-quality source rocks. Therefore, the Es3 deposited in this period had the highest in organic-matter-rich mudstone thickness (up to 300 m) as well as total organic carbon content (up to 3.0%). After that, tectonic uplift occurred again to erode strata, with erosion thickness of 200–380 m. The late Eocene was at the weak rifting stage (syn-rift phase III) with tectonic subsidence rate lower than 80 m/Ma and sedimentation rate less than 120 m/Ma. Insufficient accommodation space decreased the thicknesses of the Es2 and Es1, ranging from 150 m to 500 m. The Oligocene entered the transition stage from syn-rift to post-rift (syn-rift phase IV), where the faulting was strengthened again. Strong activity of the Qinnan fault I and weak activity of the Qinnan fault II resulted in high subsidence rate at the Eastern Sag with value of 180 m/Ma and low rate at the Western Sag with value of 55 m/Ma. As a result, the Ed deposited in this period was thick in the East and thin in the West. The tectonic uplift occurred again due to the Himalayan movement (Act II) at the end of the Oligocene, eroding the Ed with erosion thickness of 200–600 m. The Miocene was at the thermal subsidence stage (post-rift phase I), where tectonic subsidence rate and sedimentation rate was decreased to 35 m/Ma and 80 m/Ma, respectively. The “carpet-like” sedimentation resulted in widely distributed deposits with the thickness of 1,180 m. Subsidence was accelerated by the Neotectonics since the Pliocene (post-rift phase II). The tectonic subsidence rate and sedimentation rate was increased to 80 m/Ma and 180 m/Ma, respectively, where “carpet-like” sedimentation also occurred with deposition thickness of 1,800 m. The current burial depth of each horizon was the maximum one in geological history (Figure 9).
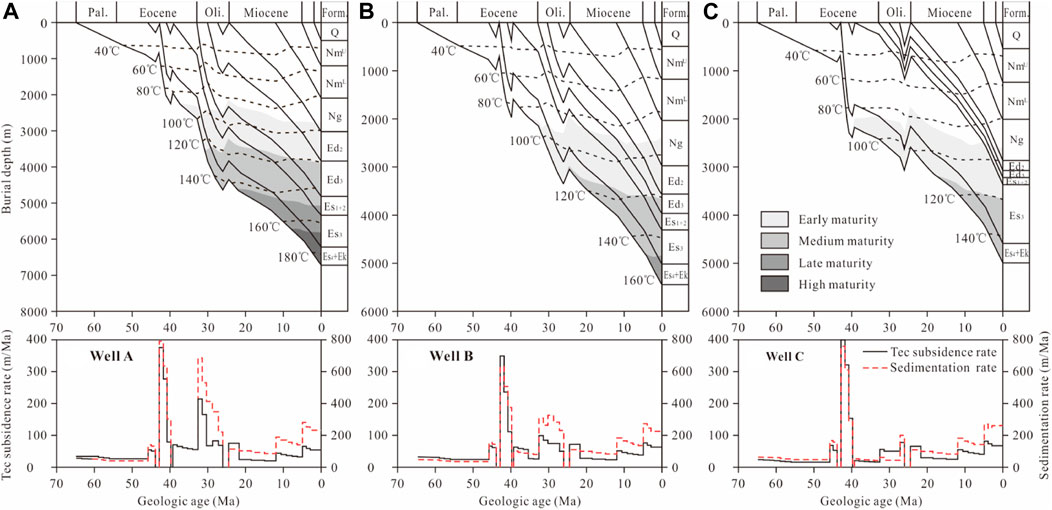
Figure 9. Burial and maturity evolution histories of the Paleogene source rocks of the Eastern (A), Southeast (B), and Western (C) sags in the Qinnan Depression.
4.2.2 Thermal maturity history modeling
The simulated maturity history shows that most source rocks in the Qinnan Depression have achieved the maturity threshold with Ro = 0.5% (Figure 9). Clear differences in maturation evolution can be observed among the Eastern, Southeastern, and Western sags. (1) Source rocks at the Eastern Sag have the highest thermal maturity due to significant subsidence. The Es3 are dominated by late mature to high mature source rocks, with Ro values in the range of 1.1%–1.5% (Figure 9A). The Ro values of the Es1 and Ed3 are more than 0.9% and 0.7%, respectively, suggesting medium mature source rocks. (2) The Es3, Es1, Ed3 at the Southeastern Sag are dominated by medium mature Source rocks, with Ro values vary between 0.7% and 1.0% (Figure 9B). (3) Source rocks at the Western Sag have the lowest thermal maturity with Ro values less than 0.8% (Figure 9C). Hence, the thermal maturity of the Paleocene source rocks in the Qinnan Depression is high at the East and low at the West, which is related to the differential subsidence and sedimentation (Cai et al., 2019). In terms of maturity time, the Paleocene source rocks at the Eastern Sag were maturated early and lasted for a long period. For example, the Es3 source rocks achieved the early mature stage in the middle Oligocene, the medium mature stage in the late Oligocene, the late mature stage in the late Miocene, and the high mature stage in the late Pliocene, respectively (Figure 9A). A phenomenon of late maturation occurred in the Paleocene source rocks at the Southeastern and Western sags. The Es3 source rocks achieved the early mature stage in the early Miocene and the medium mature stage in the late Miocene, respectively, and have not entered the late mature stage so far (Figures 9B, C).
4.2.3 Hydrocarbon generation history modeling
The simulated hydrocarbon generation history shows an obvious difference in hydrocarbon generation intensity and process among various source rocks from the Eastern, Southeastern, Western sags. It can be concluded as follows:
Two hydrocarbon generation events occurred to the Es3 source rocks at the Eastern Sag (Figure 10A). The first one occurred in the Oligocene with oil generation rate of 125 mg/g and gas generation rate of 13 mg/g. It was suspended at the end of the Oligocene due to Himalayan tectonic uplifts. The second one occurred in the Miocene with oil generation rate of 370 mg/g and gas generation rate of 45 mg/g. After that, it only generated gas until the gas generation rate was 90 mg/g. The hydrocarbon generation of the Es1 and Ed3 source rocks had occurred since the late Miocene owing to insufficient burial depth in the early stage. The cumulative hydrocarbon generation rate of the Es1 source rocks was 494 mg/g, with oil generation rate of 440 mg/g and gas generation rate of 54 mg/g, respectively. The cumulative hydrocarbon generation rate of the Ed3 source rocks is 298 mg/g, with oil generation rate of 252 mg/g and gas generation rate of 46 mg/g, respectively.
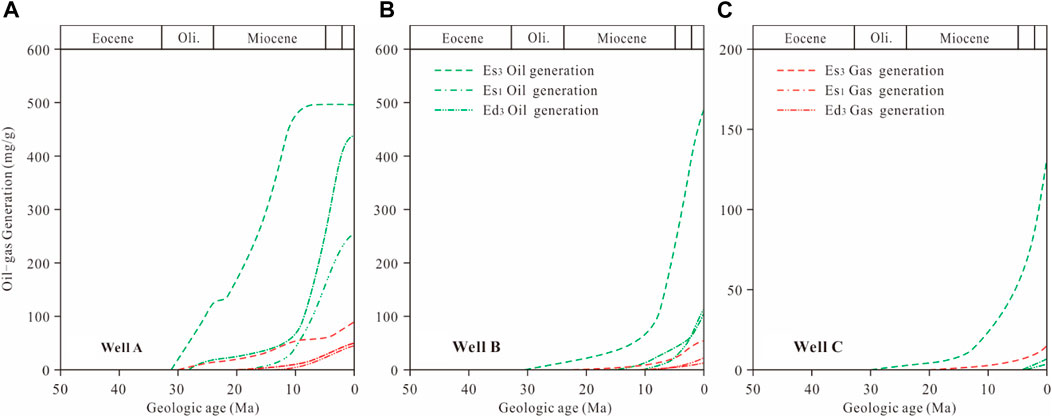
Figure 10. Hydrocarbon generation history of the Paleogene source rocks of the Eastern (A), Southeast (B), and Western (C) sags in the Qinnan Depression.
The major hydrocarbon generation event at the Southeastern Sag had occurred since the late Miocene (Figure 10B). The Es3 source rocks had entered the oil generation peak. The cumulative hydrocarbon generation rate is 535 mg/g, of which the oil generation rate is 480 mg/g and the gas generation rate is 55 mg/g. Since low maturity, the Es1 and Ed3 source rocks had not reached oil generation peak. The cumulative hydrocarbon generation rate of the Es1 source rocks is only 113 mg/g, of which the oil generation rate is 103 mg/g and the gas generation rate is 10 mg/g. The cumulative hydrocarbon generation rate of the Ed3 source rocks is only 124 mg/g with the oil and gas generation rate of 108 mg/g and16 mg/g, respectively. Similar to the Eastern Sag, oil generation rate of these three source rocks at the Southeastern Sag is significantly higher than gas generation rate, which agreed well with the field QHD29-2\2E discovered in the slope zone (proven crude oil reserves of 6,550 × 104 m3, natural gas reserves of 180 × 108 m3).
The major hydrocarbon generation event at the Western Sag had occurred since the late Pliocene (Figure 10C). Nevertheless, these three source rocks have not yet generated hydrocarbons significantly because of the low maturity, with oil and gas generation rate of 132 and 16 mg/g, respectively.
5 Discussion
5.1 Hydrocarbon generation potential of the source rocks
In this study, the hydrocarbon generation potential of the Es3, Es1, Ed3 source rocks was evaluated using geochemical and basin modeling analyses. Multiple geochemical parameters reveal that the Es3 and Es1 are high-quality source rocks with a mixture of type I and II kerogen, whose organic matter was originated from aquatic organisms under a reducing environment. The Ed3 are fair-quality source rocks with type II kerogen and are dominated by mixed organic matter depositing in a weakly reducing environment.
Based on basin modeling, source rocks at the Eastern and Southeastern sags have high hydrocarbon generation potential with the cumulative hydrocarbon generation rate more than 500 mg/g, which can provide sufficient oil and gas to surrounding structures. This is confirmed by the QHD29-2\2E oil-gas field of 100-million-ton scale discovered in the southeastern slope. However, source rocks at the Western Sag have low hydrocarbon generation potential with the cumulative hydrocarbon generation rate less than 150 mg/g, which could not provide sufficient oil and gas to surrounding structures. Their contribution to hydrocarbon accumulation is not yet realized. This may be the reason for no oil and gas discovery in the QHD21-1 and QHD22-1 structures in the north slope. Summarily, source rocks at the Eastern and Southeastern sags were high in hydrocarbon generation potential, which brings confidence to oil and gas exploration activities.
5.2 Petroleum system analysis and exploration potential
The event chart of the Paleogene to Neogene petroleum system in the Qinnan Depression is seen in Figure 11. This provides a concise outline of the chronological relationship among the elements and processes of the petroleum system. It displays that liquid hydrocarbon derived from the organic-matter-rich mudstones of the Es3 and Es1, and migrated into the sandstones of Es2 and Es1. These sandstone sequences are regarded as the main producing reservoirs in the Qinnan Depression (Niu et al., 2018). Dense mudstones at the bottom of the Es1, Ed3, Ed2 are the most important regional seal rocks within this depression. The overburden rocks covering on the Palaeogene source rock include the Ed3, Ed2, Ed1 in the Palaeogene, the Ng and Nm in the Neogene, and the Qp in the Quaternary. Most of the structural traps were primarily developed at the end of the Oligocene due to the Himalayan movement. The events chart also displays that hydrocarbon generation, migration, and accumulation began in the Miocene and continued to the present. Hence, the petroleum system in the Qinnan Depression was well preserved. The critical moment occurs when the source rock is at a transformation ratio of 50% and all the elements of the petroleum system are in place (Makeen et al., 2016). The critical moment of the petroleum system in the Qinnan Depression was appeared at the end of the Miocene (about 6 Ma). Reservicing factors were temporally and spatially coupled with each other, indicating potential oil-gas exploration prospect. Based on comprehensive analysis, the future oil-gas exploration in the Qinnan Depression should focus on effective traps around depression and slope zones at the Eastern and Southeastern sags.
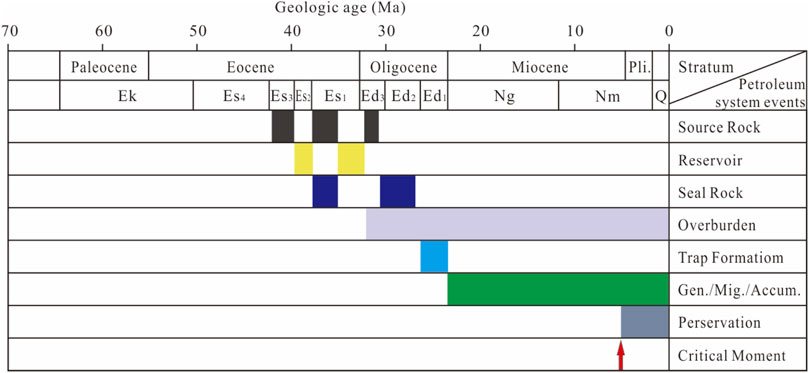
Figure 11. Simplified petroleum system event chart of the Qinnan Depression.
6 Conclusion
Based on geochemical and basin modeling analysis of the Paleogene Es3, Es1, Ed3 source rocks in the Qinnan Depression, following conclusions were obtained:
1. The Es3 and Es1 are high-quality source rocks with a mixture of type I and II kerogen, whose organic matter was originated from aquatic organisms under a reducing environment. The Ed3 are fair-quality source rocks with type II kerogen and are dominated by mixed organic matter depositing in a weakly reducing environment.
2. Clear differences in hydrocarbon generation were observed in various source rocks owing to differential subsidence and sedimentation among the Eastern, Southeastern, and Western sags. Source rocks at the Eastern Sag were maturated early and lasted for a long time, with intensive hydrocarbon generation capacity. Two hydrocarbon generation events occurred to them in the Oligocene and Miocene, respectively. Source rocks at the Southeastern Sag were maturated late and lasted for a short period, with intensive hydrocarbon generation capacity. The major hydrocarbon generation had occurred since the late Miocene. Source rocks at the Western Sag were at a low mature stage and began to generate hydrocarbon in the Pliocene, with weak hydrocarbon generation capacity.
3. Source rocks in the Qinnan Depression have high hydrocarbon generation potential with the cumulative hydrocarbon generation rate more than 500 mg/g. Reservoiring factors were temporally and spatially coupled with each other, indicating high oil-gas exploration potential. Exploration activities should focus on effective traps around depression and slope zones located at the Eastern and Southeastern sags.
4. The integrated geological analogy and basin modeling is a valid method in understanding hydrocarbon generation capacity and process of source rocks at low-exploration areas.
Data availability statement
The original contributions presented in the study are included in the article/Supplementary Material, further inquiries can be directed to the corresponding author.
Author contributions
CL: Conceptualization, Writing–original draft, Writing–review and editing. LM: Conceptualization, Funding acquisition, Writing–review and editing. ZT: Software, Writing–review and editing. QM: Conceptualization, Funding acquisition, Writing–review and editing. QW: Data curation, Software, Writing–review and editing. JF: Data curation, Visualization, Writing–review and editing. YW: Data curation, Visualization, Writing–review and editing.
Funding
The author(s) declare that financial support was received for the research, authorship, and/or publication of this article. This study was financially supported by the National Basic Research Program of China (No. 2016ZX05006-006), and the Science and Technology Planning Project of Tangshan City, China (No. 22130213H).
Acknowledgments
We thank the CNOOC Research Institute Ltd for kindly providing subsurface datasets in this study.
Conflict of interest
Authors CL, LM, QM, QW, JF, HC, and YW were employed by PetroChina Jidong Oilfield Company. Author ZT was employed by XDEC Mud Logging Brach Company (Geological Research Institute).
Publisher’s note
All claims expressed in this article are solely those of the authors and do not necessarily represent those of their affiliated organizations, or those of the publisher, the editors and the reviewers. Any product that may be evaluated in this article, or claim that may be made by its manufacturer, is not guaranteed or endorsed by the publisher.
References
Abu-Ali, M. A., and Littke, R. (2006). Paleozoic petroleum systems of Saudi Arabia: a basin modeling approach. Geoarabia (Manama) 10, 131–168. doi:10.2113/geoarabia1003131
Adegoke, A. K., Adegoke, W. H., Hakimi, M. H., and Sarki Yandoka, B. M. (2015). Geochemical characterisation and organic matter enrichment of Upper Cretaceous Gongila shales from Chad (Bornu) Basin, northeastern Nigeria: bioproductivity versus anoxia conditions. J. Petroleum Sci. Eng. 135, 73–87. doi:10.1016/j.petrol.2015.08.012
Allen, M. B., Macdonald, D. I. M., Zhao, X., Vincent, S., and Brouet-Menzies, C. (1997). Early Cenozoic two-phase extension and late Cenozoic thermal subsidence and inversion of the Bohai Basin, northern China. Mar. Petroleum Geol. 14, 951–972. doi:10.1016/S0264-8172(97)00027-5
Braun, R. L., and Burnham, A. K. (1987). Analysis of chemical reaction kinetics using a distribution of activation energies and simpler models. Energy and Fuels 1, 153–161. doi:10.1021/ef00002a003
Cai, S. W., Zhou, D. H., Wang, D. Y., Zhang, J. S., Zhang, Z., and Li, Y. (2019). Tectonic development characteristics and favorable exploration direction of qinnan sag in Bohai Bay Basin. Acta Pet. Sin. 40, 532–541. (in Chinese with English abstract). doi:10.7623/syxb201905003
Cao, Q., Ye, J. R., Wang, W., Shi, W., and Chen, C. (2009). Preliminary prediction and evaluation on source rock in low exploration basin: a case study from the Northeast Depression, South Yellow Sea Basin, East China. J. Earth Sci. 20, 836–847. doi:10.1007/s12583-009-0070-8
Chandra, K., Mishra, C. S., Samanta, U., Gupta, A., and Mehrotra, K. (1994). Correlation of different maturity parameters in the Ahmedabad-Mehsana block of the Cambay basin. Org. Geochem. 21, 313–321. doi:10.1016/0146-6380(94)90193-7
Damsté, J. S. S., Kenig, F., Koopmans, M. P., Köster, J., Schouten, S., Hayes, J., et al. (1995). Evidence for gammacerane as an indicator of water column stratification. Geochimica Cosmochimica Acta 59, 1895–1900. doi:10.1016/0016-7037(95)00073-9
Didyk, B. M., Simoneit, B. R. T., Brassell, S. C., and Eglinton, G. (1978). Organic geochemical indicators of palaeoenvironmental conditions of sedimentation. Nature 272, 216–222. doi:10.1038/272216a0
Dong, T., He, S., Yin, S. Y., Wang, D., Hou, Y., and Guo, J. (2015). Geochemical characterization of source rocks and crude oils in the upper cretaceous Qingshankou Formation, changling sag, southern Songliao Basin. Mar. Petroleum Geol. 64, 173–188. doi:10.1016/j.marpetgeo.2015.03.001
Falvey, D. A., and Middleton, M. F. (1981). Passive continental margins: evidence for a prebreakup deep crustal metamorphic subsidence mechanism. Th Int. Geol. Congr. 26.
Gawad, E. A., Fathy, M., Reda, M., and Ewida, H. (2021). Source rock evaluation of the Central Gulf of Suez, Egypt: a 1D basin modelling and petroleum system analysis. Geol. J. 56, 3850–3867. doi:10.1002/gj.4140
Gelman, S. E. (2023). Modeling the maturation history of the stacked petroleum systems of the Williston Basin, USA. Mar. Petroleum Geol. 155, 106390. doi:10.1016/j.marpetgeo.2023.106390
Hadad, Y. T., Hakimi, M. H., Abdullah, W. H., and Makeen, Y. M. (2017). Basin modeling of the Late Miocene Zeit source rock in the Sudanese portion of Red Sea Basin: implication for hydrocarbon generation and expulsion history. Mar. Petroleum Geol. 84, 311–322. doi:10.1016/j.marpetgeo.2017.04.002
Hakimi, M. H., and Abdullah, W. H. (2015). Thermal maturity history and petroleum generation modelling for the Upper Jurassic Madbi source rocks in the Marib-Shabowah Basin, western Yemen. Mar. Petroleum Geol. 59, 202–216. doi:10.1016/j.marpetgeo.2014.08.002
Hakimi, M. H., Al-Matary, A. M., and Hersi, O. S. (2018). Burial and thermal history reconstruction of the Mukalla-Sayhut Basin in the Gulf of Aden, Yemen: implications for hydrocarbon generation from Paleocene potential source rock. J. Afr. Earth Sci. 144, 59–75. doi:10.1016/j.jafrearsci.2018.04.005
Hanson, A. D., Zhang, S. C., Moldowan, J. M., Liang, D. G., and Zhang, B. M. (2000). Molecular organic geochemistry of the tarim basin, northwest China. AAPG Bull. 84, 1109–1128. doi:10.1306/A9673C52-1738-11D7-8645000102C1865D
Hao, F., Zhou, X. H., Zhu, Y. M., and Yang, Y. Y. (2011). Lacustrine source rock deposition in response to co-evolution of environments and organisms controlled by tectonic subsidence and climate, Bohai Bay Basin, China. Org. Geochem. 42, 323–339. doi:10.1016/j.orggeochem.2011.01.010
Hermansyah, H., Atmadipoera, A. S., Prartono, T., Jaya, I., and Syamsudin, F. (2017). Stratification and stability of seawater mass in Sulawesi Sea. Int. J. Sci. Basic and Appl. Res. 36, 36–44.
Hu, D., Rao, S., Wang, Z. T., and Hu, S. B. (2020). Thermal and maturation history for Carboniferous source rocks in the Junggar Basin, Northwest China: implications for hydrocarbon exploration. Petroleum Sci. 17, 36–50. doi:10.1007/s12182-019-00392-2
Huang, H. P., and Pearson, M. J. (1999). Source rock palaeoenvironments and controls on the distribution of dibenzothiophenes in lacustrine crude oils, Bohai Bay basin, eastern China. Org. Geochem. 30, 1455–1470. doi:10.1016/s0146-6380(99)00126-6
Johnsson, M. J., Howell, D. G., and Bird, K. J. (1993). Thermal maturity patterns in Alaska: implications for tectonic evolution and hydrocarbon potential. AAPG Bull. 77, 1874–1903. doi:10.1306/bdff8f6a-1718-11d7-8645000102c1865d
Jumat, N., Shalaby, M. R., Haque, A. E., Islam, M. A., and Lee Hoon, L. (2018). Geochemical characteristics, depositional environment and hydrocarbon generation modeling of the upper cretaceous Pakawau group in Taranaki Basin, New Zealand. J. Petroleum Sci. Eng. 163, 320–339. doi:10.1016/j.petrol.2017.12.088
Khaled, A., Li, R. X., Xi, S. L., Yu, Q., Wu, X., Zhao, B., et al. (2022). Basin modelling and source rock characteristics of the Late Palaeoproterozoic Cuizhuang Formation in the Yuncheng sub-basin, North China: implications for hydrocarbon generation and expulsion history. Geol. J. 57, 4700–4717. doi:10.1002/gj.4566
Lei, C., Yin, S. Y., Ye, J. R., Wu, J., Wang, Z., and Gao, B. (2021). Characteristics and deposition models of the paleocene source rocks in the Lishui Sag, East China Sea Shelf Basin: evidences from organic and inorganic geochemistry. J. Petroleum Sci. Eng. 200, 108342. doi:10.1016/j.petrol.2021.108342
Li, C., Chen, S. J., Liao, J. B., Hou, Y. T., Yu, J., Liu, G. L., et al. (2022). Geochemical characteristics of the Chang 7 Member in the southwestern Ordos Basin, China: the influence of sedimentary environment on the organic matter enrichment. Palaeoworld 32, 429–441. doi:10.1016/j.palwor.2022.09.002
Liu, H. (2014). “Study on the Paleogene system formation sequence stratigraphy and depositional system,” in Qinnan depression of Bohai Sea (China University of Geosciences). (in Chinese with English abstract).
Makeen, Y., Abdullah, W. H., Pearson, M. J., Hakimi, M. H., Ayinla, H. A., Elhassan, O. M., et al. (2016). History of hydrocarbon generation, migration and accumulation in the Fula sub-basin, Muglad Basin, Sudan: implications of a 2D basin modeling study. Mar. Petroleum Geol. 77, 931–941. doi:10.1016/j.marpetgeo.2016.07.016
Mckenzie, D. (1978). Some remarks on the development of sedimentary basins. Earth Planet. Sci. Lett. 40, 25–32. doi:10.1016/0012-821X(78)90071-7
Moldowan, J. M., Seifert, W. K., and Gallegos, E. J. (1985). Relationship between petroleum composition and depositional environment of petroleum source rocks. AAPG Bull. 69, 1255–1268. doi:10.1306/AD462BC8-16F7-11D7-8645000102C1865D
Niu, C. M., Wang, F. L., Tang, G. M., Yan, G., and Zhao, G. X. (2018). Evaporative fractionation and biodegradation impacts on a complex petroleum system: QHD29-2 oil field, Bohai Sea area. Petroleum Goelogy Exp. 40, 381–388. (in Chinese with English abstract). doi:10.11781/sysydz201803381
Perkins, J. R., Fraser, A. J., Muxworthy, A. R., Neumaier, M., and Schenk, O. (2023). Basin and petroleum systems modelling to characterise multi-source hydrocarbon generation: a case study on the inner Moray Firth, UK North Sea. Mar. Petroleum Geol. 151, 106180. doi:10.1016/j.marpetgeo.2023.106180
Peters, K. E. (1986). Guidelines for evaluating source rock using programmed pyrolysis. AAPG Bull. 70, 318–329. doi:10.1306/94885688-1704-11D7-8645000102C1865D
Peters, K. E., Walters, C. C., and Moldowan, J. M. (2005). The biomarker guide volume 1: biomarkers and isotopes in the environment and human history. New York: Cambridge University Press, 3–69.
Qiu, N. S., Xu, W., Zuo, Y. H., and Chang, J. (2015). Meso-cenozoic thermal regime in the Bohai Bay Basin, eastern north China craton. Int. Geol. Rev. 57, 271–289. doi:10.1080/00206814.2014.1002818
Roksandic, M. M. (2010). Seismic facies analysis concepts. Geophys. Prospect. 26, 383–398. doi:10.1111/j.1365-2478.1978.tb01600.x
Sachsenhorfer, R. F., Popov, S. V., Akhmetiev, M. A., Bechtel, A., Gratzer, R., Groß, D., et al. (2017). The type section of the maikop group (Oligocene-Lower Miocene) at the belaya river (north caucasus): depositional environment and hydrocarbon potential. AAPG Bull. 101 (3), 289–319. doi:10.1306/08051616027
Sangree, J. B., and Widmier, J. M. (1979). Interpretation of depositional facies from seismic data. Geophysics 44, 131–160. doi:10.1190/1.1440957
Sepúlveda, J., Wendler, J., Leider, A., Kuss, H. J., Summons, R. E., and Hinrichs, K. U. (2009). Molecular isotopic evidence of environmental and ecological changes across the Cenomanian-Turonian boundary in the Levant Platform of central Jordan. Org. Geochem. 40, 553–568. doi:10.1016/j.orggeochem.2009.02.009
Shalaby, M. R., Hakimi, M. H., and Abdullah, W. H. (2011). Geochemical characteristics and hydrocarbon generation modeling of the Jurassic source rocks in the Shoushan Basin, north Western Desert, Egypt. Mar. Petroleum Geol. 28, 1611–1624. doi:10.1016/j.marpetgeo.2011.07.003
Shi, W. L., Li, H. Y., Mao, L., Yang, H. F., Chen, L. X., and Yu, H. B. (2014). Hydrocarbon geological characteristics and exploration potential of qinnan depression in offshore area of Bohai Sea. China Pet. Explor. 19, 32–40. (in Chinese with English abstract). doi:10.3969/j.issn.1672-7703.2014.05.003
Skudra, M., and Lips, U. (2017). Characteristics and inter-annual changes in temperature, salinity and density distribution in the Gulf of Riga. Oceanologia 59 (1), 37–48. doi:10.1016/j.oceano.2016.07.001
Sweeney, J. J., and Burnham, A. K. (1990). Evaluation of a simple model of vitrinite reflectance based on chemical kinetics. AAPG Bull. 74, 1559–1570. doi:10.1306/0c9b251f-1710-11d7-8645000102c1865d
Ten Haven, H. L., Rohmer, M., Rullkötter, J., and Bisseret, P. (1989). Tetrahymanol, the most likely precursor of gammacerane, occurs ubiquitously in marine sediments. Geochimica Cosmochimica Acta 53, 3073–3079. doi:10.1016/0016-7037(89)90186-5
Volkman, J. K. (1986). A review of sterol markers for marine and terrigenous organic matter. Org. Geochem. 9, 83–99. doi:10.1016/0146-6380(86)90089-6
Volkman, J. K., Kearney, P., and Jeffrey, S. W. (1990). A new source of 4-methyl sterols and 5α(H)-stanols in sediments: prymnesiophyte microalgae of the genus Pavlova. Org. Geochem. 15, 489–497. doi:10.1016/0146-6380(90)90094-G
Wang, J. Q., Li, Z. X., and Liu, K. (2022). Rehabilitation status of denuded land in the eastern Qaidam Basin: geophysical and thermochronological evidences. Earth Sci. Front. 29, 371–384. (in Chinese with English abstract). doi:10.13745/j.esf.sf.2021.12.6
Wang, L. S., Liu, S. W., Xiao, W. Y., Li, C., Li, H., Guo, S., et al. (2002). Distribution characteristics of terrestrial heat flow in the Bohai Basin. Chin. Sci. Bull. 47, 151–155. (in Chinese with English abstract).
Wygrala, B. P. (1989). Integrated study of an oil field in the southern Po basin, northern Italy. Cologne: University of Cologne, Germany.
Xu, S., Cong, F. Y., Hao, F., Xu, C., Zou, H., Zhang, X., et al. (2018). Shelf-edge trajectory and sediment dispersal in a lacustrine setting: a case study from Qinnan Depression, Bohai Bay Basin, China. Mar. Petroleum Geol. 91, 562–575. doi:10.1016/j.marpetgeo.2018.01.027
Yu, K., Ju, Y. W., and Zhang, B. X. (2020). Modeling of tectono-thermal evolution of Permo-Carboniferous source rocks in the southern Qinshui Basin, China: consequences for hydrocarbon generation. J. Petroleum Sci. Eng. 193, 107343–107413. doi:10.1016/j.petrol.2020.107343
Yuan, W., Liu, G. D., Stebbins, A., Xu, L., Niu, X., Luo, W., et al. (2017). Reconstruction of redox conditions during deposition of organic-rich shales of the upper triassic yanchang formation, Ordos Basin, China. Palaeogeogr. Palaeoclimatol. Palaeoecol. 486, 158–170. doi:10.1016/j.palaeo.2016.12.020
Zhang, B., Mao, Z. G., Zhang, Z. Y., Yuan, Y., Chen, X., Shi, Y., et al. (2021). Black shale formation environment and its control on shale oil enrichment in Triassic Chang 7 Member, Ordos Basin, NW China. Petroleum Explor. Dev. 48, 1304–1314. doi:10.1016/s1876-3804(21)60288-4
Zheng, T., Zieger, L., Baniasad, A., Grohmann, S., Hu, T., and Littke, R. (2022). The Shahejie Formation in the Dongpu depression, Bohai Bay Basin, China: geochemical investigation of the origin, deposition and preservation of organic matter in a saline lacustrine environment during the middle Eocene. Int. J. Coal Geol. 253, 103967. doi:10.1016/j.coal.2022.103967
Keywords: geological analogy, source rock, basin modeling, thermal history, hydrocarbon generation history, low-exploration area, Qinnan Depression
Citation: Lei C, Meng L, Tian Z, Ma Q, Wang Q, Fu J and Wei Y (2024) Geochemical characteristics and hydrocarbon generation modeling of the Paleogene source rocks in the Qinnan Depression, Bohai Bay Basin, China. Front. Earth Sci. 12:1354562. doi: 10.3389/feart.2024.1354562
Received: 12 December 2023; Accepted: 29 March 2024;
Published: 22 April 2024.
Edited by:
Giovanni Martinelli, National Institute of Geophysics and Volcanology, ItalyCopyright © 2024 Lei, Meng, Tian, Ma, Wang, Fu and Wei. This is an open-access article distributed under the terms of the Creative Commons Attribution License (CC BY). The use, distribution or reproduction in other forums is permitted, provided the original author(s) and the copyright owner(s) are credited and that the original publication in this journal is cited, in accordance with accepted academic practice. No use, distribution or reproduction is permitted which does not comply with these terms.
*Correspondence: Lingjian Meng, bWVuZ2xpbmdqaWFuMjAwOEBwZXRyb2NoaW5hLmNvbS5jbg==