 Yan Peng
 Xiaohan Wang
 Liji Sheng2
- 1Faculty of Petroleum, China University of Petroleum (Beijing), Karamay, China
- 2College of Petroleum Engineering, China University of Petroleum (Beijing), Beijing, China
Predicting the production amounts has great significance for exploitation of oil and gas resources. The flow–geomechanical coupling effect plays an important role in predicting production. Shale rocks and the stress-dependent permeability model are critical for representing this coupling effect. The pore network of shale rock is not abundant like that of coal rock, and the matrix blocks of shale rock are not completely separated by the pore network. There is stress concentration around the pores when shale rock is deformed. Based on previous studies, the stress-dependent permeability model considering the impact of stress concentration is used in this study to build a numerical simulation model for flow–geomechanical coupling in a shale gas reservoir and validation using field data. Sensitivity studies are conducted to discuss the difference in production prediction between the new and common models. The main conclusions of this study are as follows: 1) The new model can fit both the field and experimental data well; the average error in daily production rate between the numerical solution and field data is 8%, which indicates that the new model can be used to predict shale gas production. 2) Under the geomechanical condition of a real reservoir, the difference in predicted production between models with and without stress concentration can be large and increase with the ratio of a to b. If this ratio is less than 50, the impact of stress concentration is not significant. Otherwise, the impact of stress concentration on production increases sharply and can exceed 20%. 3) The adsorption-induced strain enhances the impact of stress concentration on production. When the Langmuir pressure exceeds 1 MPa and Langmuir strain exceeds 0.01, the impact magnitude of stress concentration can exceed 10%.
1 Introduction
Given the continuous growth of global energy demand, conventional oil and gas resources have shown declining production trends, so countries all over the world have been forced to optimize their energy structures. After the successful exploitation of shale gas in the United States, unconventional shale gas resources have become an important form of “transition energy” in the process of optimization of the global energy structure (Zhang, 2016). The current success of shale gas development has benefitted from advances in horizontal drilling and multistage hydraulic fracturing (Li et al., 2013). Horizontal drilling achieves a large reservoir volume, whereas large-scale hydraulic fracturing creates a large number of hydraulic fractures that act as gas-flow channels (Yao et al., 2013; Hao et al., 2014). Despite some cases of successful development, uncertainties remain about the recovery rates of shale reservoirs (Warren and Root, 1963). These uncertainties stem from the complexity of shale gas production and human inability to fully understand the impacts of the heterogeneous, multidomain, and multiphysical properties of shale reservoirs (Heller et al., 2014). Given the limitations of laboratory research, there is complex coupling of the processes involved in hydrogeology, geochemistry, thermodynamics, and rock mechanics. Numerical simulations are often used in practice as a cost-effective method to perform large-scale complex analyses and predictions (Li Q. et al., 2020). One of the major challenges to consider when simulating shale gas reservoir extraction is the effect of multiple physical couplings (Wei et al., 2018).
The influence of the microstructure of a shale gas reservoir on the multiple physical couplings is reflected in two aspects: heterogeneity and fluid flow law. First, the micropore structure of a shale gas reservoir includes the pores inside the matrix and natural fractures. These pores may range in size from nanometers to microns (Peng et al., 2015). Natural fractures are connected to hydraulic fractures, and the formation of a complex fracture network plays an important role in shale gas production (Gale et al., 2007). Unlike conventional sandstone reservoirs, the gas shale matrix consists of kerogen pockets (organic matter) within the inorganic matrix (IM, which is a combination of clay and detrital minerals). However, there are differences in porosity, gas adsorption, and compressibility between kerogen and the IM (Li W. et al., 2020). When considering the heterogeneity of a shale gas reservoir, a dual-porosity (kerogen and natural fractures containing IM as two interacting pressure systems) or triple-porosity (kerogen, IM, and natural fractures as three interacting pressure systems) model is established based on the continuum hypothesis before subsequently being used in modeling (Yu et al., 2015a; Wei et al., 2018). Second, owing to the complex flow channel networks in a shale gas reservoir, various flow regimes are experienced in the production process. The flow regimes in pores of different sizes may also vary significantly (Peng et al., 2015). To consider the deviations in the gas flow regimes in shale, many numerical simulation models of natural gas transport in shale have been proposed. The Knudsen number, which is the ratio of the average free path of gas to the pore diameter, has been widely used to distinguish the flow area in shale from free molecular flow (Civan et al., 2011; Ye et al., 2015). Some scholars have also proposed and studied the non-Darcy path of gas flow, including Knudsen diffusion and slip flow (Javadpour, 2009; Ashrafi Moghadam and Chalaturnyk, 2014; Guo et al., 2015). A numerical model conceptualized using actual engineering results was previously introduced to evaluate the propagation of hydraulic fractures and study the hydromechanical responses and permeability alternation throughout hydraulic fracturing and production (Wei et al., 2019). Therefore, it is necessary to consider the selection of a multiporosity medium model and changes to the shale gas flow regimes in the simulation of shale gas reservoir production modeling.
The impacts of the above aspects on shale gas production can be represented by the permeability alternation. The alternation behavior of permeability is complicated because multiple physical processes are triggered after shale gas production. First, the shale gas flow affects shale deformation. Once production commences, the initial balance of the shale reservoir is broken, which changes the effective stress (Tuncay and Corapcioglu, 1995; Zhang et al., 2008a). In this case, shale deformation is triggered that further alternates the geometric sizes of the pores and natural fractures (Safari et al., 2017; Guo et al., 2018). Second, the deformation affects shale gas flow through changes in the permeability behavior. Owing to the geometric changes caused by pore deformation, the permeability changes throughout the production process. Third, gas desorption in kerogen supplies the gas for the IM and also induces an adsorption strain (Berryman, 2002; Heller et al., 2014). In addition, the gas flow regimes in shale gas reservoirs have many types. The gas flow regimes are dependent on pore/fracture width, including continuous flow, slip flow, and transition flow. The various flow regimes have different formations of the apparent permeability behaviors (Kazemi et al., 1976; Guo et al., 2013). However, the permeability alternation behavior is difficult to predict accurately because it is complicated by multiple physical processes; this further affects accurate assessment of the shale gas recovery efficiency (Li et al., 2018; Liu et al., 2019; Li W. et al., 2020).
Accurate understanding of the permeability alternation law of a shale reservoir during production is key to the development of this unconventional natural gas. Many scholars have studied the sensitivity of reservoir stress and proposed some classic permeability models (Palmer and Mansoori, 1998; Zhang et al., 2008b). Cui and Bustin proposed a widely used stress-sensitivity permeability model (C&B model), which uses the mean alternation of three principal effective stresses to describe the stress sensitivity of the permeability (Cao et al., 2016; Jiang and Yang, 2018). The compression coefficient describing the stress sensitivity in the C&B model is obtained by simply fitting the experimental data. The effect of stress on permeability is independent of the stress direction. However, the alternations of stresses may vary in different directions (Peng et al., 2021). Hydraulic fracturing can cause the redistribution of in situ stress (Safari et al., 2017; Guo et al., 2018). In addition, based on the classical elasticity theory, a stress concentration exists around the defects inside a material. The pores and natural fractures can be considered defects in rocks. Therefore, stress concentrations should occur around the pores or natural fractures (Sui et al., 2020). These will inevitably cause pore deformation and affect permeability, which cannot be reflected using the C&B model. By using appropriate assumptions, researchers have established some classical permeability models in which the permeability varies with stress (Palmer and Mansoori, 1998; Zhang et al., 2008b). However, the effects of pore stress concentration on pore deformation are not considered. Previous analyses have shown that the stress concentration around pores plays an important role in pore deformation. In the present work, the permeability model considering the effect of stress concentration around the pores is applied to simulate shale gas production, and the results are compared with those from the C&B model. The effects of the stress concentration on permeability alternation and production features are investigated, and the sensitivity factors affecting production are also discussed.
2 Coupled multiphysics model
2.1 Conceptual model
The IM of shale is significantly different from kerogen, and the pores in the IM are generally of the order of several hundred nanometers to several microns in size, while kerogen mainly contains nanopores (several nanometers to several hundred nanometers) (Peng et al., 2015; Cao et al., 2016). As shown in Figure 1, the pore size is directly related to the gas flow state (slip flow, transition flow, or diffusion flow) in shale, so the gas migration mechanism between IM and kerogen is obviously different. To clearly study the matrix deformation and gas flow law of a shale reservoir, a dual-pore model (kerogen and IM have different pressure systems) is adopted in this work.
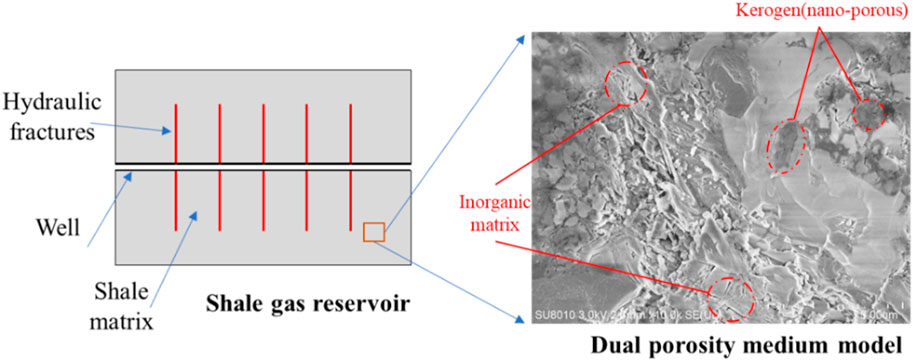
Figure 1. Shale reservoir numerical simulation diagram and dual-porosity medium model.
As shown in Figure 2, the extraction process of shale gas mainly involves the following processes (Li W. et al., 2020): 1) The free gas inside the hydraulic fractures flows into the wellbore, which satisfies the continuous flow condition under Darcy’s law. 2) When the pressure balance is disturbed, the free gas inside the IM (micropores and natural fractures) will flow into the hydraulic fractures; since the Knudsen number is less than 1, the gas transfer in the IM is mainly viscous flow under normal circumstances. 3) The free gas in the kerogen first flows into the IM, and the gas in the organic matter then begins to desorb and enter the IM; the migration modes here are mainly Knudsen diffusion and surface diffusion. During real shale gas production, the change in the reservoir pressure changes the effective stress of the reservoir, which then induces rock deformation that compresses the pores in the reservoir and changes the permeability of the reservoir. Hence, it is seen that shale gas production entails the flow–geomechanics coupling problem.
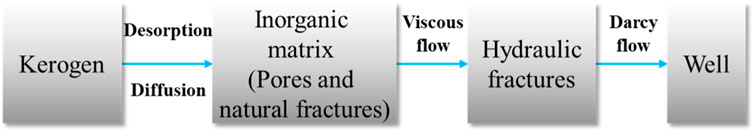
Figure 2. Shale gas extraction process.
2.2 Governing equations for rock deformation
A shale reservoir is a dual-porous-media system composed of the IM and kerogen, so the following assumptions are made: 1) the kerogen and IM are isotropic and linear elastic media; 2) the shale reservoir is completely saturated with shale gas; 3) shale gas is a single-phase medium; 4) the shale reservoir conforms to the small deformation hypothesis and plastic deformation can be ignored; 5) shale gas production is an isothermal process; 6) shale gas is an ideal gas state.
On the basis of poroelasticity and by making an analogy between thermal contraction and matrix shrinkage, the constitutive relation for the deformed shale matrix is given as follows (Zhang et al., 2008a):
where
According to the elastic theory, the deformation in the shale gas production process satisfies the equilibrium and geometric equations. A combination of these two equations and the constitutive relation in Eq. (1) is used to obtain the governing equation of shale gas deformation as follows (Cao et al., 2016):
where
2.3 Governing equation for gas transport
2.3.1 Governing equation for gas flow in the IM
The gas flow regime inside the pores of the IM is slip flow, and the gas inside these pores is free-phase gas. From the mass conservation equation, the governing equations for gas storage and flow in the IM can be written as (Peng et al., 2015)
where
where the subscript
The Darcy velocity vector of the gas in the IM can be expressed as
Substituting Eqs (5) and (4) into Eq. (3), the gas transport equation in the IM can be obtained as
2.3.2 Governing equation for gas flow in kerogen
The gas in the kerogen exists in two forms: free-gas and adsorbed phases. Gas transport in the kerogen is mainly in the form of diffusion. According to the mass conservation equation and mass transfer properties, the gas transport equation can be written as follows (Peng et al., 2015):
where
where
2.3.3 Governing equation for gas flow in the hydraulic fractures
The hydraulic fractures (HFs) can be conceptually simplified into a one-dimensional fractured medium at the boundary of the IM (HFs are shown by the red lines in Figure 1). Their stress dependence is considered here, and the flow regime effect is ignored because of the large aperture of the HFs (order of millimeters). Desorption is also ignored here. The flow inside a HF is Darcy flow, and the fluid mass conservation equation is given by
where
Hydraulic fractures are also stress-sensitive, and the expressions for the permeability and gas pressure in the HFs are given (Yu et al., 2015b).
where
2.4 Controlling equation for shale permeability
2.4.1 Intrinsic permeability model without considering stress concentration
During shale gas depletion, the geomechanical deformation of shale will significantly affect the porosity, so the intrinsic permeability is usually related to the pressure and stress. An intrinsic permeability model is needed for numerical simulation to explain the large variations in the intrinsic permeability during gas production. The intrinsic permeability alternation law is described by Eqs (11) and (12). The permeability model considering stress sensitivity generally adopts the average effective stress proposed by Cui and Bustin, as shown in Eq. (12) (Cui and Bustin, 2005):
where the subscript 0 indicates the reference state; the subscript CB indicates that this model is the one derived by Cui and Bustin.
2.4.2 Intrinsic permeability model considering stress concentration
The elastic theory is used to analyze the stress concentration characteristics around the pores in the matrix (Peng et al., 2021). The pores inside shale rock cannot completely divide the matrix block, so a stress concentration can be triggered around the pores. By calculating the displacement of the pore surface under the stress concentration condition, the total pore volume can be obtained as shown in Eq. (13) (Cao et al., 2016):
where
The displacement solution of the elliptic pores under general stress can be obtained by superposition of the surface displacement solution of the elliptic pores in the simple case. The solutions for a, b, and
where
where
2.4.3 Apparent permeability model
The apparent permeability is used to reflect the influence of the flow regime on gas flow accurately, and it is the product of the intrinsic permeability and term representing the flow regime. The expression for apparent permeability in the dual-pore system is (Peng et al., 2015)
where
3 Model validation
Field data are used to verify the accuracy of the model by simulating production from the Marcellus shale production reservoir in North America (Yeager and Meyer, 2010). The parameters used in the simulation are taken from the literature that has successfully validated the Marcellus shale case (Yu et al., 2015a), as shown in Table 1.
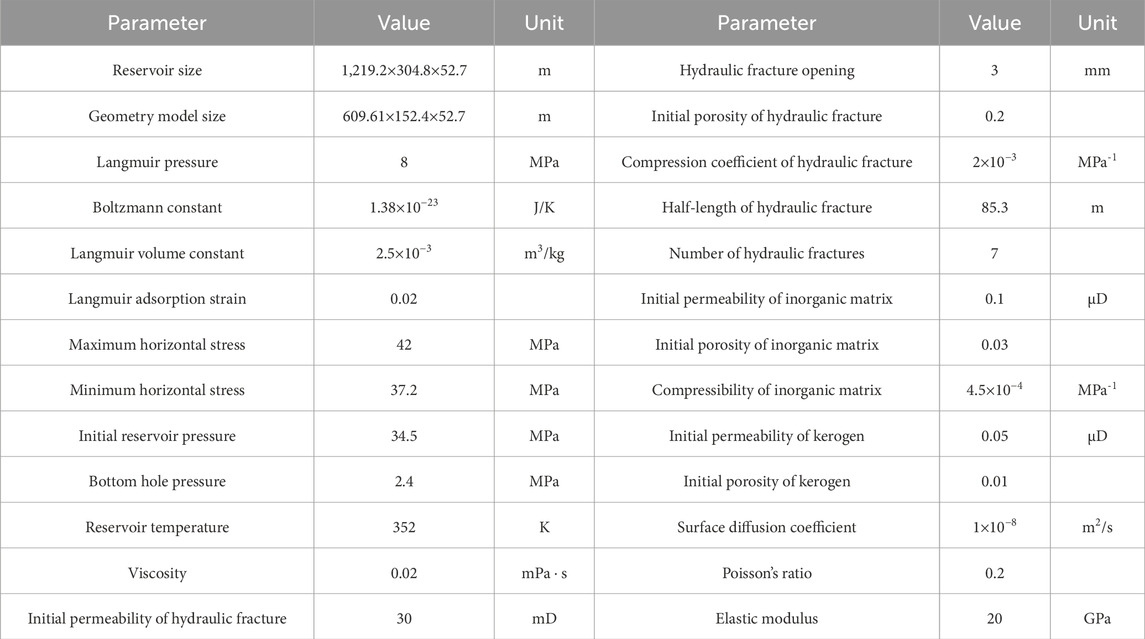
Table 1. Main parameters of the Marcellus shale reservoir simulation (Yu et al., 2015a).
As shown in Figure 3, because of the symmetry of the reservoir, a quarter-geometric reservoir model of the shale reservoir production is established. The multiphysics coupling equations for the shale gas production in Section 2 are solved using the finite element calculation software COMSOL Multiphysics (Li W. et al., 2020). As shown in Figure 3, all the outside boundaries are no-flow boundaries because no fluid flows through these boundaries. The interior white lines represent the hydraulic fractures, and the pressure values at their bottoms connected to the bottom boundary are set to the production pressure value (pw). The shale gas can flow out through the hydraulic fractures. The geomechanical boundary conditions are as follows. The top and right boundaries are applied in terms of the maximum and minimum horizontal stresses, respectively. This geometry model is only a quarter reservoir, so its geomechanical solutions are symmetrical. To represent the symmetry, the normal displacements of the left and bottom boundaries are fixed.
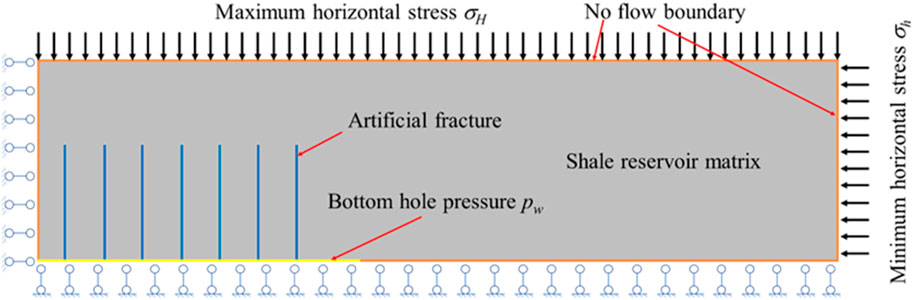
Figure 3. Top view of the shale quarter-symmetrical reservoir geometry model and its boundary conditions.
The comparison between the numerical simulation results and field data is shown in Figure 4. The results show that the permeability model considering the effects of stress concentration is in good agreement with the field production data. The gas production rate of the simulation result in the early stage is significantly higher than that from field data. The influence of water reflux in the early stage is ignored in the simulation but exists in the real case (Wei et al., 2018). However, in the late stage of mining, shale gas dominates the production output of the reservoir, and the simulation results are in good agreement with the actual production data, with an average error of 8%.
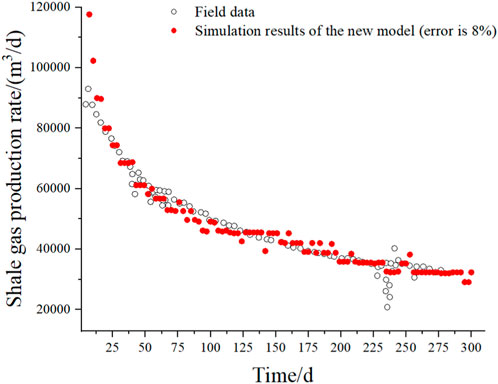
Figure 4. Comparison between the Marcellus field data and new model.
As shown in Figure 5, based on the numerical simulation model in Figure 3 and data in Table 1, the pressure distribution of the Marcellus field after 1 year of simulated production is calculated. After 1 year of production, the maximum pressure in the matrix is 3.45×10⁷ Pa, while the pressure in the area near the hydraulic fracture decreases to 2.4×10⁶ Pa, reflecting the influence of the hydraulic fracture on pressure change during production.
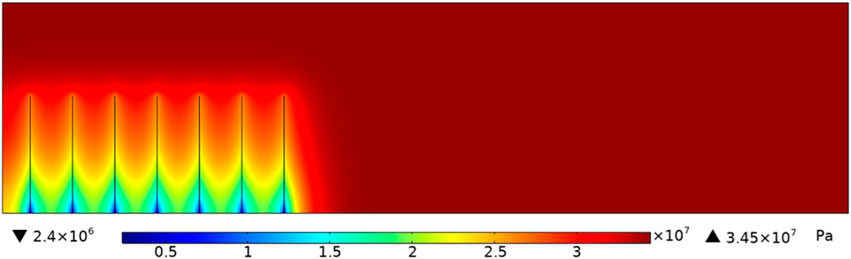
Figure 5. Simulated pressure distribution after Marcellus production for 1 year.
4 Results and discussion
4.1 Parameter relationships between the two permeability models based on experimental data
During shale gas production, the effective stress of the shale matrix increases gradually, which deforms the internal pores and natural fractures of the IM and changes the reservoir permeability. The traditional C&B model only considers the effect of the mean effective stress variation on shale permeability. The degrees of variation of the effective stresses in different directions are normally different, so the effect of effective stress difference on permeability can be considered through the proposed model. By fitting experimental data, the parameters of these two models can be determined, and the relationships between the parameters can be analyzed. The experimental data on shale permeability are retrieved from a published work (Wei et al., 2018), where the shale rock sample can be seen as a matrix block as it is an intact sample. The permeability data represent the permeability of the matrix. In addition, by substituting Eqs (12) and (16) into (18), the apparent permeabilities for the C&B and new models can be obtained, respectively. The parameter for the C&B model that can be obtained by fitting experimental data is cm, while the parameters for the new model are a and b. However, the numbers of parameters for the two models are not the same. The C&B model has only one parameter, whereas the new model has two parameters; hence, it is difficult to determine the relationship between them. To overcome this difficulty, the ratio of a to b (a/b) is used to represent the characteristics of a and b. A total of 42 experimental points are used in this study, and 21 groups of parameters are obtained, as shown in Figure 6.
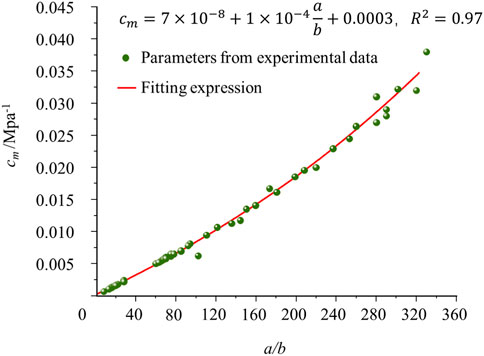
Figure 6. Relationship between experimental data fitting for the parameters of the C&B and new models.
From Figure 6, it is seen that the relationship between the parameters of the two models is stable and that cm increases with a/b. However, the degree of stability decreases with a/b. When a/b is less than 200, the errors between the fitted expression (red line in Figure 6) and parameters from the experimental data (green points in Figure 6) are low; when the ratio increases beyond 200, the error is significantly high. In the following section, the impacts of these two models on shale gas production prediction are discussed. To eliminate these errors, the four groups of parameters shown in Figure 6 are chosen, as shown in Table 2.
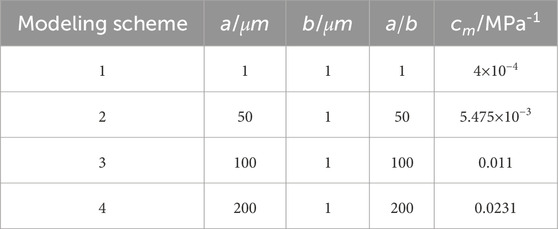
Table 2. Numerical simulation parameter determination.
4.2 Effects of stress concentration on production prediction
As noted in the discussion in Section 4.1, the parameters for the two models are obtained based on experimental data. In the experiments, the outer boundaries of the samples are applied by confining the pressure values. Under this boundary condition, the sample can deform in any direction, so this condition is known as the “free swelling” condition. To predict shale gas production, the geometry shown in Figure 3 is used, but the mechanical boundary conditions are changed to the free swelling condition wherein the left and right boundaries are based on the minimum horizontal stress (σh) and the bottom and top boundaries are based on the maximum horizontal stress (σH). To compare the prediction performances of the two models, the four groups of parameter values shown in Table 2 are used, while all other parameters are the same as those noted in Table 1.
Figure 7 shows the difference between the cumulative productions of shale gas predicted by the two models. For the four cases given by a/b=1, 50, 100, and 200, the 20-year cumulative shale gas production errors between the predictions of the two models are 7.00%, 7.38%, 6.70%, and 5.03%, respectively. All the errors in these four cases are quite low, which indicates that the two models are equivalent under these conditions. The low errors between the production predictions are attributable to the narrow differences in permeabilities between these two models. The permeability alternations with time for these two models are shown in Figure 8. The permeability errors for these two models are 10.71% and 26.94%. In this case, the boundary condition in the numerical simulation is consistent with that in the experiment. The values of cm and a/b are obtained by fitting the experimental data so that the real pore deformation can be fully reflected by these values. When the values of cm and a/b are substituted into the numerical simulation, the permeability alternations of these two models should be almost similar. These values of the parameters result from data fitting, so the method is not accurate and can result in error to some degree.
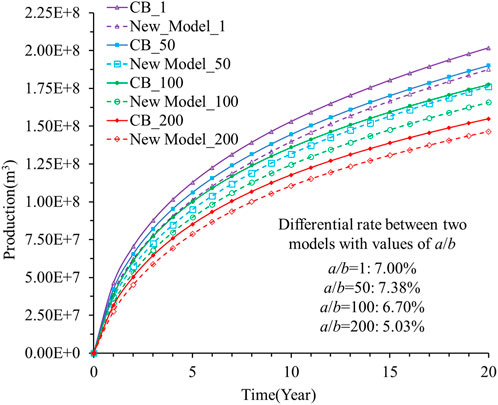
Figure 7. Cumulative shale gas production under laboratory conditions.
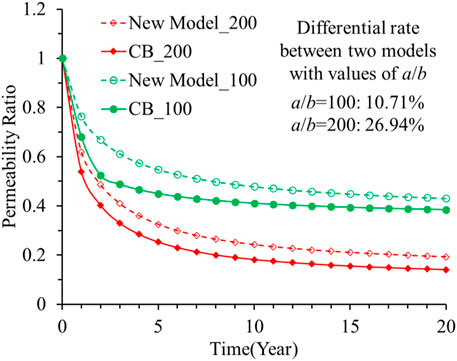
Figure 8. Permeability alternation under laboratory boundary conditions.
However, the condition of free swelling is not the real condition of the reservoir. Owing to the structural and size influences of the reservoir, the mechanical condition of the reservoir is usually assumed to be the “uniaxial strain” condition (Cui and Bustin, 2005). In this case, only the top boundary is applied based on stress, whereas the other boundaries are fixed to their normal deformations. The values of cm and a/b shown in Table 2 are used in this case as well. The uniaxial strain condition is rarely used in permeability tests so the data for this condition are difficult to find. Normally, the parameters fitted by the experimental data are commonly used to predict shale gas production. The C&B model assumes that the pores or natural fractures divide the matrix completely. However, the new model assumes that the pores or natural fractures of the shale reservoir do not separate the matrix completely, so there is a stress concentration around the pores. Under the uniaxial strain condition, the deformation behaviors of the pores for these two assumptions are quite different (Peng et al., 2021), so the difference in production predictions between the two models may be large.
The error in the production predictions between these two models is shown in Figure 9. When a/b=1, 50, 100, and 200, the cumulative shale gas productions predicted by the two models are different. When a/b=1, the error between the predictions of the two models is only 0.93%. When a/b=50, 100, and 200, the cumulative production errors predicted by the two models are 8.93%, 21.25%, and 22.01%, respectively. This indicates that these two models are equivalent when a/b is less than 50; otherwise, these two models are quite different. In addition, the prediction from the C&B model is usually less than that from the new model.
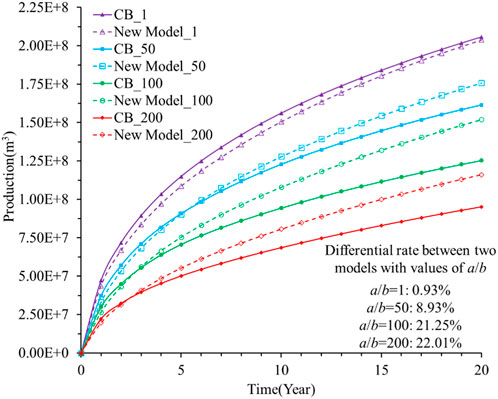
Figure 9. Cumulative shale gas production under reservoir conditions.
The significant difference between these two models is a result of the difference in permeabilities between the two models. The permeability changes during 20 years of production under the uniaxial strain condition are shown in Figure 10. When a/b=100 and 200, the permeabilities predicted by the C&B model are lower than those by the new model. The permeability predicted by the C&B model is usually less than that obtained using the new model, and this trend is consistent for the production prediction as well (C&B model predicts lower production). The permeability errors for these two models are 91.41% and 98.22%. In addition, under the uniaxial strain condition, the stresses in different directions alternate differently so the mean values of the principal stresses do not reflect the deformation of the pores when considering stress concentration. It is suggested that the new model can be used to predict production for shale because the pore structure and spatial stress concentration effect are reflected by this model.
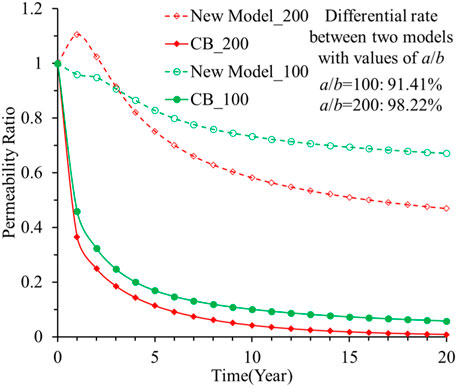
Figure 10. Permeability alternation under reservoir boundary conditions.
4.3 Effects of adsorption on production prediction
Gas desorption in the kerogen affects rock deformation (as shown in Eq. (2)), which can also affect permeability and production. To study the influence of the desorption characteristics on production, two groups of numerical simulations are conducted. In the first group, the value of the Langmuir pressure changes from 1 to 16 MPa, while the other parameters are the same as those noted in Table 1. In the second group, the value of the Langmuir adsorption strain changes from 0.002 to 0.03 while the other parameters are the same as those noted in Table 1. Both groups are also under the uniaxial strain mechanical boundary condition.
Figure 11 shows the effect of the Langmuir pressure on shale gas production, and the cumulative production increases with the Langmuir pressure. The increase in magnitude of production is large when the Langmuir pressure is less than 12 MPa. When the Langmuir pressure increases from 1 to 12 MPa, the 20-year production increases by 22.4% based on the C&B model (as shown by the solid lines in Figure 10). Otherwise, the increase in magnitude of production is low. When the Langmuir pressure increases from 12 to 16 MPa, the 20-year production increases by 1.1% based on the C&B model. In addition, the impact of the Langmuir pressure increases the difference in production predictions between these two models. When the Langmuir pressure is 1 MPa, the difference in the 20-year production values between these two models is 8.93%; when the Langmuir pressure increases to 16 MPa, this difference increases up to 24.16%.
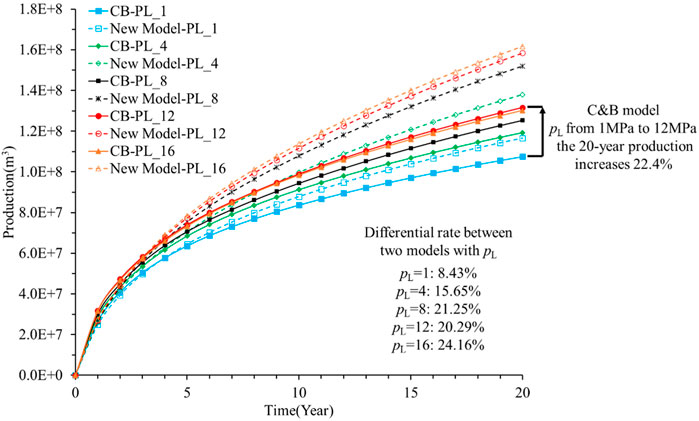
Figure 11. Effect of the Langmuir adsorption pressure of the matrix on shale gas production.
Figure 12 shows the impact of the Langmuir strain on shale gas production, and the cumulative production decreases with the Langmuir strain. When the Langmuir strain increases from 0.002 to 0.03, the 20-year production decreases by 29.9% based on the C&B model (as shown by the solid lines in Figure 11). In addition, the impact of the Langmuir strain increases the difference in production predictions between the two models. When the Langmuir strain is 0.002, the difference in the 20-year production values between the two models is 0.43%; when the Langmuir pressure increases to 0.03, this difference increases up to 27.30%.
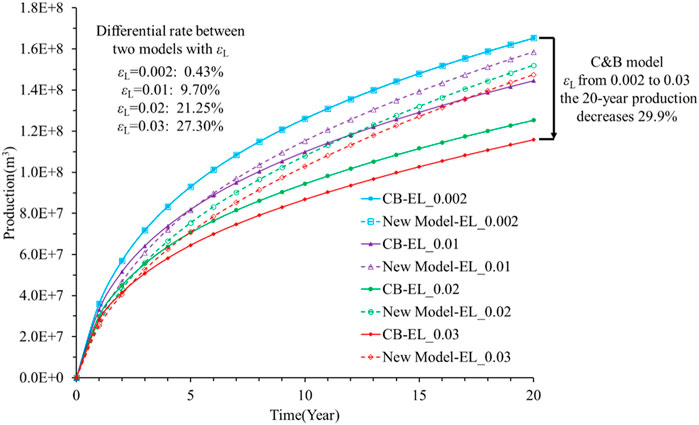
Figure 12. Effect of the adsorption strain of the matrix on shale gas production.
5 Conclusion
The impact of flow–geomechanical coupling on shale gas production is usually reflected by the stress-dependent permeability behavior. The common stress-dependent permeability model (C&B model) is derived based on the assumption that the matrix blocks are completely separated by the pores or natural fractures. For the production prediction of the shale gas reservoir, the original C&B model does not consider the changes in porosity and permeability caused by the stress concentration phenomenon, and it does not take into consideration the adsorption effect and adsorption stress of shale gas. In this study, the stress concentration phenomenon is considered; the influences of the maximum and minimum horizontal principal stresses are considered separately, and the influences of the adsorption strain and adsorption pressure on production prediction are introduced to provide further reference for shale gas production prediction. A new stress-dependent permeability model considering the impact of stress concentration is developed. The difference in production predictions between the two models are discussed, and the main conclusions are as follows:
(1) The new stress-dependent permeability model adequately fits both the field data and experimental data. This indicates that the new model can be used to predict shale gas production.
(2) Under the geomechanical condition of uniaxial strain, the difference in predicted productions between the two models increases with the ratio of a to b. This ratio can represent the pore compressibility. A high value of this ratio means a high value of pore compressibility. When this ratio is less than 50, the difference between the two models can be ignored. Otherwise, the difference is high. The main reason for the pore deformation of shale rock being different from that of normal rocks is that the matrix blocks are completely separated. This difference in pore deformation behavior further changes the permeability alternation magnitude.
(3) The adsorption-induced strain enhances the difference in predicted productions between the two models. When the Langmuir pressure exceeds 1 MPa and Langmuir strain exceeds 0.01, the difference in magnitude between the two models exceeds 10%.
Data availability statement
The raw data supporting the conclusions of this article will be made available by the authors, without undue reservation.
Author contributions
YP: conceptualization, methodology, software, supervision, writing–original draft, writing–review and editing, funding acquisition, resources, and visualization. XW: data curation, formal analysis, investigation, methodology, and writing–original draft. LS: data curation, formal analysis, methodology, and writing–original draft.
Funding
The author(s) declare that financial support was received for the research, authorship, and/or publication of this article. This study was supported by funding from the National Natural Science Foundation of China (grant no. 52004302), which supplied the salaries for the students and other required fees.
Conflict of interest
The authors declare that the research was conducted in the absence of any commercial or financial relationships that could be construed as a potential conflict of interest.
Publisher’s note
All claims expressed in this article are solely those of the authors and do not necessarily represent those of their affiliated organizations, or those of the publisher, the editors, and the reviewers. Any product that may be evaluated in this article, or claim that may be made by its manufacturer, is not guaranteed or endorsed by the publisher.
References
Ashrafi Moghadam, A., and Chalaturnyk, R. (2014). Expansion of the Klinkenberg’s slippage equation to low permeability porous media. Int. J. Coal Geol. 123, 2–9. doi:10.1016/j.coal.2013.10.008
Berryman, J. G. (2002). Extension of poroelastic analysis to double-porosity materials: new technique in microgeomechanics. J. Eng. Mech. 128, 840–847. doi:10.1061/(asce)0733-9399(2002)128:8(840)
Cao, P., Liu, J., and Leong, Y.-K. (2016). A fully coupled multiscale shale deformation-gas transport model for the evaluation of shale gas extraction. Fuel 178, 103–117. doi:10.1016/j.fuel.2016.03.055
Civan, F., Rai, C. S., and Sondergeld, C. H. (2011). Shale-gas permeability and diffusivity inferred by improved formulation of relevant retention and transport mechanisms. Transp. Porous Med. 86, 925–944. doi:10.1007/s11242-010-9665-x
Cui, X., and Bustin, R. M. (2005). Volumetric strain associated with methane desorption and its impact on coalbed gas production from deep coal seams. Bulletin 89, 1181–1202. doi:10.1306/05110504114
Gale, J. F. W., Reed, R. M., and Holder, J. (2007). Natural fractures in the Barnett Shale and their importance for hydraulic fracture treatments. Bulletin 91, 603–622. doi:10.1306/11010606061
Guo, C., Bai, B., Wei, M., He, X., and Wu, Y.-S. (2013). “Study on gas permeability in nano pores of shale gas reservoirs,” in OnePetro.
Guo, C., Xu, J., Wu, K., Wei, M., and Liu, S. (2015). Study on gas flow through nano pores of shale gas reservoirs. Fuel 143, 107–117. doi:10.1016/j.fuel.2014.11.032
Guo, X., Wu, K., and Killough, J. (2018). Investigation of production-induced stress changes for infill-well stimulation in eagle ford shale. SPE J. 23, 1372–1388. doi:10.2118/189974-pa
Hao, S., Adwait, C., Hussein, H., Xundan, S., and Lin, L. (2014). “Understanding shale gas production mechanisms through reservoir simulation,” in OnePetro.
Heller, R., Vermylen, J., and Zoback, M. (2014). Experimental investigation of matrix permeability of gas shales. Bulletin 98, 975–995. doi:10.1306/09231313023
Javadpour, F. (2009). Nanopores and apparent permeability of gas flow in mudrocks (shales and siltstone). J. Can. Petroleum Technol. 48, 16–21. doi:10.2118/09-08-16-da
Jiang, J., and Yang, J. (2018). Coupled fluid flow and geomechanics modeling of stress-sensitive production behavior in fractured shale gas reservoirs. Int. J. Rock Mech. Min. Sci. 101, 1–12. doi:10.1016/j.ijrmms.2017.11.003
Kazemi, H., Merrill, L. S., Porterfield, K. L., and Zeman, P. R. (1976). Numerical simulation of water-oil flow in naturally fractured reservoirs. Soc. Petroleum Eng. J. 16, 317–326. doi:10.2118/5719-pa
Langmuir, I. (1917). The constitution and fundamental properties of solids and liquids. J. Frankl. Inst. 183, 102–105. doi:10.1016/s0016-0032(17)90938-x
Li, N., Ran, Q., Li, J., Yuan, J., Wang, C., Wu, Y.-S., et al. (2013). “A multiple-continuum model for simulation of gas production from shale gas reservoirs,” in All days SPE-165991-MS (Abu Dhabi, UAE: SPE).
Li, W., Liu, J., Zeng, J., Leong, Y.-K., Elsworth, D., Tian, J., et al. (2020a). Epigenome-wide association study of Alzheimer's disease replicates 22 differentially methylated positions and 30 differentially methylated regions. Environ. Geotech. 9 (3), 149–158. doi:10.1186/s13148-020-00944-z
Li, W., Liu, J., Zeng, J., Leong, Y. K., Elsworth, D., Tian, J., et al. (2020b). A fully coupled multidomain and multiphysics model for evaluation of shale gas extraction. Fuel 278, 118214. doi:10.1016/j.fuel.2020.118214
Li, Y.-F., Sun, W., Liu, X. W., Zhang, D. W., Wang, Y. C., and Liu, Z. Y. (2018). Study of the relationship between fractures and highly productive shale gas zones, Longmaxi Formation, Jiaoshiba area in eastern Sichuan. Pet. Sci. 15, 498–509. doi:10.1007/s12182-018-0249-7
Liu, Y., Gao, D., Li, Q., Wan, Y., Duan, W., Zeng, X., et al. (2019). Mechanical frontiers in shale-gas development. Adv. Mech. 49, 1–236. doi:10.6052/1000-0992-17-020
Lu, Y., Wei, S., Xia, Y., and Jin, Y. (2021). Modeling of geomechanics and fluid flow in fractured shale reservoirs with deformable multi-continuum matrix. J. Petroleum Sci. Eng. 196, 107576. doi:10.1016/j.petrol.2020.107576
Palmer, I., and Mansoori, J. (1998). How permeability depends on stress and pore pressure in coalbeds: a new model. SPE Reserv. Eval. Eng. 1, 539–544. doi:10.2118/52607-pa
Pan, Z., and Connell, L. D. (2012). Modelling permeability for coal reservoirs: a review of analytical models and testing data. Int. J. Coal Geol. 92, 1–44. doi:10.1016/j.coal.2011.12.009
Peng, Y., Liu, J., Pan, Z., and Connell, L. D. (2015). A sequential model of shale gas transport under the influence of fully coupled multiple processes. J. Nat. Gas Sci. Eng. 27, 808–821. doi:10.1016/j.jngse.2015.09.031
Peng, Y., Liu, J., Zhang, G., Pan, Z., Ma, Z., Wang, Y., et al. (2021). A pore geometry-based permeability model for tight rocks and new sight of impact of stress on permeability. J. Nat. Gas Sci. Eng. 91, 103958. doi:10.1016/j.jngse.2021.103958
Peng, Y., Shen, L., Lv, P., Wei, S., and Wang, X. (2022). “Impact of stress concentration of pores on shale gas production,” in All days ARMA-2022-0219 (Santa Fe, NM, United States: ARMA).
Safari, R., Lewis, R., Ma, X., Mutlu, U., and Ghassemi, A. (2017). Infill-well fracturing optimization in tightly spaced horizontal wells. SPE J. 22, 582–595. doi:10.2118/178513-pa
Sui, W., Quan, Z., Hou, Y., and Cheng, H. (2020). Estimating pore volume compressibility by spheroidal pore modeling of digital rocks. Petroleum Explor. Dev. 47, 603–612. doi:10.1016/s1876-3804(20)60077-5
Tuncay, K., and Corapcioglu, M. Y. (1995). Effective stress principle for saturated fractured porous media. Water Resour. Res. 31, 3103–3106. doi:10.1029/95wr02764
Warren, J. E., and Root, P. J. (1963). The behavior of naturally fractured reservoirs. Soc. Petroleum Eng. J. 3, 245–255. doi:10.2118/426-pa
Wei, M., Liu, J., Elsworth, D., and Wang, E. (2018). Triple-porosity modelling for the simulation of multiscale flow mechanisms in shale reservoirs. Geofluids 2018, 1–11. doi:10.1155/2018/6948726
Wei, X., Zhang, J., Li, Q., Liu, X., Liang, L., and Ran, L. (2019). Fault slippage and its permeability evolution during supercritical CO2 fracturing in layered formation. Oil Gas Sci. Technology–Revue d’IFP Energies nouvelles 74, 76. doi:10.2516/ogst/2019051
Yao, J., Sun, H., Fan, D., Wang, C., and Sun, Z. (2013). Numerical simulation of gas transport mechanisms in tight shale gas reservoirs. Pet. Sci. 10, 528–537. doi:10.1007/s12182-013-0304-3
Ye, Z., Chen, D., and Pan, Z. (2015). A unified method to evaluate shale gas flow behaviours in different flow regions. J. Nat. Gas Sci. Eng. 26, 205–215. doi:10.1016/j.jngse.2015.05.032
Yeager, B. B., and Meyer, B. R. (2010). “Injection/Fall-off testing in the Marcellus shale: using reservoir knowledge to improve operational efficiency,” in SPE eastern regional meeting (Morgantown, WV, United States: Society of Petroleum Engineers). doi:10.2118/139067-MS
Yu, W., Zhang, T., Du, S., and Sepehrnoori, K. (2015a). Numerical study of the effect of uneven proppant distribution between multiple fractures on shale gas well performance. Fuel 142, 189–198. doi:10.1016/j.fuel.2014.10.074
Yu, W., Zhang, T., Du, S., and Sepehrnoori, K. (2015b). Numerical study of the effect of uneven proppant distribution between multiple fractures on shale gas well performance. Fuel 142, 189–198. doi:10.1016/j.fuel.2014.10.074
Zhang, G. (2016). Research on international law issues of global exploitation of shale gas. Nat. Resour. Inf. (12), 32–38. doi:10.3969/j.issn.1674-3709.2016.12.006
Zhang, H., Liu, J., and Elsworth, D. (2008a). How sorption-induced matrix deformation affects gas flow in coal seams: a new FE model. Int. J. Rock Mech. Min. Sci. 45, 1226–1236. doi:10.1016/j.ijrmms.2007.11.007
Zhang, H., Liu, J., and Elsworth, D. (2008b). How sorption-induced matrix deformation affects gas flow in coal seams: a new FE model. Int. J. Rock Mech. Min. Sci. 45, 1226–1236. doi:10.1016/j.ijrmms.2007.11.007
Keywords: shale gas reservoir, flow through porous medium, stress-dependent permeability, dual porosity model, production prediction
Citation: Peng Y, Wang X and Sheng L (2024) Numerical study of the impact of stress concentration on shale gas production. Front. Earth Sci. 12:1375023. doi: 10.3389/feart.2024.1375023
Received: 23 January 2024; Accepted: 15 March 2024;
Published: 10 April 2024.
Edited by:
Manoj Khandelwal, Federation University Australia, AustraliaReviewed by:
Xiaochen Wei, Southwest Petroleum University, ChinaXin Du, University of Science and Technology of China, China
Copyright © 2024 Peng, Wang and Sheng. This is an open-access article distributed under the terms of the Creative Commons Attribution License (CC BY). The use, distribution or reproduction in other forums is permitted, provided the original author(s) and the copyright owner(s) are credited and that the original publication in this journal is cited, in accordance with accepted academic practice. No use, distribution or reproduction is permitted which does not comply with these terms.
*Correspondence: Yan Peng, eWFuLnBlbmdAY3VwLmVkdS5jbg==