 Cleo N. Stratmann1*
 Rachid Dris1*
 Johnny Gasperi2
 Frans A. Buschman3
 Adriaan A. Markus3Sabrina Guerin4
 A. Dick Vethaak3,5†
 Bruno Tassin1
- 1Laboratoire Eau Environnement et Systèmes Urbains, Ecole des Ponts ParisTech, Université Paris Est Créteil, Marne-la-Vallee, France
- 2Laboratoire Eau et Environnement GERS-LEE, Université Gustave Eiffel, Bouguenais, France
- 3Deltares, Delft, Netherlands
- 4Syndicat Interdépartemental pour l’Assainissement de l’Agglomération Parisienne (SIAAP), Paris, France
- 5Amsterdam Institute for Life and Environment (A-LIFE), Vrije Universiteit Amsterdam, Amsterdam, Netherlands
This data paper presents microplastic (MP) concentration and composition data from four campaigns in a one-year period in the Seine River within the Greater Paris area. Detailed data on MP occurrence, physical water parameters, hydrological conditions, and potential sewer point sources are presented. Initial analysis of the data set shows that MP concentrations were significant (median: 600 particles m−3 and 100 mg m−3) and MP fluxes showed variations across sampling sites and campaigns. Three polymer types (polypropylene - PP, polyethylene - PE, polystyrene - PS) account for 96% of the total number of MP. This dataset provides valuable insights for understanding river MP pollution under anthropogenic pressure.
1 Introduction
Microplastics (MPs) are ubiquitous environmental contaminants present in all natural compartments (Miranda et al., 2020). MPs are persistent and harmful, e.g., through the release of toxic chemicals (Wagner et al., 2024), negatively impact natural resources, organisms, and human health (Amobonye et al., 2021). It is thus important to understand MPs fate and impact once they leaked into the environment to adopt mitigation and protection measures. Freshwaters are key ecosystems worthy of protection against MP pollution and rivers play an important role. Rivers are often under anthropogenic pressure receiving MPs (Kumar et al., 2021) through surface runoff, combined sewer overflows (CSOs), or wastewater treatment plant (WWTP) effluent (Fahrenfeld et al., 2019; Nguyen et al., 2024). To elucidate sources, understand MP transport and assess the ecological impacts comprehensive monitoring is needed. This should include MP concentration and fluxes (Miranda et al., 2020) across temporal and spatial scales like in a recent study on microplastics in canals of Amsterdam (Sefiloglu et al., 2024). Additional information on the environmental conditions such as the river flow rate, weather conditions, and water quality parameters like suspended particle concentration or algal biomass help to explain MPs in the environmental context (Birch et al., 2020) and to identify potential solutions (Li et al., 2020; Li et al., 2023).
The Seine River in France (Figure 1) meanders 750 km from east to northwest and is subject to intense urban activities (up to 5,000 inhabitants km−2) before reaching the English Channel. Traversing Greater Paris with 12 million inhabitants (Tabuchi et al., 2016) the Seine consistently receives sewer effluents via WWTPs (2021: ∼853 million m3 from four major WWTPs) and CSOs (∼23 million m3 in 2021) during periods of intense rainfall (Flipo et al., 2020, 2021). Studies (Dris et al., 2015; Treilles et al., 2022) have highlighted MP contamination in the Seine around Paris, exhibiting 4–5,000 particles m−3 as median concentration.
Further insights into the complex dynamics of MP occurrence in the Seine River are needed. This data paper is the basis for further analyses presented later answering questions like: Are MP concentrations increased downstream of Paris, indicating significant urban contribution to the contamination and which urban sources could be important contributors? How is MP occurrence linked to the different MP sources along the river stream?
Therefore, a 1-year MP monitoring campaign in the Seine River upstream and downstream of Greater Paris was conducted. This paper describes the unique MP monitoring dataset of the Seine River including 1) an overview of MP occurrence in the Seine between July 2021 and July 2022 based on four sampling campaigns, 2) data on physical water parameters, 3) data on hydrological conditions including a water balance, and 4) data on potential sewer point sources. This dataset provides comprehensive data reporting to foster cross-study comparisons (Cowger et al., 2020).
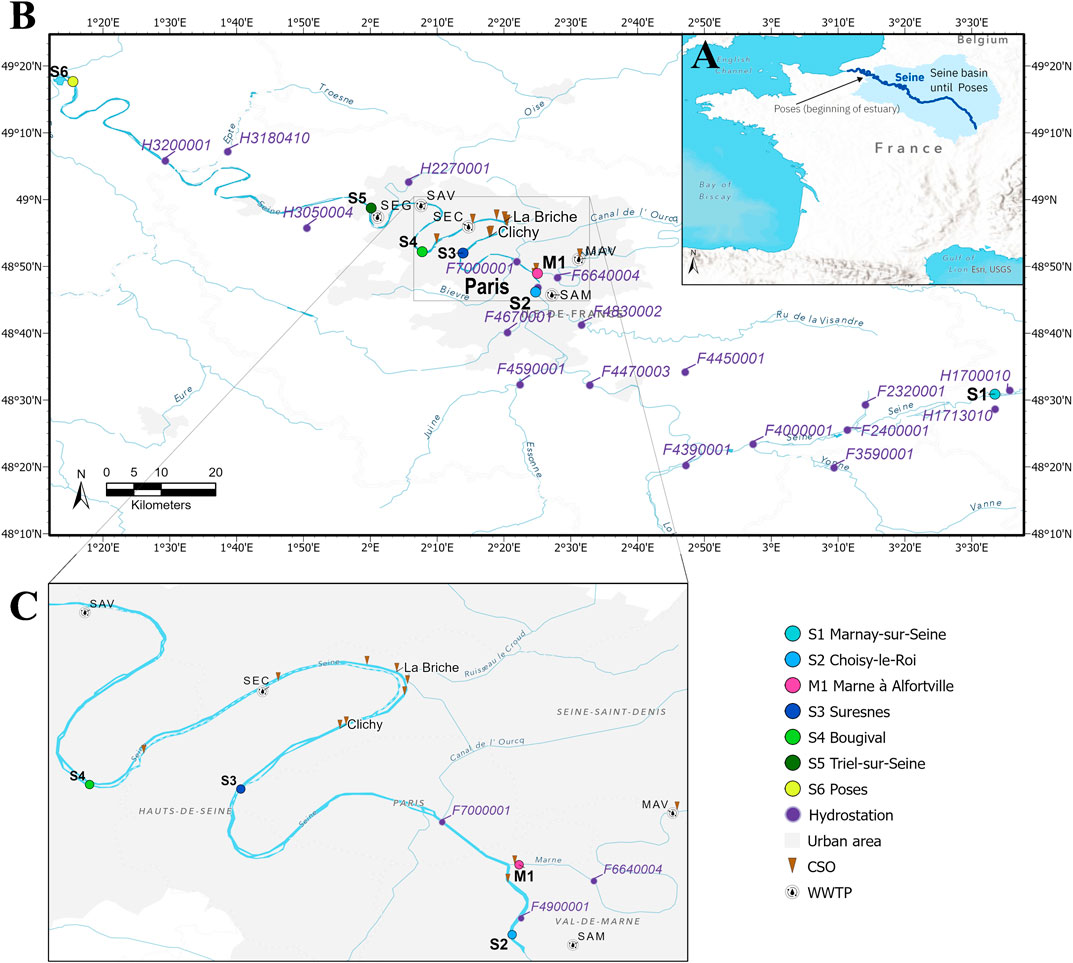
Figure 1. (A) Map of France with the Seine River and the Seine basin until Poses before the estuary starts (light-blue area). (B) Map of the monitoring area showing Seine River catchment situated in Northern France and the sampling sites (S1-S6 and M1), urban area is defined as functional urban area (OECD, 2012), hydrological measurement stations (Hydrostation labeled with identifiers), combined sewer overflow (CSO) locations (sites La Briche and Clichy hold >50% of the discharge volumes in Paris), and wastewater treatment plant (WWTP) locations SAM, Seine Amont; MAV, Marne Aval; SEC, Seine Centre; SAV, Seine Aval; SEG, Seine Grésillons. (C) Magnification detailing CSO sites that each exhibit >1% of the annual CSO discharge volume (see metadata in the Supplementary Material).
2 Methods
Monitoring included collecting MP data and some physical water quality and hydrological parameters from field samples and measurements. Detailed hydrological and meteorological data (river discharge, water level, precipitation) and data on sewage discharges (WWTPs, CSOs) were collected by third parties.
2.1 Monitoring
2.1.1 Sampling sites and monitoring period
The monitoring area (Figure 1A) is situated in the upper Seine catchment (∼67 × 103 km2). The oceanic climate has annual average temperatures of 19.5°C in summer and 5°C in winter, with low temporal variations in rainfall (mean annual precipitation 642 mm). The Seine (mean discharge in Paris: 319 m3s−1) has two distinct seasonal flow regimes: a low flow during summer (mean 125 m3s−1) and a high flow during winter (mean 583 m3s−1) (Flipo et al., 2021). This seasonality is driven by evapotranspiration in the catchment and the presence of natural aquifers. Four upstream reservoirs maintain summer flows above 100 m3s−1 and contribute to regulate flood periods. Twelve tributaries flow into the Seine within the monitored area, including the three preeminent tributaries Yonne, Marne, and Oise. Six sampling sites reached downstream spanning 442 km along the Seine from Marnay-sur-Seine to Poses before the estuary influence (Figure 1). The two sampling sites Marnay-sur-Seine (S1) and Choisy-le-Roi (S2) are located upstream of Paris, and four sampling sites at the locations Suresnes (S3), Bougival (S4), Triel-sur-Seine (S5), and Poses (S6) are located downstream of Paris. An additional sampling site just before the Seine-Marne confluence at Marne à Alfortville (M1) was monitored to account for MPs entering from the Marne River. All sampling sites exhibited anthropogenically modified riverbanks varying from concrete walls to overgrown slopes. Two sampling campaigns per river flow season (low and high) were carried out. The four sampling campaigns were conducted in July 12–22, 2021, November 2–11,2021, February 15- 24, 2022, and July 20–27, 2022.
2.1.2 Sample and data collection
2.1.2.1 Microplastics
MPs with a major particle diameter between 25 µm and 300 µm were assessed. The lower sampling mesh size was 10 µm. MP samples were collected ca. 1–3 m away from the river shore at the sampling sites during daylight for all four sampling campaigns in the surface water (upper 0.1–0.3 m) using an in-situ cascade filtration pump [Universal Filtration Object (UFO) developed by Aalborg University, (Rist et al., 2020), Supplementary Figure S1]. The same sampling approach was used by Sefiloglu et al. (2024) to determine microplastic concentrations in Amsterdam surface waters. Seven liters per minute of water were pumped through a 5,000 µm grid cage and stainless-steel tube over stainless steel filters of first 300 µm and then 10 µm pore-size. One sample consisted of four filters (16 cm in diameter and 10 µm pore size). A pressure threshold of 1.8 bar indicated filter clogging. Sampling volumes vary from 74L to 940L depending on the water conditions as higher suspended particulate matter in the water led to faster clogging.
The loaded filters were rinsed and ultrasonicated (2–4 min) before hydrogen peroxide (10 vol% H2O2) wet oxidation for 18–24 h at 30°C, and the solution was filtered afterwards. This was followed by sodium-iodide (density 1.63–1.7 g cm−3 NaI) density separation using JAMSS density separator units (Nakajima et al., 2019) and volume-reducing “anodisc” (0.2 µm, Whatman) filtration. During the procedures, the filters were stored in clean glass Petri dishes at room temperature. After oxidation and density separation, the filters were rinsed and ultrasonicated. The extracted particles on the anodisc filters were then analyzed by micro-Fourier transform infrared spectroscopy (µ-FTIR, Supplementary Material S2) with a detection limit (pixel resolution) of 25 µm. Spectra were further interpreted using systematic identification of MP in the environment (siMPle®) software [Supplementary Material S3, Primpke et al. (2020)] providing characteristics such as polymer type, particle dimensions, and mass (calculated by the software using minor and major dimension, particle thickness estimated at 0.6 × 2 × minor dimension, polymer density, and assuming an ellipsoid shape). The sample processing is visualized in Supplementary Material S4.
Throughout the study, strict protocols were followed to ensure the integrity of the samples and prevent MP contamination. To minimize the risk of synthetic material contamination, all personnel always wore cotton lab coats and refrained from wearing synthetic clothing. All procedures were executed under a laminar flow bench or fume hood. All solutions used were pre-filtered (GF/D 2.7µm, Whatman). Glassware, glass-fiber, and stainless-steel filters were muffled, i.e., temperature treatment at 500°C for 2–3 h. Workspaces were routinely cleaned. Plastic materials were avoided during laboratory processes except for sample processing for campaigns July 2021 and November 2021, where polyethylene (PE) squeezing bottles with polypropylene (PP) caps were utilized for rinsing. Procedural blanks (∼100 mL of filtered tab water) were carried out in parallel to the sample processing as of the H2O2 oxidation for MPs (results see Supplementary Material).
2.1.2.2 Physical water quality parameters
Temperature, pH, and conductivity were measured during each MP sampling campaign using a multiprobe (Multiline P4, WTW). A clean stainless-steel bucket was filled with >5L of river surface water, and measurements were taken inside the bucket. Turbidity was measured as nephelometric turbidity units (NTU) in triplicate using an in-situ turbidity meter (Hach 2100P Turbidimeter). Suspended sediment concentration (SSC) was determined from a 1-L sample of river water following the standard procedure ASTM D3977 with a slight modification of drying temperature (>48 h at 60°C). The total sample was filtered on a muffled GF/F filter (pore size 0.7 µm, Whatman), dried and weighted.
2.1.2.3 Hydrological data
For each sampling site, the distance from the river source and the river catchment area up to that point are obtained from HydroSHEDS data (Lehner and Grill, 2013).
Data of river discharge (Q, m3s−1) and water level (H, m) for the Seine and Marne Rivers and relevant tributaries near the confluences were obtained from 18 hydrological monitoring stations as daily averaged values from the Central Service for Hydrometeorology and Support for Flood Forecasting in France (Hydro Eaufrance, 2023).
Flow velocity (five replicates, m s−1) was measured in the surface water during MP sampling with a portable flowmeter (Flo-mate Model 2000; Marsh-McBirney Inc.). Measurements were not always possible or reliable due to challenging conditions, especially low water flow close to the shore, and the limitation of the instruments’ accuracy [±2% plus zero stability (1.5 m s−1)].
Daily precipitation data were obtained from Prevision-Meteo (2023) for three weather stations for the months of the sampling campaigns. Data from station Paris-Montsouris, located in central Paris, were used for sampling sites M1, S2, S3, S4, and S5. Precipitation data from Paris Melun-Villaroche and Evreux-Fauville were related to sampling sites S1 and S6, respectively.
2.1.2.4 Data on sewage discharges as microplastic sources
The acquired data include locations and daily discharge volumes for five selected WWTP effluent locations and twelve of 38 CSO outfall locations, each holding >1% of discharge and together presenting 91% of the CSO volumes discharged during the monitoring period (Figures 1B, C). Data were provided by SIAAP. The CSO outfall sites Clichy and La Briche are located downstream of sampling site S3, holding 31% and 25%, respectively.
Four large WWTPs are located along the Seine in the Paris urban area. Notably, the WWTP Paris Seine-Amont (SAM) is located a few kilometers before sampling site S2, while the WWTP Seine-Centre (SEC) is upstream of site S4. WWTPs Seine-Aval (SAV) and Seine Grésillons (SEG) are between S4 and S5. WWTP Marne Aval (MAV) is in the Marne River and related to sampling site M1.
2.2 Data analysis
We used the free software for statistical computing R (version 4.3.0) to conduct the data analyses (R Core Team, 2021). A Non-parametric Spearman rank test was applied to assess correlations between variables. Replicates of physical water parameters were averaged. For MP summary (Supplementary Material) MP (mass) concentrations and fluxes were reported as a sum of all individual particles per sample. MP polymer type proportions and sizes per campaign were weighted by sample size.
2.2.1 Microplastic data
MP data exploration followed the protocol outlined by Zuur et al. (2010). Some particles with major dimension above 300 µm (6.2%) went through the filter during sampling. For comparability, MP particles from 25 to 300 µm were analyzed. The size limits were chosen to focus on smaller MP with comparability to other studies (Dris et al., 2024).
MP numeric (further on referred to as MP concentration) and mass concentrations (Eqs 1, 2) were calculated as the number of observations (N) or particle mass divided by the sampling volume (VS) of the respective sample and converted into number of particles m−3 and µgL−1. The concentrations were estimated for different groups, e.g., per campaign and sampling site, and polymer type.
The MP (mass) flux (Eqs 3, 4) was calculated as MP (mass) concentration multiplied by the river discharge (Q) per sampling event as particles s−1 or mg s−1.
2.2.2 Water balance
For the 1-year monitoring period (with sampling durations of about 2 weeks per campaign) a water balance (Supplementary Material S5) of the Seine River discharge was conducted to quantify the hydrodynamic conditions and to study MP transport and fate. Balances were generated for the hydrological stations in the Seine. Discharge data of the Seine and tributaries were considered. The balances were calculated as the differences between the inflows and outflows. The downstream discharge Qx (Eq. 5) is the sum of the previous upstream discharge (Q0) and the incoming tributary discharges (Qi) between Q0 and Qx. Acknowledging that ground water flow into the river and evaporation are to be assumed negligible with respect to the discharge, the difference (Eq. 6) should be close to 0 m3s−1.
3 Description of the data and initial analyses
3.1 Microplastics
The dataset contains comprehensive data of individual MP particles (total N = 5,922) per sampling site and sampling day, detailing particle characteristics (mass, polymer type, minor, major, and ferret dimension). For number and mass, MP concentrations and MP fluxes were estimated for each campaign per sampling date, and sampling site (Figures 2B, C; Supplementary Material MP summary). The median MP concentration was ∼600 particles m−3 and MP flux 165 × 103 particles s−1. MP mass concentrations and mass fluxes ranged between 2 and 960 mg m−3, and 57 and 500 × 103 mg s−1, respectively. The annual estimated MP concentration and MP mass flux in the Seine are 5.19 × 10¹² particles yr−1 and 816 t yr−1, respectively.
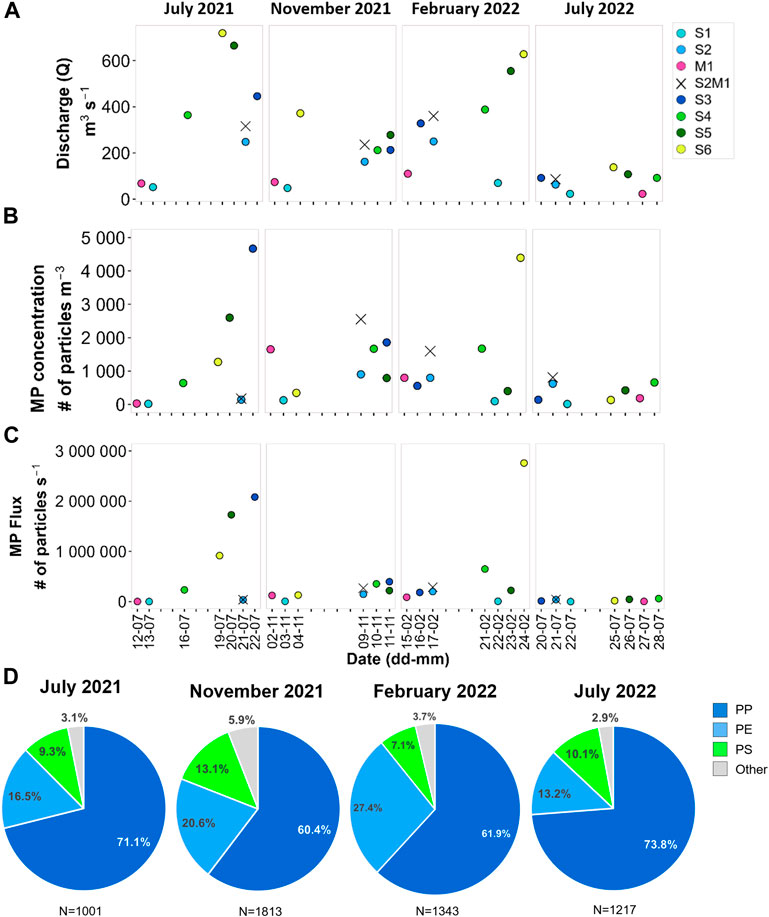
Figure 2. Graphs (A–C) show data on River discharge, microplastic (MP) concentration, and MP flux, respectively, along the period (x-axis, date indicating day-month) of the four sampling campaigns (panel headings) for each sampling site (legend), # indicating number. Because site M1 presents a potential MP contribution from the Marne River into the Seine River, we have combined the values from sites S2 and M1 (S2M1) to enhance comparability with the subsequent downstream site S3. (D) Pie charts of the proportions per sampling campaign based on numeric concentration of polypropylene (PP), polyethylene (PE), polystyrene (PS), and all other detected polymer types. N = Number of particles per campaign, sampling site M1 was excluded.
MP concentrations varied across sampling sites and campaigns between 14 particles m−3 (S1) and 4,700 particles m−3 (S3). MP fluxes ranged from 300 particles s−1 (S1) to 2.67 × 10⁶ particles s−1 (S6). For each campaign, the lowest MP concentrations were always found at the upstream sampling site S1. The MP fluxes for S1 (ranging from 300 to 6,000 particles s−1) are smaller than the MP flux values of sampling sites S2–S6 (ranging between 13 × 103 and 2.76 × 10⁶ particles s−1), with a median of 165 × 103 particles s−1. MP concentration correlates moderately (ρ = 0.65, p < 0.01) to river discharge, MP (mass) flux (ρ = 0.89, p<0.01; ρ = 0.85, p < 0.01) correlates stronger to river discharge.
The MP concentrations in the Seine are comparable to higher concentrations reported in European rivers’ surface water (Gao et al., 2023).
Sixteen polymer types were identified including acrylics, epoxy and rubber (Supplementary Material S5), and the most abundant polymer types across all Seine samples were polypropylene (PP) (concentration: 67%, mass concentration: 48%), polyethylene (PE) (19%, 38%), and polystyrene (PS) (10%, 10%), reflecting similar findings in European rivers (Scherer et al., 2020; Gao et al., 2023; Sefiloglu et al., 2024). The polymer type distribution is relatively consistent across the four campaigns (Figure 2D) and similar across sampling sites with deviations observed for some individual samples (Supplementary Material S5). The median MP particle minor and major dimensions overall were 53 µm and 96 µm (Supplementary Material S6). Smaller MPs consistently exhibited higher MP concentrations and fluxes across all samples. PE particles are found to be larger than PS and PP (PP exhibits the smallest major dimensions overall).
3.2 Physical water quality parameters
Suspended sediment concentration (SSC) ranged from 0.5 mg L−1 (S1) to 51.7 mg L−1 (S3). Turbidity values ranged from 2.6 to 23.7 NTU, pH was between 7.5 and 8.3, and water temperatures ranged from 7°C to 26°C. Spearman correlation tests resulted in turbidity and SSC, as expected due to collinearity, being correlated (ρ = 0.77, p < 0.05). Turbidity correlated with MP concentration (ρ = 0.50, p < 0.05) and flux (ρ = 0.64, p < 0.05).
3.3 Hydrological conditions
The flow regimes during the monitoring did not conform to the habitual low flows during summer and high flows during winter. High precipitation in July 2021 in Western Europe influenced the summer flow in the Seine. On the contrary, fall has been dry leading to low flows. We captured different river discharge conditions ranging from 23 to 719 m3s−1 (Figure 2A). River discharges on sampling days across all Seine sampling sites (S1-S6) were higher during the July 2021 and February 2022 campaigns (range, median: 52–719, 364 m3s−1; and 70–628, 328 m3s−1, respectively), but lower in November 2021 (48–327, 212 m3s−1), and lowest during July 2022 (23–138, 92 m3s−1). The dataset contains the river discharge for each relevant sampling.
Water balances are important for evaluating MP flux and concentration observations. Fluctuations in river discharge and deviations in the water balances can be used to understand MP dynamics. For example, the MP concentration in the Seine River may be elevated due to tributary contribution, sewage overflow and runoff during peak discharge. Five water balance calculations with daily river discharge data were conducted (Supplementary Material S7). As a result of the discharge differences, the balances show deviations around normal levels (up to ∼10%). Discharge data per hydrostation are included in the Supplementary Material (Water-balance).
We collected precipitation data concerning the monitoring period (from 2 weeks before the start of a sampling campaign until the end) to later assess its influence on the river flow dynamics and MP concentration. Precipitation can lead to increased river discharge, turbulence, CSOs, and surface runoff, potentially transporting MPs into rivers.
3.4 Sewage discharges
Between 1 July 2021, and 1 August 2022, WWTP effluent daily discharge volumes (Supplementary Material WWTP discharges) range from around 150 × 103–1 × 10⁶ m3 day−1 (SAM), 1 × 10⁶–3.4 × 10⁶ m3 day−1 (SAV), up to 500 × 103 m3 day−1 (SEC), 30 × 103–325 × 103 m3 day−1 (SEG), and 14 × 103–100 × 103 m3 day−1 (MAV).
Up to 47 CSOs happened during the 1-year monitoring period. Several CSOs were recorded just before and during the sampling campaign in July 2021, and one CSO event before the campaign in November 2021 for CSO outfall sites La Briche and Clichy (Supplementary Material CSO discharges). The maximum daily discharge volumes during the monitoring periods occurred on 13 July 2021, and were 945 × 103 m3 (Clichy) and 963 × 103 m3 (La Briche). Other CSO outfall sites contribute significantly to the annual CSO discharge.
4 Conclusion and potential uses of this dataset
This dataset presents comprehensive data of MP contamination in the Seine River and various environmental and hydrological conditions. Preliminary results show that MP levels are locally highly variable which may be attributed to hydrological conditions. This report facilitates the calculation of MP contamination metrics, analysis of relationships with environmental and hydrological variables, and the assessment of the environmental impact. The knowledge derived from analyses offers insights for research, modelling, environmental education, and policy of MP pollution in rivers. The dataset can be augmented with future data.
Data availability statement
The datasets presented in this study can be found in online repositories. The names of the repository/repositories and accession number(s) can be found below: https://zenodo.org/records/10658366?token=eyJhbGciOiJIUzUxMiJ9.eyJpZCI6IjFiMGY2ZGNiLTcyYWUtNGNmOC05ZmNhLWZhZDZmN2FlMTBmNSIsImRhdGEiOnt9LCJyYW5kb20iOiI2NWUyNzk2Y2U3YWVhNmMxMWZkNGRkMjZlMTE2YjJiZSJ9.32rBjQV o7DJShBEGzbdlzurmySXmwDPYTnNiCLOQSniiEm7y5ohgmAB5lxIR1gbFUwX_iORsbxZB-fvXQrJzg, Zenodo LimnoPlast.
Author contributions
CS: Conceptualization, Data curation, Formal Analysis, Investigation, Methodology, Project administration, Visualization, Writing–original draft, Writing–review and editing. RD: Conceptualization, Writing–review and editing, Funding acquisition, Investigation, Methodology, Supervision, Project administration. JG: Conceptualization, Funding acquisition, Methodology, Supervision, Writing–review and editing. FB: Formal Analysis, Methodology, Supervision, Writing–review and editing. AM: Formal Analysis, Methodology, Supervision, Writing–review and editing. SG: Resources, Writing–review and editing. AV: Methodology, Supervision, Writing–review and editing. BT: Conceptualization, Funding acquisition, Investigation, Methodology, Project administration, Supervision, Writing–review and editing.
Funding
The author(s) declare that financial support was received for the research, authorship, and/or publication of this article. This project has received funding from the European Union’s Horizon 2020 research and innovation programme under grant agreement No. 860720.
Acknowledgments
This study was performed as part of a Ph.D. project in the project LimnoPlast: Microplastics in Europe’s Freshwater Ecosystems: from sources to solutions. We would like to express great gratitude to every person who has helped for preparation, in the field, in the laboratory, and for expert input: Mohamed Saad, Philippe Dubois, Azeez Odofin, Daniela Castro, Ayoub Elcadi, Öykü Sefigolu, Guilherme Calabro, Robin Richoux, Erwan Garcia Gonzales, Nadia Bouzid, Gabriël Olthof, Maryem Mehboob, Minh-Trang Nguyen, Robin Treilles, Jean-Sebastien Barbier, Max Beaurepaire, Sinimar Awad, and Cérine Hadjebar. We thank the OSU-Efluve for access to the µ-FTIR instrument granted by the PRAMMICS platform. A special thanks goes to PIREN-Seine and MeSeine Innovation SIAAP program for financial support.
Conflict of interest
The authors declare that the research was conducted in the absence of any commercial or financial relationships that could be construed as a potential conflict of interest.
Publisher’s note
All claims expressed in this article are solely those of the authors and do not necessarily represent those of their affiliated organizations, or those of the publisher, the editors and the reviewers. Any product that may be evaluated in this article, or claim that may be made by its manufacturer, is not guaranteed or endorsed by the publisher.
Supplementary material
The Supplementary Material for this article can be found online at: https://www.frontiersin.org/articles/10.3389/feart.2024.1386547/full#supplementary-material
References
Amobonye, A., Bhagwat, P., Raveendran, S., Singh, S., and Pillai, S. (2021). Environmental impacts of microplastics and nanoplastics: a current overview. Front. Microbiol. 12, 768297. doi:10.3389/fmicb.2021.768297
Birch, Q. T., Potter, P. M., Pinto, P. X., Dionysiou, D. D., and Al-Abed, S. R. (2020). Sources, transport, measurement and impact of nano and microplastics in urban watersheds. Rev. Environ. Sci. Bio/Technology 19 (2), 275–336. doi:10.1007/s11157-020-09529-x
Cowger, W., Booth, A. M., Hamilton, B. M., Thaysen, C., Primpke, S., Munno, K., et al. (2020). Reporting guidelines to increase the reproducibility and comparability of research on microplastics. Appl. Spectrosc. 74 (9), 1066–1077. doi:10.1177/0003702820930292
Dris, R., Beaurepaire, M., Bouzid, N., Stratmann, C., Nguyen, M. T., Bordignon, F., et al. (2024). “Chapter 3 - sampling and analyzing microplastics in rivers: what methods are being used after a decade of research?,” in Microplastic contamination in aquatic environments. Editor E. Y. Zeng Second Edition (Elsevier), 65–91. doi:10.1016/B978-0-443-15332-7.00013-2
Dris, R., Gasperi, J., Rocher, V., Saad, M., Renault, N., and Tassin, B. (2015). Microplastic contamination in an urban area: a case study in Greater Paris. Environ. Chem. 12 (5), 592. doi:10.1071/EN14167
Fahrenfeld, N. L., Arbuckle-Keil, G., Naderi Beni, N., and Bartelt-Hunt, S. L. (2019). Source tracking microplastics in the freshwater environment. TrAC Trends Anal. Chem. 112, 248–254. doi:10.1016/j.trac.2018.11.030
Flipo, N., Gallois, N., Labarthe, B., Baratelli, F., Viennot, P., Schuite, J., et al. (2020). “Pluri-annual water budget on the Seine basin: past, current and future trends,” in The Seine River basin. Editors N. Flipo, P. Labadie, and L. Lestel (Springer International Publishing), 59–89. doi:10.1007/698_2019_392
N. Flipo, P. Labadie, and L. Lestel (2021). The Seine River basin (Springer International Publishing). doi:10.1007/978-3-030-54260-3
Gao, S., Orlowski, N., Bopf, F. K., and Breuer, L. (2023). A review on microplastics in major European rivers. WIREs Water 11, e1713. doi:10.1002/wat2.1713
Hydro Eaufrance (2023). HydroPortail. Available at: https://www.hydro.eaufrance.fr/.
Kumar, R., Kumar, R., Sharma, P., Manna, C., Manna, C., Jain, M., et al. (2021). Abundance, interaction, ingestion, ecological concerns, and mitigation policies of microplastic pollution in riverine ecosystem: a review. Sci. Total Environ. 782, 146695. doi:10.1016/j.scitotenv.2021.146695
Lehner, B., and Grill, G. (2013). Global river hydrography and network routing: baseline data and new approaches to study the world’s large river systems. Hydrol. Process. 27 (15), 2171–2186. doi:10.1002/hyp.9740
Li, C., Busquets, R., and Campos, L. C. (2020). Assessment of microplastics in freshwater systems: a review. Sci. Total Environ. 707, 135578. doi:10.1016/j.scitotenv.2019.135578
Li, S., Wang, H., He, Y., Liang, D., Shen, Y., Gu, Q., et al. (2023). How microplastic loads relate to natural conditions and anthropogenic activities in the Yangtze river basin. Chemosphere 342, 140146. doi:10.1016/j.chemosphere.2023.140146
Miranda, M. N., Silva, A. M. T., and Pereira, M. F. R. (2020). Microplastics in the environment: a DPSIR analysis with focus on the responses. Sci. Total Environ. 718, 134968. doi:10.1016/j.scitotenv.2019.134968
Nakajima, R., Tsuchiya, M., Lindsay, D. J., Kitahashi, T., Fujikura, K., and Fukushima, T. (2019). A new small device made of glass for separating microplastics from marine and freshwater sediments. PeerJ 7, e7915. doi:10.7717/peerj.7915
Nguyen, M. T., Phuong, N. N., Saad, M., Tassin, B., Gillet, T., Guérin-Rechdaoui, S., et al. (2024). Microplastic accumulation in sewer sediments and its potential entering the environment via combined sewer overflows: a study case in Paris. Environ. Sci. Pollut. Res. 31, 10501–10507. doi:10.1007/s11356-023-31734-8
OECD (2012). Redefining “urban”—a new way to measure metropolitan areas. Available at: https://www.oecd-ilibrary.org/content/publication/9789264174108-en.
Prevision-meteo (2023). Daily climate. Available at: https://prevision-meteo.ch/.
Primpke, S., Cross, R. K., Mintenig, S. M., Simon, M., Vianello, A., Gerdts, G., et al. (2020). Toward the systematic identification of microplastics in the environment: evaluation of a new independent software tool (siMPle) for spectroscopic analysis. Appl. Spectrosc. 74 (9), 1127–1138. doi:10.1177/0003702820917760
R Core Team (2021). R: a language and environment for statistical computing. Vienna, Austria: R Foundation for Statistical Computing. Available at: https://www.R-project.org/.
Rist, S., Vianello, A., Winding, M. H. S., Nielsen, T. G., Almeda, R., Torres, R. R., et al. (2020). Quantification of plankton-sized microplastics in a productive coastal Arctic marine ecosystem. Environ. Pollut. 266, 115248. doi:10.1016/j.envpol.2020.115248
Scherer, C., Weber, A., Stock, F., Vurusic, S., Egerci, H., Kochleus, C., et al. (2020). Comparative assessment of microplastics in water and sediment of a large European river. Sci. Total Environ. 738, 139866. doi:10.1016/j.scitotenv.2020.139866
Sefiloglu, F. Ö, Stratmann, C. N., Brits, M., Van Velzen, M. J. M., Groenewoud, Q., Vethaak, A. D., et al. (2024). Comparative microplastic analysis in urban waters using μ-FTIR and Py-GC-MS: a case study in Amsterdam. Environ. Poll. 351, 124088. doi:10.1016/j.envpol.2024.124088
Treilles, R., Gasperi, J., Tramoy, R., Dris, R., Gallard, A., Partibane, C., et al. (2022). Microplastic and microfiber fluxes in the Seine River: flood events versus dry periods. Sci. Total Environ. 805, 150123. doi:10.1016/j.scitotenv.2021.150123
Wagner, M., Monclús, L., Arp, H. P. H., Groh, K. J., Løseth, M. E., Muncke, J., et al. (2024). State of the science on plastic chemicals—identifying and addressing chemicals and polymers of concern. [object Object]. doi:10.5281/ZENODO.10701706
Keywords: microplastic fluxes, water balance, river catchment, urban plastic pollution, sewer discharges
Citation: Stratmann CN, Dris R, Gasperi J, Buschman FA, Markus AA, Guerin S, Vethaak AD and Tassin B (2024) Monitoring microplastics in the Seine River in the Greater Paris area. Front. Earth Sci. 12:1386547. doi: 10.3389/feart.2024.1386547
Received: 15 February 2024; Accepted: 07 May 2024;
Published: 12 June 2024.
Edited by:
Uwe Schneidewind, University of Birmingham, United KingdomReviewed by:
Reza Dehbandi, University of Birmingham, United KingdomMohammad Wazne, Université Claude Bernard Lyon 1, France
Copyright © 2024 Stratmann, Dris, Gasperi, Buschman, Markus, Guerin, Vethaak and Tassin. This is an open-access article distributed under the terms of the Creative Commons Attribution License (CC BY). The use, distribution or reproduction in other forums is permitted, provided the original author(s) and the copyright owner(s) are credited and that the original publication in this journal is cited, in accordance with accepted academic practice. No use, distribution or reproduction is permitted which does not comply with these terms.
*Correspondence: Cleo N. Stratmann, Yy5zdHJhdG1hbm5AcG9zdGVvLmRl; Rachid Dris, cmFjaGlkLmRyaXNAdS1wZWMuZnI=
†Deceased