- 1Department of Land Surveying and Geo-Informatics, Hong Kong Polytechnic University, Kowloon, Hong Kong SAR, China
- 2Laboratory of Geomechanics, Sсhmidt Institute of Physics of the Earth of the Russian Academy of Sciences, Moscow, Russia
We investigate the evolution of horizontal stress field after implementing a supercontinent into spherical mantle model with phase transitions, the temperature- and pressure-dependent rheology, while assuming that the mantle is heated from the base and from within. Before implementation of the supercontinent, the overlithostatic horizontal stresses in the areas of mantle upwellings/downwellings are about ±25 MPa and more, whereas for the rest upper mantle horizontal stresses are in the range of ±15 MPa. The supercontinent covered one-third of the Earth`s surface and it is modeled as an undeformable, highly viscous immobile lid with respect to the ambient mantle and it is abruptly imposed on well-developed mantle convection. The area of supercontinent is limited by a spherical angle (θ ≤ 66.4◦). After implementation, the mantle flow is rearranged and a group of upwelling mantle flows is formed under the supercontinent and their hot heads increase in size due to the heat-insulating effect of the supercontinent, while quasi-linear subduction zones increase in the oceanic regions. As a result, the average temperature of the area under the supercontinent rises over time and becomes higher than the average temperature of the suboceanic area, where cold descending mantle flows intensify. Аt the depth covering the interval from 300 to 400 km under the supercontinent the temperature rises on average by 60 K. Formed under the supercontinent, upwelling mantle flows dramatically change the stress pattern in the supercontinental area producing tensional stresses in the supercontinent and overlithostatic compressive horizontal stresses in the subcontinent mantle. Tensile overlithostatic horizontal stresses inside the supercontinent change from 25 to 50 MPa in different continental areas, whereas beneath the supercontinent the overlithostatic compressive horizontal stresses in the subcontinent mantle are about 20–60 МPа. Only for the model with weak zone around the supercontinent stresses can reach 100 MPa.
1 Introduction
Geological and palaeo-magnetic evidence suggests the formation of several supercontinents during the Earth’s history (e.g., Rogers, 1996; Meert, 2002; Zhao et al., 2004; Rogers and Santosh, 2009; Piper, 2010; Pesonen et al., 2012; Zhang et al., 2012; Nance et al., 2014; Mitchell et al., 2021). The relationship between the supercontinent cycle and various geological and tectonic events have been investigated in numerous studies, such as orogenic formations (Hoffman, 1991), sea level variations (Anderson, 1982), and flood basalt volcanism (Courtillot and Renne, 2003; Condie, 2004). The effect of a super-continent cycle on the climate was studied by Donnadieu et al. (2004), Rogers and Santosh (2004), Nance et al. (2014) and others.
The influence of supercontinents on 3D mantle convection has been investigated numerically, for instance, by Lowman and Gable (1999), Yoshida et al. (1999), Honda et al. (2000), Phillips and Bunge (2005), Phillips and Bunge (2007), Zhong et al. (2007), Li and Zhong (2009), Yoshida (2010), Heron and Lowman (2011), Yoshida (2013), Yoshida (2019), Lobkovsky and Kotelkin (2015), Zhang et al. (2018), Mao et al. (2019), Yoshida (2019), and others. These studies revealed that, due to the influence of the supercontinent, the mantle flow is rearranged and a group of mantle plumes appears under the supercontinent after some time. Nevertheless, the stress variations with depth from the lithosphere to lower mantle are still poorly understood. At the same time, tensile stresses in the supercontinent are connected with stresses in the surrounding mantle and show in what state it is at the current stage.
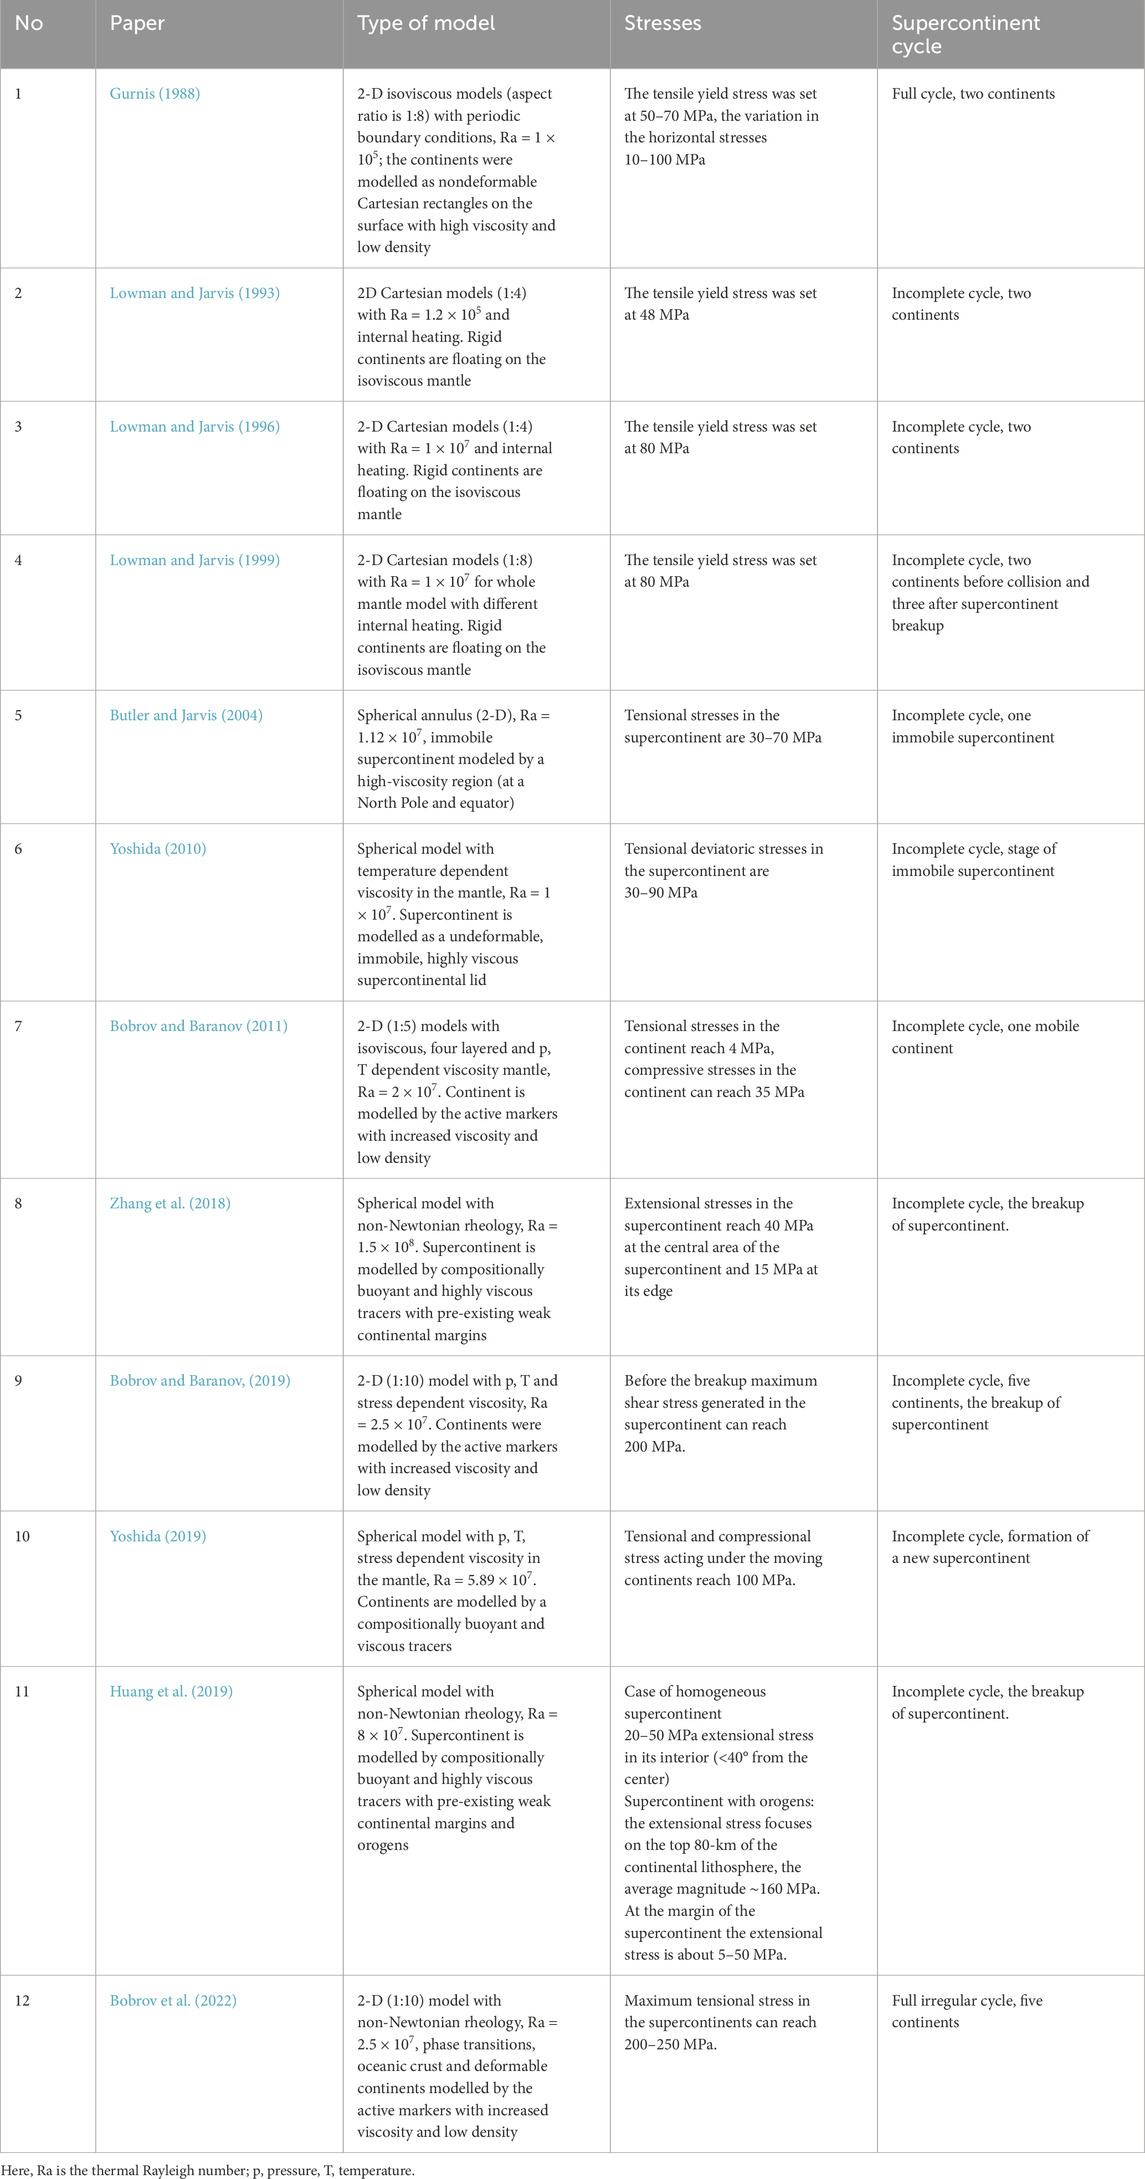
The studies where stresses during the supercontinent cycle were investigated are presented in Table 1. Tensional stresses in the supercontinent change in a rather wide range from 30 MPa (Yoshida, 2010) to about 100 MPa (Yoshida, 2019) or even 200 MPa (Bobrov and Baranov, 2019; Bobrov et al., 2022). For spherical models, the stresses were calculated, for example, by Yoshida (2010), Huang et al. (2019) and Yoshida (2019). The magnitude of critical stresses required for a supercontinent to disintegrate depends on the model and rheology of the mantle as well as how the supercontinent is constructed. In studies where the self-consistent supercontinent formation model is used, this leads to the inherited heterogeneities (e.g., previous orogens) allowing for the localization of deformation under tensile stresses.
Despite numerous studies investigated convection in the mantle and the lithosphere, the stress evolution in time and space is not yet fully understood, particularly the evolution of stresses in the supercontinent. We address this aspect here by investigating the stresses in the supercontinent and in the mantle, while adopting a 3-D spherical model with the pressure- and temperature-dependent viscosity and phase transitions. In our calculations, the immobile supercontinent is modeled as an undeformable area with a high viscosity (1,000 units in non-dimensional form, here 1 unit is taken equal to 0.5 × 10²² Pa s). The supercontinent is implemented instantaneously on a well-developed mantle convection pattern.
Below we present a brief overview of theoretical and numerical models. The results of numerical modeling are presented in Section 3 and discussed in Section 4. The study is concluded in Section 5.
2 Numerical model setup
2.1 Theoretical model and governing equations
We modeled the Earth’s mantle as the Boussinesq fluid with the infinite Prandtl number in a 3D spherical geometry. The mantle is heated from the core and from within by decay of radioactive elements (internal heating). In our model for spherical mantle convection, the dimensionless equations for conservation of mass, momentum, and energy read (e.g., McNamara and Zhong, 2004; Zhong et al., 2007; Bobrov and Baranov, 2014; Bobrov and Baranov, 2016; Bobrov and Baranov, 2018):
where v is the velocity vector; p is the dynamic pressure; τ is the deviatoric tensor of viscous stresses; T is the temperature; t is the time,
According to the parameters summarized in the preceding paragraph, Ra =
The scaling factors for the variables in Equations 1–3 are: R for the length, R2/κ for the time, κ/R for the velocity, and κ
The horizontal overlithostatic stress, in particular lateral normal stresses σθθ, which are oriented along the surface, and directed along the change in latitude θ,is defined by (Schubert et al., 2001):
where
With the definition taken here (Equations 4, 5), the compressive stresses are negative. For both, p and τ, the dimensional unit σ is
The non-dimensional depth (r) and temperature-dependent viscosity are defined as follows:
where ηz is the depth pre-factor, and E is the activation energy of olivine.
2.2 Modeling parameters and initial conditions
Our numerical model has six parameters, specifically the thermal Rayleigh number Ra, two phase Rayleigh numbers
The modelled supercontinent has the shape of a spherical cap centered at the South Pole and is limited by a latitude of 66.4° (i.e., θ ≤ 66.4°). The sub-continental lithosphere, defined as a fixed highly viscous super-continental lid (HVSL), extends down to depth of 200 km, which is consistent with recent tomography and mantle models (Becker and Boschi, 2002; Gung et al., 2003). The HVSL has a non-dimensional viscosity of 1,000, whereas the viscosity within a surrounding mantle varies from 10–1.5 to 101.5. With such a viscosity pattern, the continent can be considered as a quasi-solid body (e.g., Trubitsyn et al., 2006). The ratio of the inner to the outer radii is 0.5448, which corresponds to the Earth’s core size.
In numerical modeling, we used the CitcomS spherical code with some original improvements (Zhong et al., 1998; Tan et al., 2002; Chuvaev et al., 2020). This code has been extensively used and thoroughly tested (e.g., Schmeling et al., 2008; Zhong et al., 2008). Here the momentum transfer (Stokes) equation was solved by the finite element method (FEM) in the natural velocity-pressure variables (Hughes, 1987) by using an iterative multigrid solution method. Details on the method applied are given in Moresi and Gurnis (1996) and Zhong et al. (2000). To improve the accuracy of solution, the code uses the Uzawa’s algorithm (Fortin and Fortin, 1985; Pelletier et al., 1989) which allowed us to obtain a velocity field for large viscosity variations. The parameter of artificial compressibility was assumed to be 5 × 10⁻⁶, and the accuracy of the Uzawa algorithm was 1 × 10⁻⁶. The heat transfer equation was solved by applying the Petrov-Galerkin method (Brooks and Hughes, 1982). The mesh is 33 × 33 × 59 × 12 cells multigrid (Zhong et al., 2000), corresponding to a vertical resolution of 50 km according to mantle tomography models (e.g., Becker and Boschi, 2002). The calculation was carried out on a personal computer with 18 GB of RAM and 8 cores (Intel Core i7) on a VmWare virtual machine by using virtualization technology (Chuvaev et al., 2020). The computation time of one model was approximately 1 month.
Firstly, we computed a pure thermal convection model until quasi steady-state solution was reached. This model started from a radial temperature profile with horizontal perturbations. After reaching a quasi-steady-state solution (temperature field), we added the supercontinent as a high viscous block and used temperature field as an initial condition to restart calculation. This method was used before, for instance, by Zhang et al. (2009), Honda et al. (2000), or Phillips and Bunge (2007).
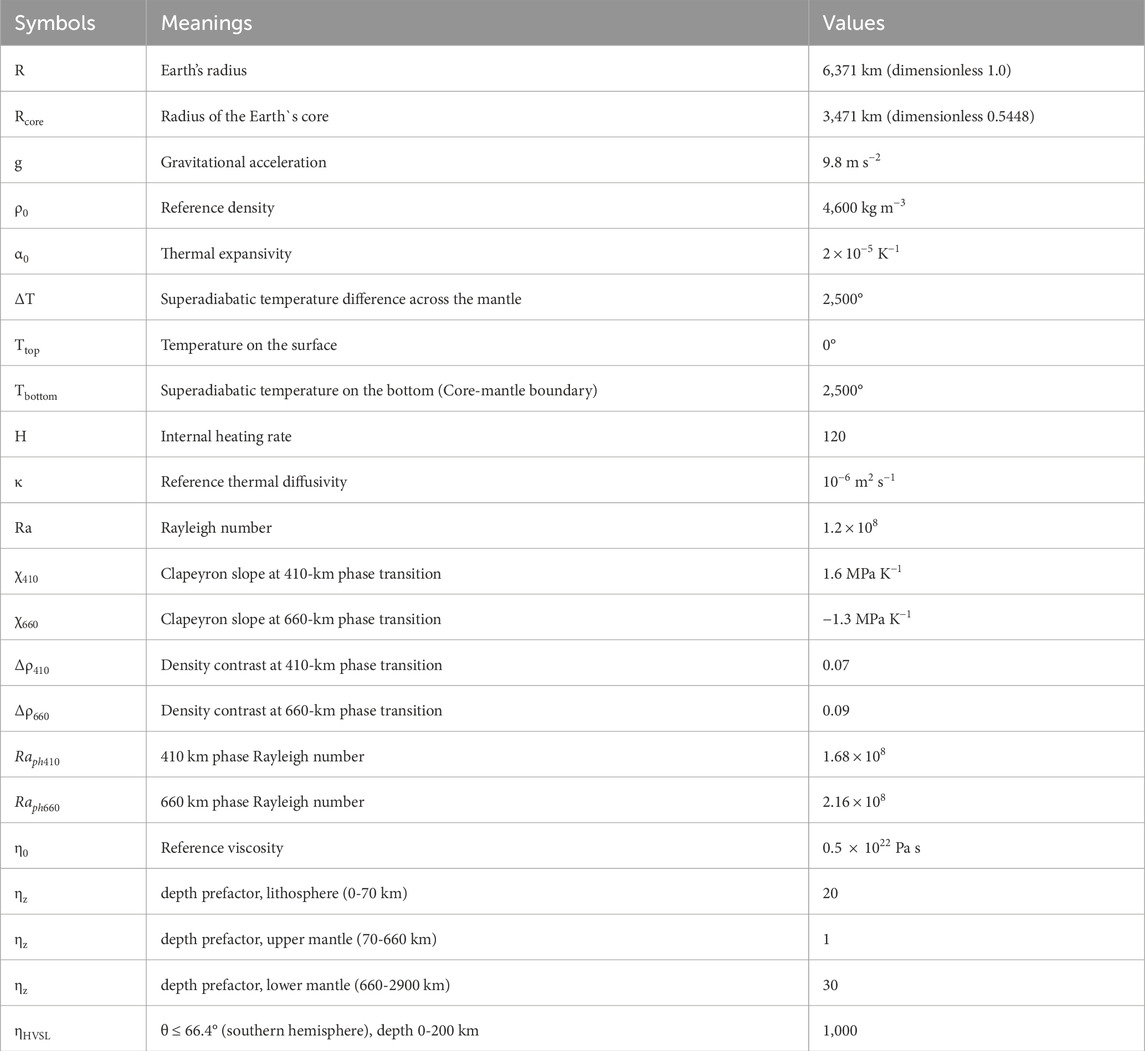
In addition to the base model (model 1), with the parameters summarized in Table 2, three other models were calculated: the model 2 with a thin supercontinent (100 km) with the same parameters as in model 1, the model 3, including a weak zone around the supercontinent, and the model 4, with the Rayleigh number halved (R = 6 × 10⁷) and with the internal heat production number halved (H = 60).
3 Results
The results of numerical modeling make it possible to identify some specific features for the fields that arise under the influence of the supercontinent. At first, the pure thermal convection model reaches the regime when the systematic trend of the solution disappears (Figure 1). Figure 1 shows the distribution of the average superadiabatic temperature (Figure 1a) and the logarithmic viscosity (Figure 1b) for the entire mantle. After that, we introduced the supercontinent as a highly viscous super-continental lid. Then we calculated the mantle convection over the period of ∼160 Ma. The mantle flow, temperature, viscosity, and the distribution of lateral stresses σθθ for different time stages and sections are presented on Figures 2–9 (base model). Figures 2, 4, 6 show calculated fields of the dimensionless temperature, the logarithmic viscosity, and the lateral stresses σθθ in the spherical section along the longitude of ф = 20° and 200° at three successive stages (0, 80, and 160 Ma). Figures 3, 5, 7 show the calculated fields of temperature and lateral stresses for the same epoch times at depths of 100 and 300 km in the Mollweide (Babinet) projection.
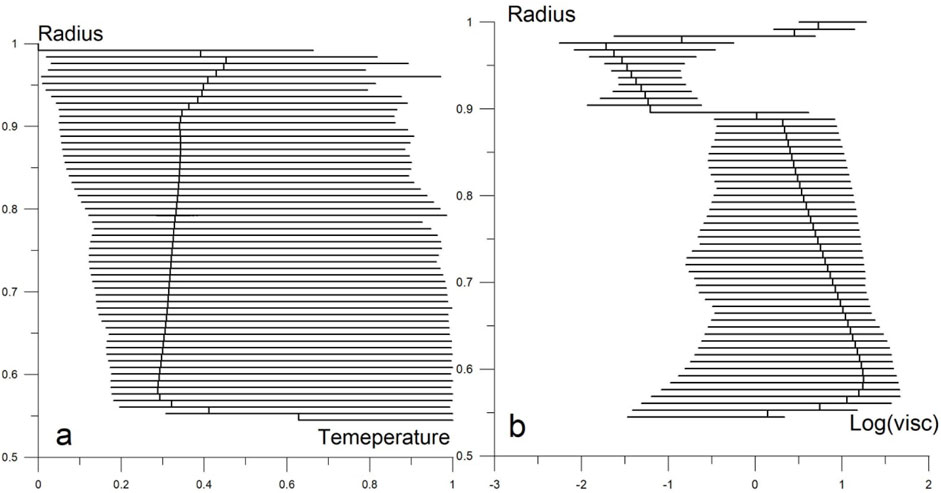
Figure 1. The mantle model for quasi-steady state without supercontinent. The depth distribution of dimensionless superadiabatic temperature (a) and viscosity (b) respectively.
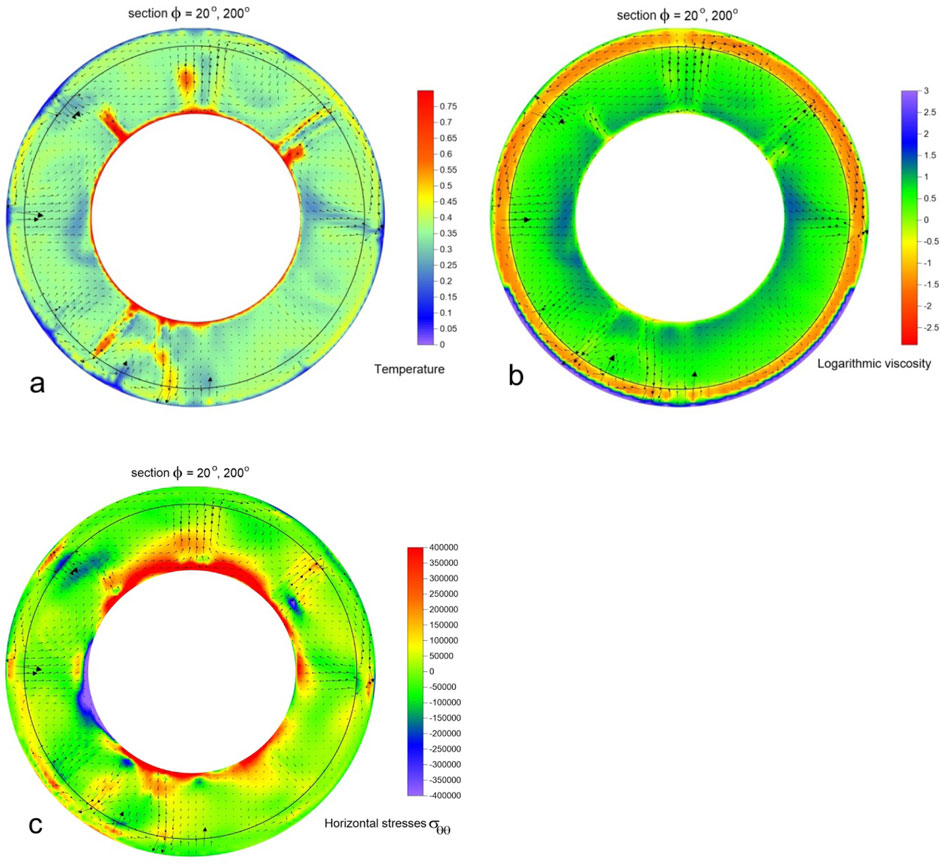
Figure 2. The base mantle model, the moment of supercontinent (200 km thickness) implementation, stage t = 0 Ma. The black ring shows the boundary of the upper mantle at a depth of 660 km. From top to bottom: (a) section φ = 20° and 200° of the spatial distribution of the dimensionless temperature, the flow velocities are shown by the black arrows; (b) section φ = 20° and 200° of the spatial distribution of the dimensionless logarithm viscosity with flow velocities; and (c) section φ = 20° and 200° of the field of the dimensionless normal horizontal stress σθθ with flow velocities.
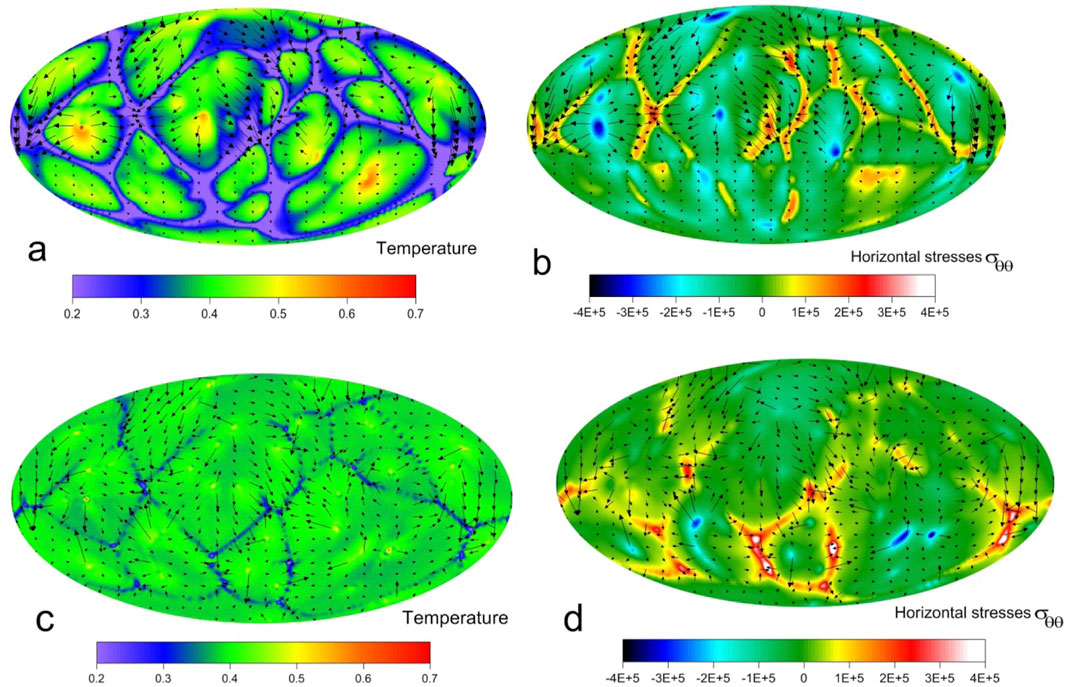
Figure 3. The base mantle model, the stage t = 0 Ma in the Mollweide (Babinet) projection. From top to bottom: (a) section on depth of 100 km, the spatial distribution of the dimensionless temperature, the flow velocities are shown by the black arrows; (b) section on depth of 100 km, the field of the dimensionless normal horizontal stress σθθ; (c) section on depth of 300 km, the spatial distribution of the dimensionless temperature, the flow velocities are shown by the black arrows; and (d) section on depth of 300 km, the field of the dimensionless normal horizontal stress σθθ.
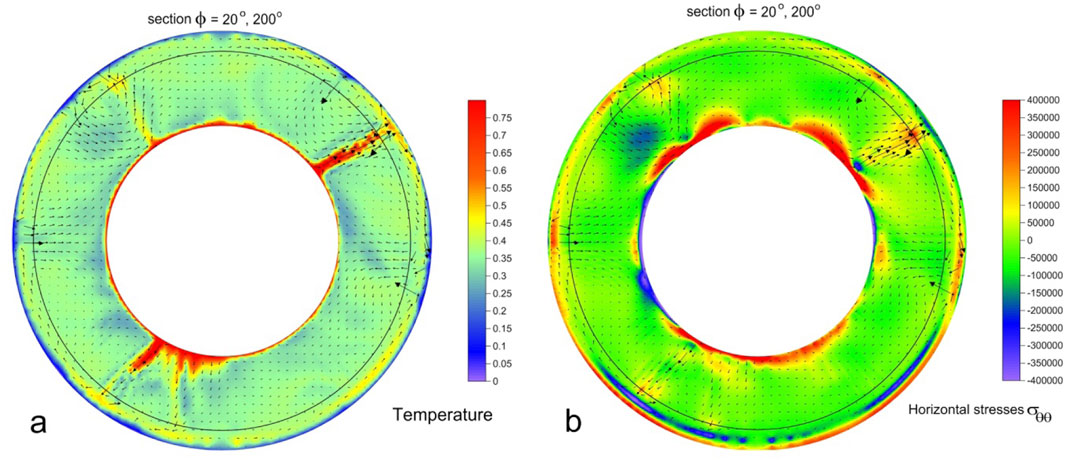
Figure 4. The base mantle model, the continent thickness is 200 km, and the stage t = 80 Ma. The black ring shows the boundary of the upper mantle at a depth of 660 km. From top to bottom: (a) section φ = 20° and 200° the spatial distribution of the dimensionless temperature, the flow velocities are shown by the black arrows; and (b) section φ = 20° and 200° the field of the dimensionless normal horizontal stress σθθ with flow velocities.
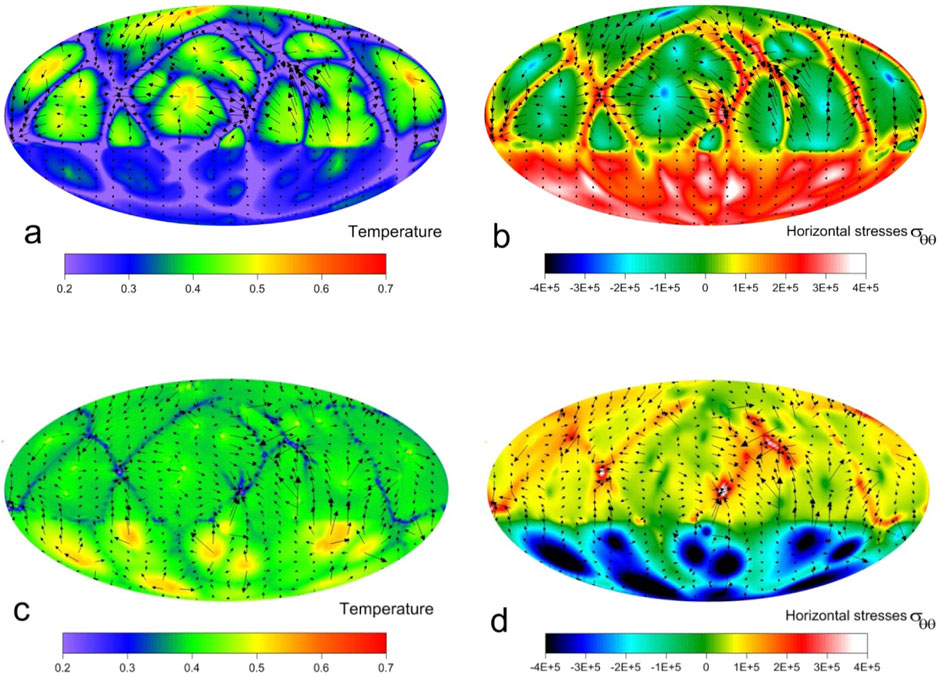
Figure 5. The base mantle model, the continent thickness is 200 km, and the stage t = 80 Ma. See Figure 3 for the legend. From top to bottom: (a) section on depth of 100 km, the spatial distribution of the dimensionless temperature, the flow velocities are shown by the black arrows; (b) section on depth of 100 km, the field of the dimensionless normal horizontal stress σθθ; (c) section on depth of 300 km, the spatial distribution of the dimensionless temperature, the flow velocities are shown by the black arrows; and (d) section on depth of 300 km, the field of the dimensionless normal horizontal stress σθθ.
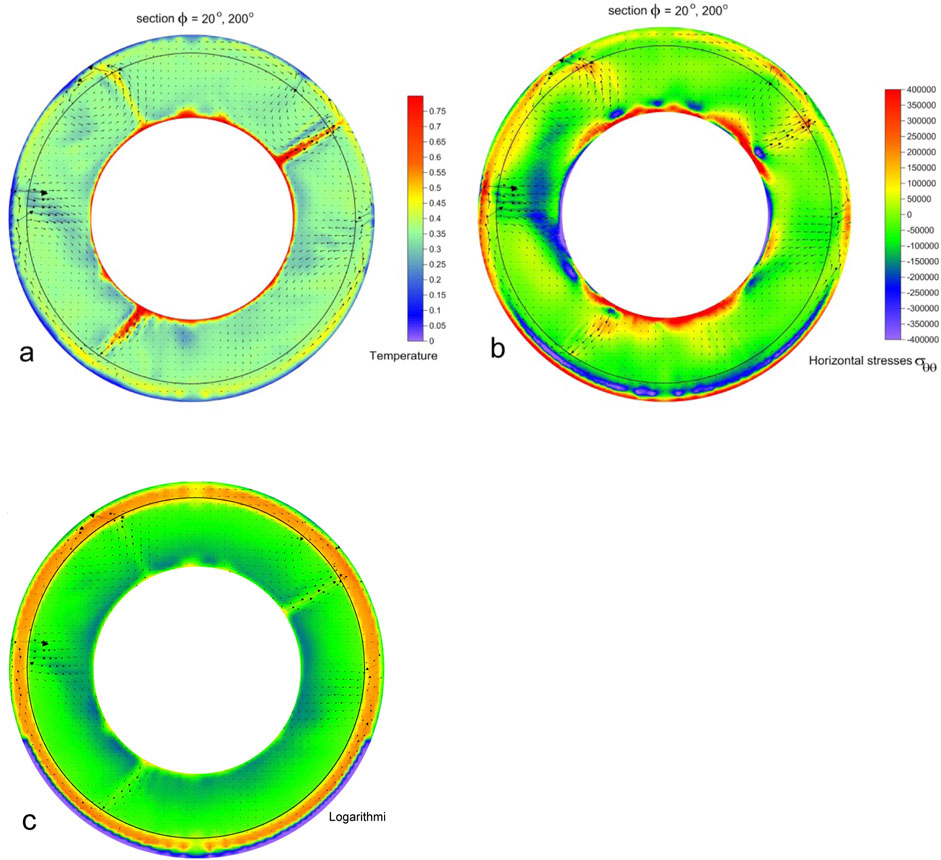
Figure 6. The base mantle model, the continent thickness is 200 km, and the stage t = 160 Ma. From top to bottom: (a) section φ = 20° and 200° the spatial distribution of the dimensionless temperature, the flow velocities are shown by the black arrows; (b) section φ = 20° and 200° the field of the dimensionless normal horizontal stress σθθ with flow velocities and (c) Section φ = 20° and 200° of the spatial distribution of the dimensionless logarithm viscosity with flow velocities.
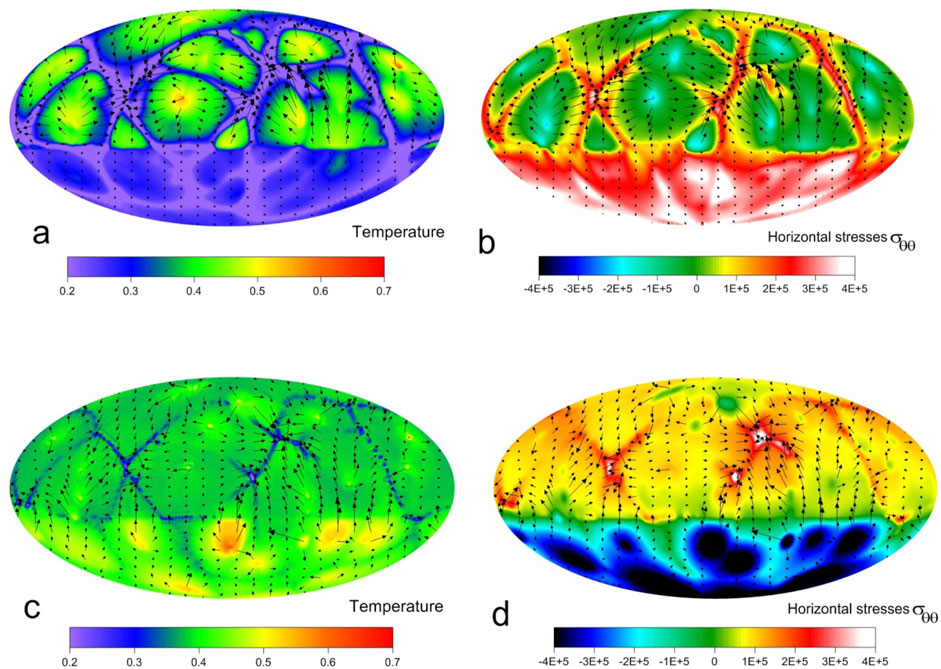
Figure 7. The base mantle model, the continent thickness is 200 km, and the stage t = 160 Ma. See Figure 3 for the legend. (a) Section on depth of 100 km, the spatial distribution of the dimensionless temperature, the flow velocities are shown by the black arrows; (b) section on depth of 100 km, the field of the dimensionless normal horizontal stress σθθ; (c) section on depth of 300 km, the spatial distribution of the dimensionless temperature, the flow velocities are shown by the black arrows; and (d) section on depth of 300 km, the field of the dimensionless normal horizontal stress σθθ.
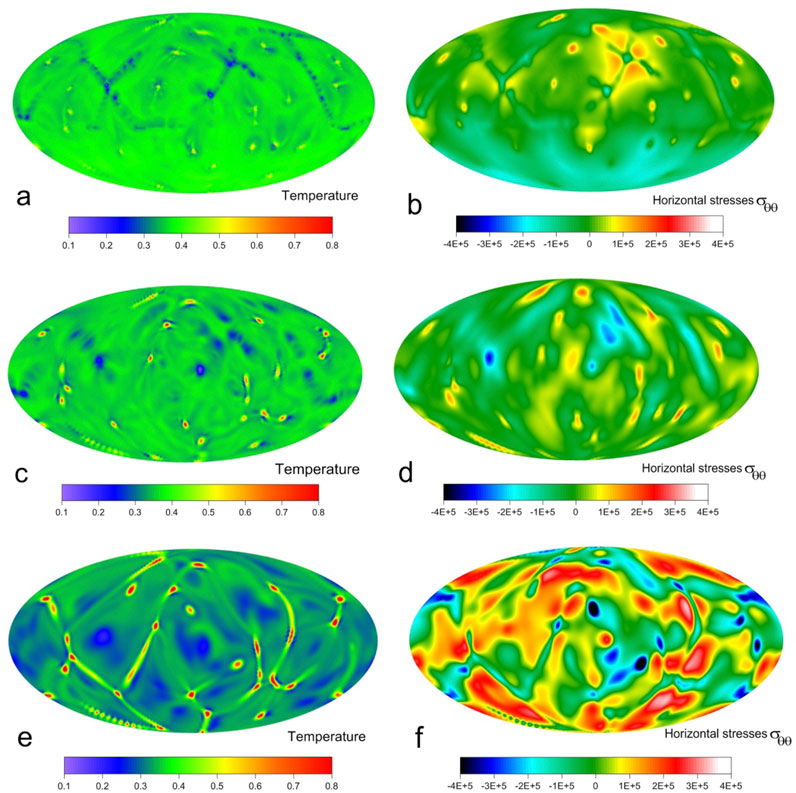
Figure 8. The base mantle model, the continent thickness is 200 km, and the stage t = 160 Ma. (a) Section on depth of 500 km, the field of the dimensionless temperature; (b) section on depth of 500 km, the field of the dimensionless normal horizontal stress σθθ; (c) section on depth of 1,500 km, the field of the dimensionless temperature; (d) section at depth of 1,500 km, the field of the dimensionless normal horizontal stress σθθ; (e) section on depth of 2,550 km, the field of the dimensionless temperature; (f) section at depth of 2,550 km, the field of the dimensionless normal horizontal stress σθθ.
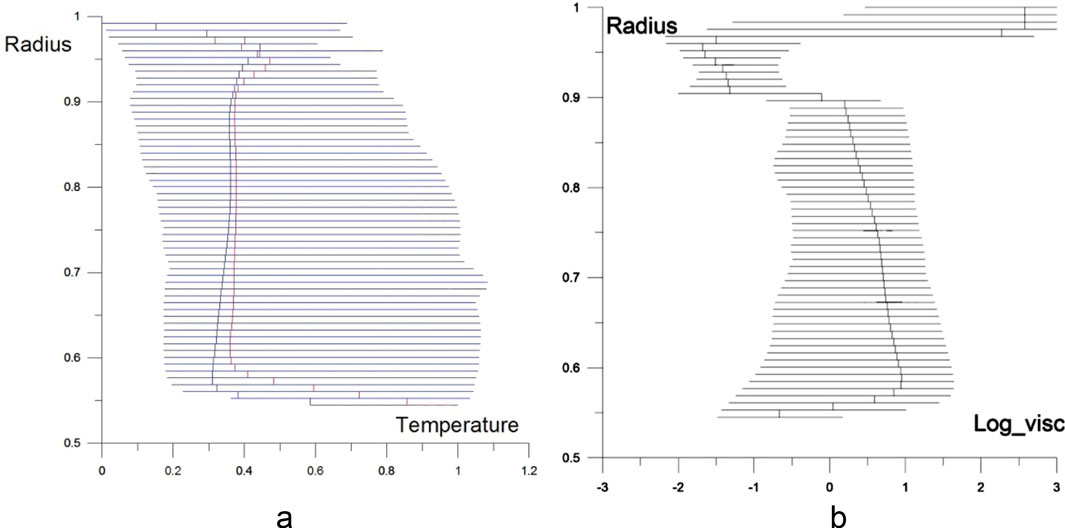
Figure 9. The mantle model, the stage t = 160 Ma. The laterally averaged depth distribution of dimensionless temperature (a) and viscosity (b) respectively. The red line shows the average temperature curve for the subcontinental area only. The blue line shows the average temperature curve for the entire mantle.
The viscosity field exhibits the presence of a supercontinent (purple surface, lower part of Figure 2b), a jump at the 660-km phase boundary as well as the temperature-dependent nature of viscosity, and the increase of viscosity with depth. The presence of phase transition at depth of 660 km with real parameters (Table 2) does not cause separation of a mantle flows between the upper and lower mantle. As a result, at the phase boundary between the lower and upper mantle only slowing down of mantle flows is detected.
Due to a viscosity jump by a factor of 30 in the lower mantle, as well as due to an endothermic phase transition at a depth of 660–670 km, mantle flows are largely forced out into the upper mantle (Figures 2, 4, 6). The centers of convective mantle cells turn out to be elevated towards the surface, as it can be seen from the velocity vectors of mantle flows. As a result, extended regions of sub-horizontal relatively fast currents appear in the upper mantle. Similar features in the convection pattern appeared with the introduction of a phase boundary at a depth of 660 km in the isoviscous (e.g., Bunge et al., 1996) and temperature-dependent viscosity models (e.g., Zhong et al., 2000).
3.1 Evolution of temperature and mantle flows
After the supercontinent implementation, the thermal-blanket effect of the supercontinent begins to influence on the mantle convection pattern. Due to a high viscosity, the velocities in the supercontinent become small and convective transport in the supercontinent stops. Only conductive heat transfer in the supercontinent takes place. As a result, the supercontinent becomes a region of low temperatures compared to the convecting mantle at the same depth, as seen in Figures 5a, 7a for the depth of 100 km. At the lower boundary of the continental lithosphere at a depth of 200 km, temperatures in the subcontinental mantle and in the continental lithosphere become equal. Below the supercontinent, positive temperature anomalies are formed due to a thermal insulation. Our numerical modeling revealed that over time, hot mantle upwellings tend to concentrate under the supercontinent, as seen in Figures 5c, 7c for the depth of 300 km. In addition, their upper part increases because it cannot effectively shed heat through a lower boundary of the supercontinent. As a result, the average temperature in the area under the supercontinent rises over time and becomes higher than the average temperature of the sub-oceanic area, where cold descending mantle currents intensify. Thus, at the depth of 100 km, the temperature in the supercontinent is lower by an average of 250 K (compared to the surrounding mantle) (see Figure 7a), while at the depth from 300 to 400 km under the supercontinent, the temperature of the subcontinental mantle is higher on average by 60 K (Figure 7c).
The phenomenon of a partial concentration of mantle upwellings under the supercontinent is already clearly manifested at t = 80 Ma after the supercontinent implementation (Figure 5c), while in the oceanic region opposite to the supercontinent, descending mantle flows are more pronounced. However, mantle upwellings continue to exist in the oceanic region, participating near the surface in the formation of convection cell structures surrounded by subduction zones (Figures 5a, 7a). Further, this feature of a mantle convection pattern is preserved (Figure 7c). Annular sections of the mantle show similar features of the temperature distribution over depth in sections of φ = 20° and 200° (Figures 4a, 6a). A subduction girdle is also formed around the supercontinent. The extent of such subduction zones is approximately more than half of its continental-oceanic boundary, e.g., (Figures 5a, 7a).
3.2 Evolution of the stress field σθθ
After the implementation of a supercontinent, the σθθ stresses in the mantle areas where there are no strong current velocity gradients (the main part of the mantle) are in the range of about ±120,000 in non-dimensional form (±15 MPa in dimensional form).
Downwelling/upwelling mantle flows differ in the σθθ stress field from the surrounding mantle regions by approximately ±200,000 (±25 MPa). These areas are clearly visible in Figures 3b–d. The strongest stresses are detected in the lowermost mantle. This might be explained by a vertical temperature gradient being stronger than at the outer surface due to the difference in the areas of these surfaces in the considered spherical problem.
After the implementation of a supercontinent in our model, stress fields in the spherical segment of supercontinent begin to change. The concentration of hot mantle flows under the supercontinent that forms as described above, significantly changes the stress pattern under and within the supercontinent. The horizontal tensional (over-lithostatic) stresses σθθ are formed in the supercontinental area (t = 80 Ma, Figure 5b). Later, the superсontinental area becomes outlined in the horizontal tensional stress field σθθ more clearly (t = 160 Ma, Figure 7b). The supercontinent is characterized by horizontal over-lithostatic tensional stresses σθθ in the range from 200,000 to 400,000 (from 25 to 50 MPa, stages t = 80 Ma, Figure 5b; t = 160 Ma; Figure 7b, red and orange colors). In contrary, after the rearranging of mantle flows under the supercontinent, these mantle upwellings produce horizontal over-lithostatic compressive stresses σθθ in the range from 160,000 to 480,000 (from 20 to 60 МРа, stages t = 80 Ma, Figure 5d; stages t = 160 Ma; Figure 7d, blue colors).
As the results of the σθθ fields show, the location of the heads of ascending mantle flows under the supercontinent is quite clearly exhibited. In the lithosphere of the supercontinent, this location is also pronounced, but somewhat less; rather, there is general stretching of the supercontinent, with some variations across its regions.
We also traced changes in the σθθ field depending on depth, for depths of 500, 1,500, and 2,550 km (Figures 8a–c). The result shows that at depth of 500 km, the difference between the sub-supercontinental region (which is generally in a state of compression, blue tones) and the suboceanic region is pronounced, but significantly less than at depth of 300 km, as discussed earlier. At depth of 1,500 km, the difference between the sub-supercontinental and suboceanic regions is manifested in the fact that all downwelling flows are located in the suboceanic region. At this depth, lateral linear structures tend to disappear, and the most intense mantle flows are subvertical and have relatively small diameter. Accordingly, the stress fields also change. As seen in Figure 8b, the stress values almost everywhere at depths of 500 and 1,500 km are much smaller than in the mantle boundary layers. Moreover, stresses also drop in submerging linear structures. At depth of 2,550 km, when the currents interact with the lower boundary of the mantle, the stresses increase substantially (Figure 8c). The appearance of quasi-linear structures is again observed, however, now these are not cold descending, but hot ascending mantle flows. At this depth, both in the temperature field and in the stress field, the influence of the supercontinent is not obvious.
Figure 9 shows the vertical distribution of the dimensionless temperature averaged laterally (that is, at a fixed value of the radius) over the entire computational area (black line), the stage t = 160 Ma after the supercontinent implementation. The horizontal bars display the temperature deviation range in the nodes from the mean value. A similar averaged temperature curve is also shown for the subcontinental area only (red line). The temperature increase below a supercontinent is clearly seen within the upper mantle. The temperature difference, however, also takes place (to a lesser extent) throughout the lower mantle, as well as in the boundary layers. In the lower boundary layer, the differences in average temperatures are pronounced. Under the supercontinent, the temperature increases up to 120 K. Thus, the effect of supercontinent is pronounced also near the lower boundary of the lower mantle. We conclude that the reason for this is the concentration of roots of ascending plumes under the continental region.
We also calculated other numerical models, for testing and comparison purposes for the same time steps. For the second model, we halved the thickness of the supercontinent to 100 km with the same other parameters. In this case extensional stresses in the supercontinent at a depth of 50 km may be 20–50 MPa whereas under the supercontinent overlithostatic compressive horizontal stresses are less than 50 MPa (Figure 10).
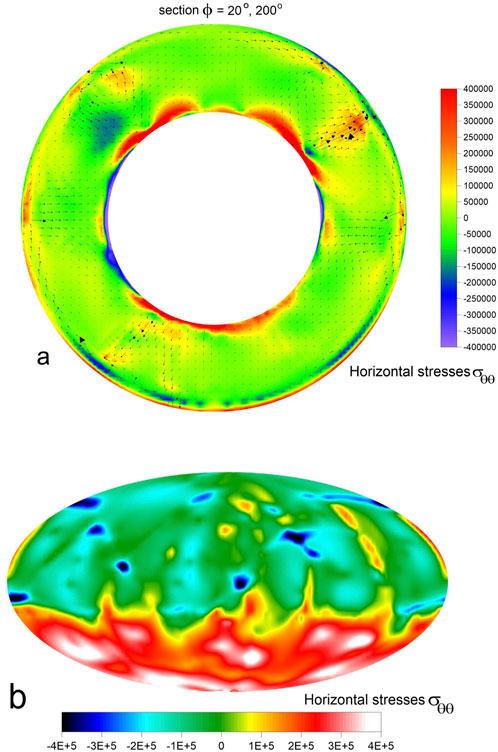
Figure 10. The second mantle model, the continent thickness is 100 km, and the stage t = 160 Ma. (a) Section φ = 20° and 200° the field of the dimensionless normal horizontal stress σθθ with flow velocities. The black ring shows the boundary of the upper mantle at a depth of 660 km. (b) The field of the dimensionless normal horizontal stress σθθ (depth 50 km).
Another model (model 3) was considered with a weak zone of viscosity reduced by a factor of 100 along the border of the supercontinent with the same other parameters as in the base model. For this model with a weak zone, a supercontinent becomes mainly surrounded by subduction zones, while in our basic model the subduction covered only about half of the perimeter. Calculations show a trend towards an increase in tensile stresses in the supercontinent up to 100 MPa due to an increase in the extent of subduction zones at its edges (Figure 11). As in previous models, we find the concentration of hot mantle flows under the supercontinent.
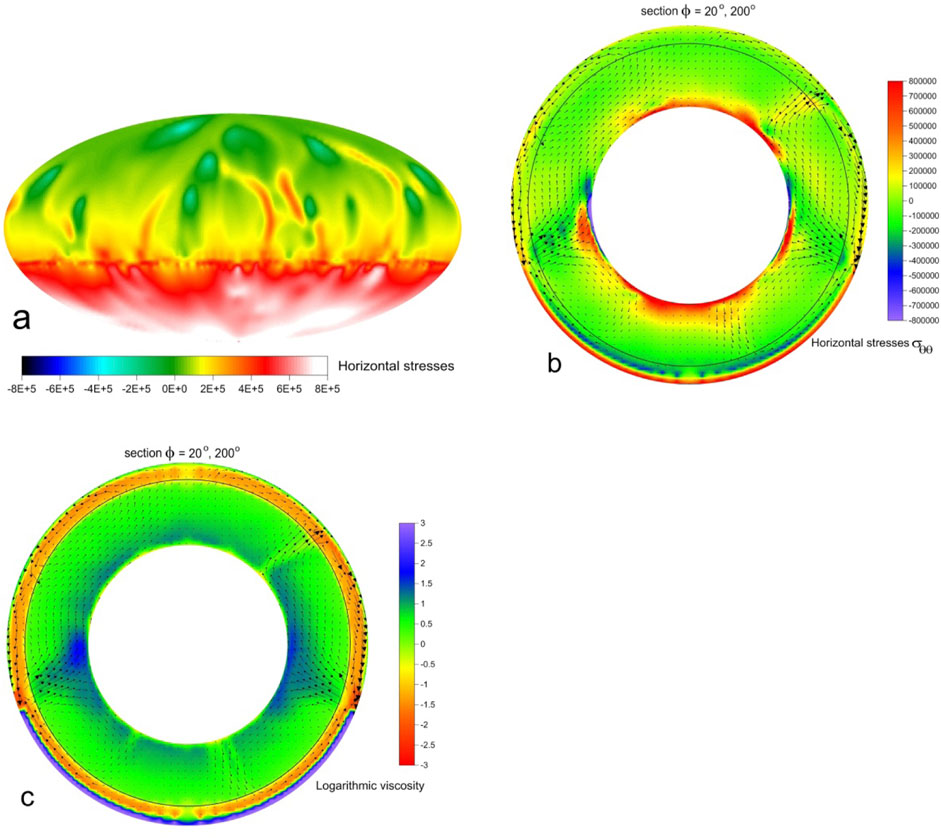
Figure 11. The third mantle model, the continent thickness is 200 km, and the stage t = 160 Ma. (a) The field of the dimensionless normal horizontal stress σθθ (depth 100 km). (b) Section φ = 20° and 200°, the field of the dimensionless normal horizontal stress σθθ with flow velocities. (c) Section φ = 20o and 200o of the spatial distribution of the dimensionless logarithm viscosity with flow velocities. The black ring shows the boundary of the upper mantle at a depth of 660 km.
Additionally, we consider model 4 with Ra = 6
4 Discussion
In this study we modelled the supercontinent as an immobile highly viscous lid without its breakup. Such approximation was made before, for example, by Yoshida et al. (1999) and Yoshida (2010). As shown by numerical calculations for spherical and Cartesian models (e.g., Yoshida, 2019; Bobrov et al., 2022) the velocities of a supercontinent after its formation and before its breakup are relatively small. Thus, an immobile supercontinent gives a fairly acceptable approximation for this stage of the supercontinent cycle.
We demonstrated that after implementing the supercontinent in the model, the mantle flows reorganize and a group of mantle upwellings under the supercontinent is formed whereas subduction under the supercontinent stops. Also, subduction zones (so-called subduction girdle) are formed around the supercontinent. Presence of a subduction girdle around the supercontinents has been verified for reconstructed Pangea (e.g., Collins, 2003), Rodinia (e.g., Li et al., 2008), and partly for Nuna (e.g., Pisarevsky et al., 2014).
In addition, the models exhibited a partial cooling of the supercontinent area. The temperature at the depth of 100 km in the continental lithosphere is lower by approximately 250 K compared to the surrounding mantle. The heat-insulating effect of the supercontinent leads to the concentration of mantle upwellings and an increase in temperature under a supercontinent. This leads to a slight rise in temperature within the subcontinental mantle. For example, at the depth of 300 km, positive temperature anomalies in the vast mantle area below a supercontinent range to 60–70 K (Figures 5c, 7c). The effect of thermal insulation was described in detail by Lowman and Gable (1999), Yoshida et al. (1999), Li and Zhong (2009), Heron and Lowman (2011), Yoshida (2013), Mao et al. (2019), and others (Table 1). For example, Yoshida (2013) and Heron and Lowman (2011) have calculated that a temperature increase under the supercontinent is about only 50 K. Our results show (cf. Figures 2a,b; Figures 4a,b; Figures 6a,b) that hot temperature anomalies are concentrated in the narrow jets while the stress anomalies are more diffuse and cover substantially larger areas. The reason is the viscous involvement of the surrounding mantle material into the upwellings. Thus, hot mantle upwellings (despite their reduced viscosity and, consequently, reduced coupling with surrounding mantle material) are nevertheless able to induce the mantle flows and the stresses in significant surrounding areas.
We also studied stress fields at large depths in the mantle and their response to the presence of a supercontinent. The effect of the implemented supercontinent on stress fields decreases with depth for all our models. At the core, the stress field is determined by the inhomogeneous structure of the mantle flows at the bottom of the mantle.
In addition to the main model, we investigated other scenarios. In the second model the thickness of supercontinent was reduced to a half (100 km), whereas other parameters were kept the same (Figure 10). It could be assumed that for the case of a thinner supercontinent plate, the forces acting in it per unit cross section (i.e., stresses) would be large. The results showed, however, that simultaneously, the integral tensile forces themselves, acting at the base of supercontinent, changed (decreased) as a result of the diminution of the difference between the sub-supercontinental and the suboceanic region. As a result, the influence of the supercontinent thickness on tensile stresses turned out to be insignificant; the difference was rather in a more non-uniform distribution of stresses in the supercontinent compared to a main model. Thus, both models demonstrate the maximum value of σθθ around 50 MPa, which is consistent with the results of Huang et al. (2019) for the case of the absence of a weak zone along the perimeter of the supercontinent.
Another model (model 3) with a weak zone around the supercontinent provides the subduction girdle around the supercontinent (Figure 11). Similar to the results obtained in the other studies (e.g., Huang et al., 2019), the model showed the emergence of a robust annular subduction zone around the supercontinent, while in our basic model the subduction covered about half of the perimeter. The presence of this extensive circumferential subduction leads to an increase in tensile stresses in the supercontinent. Here extensional stresses in the supercontinent reach 100 MPa. Since the compressive stresses below the supercontinent are also increased, we conclude that this phenomenon is related to increased volume of downwelling hence increased upwelling leading to higher stresses.
We also considered the model 4 with halving the Rayleigh number and with halving the heat generation from our base model 1. Here, the stresses in and under the supercontinent turn out to be about half as much as for our basic model, which is not enough for the breakup of the supercontinent. We, therefore, concluded that the real values of Rayleigh number and heat-flow generation should be higher than in this model.
Unlike previous studies, we also investigated the stress fields in the meridional annular section of the mantle, which makes it possible to analyze the stresses at all its depths. Calculated horizontal stresses (σθθ) revealed sharp change in the sign of σθθ with depth at the transition from the supercontinent to the underlying mantle (e.g., sharp change of red to blue colors in the lower part of Figure 6b). Well defined horizontal tensional over-lithostatic stresses (red and orange colors in Figures 5b, 7b) developed in the supercontinent above mantle upwellings. The figures of meridional annular sections e.g., Figure 6b show some blurring of the change in the sign of σθθ with depth. Nevertheless, we state that according to the calculation results, the lowest calculation nodes, lying in the supercontinent, almost all show tensile stresses while the next row of grid nodes, lying already in the subcontinental mantle, almost everywhere show compression stresses.
At the stage of t = 160 Ma (see Figure 7b), they reached up to 400,000 dimensionless units (50 MPa in dimensional form). These values closely agree with the results presented by Zhang et al. (2018) for depths of 75 km and 220 km. This relatively low value may also be caused by the spherical effect (e.g., Butler and Jarvis, 2004). It may not be sufficient for a supercontinent breakup. However, for the model 3 with a weak zone around the supercontinent the tensional stresses are more reliable (Figure 11). In contrary, in vast areas of the subcontinental mantle corresponding to the heads of mantle upwellings, we find a pronounced horizontal compressive stress (blue and purple colors in Figures 5d, 7d). For example, in Figure 7d in the subcontinental mantle the overlithostatic compressive stresses range from 200,000 to 400,000 in the dimensionless form (from 25 MPa to 50 MPa). The boundary of a sharp change in the values of σθθ, which appears in these areas, outlines the position of effective viscosity jump, meaning that this interface marks the base of the HVSL.
The reason for this difference in stresses in the supercontinent and the underlying mantle is the strong difference in viscosities of the continent and the underlying mantle material. The supercontinent material, due to its high viscosity, cannot move in the same way as the underlying mantle. This effect in the area under the supercontinent is clearly visible in Figures 5b,d as well as in Figures 7b,d.
It is important to note that the same phenomenon of a sharp contrast and reversal of σθθ stress sign is also presented in oceanic areas on the lithosphere-asthenosphere boundary. For example, in Figure 6b, an upwelling mantle flow (in the upper left of the figure) creates tensile stresses in a relatively thin oceanic lithosphere and compressive stresses immediately below it. In contrast, the descending mantle flow (left side of the same figure, equatorial region) creates compressive stresses in the oceanic lithosphere and tensile stresses immediately below it. The over-lithostatic tensile stresses arise in a relatively thin oceanic lithosphere above the layer with upward-moving flows where the horizontal stresses are compressive (Figure 6b, left side). Our results revealed that the difference in viscosities of two orders is already sufficient for the appearance of this phenomenon.
Our model cannot provide the plate behavior due to small laterally viscosity variations. By this reason slabs and mantle plumes in our model are absent. However our results are in a good agreement with other spherical models where stresses were studied (e.g., Huang et al., 2019; Yoshida, 2019; 2010). Numerical modeling was performed with a realistic Rayleigh number, phase transitions and p, T dependent viscosity. Despite a rather rough resolution grid, it was enough to resolve small-scale mantle plumes under the supercontinent. Used rheology generates the long-wavelength convective structures; however, it is not able to produce strong plates for oceanic regions.
Compared to other studies we focused on stresses not only in the supercontinent. For example, Yoshida (2010) considered stresses at the depths of 43, 129 and 215 km, that is, in the supercontinent and at its base. Huang et al. (2019) considered stresses only for depths of 220 km, and in the form of one-dimensional profiles averaged over both angular coordinates (not in the form of a map). We argue that it is essential to study the stresses not only within the supercontinent, but essentially throughout the whole mantle down to the core-mantle boundary in order to better understand supercontinent cycle. Moreover, the analysis of only averaged values does not provide the whole picture. Instead, the analysis should involve also the ranges of their lateral variations and the peculiarities of separate typical regions (upper mantle, lower mantle, its lowermost part, areas of the ascending and descending mantle flows).
Unlike mantle models from Huang et al. (2019) and Zhang et al. (2018) who considered a supercontinent breakup, our models do not incorporate continental breakup process yet. This requires adding active tracers that will be implemented in our forthcoming study. It is also important to note that some other essential factors, such as plates-like behavior, should be incorporated into the model. However, in contrast to these studies, we considered and analyzed the stress fields throughout the mantle, and not only at shallow depths.
The compressive stresses in the subcontinental mantle with a strongly tensional stress directly in the supercontinent were previously shown for 2-D Cartesian mantle models with floating continents by Bobrov et al. (2022). It should also be noted that for a 2-D model with non-Newtonian stress-dependent rheology (Bobrov et al., 2022), the maximum stress values in the supercontinent (about 200 MPa) were higher than in the underlying mantle (50–100 MPa), while in our models (model 1, 2, 4), the compressive stresses under supercontinent are approximately the same by absolute value as tensional stresses in the supercontinent (values in the interval from 25 to 50 MPa).
5 Summary and concluding remarks
Using the spherical mantle convection model with the pressure- and temperature-dependent rheology, we computed the normal horizontal stresses σθθ and their temporal changes within the supercontinent and the underlying mantle. For the spherical mantle models, a successive concentration of head parts of upwellings under the supercontinent and their increasing in size, together with the intensification of slabs in the oceanic hemisphere, was shown. At the same time, the average temperature under the supercontinent rises on average by 60 K, whereas under the base of the lithosphere increase in temperature can reach up to 120 K. In the D`` layer temperature under the supercontinent is also increased up to 120 K due to mantle upwellings roots.
After the implementation of the immobile supercontinent, the area of supercontinent is limited by a spherical angle (θ ≤ 66.4°) of the spherical polar grid, change of the sign in horizontal stresses when moving from the region of the supercontinent to the underlying mantle is formed. The same effect is shown for the oceanic lithosphere on the lithosphere-asthenosphere boundary. Our calculations show that the overlithostatic horizontal stresses in the upper mantle are in the range of about ±15 MPa, while along the ascending and descending mantle flows these stresses are about ±25 MPa and more. The lowermost part of the lower mantle as an area of high viscosity in the presence of a significant vertical temperature gradient, exhibits the maximum stresses (up to 70 MPa).
In the supercontinent, the horizontal stresses are more moderate. For a given p, T dependent rheology in our models, the tensile stresses reach a maximum value of about 20–50 MPa. Only for model with weak zone around the supercontinent tensile stresses can reach 100 MPa due to powerful subduction girdle at its edges. A tensional regime prevailing in the supercontinent may provide the penetration of mantle upwellings into the supercontinent, followed by a decrease in the strength of this area and the supercontinent breakup. In the subcontinent mantle the overlithostatic compressive horizontal stresses are the same in the absolute value (25–50 МРа) except the model with weak zone where stresses are approximately twice higher.
Data availability statement
The raw data supporting the conclusions of this article will be made available by the authors, without undue reservation.
Author contributions
ABa: Investigation, Writing – original draft, Writing – review and editing. ABo: Conceptualization, Formal Analysis, Investigation, Writing – original draft, Writing – review and editing. RT: Funding acquisition, Investigation, Methodology, Project administration, Resources, Supervision, Writing – original draft, Writing – review and editing. AC: Conceptualization, Software, Writing – review and editing.
Funding
The author(s) declare that financial support was received for the research and/or publication of this article. Robert Tenzer was supported by the project P0054667 of the Land Surveying and Geo-Informatics, Hong Kong Polytechnic University.
Acknowledgments
The authors would like to thank the reviewers, whose reviews helped to improve the manuscript significantly. We are grateful to Louis Moresi, Shijie Zhong, Michael Gurnis, and other authors of the CitcomS code for providing the possibility of using this software.
Conflict of interest
The authors declare that the research was conducted in the absence of any commercial or financial relationships that could be construed as a potential conflict of interest.
Publisher’s note
All claims expressed in this article are solely those of the authors and do not necessarily represent those of their affiliated organizations, or those of the publisher, the editors and the reviewers. Any product that may be evaluated in this article, or claim that may be made by its manufacturer, is not guaranteed or endorsed by the publisher.
References
Anderson, D. L. (1982). Hotspots, polar wander, Mesozoic convection and the geoid. Nature 297, 391–393. doi:10.1038/297391a0
Becker, T. W., and Boschi, L. (2002). A comparison of tomographic and geodynamic mantle models. Geochem. Geophys. Geosyst. 3. doi:10.1029/2001gc000168
Bobrov, A., Baranov, A., and Tenzer, R. (2022). Evolution of stress fields during the supercontinent cycle. Geodesy Geodyn. 13, 363–375. doi:10.1016/j.geog.2022.01.004
Bobrov, A. M., and Baranov, A. A. (2011). Horizontal stresses in the mantle and in the moving continent for the model of two-dimensional convection with varying viscosity. Izv. Phys. Solid Earth. 47 (9), 801–815. doi:10.1134/S1069351311090023
Bobrov, A. M., and Baranov, A. A. (2014). The structure of mantle flows and stress fields in a two-dimensional convection model with non-Newtonian viscosity. Russ. Geol. Geophys. 55 (2014), 801–811. doi:10.1016/j.rgg.2014.06.001
Bobrov, A. M., and Baranov, A. A. (2016). The mantle convection model with non-Newtonian rheology and phase transitions: the flow structure and stress fields. Izv. Phys. Solid Earth 52 (1), 129–143. doi:10.1134/S1069351316010031
Bobrov, A. M., and Baranov, A. A. (2018). Modeling of moving deformable continents by active tracers: closing and opening of oceans, recirculation of oceanic crust. Geodyn. Tectonophys. 9 (1), 287–307. doi:10.5800/GT-2018-9-1-0349
Bobrov, A. M., and Baranov, A. A. (2019). Thermochemical mantle convection with drifting deformable continents: main features of supercontinent cycle. Pure Appl. Geophys. 176 (8), 3545–3565. doi:10.1007/s00024-019-02164-w
Brooks, A. N., and Hughes, T. J. R. (1982). Streamline Upwind/Petrov–Galerkin formulations for convection dominated flows with particular emphasis on the incompressible Navier–Stokes equations. Comput. Methods Appl. Mech. Eng. 32, 199–259. doi:10.1016/0045-7825(82)90071-8
Brunet, D., and Yuen, D. A. (2000). Mantle plumes pinched in the transition zone. Earth Planet. Sci. Lett. 178, 13–27. doi:10.1016/s0012-821x(00)00063-7
Bunge, H. P., Richards, M. A., and Baumgardner, J. R. (1996). Effect of depth-dependent viscosity on the planform of mantle convection. Nature 379, 436–438. doi:10.1038/379436a0
Butler, S. L., and Jarvis, G. T. (2004). Stresses induced in continental lithospheres by axisymmetric spherical convection. Geophys. J. Int. 157, 1359–1376. doi:10.1111/j.1365-246X.2004.02257.x
Chuvaev, A., Baranov, A., and Bobrov, A. (2020). Numerical modelling of mantle convection in the Earth using cloud technologies. Comput. Technol. 25(2), 103–118. doi:10.25743/ICT.2020.25.2.009
Collins, W. J. (2003). Slab pull, mantle convection, and Pangaea assembly and dispersal. Earth Planet. Sci. Lett. 205, 225–237. doi:10.1016/S0012-821X(02)01043-9
Condie, K. C. (2004). Supercontinents and superplume events: distinguishing signals in the geologic record Record. Phys. Earth Planet. 146, 319–332. doi:10.1016/j.pepi.2003.04.002
Courtillot, V. E., and Renne, P. R. (2003). On the ages of flood basalt events. Compt. Rend. Geosc. 335, 113–140. doi:10.1016/S1631-0713(03)00006-3
Donnadieu, Y., Goddéris, Y., Ramstein, G., Nédélec, A., and Meert, J. (2004). A snowball Earth climate triggered by continental break-up through changes in runoff. Nature 428 (2004), 303–306. doi:10.1038/nature02408
Fei, Y., Orman, J. V., Li, J., van Westrenen, W., Sanloup, C., Minarik, W., et al. (2004). Experimentally determined postspinel transformation boundary in Mg2SiO4 using MgO as an internal pressure standard and its geophysical implications. J. Geophys. Res. 109, B02305. doi:10.1029/2003JB002562
Fortin, M., and Fortin, A. A. (1985). Generalization of Uzawa`s algorithm for the solution of the Navier–Stokes equations. Comm. Appl. Numer. Methods 1, 205–210. doi:10.1002/cnm.1630010504
Gung, Y., Panning, M., and Romanowicz, B. (2003). Global anisotropy and the thickness of continents. Nature 422, 707–711. doi:10.1038/nature01559
Gurnis, M. (1988). Large-scale mantle convection and aggregation and dispersal of supercontinents. Nature 332, 696–699. doi:10.1038/332695a0
Heron, P. J., and Lowman, J. P. (2011). The effects of supercontinent size and thermal insulation on the formation of mantle plumes. Tectonophysics 510, 28–38. doi:10.1016/j.tecto.2011.07.002
Hoffman, P. F. (1991). Did the breakout of laurentia turn gondwanaland inside-out? Science 252, 1409–1412. doi:10.1126/science.252.5011.1409
Honda, S., Yoshida, M., Ootorii, S., and Iwase, Y. (2000). The timescales of plume generation caused by continental aggregation. Earth Planet. Sci. Lett. 176, 31–43. doi:10.1016/s0012-821x(99)00319-2
Huang, C., Zhang, N., Li, Z. X., Ding, M., Dang, Z., Pourteau, A., et al. (2019). Modeling the inception of supercontinent breakup: stress state and the importance of orogens. Geochem. Geophys. Geosyst. 20 (11), 4830–4848. doi:10.1029/2019gc008538
Hughes, T. J. R. (1987). The finite element method: linear static and dynamic finite element analysis. New Jersey: Prentice Hall.
Leng, W., and Zhong, S. (2009). More constraints on internal heating rate of the earth’s mantle from plume observations. Geophys. Res. Lett. 36. doi:10.1029/2008GL036449
Li, Z.-X., Bogdanova, S., Collins, A., Davidson, A., Waele, B., Ernst, R., et al. (2008). Assembly, configuration, and break-up history of Rodinia: a synthesis. Precambrian Res. 160, 179–210. doi:10.1016/j.precamres.2007.04.021
Li, Z. X., and Zhong, S. J. (2009). Supercontinent-superplume coupling, true polar wander and plume mobility: plate dominance in whole-mantle tectonics? Phys. Earth Planet. Inter. 176, 143–156. doi:10.1016/j.pepi.2009.05.004
Lobkovsky, L., and Kotelkin, V. (2015). The history of supercontinents and oceans from the standpoint of thermochemical mantle convection. Precambrian Res. 259, 262–277. doi:10.1016/j.precamres.2015.01.005
Lowman, J. P., and Gable, C. W. (1999). Thermal evolution of the mantle following continental aggregation in 3D convection models. Geophys. Res. Lett. 26 (17), 2649–2652. doi:10.1029/1999GL008332
Lowman, J. P., and Jarvis, G. T. (1993). Mantle convection flow reversals due to continental collisions. Geophys. Res. Lett. 20, 2087–2090. doi:10.1029/93GL02047
Lowman, J. P., and Jarvis, G. T. (1996). Continental collisions in wide aspect ratio and high Rayleigh number two-dimensional mantle convection models. J. Geophys. Res. 101, 25485–25497. doi:10.1029/96JB02568
Lowman, J. P., and Jarvis, G. T. (1999). Effects of mantle heat source distribution on supercontinent stability. J. Geophys. Res. 104, 12733–12746. doi:10.1029/1999JB900108
Mao, Y., Zhong, J., and Zhang, J. (2019). The dynamics of an insulating plate over a thermally convecting fluid and its implication for continent movement over convective mantle. J. Fluid Mech. 868, 286–315. doi:10.1017/jfm.2019.189
McNamara, A. K., and Zhong, S. (2004). Thermochemical structures within a spherical mantle: superplumes or piles? J. Geophys. Res. - Solid Earth 109 (B7), 1–14. doi:10.1029/2003JB002847
Meert, J. G. (2002). Paleomagnetic evidence for a paleo-mesoproterozoic supercontinent columbia. Gondwana Res. 5, 207–215. doi:10.1016/S1342-937X(05)70904-7
Mitchell, R. N., Zhang, N., Salminen, J., Liu, Y., Spencer, C. J., Steinberger, B., et al. (2021). The supercontinent cycle. Nat. Rev. Earth. Environ. 2, 358–374. doi:10.1038/s43017-021-00160-0
Moresi, L. N., and Gurnis, M. (1996). Constraints on the lateral strength of slabs from three-dimensional dynamic flow models. Earth Planet. Sci. Lett. 138, 15–28. doi:10.1016/0012-821X(95)00221-W
Nance, R. D., Murphy, J. B., and Santosh, M. (2014). The supercontinent cycle: a retrospective essay. Gondwana Res. 25, 4–29. doi:10.1016/j.gr.2012.12.026
Pelletier, D., Fortin, A., and Camarero, R. (1989). Are FEM solutions of incompressible flows really incompressible. Int. J. Numer. Methods Fluids 9, 99–112. doi:10.1002/fld.1650090108
Pesonen, L. J., Mertanen, S., and Veikkolainen, T. (2012). Paleo-Mesoproterozoic supercontinents—a Paleomagnetic view. Geophysica 48 (1–2), 5–47.
Phillips, B. R., and Bunge, P. H. (2005). Heterogeneity and time dependence in 3D spherical mantle convection models with continental drift mantle convection models with continental drift. Earth Planet. Sci. Lett. 233, 121–135. doi:10.1016/j.epsl.2005.01.041
Phillips, B. R., and Bunge, P. H. (2007). Supercontinent cycles disrupted by strong mantle plumes. Geology 35, 847–850. doi:10.1130/g23686a.1
Piper, J. D. A. (2010). Protopangaea: palaeomagnetic definition of Earth's oldest (mid-Archaean-Palaeoproterozoic) supercontinent. J. Geodyn. 50 (3), 154–165. doi:10.1016/j.jog.2010.01.0021016/j.jog.2010.01.002
Pisarevsky, S., Elming, S., Pesonen, L., and Li, Z. X. (2014). Mesoproterozoic paleogeography: supercontinent and beyond. Precambrian Res. 244, 207–225. doi:10.1016/j.precamres.2013.05.014
Rogers, J. J. W. (1996). A history of continents in the past three billion years. J. Geol. 104, 91–107. doi:10.1086/629803
Rogers, J. J. W., and Santosh, M. (2004). Continents and supercontinents. New York: Oxford Univ. Press, 308.
Rogers, J. J. W., and Santosh, M. (2009). Tectonics and surface effects of the supercontinent Columbia. Gondwana Res. 15, 373–380. doi:10.1016/j.gr.2008.06.008
Schmeling, H., Babeyko, A. Y., Enns, A., Faccenna, C., Funiciello, F., Gerya, T., et al. (2008). A benchmark comparison of spontaneous subduction models—towards a free surface. Phys. Earth Planet. Interiors 171, 198–223. doi:10.1016/j.pepi.2008.06.028
Schubert, G., Turcotte, D. L., and Olson, P. (2001). Mantle convection in the Earth and planets. Cambridge: Cambridge Univ. Press.
Tan, E., Gurnis, M., and Han, L. (2002). Slabs in the lower mantle and their modulation of plume formation. Geochem. Geophys. Geosyst. 3, 1–24. doi:10.1029/2001gc000238
Trubitsyn, V. P., Simakin, A. G., and Baranov, A. A. (2006). The effect of spatial variations in viscosity on the structure of mantle flows. Izvestiya, Phys. Solid Earth 42 (1), 1–12. doi:10.1134/S1069351306010010
Yoshida, M. (2010). Temporal evolution of the stress state in a supercontinent during mantle reorganization. Geophys. J. Int. 180 (1), 1–22. doi:10.1111/j.1365-246X.2009.04399.x
Yoshida, M. (2013). Mantle temperature under drifting deformable continents during the supercontinent cycle. Geophys. Res. Let. 40 (4), 681–686. doi:10.1002/grl.50151
Yoshida, M. (2019). On mantle drag force for the formation of a next supercontinent as estimated from a numerical simulation model of global mantle convection. Terra nova. 31, 135–149. doi:10.1111/ter.12380
Yoshida, M., Honda, S., Ootorii, S., and Iwase, Y. (1999). Generation of plumes under a localized high viscosity lid in 3-D spherical shell convection. Geophys. Res. Lett. 26 (7), 947–950. doi:10.1029/1999GL900147
Zhang, N., Dang, Z., Huang, C., and Li, Z. X. (2018). The dominant driving force for supercontinent breakup: plume push or subduction retreat? Geos. Front 9 (4), 997–1007. doi:10.1016/j.gsf.2018.01.010
Zhang, N., Zhong, S., and McNarmara, A. K. (2009). Supercontinent formation from stochastic collision and mantle convection models. Gondwana Res. 15, 267–275. doi:10.1016/j.gr.2008.10.002
Zhang, S., Li, Z.-X., Evans, D. A. D., Wu, H., Li, H., and Dong, J. (2012). Pre-Rodinia supercontinent Nuna shaping up: a global synthesis with new paleomagnetic results from North China. Earth Planet. Sci. Lett. 353–354, 145–155. doi:10.1016/j.epsl.2012.07.034
Zhao, G., Sun, M., Wilde, S. A., and Li, S. (2004). A Paleo-Mesoproterozoic supercontinent: assembly, growth and breakup. Earth-Science Rev. 67 (1), 91–123. doi:10.1016/j.earscirev.2004.02.003
Zhong, S., Gurnis, M., and Moresi, L. (1998). Role of faults, nonlinear rheology, and viscosity structure in generating plates from instantaneous mantle flow models. J. Geophys. Res. 103 (15), 15255–15268. doi:10.1029/98jb00605
Zhong, S., McNamara, A., Tan, E., Moresi, L., and Gurnis, M. (2008). A benchmark study on mantle convection in a 3-D spherical shell using CitcomS. Geochem. Geophys. Geosyst. 9, Q10017. doi:10.1029/2008GC002048
Zhong, S., Zhang, N., Li, Z. X., and Roberts, J. H. (2007). Supercontinent cycles, true polar wander, and very long-wavelength mantle convection. Earth Planet. Sci. Lett. 261, 551–564. doi:10.1016/j.epsl.2007.07.049
Keywords: supercontinent, spherical mantle convection, thermal insulating, horizontal stresses, spherical convection
Citation: Baranov A, Bobrov A, Tenzer R and Chuvaev A (2025) Evolution of lateral tectonophysical stresses in the spherical shell convection with an immobile supercontinent. Front. Earth Sci. 13:1452399. doi: 10.3389/feart.2025.1452399
Received: 20 June 2024; Accepted: 14 April 2025;
Published: 29 April 2025.
Edited by:
Nibir Mandal, Jadavpur University, IndiaReviewed by:
Dip Ghosh, University of Calcutta, IndiaAjay Kumar, Indian Institute of Science Education and Research, Pune, India
Copyright © 2025 Baranov, Bobrov, Tenzer and Chuvaev. This is an open-access article distributed under the terms of the Creative Commons Attribution License (CC BY). The use, distribution or reproduction in other forums is permitted, provided the original author(s) and the copyright owner(s) are credited and that the original publication in this journal is cited, in accordance with accepted academic practice. No use, distribution or reproduction is permitted which does not comply with these terms.
*Correspondence: A. Baranov, YWFiYXJhbm92QGdtYWlsLmNvbQ==
 A. Baranov
 A. Bobrov2
 R. Tenzer
 A. Chuvaev