 Pavlo Saik1
 Artem Sybir2
 Igor Vorona3
 Oksana Isaieva3
 Volodymyr Yukhymchuk3
 Volodymyr Trachevsky4
 Oleksandr Burchak5*
 Ivan Hubynskyi6
 Vasyl Lozynskyi1,7*
- 1Belt and Road Initiative Centre for Chinese-European Studies (BRICCES), Guangdong University of Petrochemical Technology, Maoming, China
- 2Z. I. Nekrasov Iron and Steel Institute, National Academy of Sciences of Ukraine, Dnipro, Ukraine
- 3Lashkaryov Institute of Semiconductor Physics, National Academy of Sciences of Ukraine, Kyiv, Ukraine
- 4Laboratory for Synthesis and Diagnostics of Nanosystems and Nanomaterials of the Analytical Research Department, Technical Center of the National Academy of Sciences of Ukraine, Kyiv, Ukraine
- 5M.S. Poliakov Institute of Geotechnical Mechanics, National Academy of Sciences of Ukraine, Dnipro, Ukraine
- 6Thermal and Material Engineering Center LLS, Dnipro, Ukraine
- 7Department of Mining Engineering and Education, Dnipro University of Technology, Dnipro, Ukraine
Introduction: The high-temperature graphitization of anthracite is a key process for producing artificial graphite with properties comparable to natural graphite. However, the kinetics and structural evolution of carbon materials under rapid heating conditions remain insufficiently studied.
Methods: This study investigates the structural transformations of anthracite during staged heat treatment using Raman and electron paramagnetic resonance (EPR) spectroscopy. The experiments were conducted in an electrothermal fluidized bed system, providing heating rates up to 1000 K/min and holding times of several tens of minutes.
Results: The combined analysis of Raman and EPR data revealed that graphitization occurs in three distinct temperature intervals. At 2,100°C, the product resembles natural graphite but retains a higher density of structural defects. At elevated temperatures of 2,700°C and 3,000°C, turbostratic graphite with fewer defects was obtained.
Discussion: Rapid heating and short annealing time facilitate the transformation of the two-dimensional carbon matrix into a more ordered three-dimensional structure while promoting the removal of ash-forming elements. Process optimization in terms of temperature and residence time is crucial for improving the structural integrity and performance of artificial graphite materials.
1 Introduction
The demand for graphite is constantly growing due to its increased use in traditional industries such as nuclear power and metallurgy, and its new applications in energy conservation technologies and graphene production. This leads to the expansion in using and improving traditional graphite production technologies (Engels et al., 2022; Rui et al., 2021) and the search for new, more effective, and cheaper ones (Tang et al., 2017; Kamal et al., 2020; Jara et al., 2019; Zhang et al., 2023; Chen et al., 2023). On the other hand, the global coal industry remains extensive and powerful, although the demand for its products in the energy sector is steadily declining (Salieiev, 2024; Ma et al., 2021; Bondarenko et al., 2023; Kelamanov et al., 2023). As a result, there is a natural drive to explore new uses for fossil coal, one of which could be its conversion into graphite. In particular, recent efforts have focused on developing new technologies for refining natural graphite (Sybir et al., 2023) and producing high-quality artificial graphite from coal, which would meet the requirements for manufacturing lithium-ion batteries (Surovtseva et al., 2022; Shi et al., 2021) or graphene products (Singh et al., 2023a; Singh and Dastgheib, 2024a). At the same time, there is an ongoing search for more efficient and energy-saving methods to transform coal into graphite (Yadav et al., 2024).
The main research directions on using coal as precursors for obtaining artificial graphite are related to determining the influence of the main technological parameters of the processes and characteristics of the initial coal types. The results of numerous research studies, in particular (Nyathi et al., 2013; Krasnovyd et al., 2023; Qiu et al., 2019; Bazaluk et al., 2024), indicate that an increased degree of carbon precursor’s metamorphism contributes to the graphitization process’s intensification and provides a more ordered graphite-like structure. In view of this, anthracite, a coal with a high degree of metamorphism, was chosen for the research.
The choice of the temperature range for the study of anthracite graphitization is based on the results of numerous previous researches, in which most experiments were conducted in the range of 1,500°C–3000°C. In particular, a three-stage mechanism of anthracite graphitization was proposed in publications (Wang et al., 2021; Sybir et al., 2020; Qiu et al., 2020; Qiu et al., 2021) based on experimental and theoretical data.
The first stage (up to 1,500°C) includes removing moisture and volatile components, cracking formation, polymerization and condensation reactions, thermal decomposition of carbonates, and desulfurization. The second stage (1,500°C–2200°C) involves structural ordering, reduction of the interlayer distance, transition of oxides to the liquid phase and their evaporation, accompanied by chemical transformations and formation of eutectic mixtures. The third stage (2200°C–3000°C) is characterized by recrystallization, elimination of lattice defects, and formation and decomposition of carbides.
Separate research conducted in the temperature range of 1,200°C–2000 °C allowed us to identify two generalized areas of structural changes and changes in the physical properties of anthracite (Sybir et al., 2020): up to 1,600°C–a gradual increase in the degree of structure ordering and a decrease in electrical resistance; above 1,600°C–sharp changes in crystal structure, electrical resistance, and microhardness.
Thus, the choice of the temperature range of 1,500°C–3000°C in this research is reasonable in view of the current scientific context and allows for a full analysis of the key stages of anthracite graphitization.
The restriction of the upper-temperature limit is connected with the possibility of local overheating of the carbon material and its partial evaporation. The study results confirmed the decisive influence of the temperature factor on graphitization. The influence of temperature significantly increases when reaching 2400°C–2500°C, so research in this area could be carried out in 100°C increments (González et al., 2004). Still, many researches aimed at determining the principle mechanisms of graphitization of anthracites were carried out in 300°C increments (Qiu et al., 2021). At the same time, the heating rate of the material during the experiment was no more than 10° per minute, and the holding time was from 1 to 4 h. Thus, the effect of the holding time was somewhat reduced, especially at high temperatures. Special attention was paid to the effect of ash elements on the graphitization process as catalysts. Research conducted on semi-anthracite from the Villablino zone in north-western Spain showed that the catalytic effect of ash elements can significantly increase the graphitization rate (González et al., 2004). Such results were obtained when comparing the heat treatment results of the initial semi-anthracite and semi-anthracite after chemical demineralization (Pappano and Schobert, 2009; González et al., 2002). This is linked with carbide formation and anthracite’s disordered carbon. When the temperature rises, the carbide can decompose.
In recent works (Zhifei et al., 2023), attention was devoted to researching the graphitization of anthracite, considering the content of inertinite and vitrinite in coal. Research has shown that inertinite has advantages since it has a higher structural order than vitrinite. However, vitrinite’s graphitization rate is higher than inertinite’s, and at 3000°C, the d002 values of both macerals tend to coincide.
The technology of graphitization at a temperature of 2400°C–3000 °C in Kastner or Acheson furnaces is known (Lieleka et al., 2014). These are batch furnaces where heating occurs due to the passage of electric current through the furnace working space and the release of Joule heat. The support is the carbon billets (Kastner furnace) or a granulated coke bed (Acheson furnace). The process cycle time in the Acheson furnace is 36–120 h, depending on the furnace capacity, and in the Kastner furnace, 10–30 h, respectively. Specific electricity consumption reaches 3000–3500 kWh/t for the Kastner furnace and 4,500–6,500 kWh/t for the Acheson furnace.
An alternative to traditional processes of high-temperature processing of carbon materials is the use of furnaces with an electrothermal fluidized bed (EBF) (Fedorov et al., 2017; Fedorov et al., 2022; Hubynskyi et al., 2024) (Figure 1).
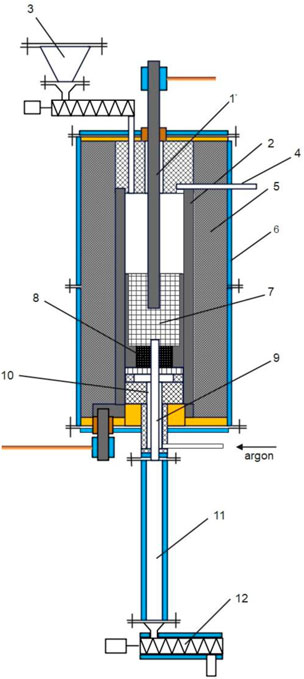
Figure 1. Schematic of the furnace for heat treatment of carbon materials in an electrothermal fluidized bed: 1 – central electrode; 2 – side electrode; 3 – feedstock hopper with feeder; 4 – off-gas channel; 5 – thermal insulation; 6 – water-cooled body; 7 – fluidized bed of carbon material; 8 – gas distribution device; 9 – channel for removing graphitized material; 10 – argon supply channel; 11 – water-cooled refrigerator for graphitized material; 12 – screw conveyor for graphitized material.
The technology of processing carbonaceous materials in an electrothermal fluidized bed involves the formation of a fluidized bed of particles with a size of 0.2–1 mm by supplying inert gas (argon or nitrogen). The bubble mode of the layer is formed in the gap between the central 1 and side 2 graphite electrodes at a fluidization number of 2–5. The fluidized bed is heated by passing an electric current in the radial direction through the particle layer. This allows achieving high temperatures and possibly fine-tuning the heat treatment modes. The treatment process is carried out in a continuous mode with constant loading of raw materials from hopper 3 and unloading of the graphitized product through channel 9, refrigerator 11, and screw conveyor 12. The results of comparative studies of energy consumption and greenhouse gas emissions in the production of artificial graphite have shown the prospects of using high-temperature technology based on electrothermal fluidized bed instead of traditional processes based on Acheson or Kastner furnaces, which can reduce energy consumption by ∼25% and reduce CO2 emissions by 40%–50% compared to (Qiu et al., 2021; González et al., 2004).
The novelty of this study of anthracite graphitization lies in the choice of technological parameters of heat treatment, which are inherent in processes in an electrothermal fluidized bed (Hubynskyi et al., 2024) and significantly affect the course of graphitization processes, in particular, the heating rate and holding time when reaching a given temperature. In the experiments, much more intensive heat treatment modes were implemented than in traditional technologies: the heating rate reached 100–1000 K/min, and the holding time was only a few tens of minutes. The study aimed to determine the effect of these heat treatment parameters (heating rate and holding time at high temperature) on forming an anode-quality graphite structure. Anthracite from the Donetsk coal basin was chosen as a precursor because of the prospect of the unconventional use of fossil coal, the mining infrastructure for which remains strong.
Raman spectroscopy, widely recognized for its effectiveness in analyzing structural changes in carbonaceous systems (Orlando et al., 2021; Das and Agrawal, 2011; Potgieter-Vermaak et al., 2011; Zhao et al., 2024; Xu et al., 2020a), was therefore considered an appropriate tool for characterizing the graphitization behavior of anthracite in this study.
2 Experimental technique
Anthracite with the content of the ash-forming component Ad = 17.96%, with the elemental composition of Mg – 0.6%, Al – 3.2%, Si – 5.3%, Fe – 1.3%, and Ca – 0.4% was chosen as the object of the research. The grain-size class of anthracite powder used in the experiments was 100–250 µm. The measurements were made using samples in their initial state and warmed thoroughly in stages at temperatures of 1,500, 1800, 2100, 2400, 2700, and 3000°C with a holding time of 10–20 min. The heating rate typical for the electrothermal fluidized bed technology was achieved in a specially designed chamber furnace (Hubynskyi et al., 2024; Sybir et al., 2022). Graphitization, a technological mode of processing raw materials with one influence factor, is more straightforward and practical than graphitization, the solid-phase transition of non-graphitic carbon into graphite during heat treatment under high pressure. In addition, the technology of anthracite graphitization using an electrothermal fluidized bed is promising in an ecological sense and less energy-consuming.
Raman spectra were recorded on a spectrometer, which was an MDR-23 monochromator (LOMO) with a CCD camera iDus 420 photodetector (Andor (UK)). To excite the Raman spectra, the authors used radiation from a CNI Model with a PSU-H-FDA solid-state laser with a wavelength of 457 nm, and a low radiation power (the power density did not exceed 103 W/cm2) was used to prevent any thermal transformations in the researched samples. The spectral separative power, determined from the width of the silicon phonon band of the monocrystalline silicon wafer, was 3 cm-1. The position of the Si phonon peak at 520.5 cm-1 was used as a reference standard to determine the frequencies of the Raman bands in the researched samples. EPR studies were conducted on a Bruker ELEXSYS-E580 spectrometer in the X range (∼9.8 GHz), equipped with a highly sensitive ER 4122SHQE resonator. The EPR spectra were normalized to the mass of the samples and the resonator Q-factor with the sample, which allows a direct comparison of signal intensities from different samples. All measurements were performed at room temperature.
3 Results and discussion
The Raman spectrum of coals is conventionally divided into two spectral ranges. The first of these, most often used for characterizing coals and their derivatives, lies in the 800–1800 cm-1 region, where first-order Raman bands manifest (He et al., 2017; Yin et al., 2019; Xu et al., 2020b; Li et al., 2024). In the second range, 2000–4,000 cm-1, mainly second-order Raman lines appear (Reich and Thomsen, 2004; Kawashima and Katagiri, 1995; Rantitsch et al., 2016). In the first spectral range, the Raman spectrum in coals visually reveals two bands at ∼1,450 and ∼1,600 cm-1. However, a detailed analysis of the band shapes showed that the spectrum is more complex and requires more lines to describe it. Different authors use 3 to 11 lines for description (for details see (Xu et al., 2020b; Li et al., 2024; Reich and Thomsen, 2004; Kawashima and Katagiri, 1995; Rantitsch et al., 2016; Li et al., 2006)). We will use five components (Morga et al., 2014) in further analysis: G, D, D′, D3, and D4. The G-band (1,580–1,600 cm−1) is ascribed to a doubly degenerate oscillating mode of the E2g-symmetry in the Brillouin zone center, which is the result of symmetric stretching oscillations of any pair of carbon atoms that have sp2-hybridization. The D band (∼1,350 cm−1) is observed only in the Raman spectra of ordered carbonaceous materials with defects; the selection rules in defect-free structures forbid it. Indeed, the D band is absent in the Raman spectra of high-quality crystalline graphite, but the G band is always present. Therefore, the ratio of the G and D bands amplitudes (ID/IG) is often used to determine the degree of defectiveness of material and the size of crystalline regions in matrices, along with an analysis of changes in bandwidths. The D3 band (∼1,540 cm−1) is observed in highly disordered materials and attributed to amorphous carbon structures. The other lines, D′ at ∼1,620 cm-1 and D4 at ∼1,200 cm-1 are usually of lower intensity and are assigned to amorphous carbon and olefin, respectively. It should be noted that although both D and D′ bands belong to the amorphous carbon phase, they have different excitation mechanisms.
The second-order Raman spectrum proves helpful in studying the ordering of graphene planes and the formation of a graphite-like structure (Pimenta et al., 2007). The single-layer graphene is known to be characterized by a symmetric, intense band (2D) with a frequency of ∼2687 cm-1 (Ferrari et al., 2006). For double-layer graphene, the number of options for 2D Raman band excitation increases to four. For five- or more-layer carbon films, the shape of the 2D Raman band becomes similar to the 2D band of graphite (Ferrari et al., 2006) and consists of two components (2D0 and 2D1) with frequencies ∼2687 and 2727 cm-1. At the same time, the shape of the 2D Raman band is symmetrical for turbostratic graphite, for which the parallelism of the layers is preserved, but the order in the stacking sequence of layers is broken (Kumar et al., 2013; Barros et al., 2005). The band at ∼2145 cm–1 attributed to carbyne (Danno et al., 2000) appears in this spectral range for some carbon-based materials. The Raman bands have been identified based on careful studies of different coal samples and comparisons with other carbon-based materials, particularly graphene and graphene oxide (Singh et al., 2023b; Singh and Dastgheib, 2024b).
Figure 2a shows the first-order Raman spectra of the initial and heat-treated anthracite samples, normalized on the G band peak intensity. Figure 2B presents the evolution of the ID/IG ratio, which demonstrates three temperature ranges of the anthracite transformation during shock heating, where ID and IG are amplitudes of the experimental Raman peaks, close to the spectral position of D and G bands of carbon-based materials, respectively.
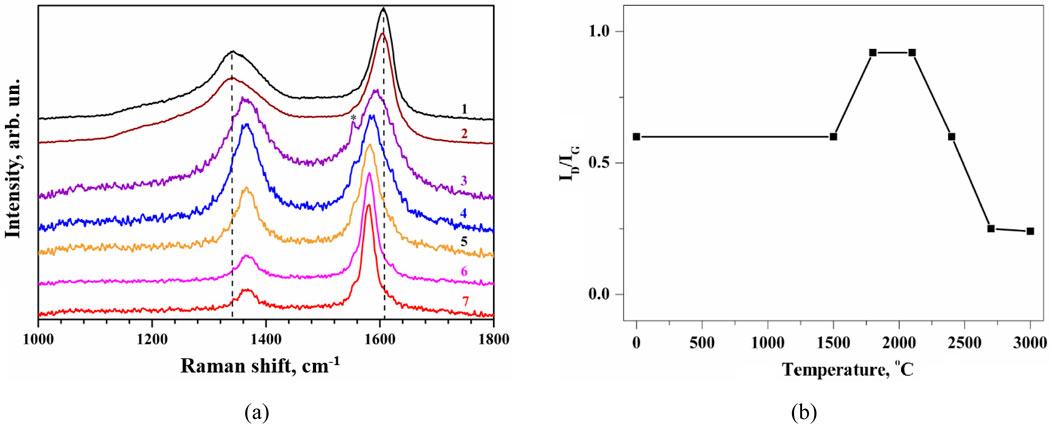
Figure 2. (a) The G-bands Raman spectra of anthracite samples normalized to the peak intensity: 1 – initial; and annealed at different temperatures: 2–1,500°С; 3–1800°С; 4–2100°С; 5–2400°С; 6–2700°С; 7–3000°С. The exposure time is 10 min. (b) Evolution of the ratio of amplitude intensities for experimental bands D and G (∼1,450 and ∼1,600 cm-1, respectively).
The first temperature range is from room temperature to 1,500°С (Figure 2A, curves 1, 2). Samples processed at these temperatures are characterized by Raman spectra with the most significant spectral distance between G and D bands (266 cm-1) and the largest half-width. The spectra also contain D′, D3, and D4 bands, indicating the presence of amorphous carbon and olefin in the samples (see decomposition of the spectrum into components in Figure 3).
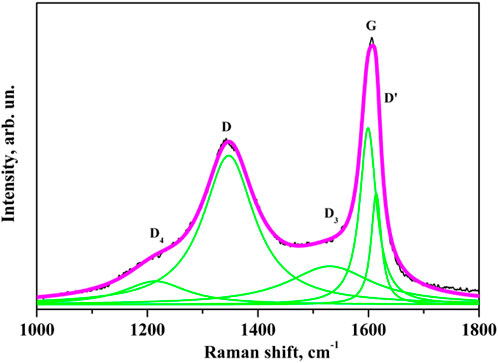
Figure 3. Raman spectrum of the initial coal sample and its decomposition into separate components corresponding to different oscillating modes.
The second temperature range is from 1,500 to 2100°С. For samples processed at these temperatures, the Raman spectra are characterized by an increase in the half-width of the G bands and a decrease in the half-width of the D bands, while the spectral distance between the maxima of these bands decreases to 222 cm-1. The latter is caused by a high-frequency shift of the D band and a low-frequency shift of the G band. The low-frequency change of the G band is apparently due to an increase in the average size of carbon nanocrystals. At the same time, the increase in the G band half-width requires additional study and explanation. Annealing at high temperatures, as a rule, leads to the ordering of atoms in the lattice and a decrease in the number of defects, increasing the crystalline perfection and reducing phonon bands’ half-widths. Therefore, the reason for the increase in the half-widths of the G bands at temperatures of 1800 and 2100°С should be a process that prevents the ordering of carbon atoms, for example, the melting of SiO2 and/or Al2O3 in coal and their subsequent transformation into volatile and liquid components. The above results of the elemental analysis for the initial sample allow us to assume this explanation for the increase in the G band half-width.
With an increase in the heating temperatures of the samples above 2200°С (the third temperature range), the half-widths of both G and D bands decrease significantly, indicating an increase in the crystalline perfection of the samples. This is accompanied by a decrease in the spectral distance between the bands (to 215 cm-1), which is caused by a reduction in the contribution of the D′ band to Raman spectra. The intensities of the D and D′ bands also decrease, indicating a decrease in the number of defects in coal thermally treated at these temperatures. The contribution of olefin (D4) and amorphous carbon phase (D3) to Raman spectra is practically absent. Such parameters of the Raman spectra allow us to assume that graphite is predominantly formed at temperatures of 2700 and 3000°С.
A comparison of the changes caused in the Raman scattering spectra for different exposure times at the same heating temperature shows that the orderliness of the substance increases with increasing time, and its defectiveness decreases (Figure 4).
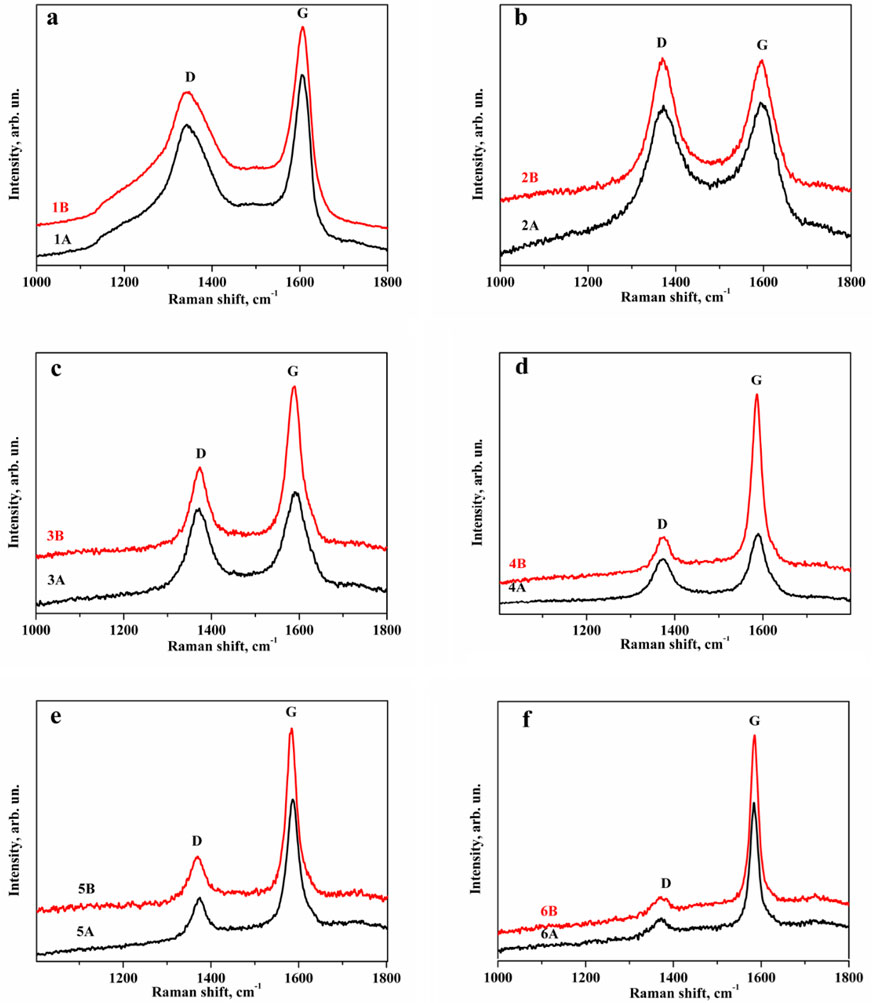
Figure 4. Dependence of the D-band Raman spectra of anthracite normalized on intensity on the holding time during the annealing process. (A – 10 min, B – 20 min) at temperatures: (a) – 1,500°С; (b) – 1800°С; (c) – 2100°С; (d) – 2400°С; (e) – 2700°С; (f) – 3000°С.
Second-order Raman spectra were analyzed to obtain additional information about the graphitization processes of coal. (Figure 5). It showed that for coal, both original and processed at 1,500°C, the 2D bands are not visible (Figure 5, curves 1, 2), which indicates their low crystalline perfection and high content of amorphous carbon phase in the samples. The 2D band exhibits the most pronounced two-component character for the samples from the second temperature range (Figure 5, curves 3, 4); this is especially noticeable for the sample annealed at T = 2100oС. This indicates that at these temperatures, coal begins to form graphite, corresponding to natural ones in terms of quality indicators.
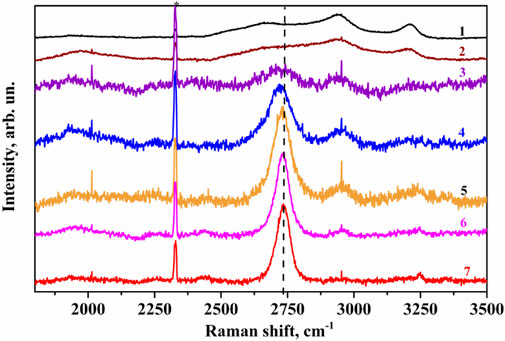
Figure 5. The G-bands Raman spectra of coal samples normalized to the peak intensity in the area of the second order of oscillating modes: 1 – original; and annealed at different temperatures: 2–1,500°С; 3–1800°С; 4–2100°С; 5–2400°С; 6–2700°С; 7–3000°С (the holding time is 10 min).
At temperatures of coal sample processing of 2400°C and higher, their 2D Raman bands are symmetrized with a slight asymmetry on the low-frequency wings. This indicates the formation of turbostratic graphite, which differs from natural graphite’s structural properties, particularly in the sequence of carbon layer stacking.
The analysis of Raman spectra of the second-order Raman confirms the division into temperature ranges in the anthracite graphitization process when using high-temperature technology based on an electrothermal fluidized bed.
Figure 6 shows the initial coal’s electron paramagnetic resonance (EPR) spectra and samples annealed for 10 min at the indicated temperatures. It is visible that EPR signals are recorded on the initial sample and samples that are annealed at the minimum and maximum temperatures.
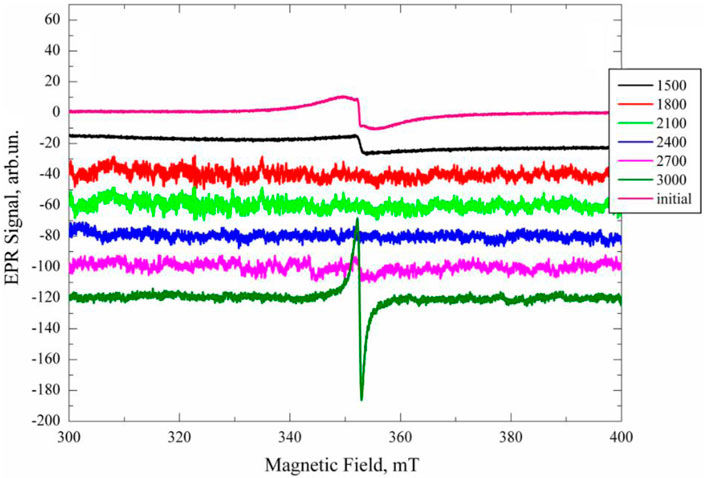
Figure 6. Q-normalized EPR spectra of the initial and annealed samples for 10 min at temperatures of 1,500°С, 1800°С, 2100°С, 2400°С, 2700°С, and 3000°С.
Usually, EPR signals registered in coal are conventionally divided into several groups (Pilawa et al., 2002; Zhou et al., 2019): signals observed at g∼2.0025–2.0029, 2.0035–2.0042, g∼2.0024–2.0031 and g∼2.0010–2.0020. They are attributed to simple aromatic radicals, oxygen-containing free radicals, such as simple ethers and quinones, aliphatic-aromatic hybrid radicals, and oxygen-containing radicals, respectively. To identify the EPR signals in the coal studied, the computer modeling of the experimental EPR spectra with their decomposition into components was done. Figure 7 shows the EPR spectra of the initial and annealed at 3000°C samples with their decomposition into components.
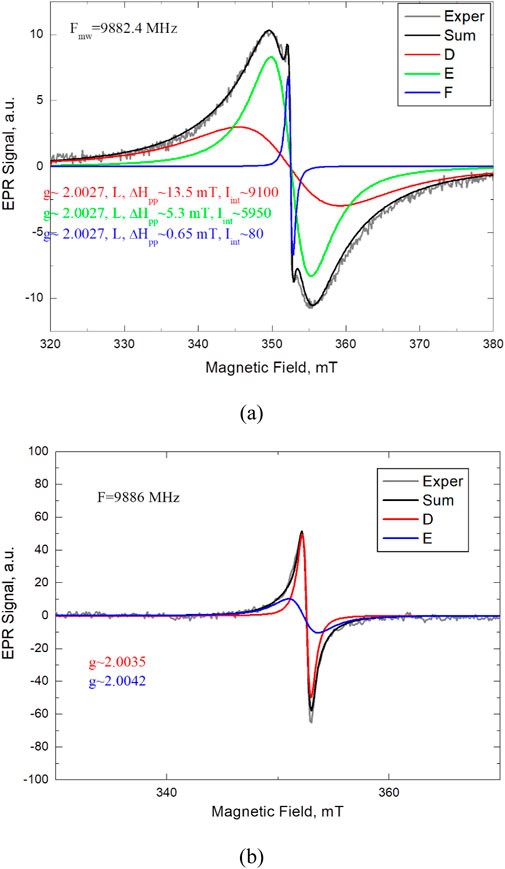
Figure 7. EPR spectra of the initial (a) and annealed at 3,000°С (b) samples with their decomposition into components.
Visually, the EPR spectrum of the initial sample consists of two components–broad and narrow overlapping lines. However, the analysis of its form showed that it cannot be described by two components of the regular shape (Lorentz or Gaussian). It can be characterized by three Lorentz with the same g ∼ 2.0027 widths of 0.65, 5.3, and 13.5 mT, respectively. According to (Pilawa et al., 2002; Zhou et al., 2019), they can be attributed to simple aromatic and/or aliphatic-aromatic hybrid radicals. Three EPR signals most likely indicate the simultaneous existence of three different paramagnetic centers–radicals in the initial coal. The EPR spectra in this research are observed only at extreme temperatures. At the same time, the radicals registered during the experiment have close g-factor values, so it has not yet been possible to identify the defects unambiguously. Work in this direction will be continued.
According to the Raman results, coal annealing leads to the restructuring of the internal structure of the coal, which is accompanied by the healing of radicals. At the same time, no signals are observed in the EPR spectrum. For the sample annealed at 3000°C, a new EPR spectrum appears, which can be described by two Lorentzian components. Their g-factors (2.0035 and 2.0042, respectively) can be classified as oxygen-containing free radicals such as ethers and quinones (Zhou et al., 2019). On the other hand, a narrow signal with g = 2.0035 was observed in nanostructured graphite (Kausteklis et al., 2011). Since high-temperature treatment of coal promotes the escape of oxygen and the above-described Raman studies showed the formation of a graphite-like structure, most likely, the observed EPR signals should be attributed to the intrinsic defects of the graphite-like matrix, such as dangling bonds.
4 Conclusion
Structural studies of coals heated at high temperatures using the fluidized bed technology have shown the possibility of forming a graphite-like structure. The quality of the final product was found to depend on the annealing temperature. At a heating temperature of 1,500°C–2100°C, a graphite-like structure is formed, similar to natural graphite, but with many defects, which can increase the resistance of the final product.
Increasing the annealing temperature to 2700°C–3000°C leads to a decrease in the defectiveness of the material and the formation of a turbostratic graphite structure. Increasing the heat treatment time helps improve the structure of the final product. Thus, the possibility of using the fluidized bed technology to obtain graphite is demonstrated. Optimization of process parameters, such as annealing time and temperature, is a promising way to improve the quality of artificial graphites.
Data availability statement
The original contributions presented in the study are included in the article/supplementary material, further inquiries can be directed to the corresponding authors.
Author contributions
PS: Project administration, Writing – review and editing. AS: Data curation, Investigation, Methodology, Writing – original draft. IV: Investigation, Methodology, Visualization, Writing – original draft. OI: Formal Analysis, Software, Writing – review and editing. VY: Investigation, Methodology, Visualization, Writing – original draft. VT: Methodology, Supervision, Validation, Writing – original draft. OB: Conceptualization, Data curation, Validation, Writing – review and editing. IH: Funding acquisition, Resources, Software, Writing – review and editing. VL: Funding acquisition, Investigation, Writing – review and editing.
Funding
The author(s) declare that financial support was received for the research and/or publication of this article. This study was carried out as part of the project “Belt and Road Initiative Centre for Chinese-European Studies (BRICCES)” and was funded by the Guangdong University of Petrochemical Technology. This research is supported by the National Academy of Sciences of Ukraine, Thermal & Material Engineering Center LLS.
Conflict of interest
The authors declare that the research was conducted without any commercial or financial relationships that could be construed as a potential conflict of interest.
The author(s) declared that they were an editorial board member of Frontiers, at the time of submission. This had no impact on the peer review process and the final decision.
Generative AI statement
The author(s) declare that no Generative AI was used in the creation of this manuscript.
Publisher’s note
All claims expressed in this article are solely those of the authors and do not necessarily represent those of their affiliated organizations, or those of the publisher, the editors and the reviewers. Any product that may be evaluated in this article, or claim that may be made by its manufacturer, is not guaranteed or endorsed by the publisher.
References
Barros, E. B., Demir, N. S., Souza Filho, A. G., Mendes Filho, J., Jorio, A., Dresselhaus, G., et al. (2005). Raman spectroscopy of graphitic foams. Phys. Rev. B-Condensed Matter Mater. Phys. 71 (16), 165422. doi:10.1103/PhysRevB.71.165422
Bazaluk, O., Sobolev, V., Molchanov, O., Burchak, O., Bezruchko, K., Holub, N., et al. (2024). Changes in the stability of coal microstructure under the influence of weak electromagnetic fields. Sci. Rep. 14, 1304. doi:10.1038/s41598-024-51575-w
Bondarenko, V., Salieiev, I., Kovalevska, I., Chervatiuk, V., Malashkevych, D., Shyshov, M., et al. (2023). A new concept for complex mining of mineral raw material resources from DTEK coal mines based on sustainable development and ESG strategy. Min. Mineral Deposits 17 (1), 1–16. doi:10.33271/mining17.01.001
Chen, Y., Li, S., Lin, S., Chen, M., Tang, C., and Liu, X. (2023). Promising energy-storage applications by flotation of graphite ores: a review. Chem. Eng. J. 454, 139994. doi:10.1016/j.cej.2022.139994
Danno, T., Murakami, K., Krause, M., and Kuzmany, H. (2000). Resonance Raman scattering from carbyne materials. AIP Conf. Proc. 544, 473–476. doi:10.1063/1.1342557
Das, R. S., and Agrawal, Y. K. (2011). Raman spectroscopy: recent advancements, techniques and applications. Vib. Spectrosc. 57, 163–176. doi:10.1016/j.vibspec.2011.08.003
Engels, P., Cerdas, F., Dettmer, T., Frey, C., Hentschel, J., Herrmann, C., et al. (2022). Life cycle assessment of natural graphite production for lithium-ion battery anodes based on industrial primary data. J. Clean. Prod. 336, 130474. doi:10.1016/j.jclepro.2022.130474
Fedorov, S. S., Sybir, A., Hubynskyi, M. V., and Hubynskyi, S. M. (2017). Method of refining carbon material in an electrothermal fluidized bed. Ukraine, UA 142810 U.
Fedorov, S. S., Sybir, A., Hubynskyi, M. V., Hubynskyi, S. M., and Merkulov, O. Y. (2022). Electrothermal fluidized bed furnace Ukraine. UA 154510 U.
Ferrari, A. C., Meyer, J. C., Scardaci, V., Casiraghi, C., Lazzeri, M., Mauri, F., et al. (2006). Raman spectrum of graphene and graphene layers. Phys. Rev. Lett. 97 (18), 187401. doi:10.1103/PhysRevLett.97.187401
González, D., Montes-Morán, M. A., Suárez-Ruiz, I., and Garcia, A. B. (2004). Structural characterization of graphite materials prepared from anthracites of different characteristics: a comparative analysis. Energy & Fuels 18 (2), 365–370. doi:10.1021/ef030144
González, D., Montes-Morán, M. A., Young, R. J., and Garcia, A. B. (2002). Effect of temperature on the graphitization process of a semianthracite. Fuel Process. Technol. 79 (3), 245–250. doi:10.1016/S0378-3820(02)00181-9
He, X., Liu, X., Nie, B., and Song, D. (2017). FTIR and Raman spectroscopy characterization of functional groups in various rank coals. Fuel 206, 555–563. doi:10.1016/j.fuel.2017.05.101
Hubynskyi, S., Sybir, A., Fedorov, S., Usenko, A., Hubynskyi, M., and Vvedenska, T. (2024). Analysis of changes in global warming potential during enrichment and production of battery-grade graphite using electrothermal fluidized bed technology. IOP Conf. Ser. Earth Environ. Sci. 1348, 012028. doi:10.1088/1755-1315/1348/1/012028
Jara, A. D., Betemariam, A., Woldetinsae, G., and Kim, J. Y. (2019). Purification, application and current market trend of natural graphite: a review. Int. J. Min. Sci. Technol. 29 (5), 671–689. doi:10.1016/j.ijmst.2019.04.003
Kamal, A. S., Othman, R., and Jabarullah, N. H. (2020). Preparation and synthesis of synthetic graphite from biomass waste: a review. Syst. Rev. Pharm. 11 (2), 881–894.
Kausteklis, J., Cevc, P., Arčon, D., Nasi, L., Pontiroli, D., Mazzani, M., et al. (2011). Electron paramagnetic resonance study of nanostructured graphite. Phys. Rev. B – Condens. Matter Mater. Phys. 84 (12), 125406. doi:10.1103/PhysRevB.84.125406
Kawashima, Y., and Katagiri, G. (1995). Fundamentals, overtones, and combinations in the Raman spectrum of graphite. Phys. Rev. B 52 (14), 10053–10059. doi:10.1103/PhysRevB.52.10053
Kelamanov, B., Yessengaliyev, D., Burumbayev, A., Kabylkanov, S., and Samuratov, E. (2023). Technology of smelting complex alloys using high-ash coals and modeling of the possibilities of their application in the production of steel and ferroalloys. Eng. J. Satbayev Univ. 145 (4), 5–9. doi:10.51301/ejsu.2023.i4.01
Krasnovyd, S., Konchits, A., Shanina, B., Valakh, M., Yukhymchuk, V., Skoryk, M., et al. (2023). Coal from the outburst hazardous mine seams: spectroscopic study. Min. Mineral Deposits 17 (1), 93–100. doi:10.33271/mining17.01.093
Kumar, N., Pandian, R., Das, P. K., Ravindran, T. R., Dash, S., and Tyagi, A. K. (2013). High-temperature phase transformation and low friction behaviour in highly disordered turbostratic graphite. J. Phys. D Appl. Phys. 46 (39), 395305. doi:10.1088/0022-3727/46/39/395305
Li, X., Han, T., Zhou, Y., Xie, Y., Luo, Y., Huang, J., et al. (2024). Photoelectrocatalytic hydrogen evolution and synchronous degradation of organic pollutants by pg-C3N4/β-FeOOH S-scheme heterojunction. Sci. China Technol. Sci. 67 (4), 1238–1252. doi:10.1007/s11431-023-2604-x
Li, X., Hayashi, J. I., and Li, C. Z. (2006). FT-Raman spectroscopic study of the evolution of char structure during the pyrolysis of a Victorian brown coal. Fuel 85 (12-13), 1700–1707. doi:10.1016/j.fuel.2006.03.008
Lieleka, S. V., Panov, E. N., Karvatskyi, A.Ya., Pulinets, I. V., Chyrka, T. V., and Lazarev, T. V. (2014). Teploelektrycheskoe sostoyanye pechey grafytyrovanyia Achesona. Kyiv, Ukraine: NTUU KPI, 238.
Ma, H., Chen, S., Xue, D., Chen, Y., and Chen, Z. (2021). Outlook for the coal industry and new coal production technologies. Adv. Geo-Energy Res. 5 (2), 119–120. doi:10.46690/ager.2021.02.01
Morga, R., Jelonek, I., and Kruszewska, K. (2014). Relationship between coking coal quality and its micro-Raman spectral characteristics. Int. J. coal Geol. 134, 17–23. doi:10.1016/j.coal.2014.09.013
Nyathi, M. S., Clifford, C. B., and Schobert, H. H. (2013). Characterization of graphitic materials prepared from different rank Pennsylvania anthracites. Fuel 114, 244–250. doi:10.1016/j.fuel.2012.04.003
Orlando, A., Franceschini, F., Muscas, C., Pidkova, S., Bartoli, M., Rovere, M., et al. (2021). A comprehensive review on Raman spectroscopy applications. Chemosensors 9, 262. doi:10.3390/chemosensors9090262
Pappano, P. J., and Schobert, H. H. (2009). Effect of natural mineral inclusions on the graphitizability of a Pennsylvania anthracite. Energy & Fuels 23 (1), 422–428. doi:10.1021/ef800515r
Pilawa, B., Więckowski, A. B., Pietrzak, R., and Wachowska, H. (2002). Oxidation of demineralized coal and coal free of pyrite examined by EPR spectroscopy. Fuel 81 (15), 1925–1931. doi:10.1016/S0016-2361(02)00131-X
Pimenta, M. A., Dresselhaus, G., Dresselhaus, M. S., Cancado, L. G., Jorio, A., and Saito, R. (2007). Studying disorder in graphite-based systems by Raman spectroscopy. Phys. Chem. Chem. Phys. 9 (11), 1276–1290. doi:10.1039/B613962K
Potgieter-Vermaak, S., Maledi, N., Wagner, N., Van Heerden, J. H. P., Van Grieken, R., and Potgieter, J. H. (2011). Raman spectroscopy for the analysis of coal: a review. J. Raman Spectrosc. 42 (2), 123–129. doi:10.1002/jrs.2636
Qiu, T., Yang, J. G., and Bai, X. J. (2019). Preparation of coal-based graphite with different microstructures by adjusting the content of ash and volatile matter in raw coal. Energy Sources, Part A Recovery, Util. Environ. Eff. 42 (15), 1874–1881. doi:10.1080/15567036.2019.1604900
Qiu, T., Yang, J. G., and Bai, X. J. (2020). Insight into the change in carbon structure and thermodynamics during anthracite transformation into graphite. Int. J. Minerals, Metallurgy Mater. 27, 162–172. doi:10.1007/s12613-019-1859-9
Qiu, T., Yang, J. G., and Bai, X. J. (2021). Investigation on microstructural changes of Anthracite during Graphitization and effect of Silica content on product crystal structure. Energy Sources, Part A Recovery, Util. Environ. Eff. 43 (7), 769–782. doi:10.1080/15567036.2019.1632982
Rantitsch, G., Lämmerer, W., Fisslthaler, E., Mitsche, S., and Kaltenböck, H. (2016). On the discrimination of semi-graphite and graphite by Raman spectroscopy. Int. J. Coal Geol. 159, 48–56. doi:10.1016/j.coal.2016.04.001
Reich, S., and Thomsen, C. (2004). Raman spectroscopy of graphite. Philosophical Trans. R. Soc. Lond. Ser. A Math. Phys. Eng. Sci. 362 (1824), 2271–2288. doi:10.1098/rsta.2004.1454
Rui, X., Geng, Y., Sun, X., Hao, H., and Xiao, S. (2021). Dynamic material flow analysis of natural graphite in China for 2001-2018. Resour. Conservation Recycl. 173, 105732. doi:10.1016/j.resconrec.2021.105732
Salieiev, I. (2024). Organization of processes for complex mining and processing of mineral raw materials from coal mines in the context of the concept of sustainable development. Min. Mineral Deposits 18 (1), 54–66. doi:10.33271/mining18.01.054
Shi, M., Song, C., Tai, Z., Zou, K., Duan, Y., Dai, X., et al. (2021). Coal-derived synthetic graphite with high specific capacity and excellent cyclic stability as anode material for lithium-ion batteries. Fuel 292, 120250. doi:10.1016/j.fuel.2021.120250
Singh, S. B., and Dastgheib, S. A. (2024a). Characteristics of graphene oxide-like materials prepared from different deashed-devolatilized coal chars and comparison with graphite-based graphene oxide, with or without the ultrasonication treatment. Carbon 228, 119331.
Singh, S. B., and Dastgheib, S. A. (2024b). Characteristics of graphene oxide-like materials prepared from different deashed-devolatilized coal chars and comparison with graphite-based graphene oxide, with or without the ultrasonication treatment. Carbon 228, 119331. doi:10.1016/j.carbon.2024.119331
Singh, S. B., Haskin, N., and Dastgheib, S. A. (2023a). Coal-based graphene oxide-like materials: a comprehensive review. Carbon 215, 118447.
Singh, S. B., Haskin, N., and Dastgheib, S. A. (2023b). Coal-based graphene oxide-like materials: a comprehensive review. Carbon 215, 118447. doi:10.1016/j.carbon.2023.118447
Surovtseva, D., Crossin, E., Pell, R., and Stamford, L. (2022). Toward a life cycle inventory for graphite production. J. Industrial Ecol. 26 (3), 964–979. doi:10.1111/jiec.13234
Sybir, A., Hubynskyi, M., Fedorov, S., Hubynskyi, S., Vvedenska, T., and Bezuglyi, V. (2020). Effect of heat shock on graphitization of Donbass anthracite. Min. Mineral Deposits 14 (3), 43–49. doi:10.33271/mining14.03.043
Sybir, A. V., Hubynskyi, M. V., Balalaiev, O. K., Burchak, O. V., Sukhyy, K. M., Fedorov, S. S., et al. (2022). Effect of parameters of the anthracite heat treatment on the properties of carbon materials during shock heating. Vopr. Khimii i Khimicheskoi Tekhnologii 5, 94–101. doi:10.32434/0321-4095-2022-144-5-94-101
Sybir, A. V., Hubynskyi, S. M., Fedorov, S. S., Sukhyy, K. M., Hubynskyi, M. V., and Vvedenska, T. Y. (2023). Peculiarities of high-temperature refining of carbon materials. Voprosy Khimii & Khimicheskoi Tekhnologii (6), 177–186. doi:10.32434/0321-4095-2023-151-6-177-186
Tang, Y., Peng, P., Wang, S., Liu, Z., Zu, X., and Yu, Q. (2017). Continuous production of graphite nanosheets by bubbling chemical vapor deposition using molten copper. Chem. Mater. 29 (19), 8404–8411. doi:10.1021/acs.chemmater.7b02958
Wang, L., Qiu, T., Guo, Z., Shen, X., Yang, J., and Wang, Y. (2021). Ю changes and migration of coal-derived minerals on the graphitization process of anthraciteю. ACS Omega 6 (1), 180–187. doi:10.1021/acsomega.0c04120
Xu, Y., Chen, X., Wang, L., Bei, K., Wang, J., Chou, I. M., et al. (2020a). Progress of Raman spectroscopic investigations on the structure and properties of coal. J. Raman Spectrosc. 51 (9), 1874–1884.
Xu, Y., Chen, X., Wang, L., Bei, K., Wang, J., Chou, I. M., et al. (2020b). Progress of Raman spectroscopic investigations on the structure and properties of coal. J. Raman Spectrosc. 51 (9), 1874–1884. doi:10.1002/jrs.5826
Yadav, R., Sharma, A. K., and Sharma, S. (2024). Energy saving and corrosion control by heat recycling in re-baking process of graphite electrode manufacturing. Proc. Institution Mech. Eng. Part E J. Process Mech. Eng., 09544089251316144. doi:10.1177/0954408925131614
Yin, Y., Yin, H., Wu, Z., Qi, C., Tian, H., Zhang, W., et al. (2019). Characterization of coals and coal ashes with high Si content using combined second-derivative infrared spectroscopy and Raman spectroscopy. Crystals 9 (10), 513. doi:10.3390/cryst9100513
Zhang, D., Zhang, W., Zhang, S., Ji, X., and Li, L. (2023). Synthesis of expanded graphite-based materials for application in lithium-based batteries. J. Energy Storage 60, 106678. doi:10.1016/j.est.2023.106678
Zhao, S., Shen, S. S., Han, L., Tian, B. C., Li, N., Chen, W., et al. (2024). Ferroelectric perovskite PbTiO3 for advanced photocatalysis. Rare Met. 43 (9), 4038–4055. doi:10.1007/s12598-024-02847-x
Zhifei, L., Daiyong, C., Gaojian, C., Qingtong, C., and Zhongwei, B. (2023). High-temperature graphitization characteristics of vitrinite and inertinite. Front. Earth Sci. 11, 1235457. doi:10.3389/feart.2023.1235457
Keywords: anthracite, graphite, structural transformations, Raman and EPR spectroscopy, coal
Citation: Saik P, Sybir A, Vorona I, Isaieva O, Yukhymchuk V, Trachevsky V, Burchak O, Hubynskyi I and Lozynskyi V (2025) Research on high-temperature graphitization of anthracite using Raman and electron paramagnetic resonance spectroscopy. Front. Earth Sci. 13:1540335. doi: 10.3389/feart.2025.1540335
Received: 05 December 2024; Accepted: 30 April 2025;
Published: 15 May 2025.
Edited by:
Kezhen Qi, Dali University, ChinaReviewed by:
Xibao Li, Nanchang Hangkong University, ChinaSohan Bir Singh, University of Illinois at Urbana-Champaign, United States
Copyright © 2025 Saik, Sybir, Vorona, Isaieva, Yukhymchuk, Trachevsky, Burchak, Hubynskyi and Lozynskyi. This is an open-access article distributed under the terms of the Creative Commons Attribution License (CC BY). The use, distribution or reproduction in other forums is permitted, provided the original author(s) and the copyright owner(s) are credited and that the original publication in this journal is cited, in accordance with accepted academic practice. No use, distribution or reproduction is permitted which does not comply with these terms.
*Correspondence: Oleksandr Burchak, b3ZidXJjaGFrNTdAZ21haWwuY29t; Vasyl Lozynskyi, bHZnLm5tdUBnbWFpbC5jb20=