 Haicheng She1,2,3
 Yanxu Liang
 Siqi Liu
- 1School of Urban Construction, Yangtze University, Jingzhou, China
- 2Key Laboratory of Reservoir and Dam Safety Ministry of Water Resources, Nanjing, China
- 3Institute of Geotechnical Engineering, Xi’an University of Technology, Xi’an, China
- 4The Third Engineering Co., Ltd. of China Railway Seventh Group, Xi’an, China
Impact disturbance, scanning electron microscopy, nuclear magnetic resonance, and triaxial compression tests were carried out to reveal the damage evolution law of rock after different numbers of impacts. The relationship between the energy spectrum area and porosity was determined. Combining the Weibull distribution and the Drucker–Prager intensity criterion, a rock statistical damage model and a constitutive model considering impact disturbance were established. Research has shown that (1) With increased numbers of impacts, different types of pores increased. Among these, the increase in mesopores and macropores was relatively greater than the increase in micropores. The porosity and expansion rate both increased significantly. However, their growth rate slowed with the increase in the number of impacts. This indicates that mesopores and macropores had a buffering effect on the impact of the disturbance effect. (2) As the number of impacts increased, the initial shear strength decreased rapidly, indicating that the disturbance development of pores and cracks had a significant deterioration effect on the mechanical properties of rocks. Subsequently, the decrease in shear strength slowed, indicating that the growth and development of pores and cracks also had an inhibitory effect on impact disturbance.
1 Introduction
Power construction techniques such as mechanical breaking (Chen et al., 2025; Fu et al., 2024a) and blasting (Liu, 2024; Zhu et al., 2022) are often used in underground space construction projects. However, the dynamics propagate in the form of stress waves into the surrounding rock mass, inducing vibrations in the surrounding rock of underground chambers and causing damage to the surrounding rock (Fu et al., 2024b; Huang et al., 2019; Wang et al., 2021). Meanwhile, frequent dynamic disturbances will cause continuous cumulative damage to the surrounding rocks of the cave chamber (Huang et al., 2023; Zhang et al., 2024b), exacerbating the expansion and extension of pre-existing defects within the surrounding rock, reducing its mechanical properties, and causing destabilization of the surrounding rock in underground chambers (Jiang et al., 2019; Liu et al., 2022). Therefore, it is of great significance to study the damage and ontological relationship of rocks after different numbers of impacts.
In recent years, there have been many studies on rock disturbances. Luo et al. (2020) simulated three different levels of dynamic perturbations and analyzed the mechanical behavior and acoustic emission characteristics of rock damage by true triaxial tests. Chu et al. (2023) simulated the damage process of rock bodies under low peripheral pressure dynamic loading by sinusoidal wave perturbation triaxial loading tests and established a new perturbation damage intrinsic model according to the test results. Tang et al. (2016) used an improved split Hopkinson press bar. Dynamic disturbance tests were conducted on the serpentine under different static axial pressures and frequent dynamic disturbances. The dynamic deformation characteristics, peak stresses and strains, energy changes, and failure modes were investigated. Zheng et al. (2024a) conducted true triaxial static and dynamic coupled loading tests. The separation of true triaxial static-induced damage and micro dynamic-induced damage is proposed. Their evolutionary patterns were investigated, and corresponding damage models were developed. Jing et al. (2024) obtained the stress–strain curves of coal rock by simulating the dynamic and static coupled loading effects and studied the mechanical response and damage analysis of coal rock by using acoustic emission and DIC techniques. Niu et al. (2024) conducted cyclic disturbance tests on different kinds of water-bearing soft rocks through a creep-dynamic disturbance impact loading system. Input energy density, elastic energy density, dissipated energy density, and damage variable patterns of different water-bearing soft rocks during perturbation were analyzed. Wen et al. (2024) conducted a low-frequency disturbed dynamic uniaxial compression test on a coal specimen through a self-developed electro-hydraulic servo system coupled with dynamic and static loads. Strength evolution, surface deformation, acoustic emission (AE) characteristic parameters, and damage modes of coal specimens under different levels of static preload were investigated.
Most studies focus on static or quasi-static loads. However, in actual engineering, the rock body is often in a coupled environment of high stress and dynamic disturbance. Existing studies have shown that the mechanical behavior of rocks under dynamic perturbation is controlled by multiple factors such as loading rate (Sun et al., 2024; Wang et al., 2025), stress paths (Tao et al., 2021; Zheng et al., 2024b), confining pressure conditions (Huang et al., 2024b; Zhang et al., 2024a), fracture (Huang et al., 2024b; Zhang et al., 2024a), and fracture structure (Ying et al., 2024). Scholars have revealed localization phenomena such as stress wave propagation and fractal extension of cracks using Hopkinson compression rod experiments and digital image correlation techniques (Huang et al., 2024c; Li et al., 2024; Yang et al., 2024; Yue et al., 2024; Zang et al., 2024; Zhao et al., 2024) and have developed numerical simulation tools such as discrete element and finite difference methods (Liang et al., 2024; Ni et al., 2024; Xie and Li, 2024; Yu et al., 2024). However, these tools are difficult to use with complex disturbances in real engineering situations. Meanwhile, there is still a lack of systematic knowledge about the rock damage evolution under multi-field coupling.
In summary, many scholars have used various dynamic loading methods to analyze rock deformation, strength, and damage (Huang et al., 2024a). Few scholars have considered the special case of the coupling of shock and loading. In this article, nuclear magnetic resonance (NMR) is used to analyze the change rule of the pore space of rock samples after different numbers of impacts. The deterioration law of the mechanical properties of rock specimens after disturbance is analyzed using a triaxial compression test. Finally, the total damage variable (Dm) was substituted into the rock damage constitutive equation according to the Lemaitre equivalent stress principle in damage mechanics. The result is combined with the Drucker–Prager strength criterion to establish a statistical damage model for rocks and a statistical damage constitutive model for rock loading, considering impact disturbance. An in-depth investigation of the nonlinear response characteristics of rocks subjected to dynamic disturbance provides theoretical support for geotechnical engineering dynamic stability assessment.
2 Materials and methods
2.1 Preparation of specimens
To investigate the deterioration response of rock mechanical properties after impact, the gray–black shale of Longmaxi Formation in the JiaoShiBa area at a depth of 2,330–2,410 m was selected to be similar in composition and microstructure to the shale gas aggregation layer, which is the target layer for fracturing and extraction. Because it is difficult to take samples from the ground, the sampling process will inevitably cause irreversible damage to the rock. This article uses an X diffractometer and electron microscope scanning test for analysis.
2.1.1 Composition of the specimen
An XRD-7000 X diffractometer and a nuclear magnetic resonance instrument were chosen to sample six groups to obtain the content of various mineral groups of rock samples; see Figure 1.
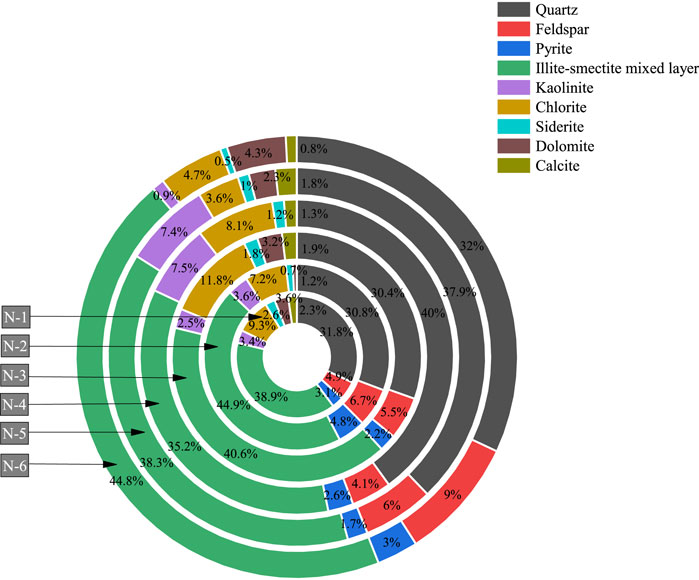
Figure 1. Mineral composition of experimentally measured rock samples. Minerals include quartz, feldspar, pyrite, illite–smectite mixed layer, kaolinite, chlorite, siderite, dolomite, and calcite.
As can be seen from Figure 1, the main mineral components of the shale specimens are clay minerals such as an illite–smectite mixed layer, chlorite, and kaolinite, with contents ranging from 48.8% to 56.4%. Quartz, feldspar, and pyrite contents range from 38.6% to 48.2%; carbonatite contents range from 3.6% to 5.7%. The contents of the mineral components of each group of specimens are very close to each other.
2.1.2 Microstructure analysis of specimens
The surface pore microstructure of shale rock samples was analyzed using a scanning electron microscope (SEM) model JSM-6700F from the Xi’an University of Technology. The structural development and distribution characteristics of microfine view pores, cracks, and lysimetric pores on the shale surface, as well as the distribution, arrangement, and cementation status of quartz and clay minerals, can be analyzed by observing the rock sample slices through the scanning electron microscope, as shown in Figure 2.
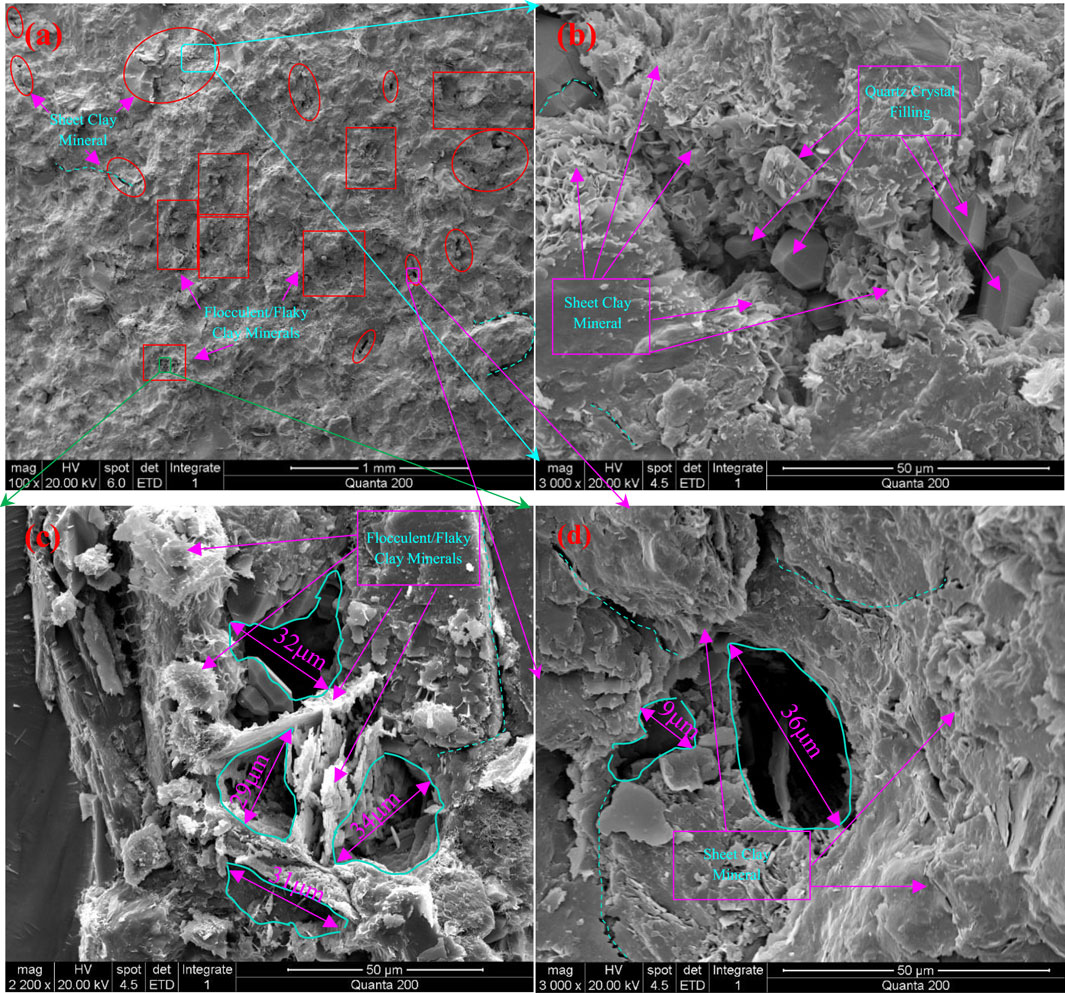
Figure 2. Scanning electron microscopic images of the surface of a shale sample. (a) Magnification of ×100. (b) Magnification of ×3,000. (c) Magnification of ×2,200. (d) Magnification of ×3,000.
Figures 2a–d show the scanning electron microscope images of shale at different magnifications, with magnifications of ×100, ×3,000, ×2,200, and ×3,000, respectively, and Figures 2b–d show the localized magnified SEM images of Figure 2a. Figure 2a is a low magnification image in which it can be seen that the overall structure of the shale is relatively dense and there are more microcracks, flocculent/flaky clay minerals, and locally developed solvation pores (also known as organic matter pores). Figures 2b–d are local magnified high magnification images in which it can be seen that the local clay mineral content is high. The flocculent/flaky clay mineral crystal structure can be clearly distinguished. There are many tiny cracks or pores within the crystals, which are known as inter-crystalline microcracks or inter-crystalline pores, and their slit widths or pore diameters are small. Under rock-forming and weathering, a large number of tectonic pores or cracks are formed, known as intergranular pores or tectonic cracks, which are generally larger than the size of intergranular defects and smaller than the size of organic solution pores. Figure 2b shows that in addition to filling a large number of clay minerals in the tectonic cracks, fillers such as quartz and feldspar are also present. Figure 2c shows that the content of clay minerals is higher near the solution holes and multiple solution holes appear, indicating that the clay minerals are highly susceptible to hydration expansion and softening by dissolution under the action of water or changes in the physical state, which increases the porosity, loosens the structure, and reduces the strength of the local shale. In Figure 2d, it can be seen that the formation of solution holes is related to the rock formation type, geological environment, underground fluids, etc. The size of the solution holes is generally 10 ∼ 1,000 nm, the individual diameters can be in micrometers, and the largest diameter of the solution holes obtained in the figure is 36 µm. The electron microscope scanning revealed that the shale specimens selected for the test have obvious structural anisotropy and abundant microcracks.
2.1.3 Dimensions of the specimen
Because of the small size of the oil well borehole, the structural surface of the formation rock was ignored. It was considered to be a rock specimen because of the size requirements of the NMR test specimen. Then, according to the petroleum industry standards recommended by the International Society for Rock Mechanics (ISRM), the specimen size was machined to a cylindrical shape with a diameter of 25 mm and a height of 50 mm, with the error controlled within 2∼4 mm. The flatness of the end face is 0.1 mm.
2.2 Specimen device
(1) This impact disturbance test used the China University of Petroleum (East China) rock impact damage experimental device. It accepts 50 mm × 25 mm cylindrical rock specimens and can generate dynamic impact pressure on the rock specimen to simulate the rock impact disturbance, damage, and destruction. (2) Rock specimen microstructure analysis using a MiniMR-60 nuclear magnetic resonance instrument (NMRI) is non-destructive, non-radiation testing that is easy to operate and provides clear imaging in a short time. (3) The MTS triaxial pressure tester produced by GCTS Company of the United States was used to conduct a triaxial compression test on the rock specimens after impact.
2.3 Test methods
(1) The test device index parameters used a heavy mass of 80 kg, a height drop of 0.5 m, a peak pressure of 176.8 MPa, an average pressurization rate of 84.652 MPa/s, and 1, 2, 4, 8, 16, and 32 impacts for the impact dynamic damage test.
(2) Scanning electron microscopy (SEM) and nuclear magnetic resonance (NMR) were used to analyze the change rule of rock microstructure after different numbers of impacts.
(3) The study aimed to examine the deterioration of mechanical properties of rock specimens through triaxial compression tests and to provide experimental data to establish a statistical damage constitutive model.
3 Analysis of test results
3.1 SEM image analysis of rock impact disturbance
Excerpts of SEM images of rocks after different numbers of dynamic impacts are shown in Figures 3a–f. Their magnifications are ×4,000, ×4,000, ×800, ×1,215, ×2,000, and ×160.
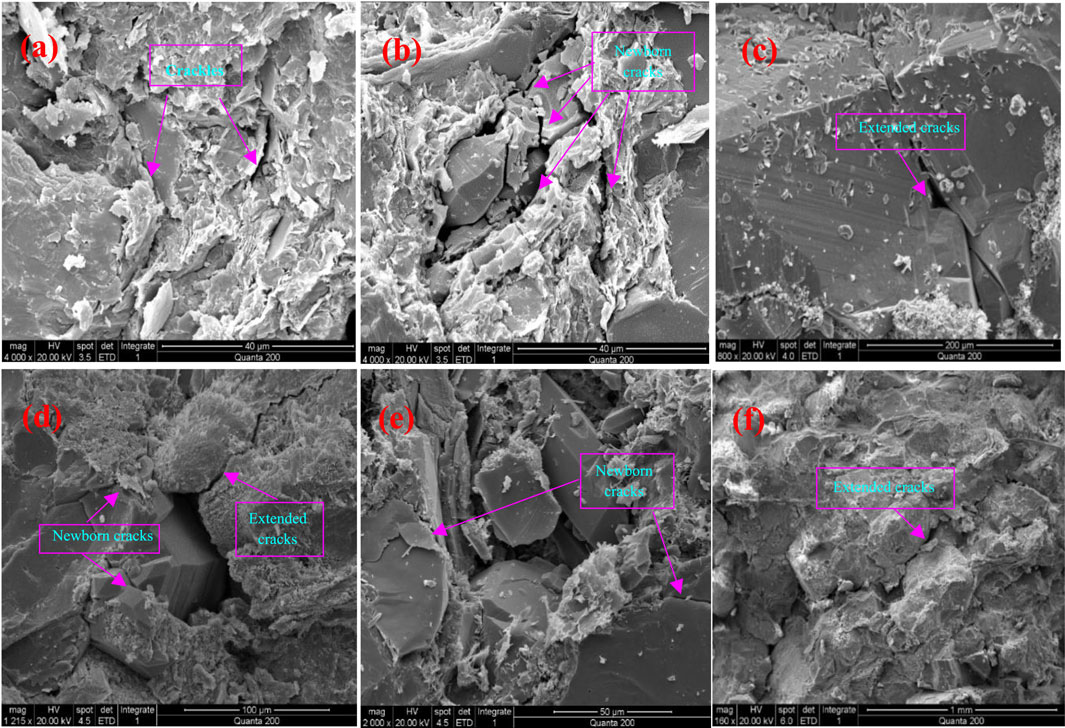
Figure 3. SEM images of the rock sample surfaces after impact disturbance tests. (a) One impact, with a magnification of ×4,000. (b) Two impacts, with a magnification of ×4,000. (c) Four impacts, with a magnification of ×800. (d) Eight impacts, with a magnification of ×1,215. (e) Sixteen impacts and magnification of ×2,000. (f) Thirty-two impacts, with a magnification of ×160.
Figure 3 shows that crack extension and obvious newborn cracks were generated on the surface of the rock specimen, both overall and locally. Most of the cracks extended along the intermineral crystals, forming a large number of intergranular cracks. From Figures 3a,b, it can be observed that the local multiple cracks sprout and expand simultaneously, and the direction of their expansion is the same. The cracks show obvious dislocation, indicating that the local damage is mainly dominated by shear damage. Finally, these cracks form a very developed crushing zone in the local area. From Figures 3d,e, it can be seen that the nascent cracks are mainly generated at the walls of the organic solvation holes, indicating that there is an obvious stress concentration phenomenon at the organic solvation holes during the propagation of the stress wave. From Figures 3c,f, it can be seen that the crack extension mainly spreads and expands along the crystal intergranular space, and the crystal itself did not crack, indicating that the bond strength of the intergranular cement is lower than the crystal strength. It is shown that the impact of shock vibration on rock specimens is mainly the expansion, conversion, and aggregation of cracks to form obvious cracks and the aggregation of cracks until destruction. This may be the main mechanical behavior of rock damage under dynamic action.
3.2 Rock impact disturbance pore structure change rule
The distribution pattern of the T2 energy spectrum of rock samples after different numbers of impacts measured by the NMR test is shown in Figure 4 to investigate the development of internal pore size and the change rule of pore space of rock samples after the action of impact perturbation.
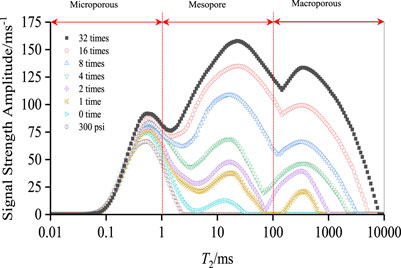
Figure 4. Relationship between the signal strength amplitude and T2 energy spectra of shale with increasing numbers of impacts.
As can be seen from Figures 1, 4, the rock specimen initially has a high number of micropores and a low number of medium and large pores. After experiencing different numbers of impacts, the second and third spectral peaks are significantly higher, and their increases are several times or even ten times higher, which indicates that the number of medium and large pores is increased. This indicates that there is a drastic shift from micropores to medium pores, and from medium pores to large pores. It also indicates that large pores have a preferential extension characteristic under the effect of impact. (2) The first spectral peak has a slight increase, indicating that the number of micropores also increases slightly, which suggests that the number of micropores budding after impact is small and that the pore structure of micropores is relatively stable. (3) The analysis of the axes of the different spectral peaks reveals that the axes of the second and third spectral peaks have an offset phenomenon, which also indicates the signs of enlargement and expansion of the aperture.
According to the literature (She et al., 2022), the relationship between the radius of the rock pore throat (r) and the relaxation time (T2) is established as follows:
where Fs is the geometry factor; for columnar pores, generally take Fs = 2, ρ(T2) = 0.5 × 10⁻⁸ ms−1. Then, we have the r and T2 conversion equation:
From the conversion Equation 2, the pores can be categorized according to the relaxation time into micropores (0.01 ms ≤ T2 < 1 ms), mesopores (1 ms ≤ T2 < 100 ms), and macropores (100 ms ≤ T2 < 10,000 ms), as shown in Figure 4.
According to Yang et al. (2022), the energy spectrum area is the spectral area of the T2 energy spectrum plot, which can indicate the following relationship: (1) The spectral area is related to the porosity of the rock. (2) The size of the spectral area of the first, second, and third peaks is proportional to the total number of micropores, mesopores, and macropores, respectively.
The energy spectral areas corresponding to micropores, mesopores, and macropores in Figure 6 were counted to obtain Table 1, and the percentages of micropores, mesopores, and macropores were analyzed for different numbers of impacts in Figures 5, 6.
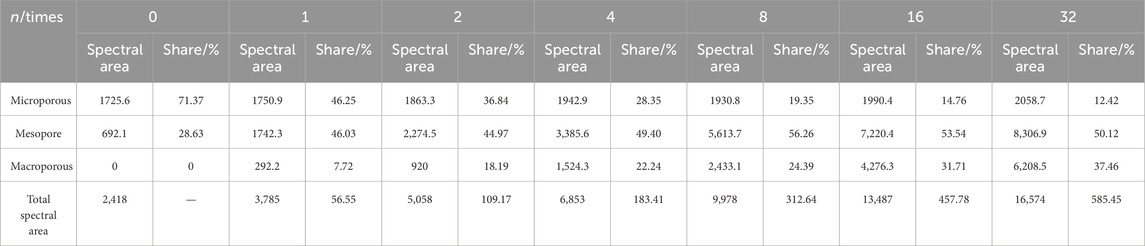
Table 1. Statistical parameters of T2 energy spectrum after different numbers of impacts.
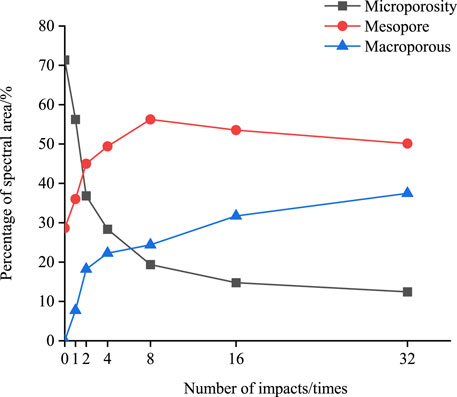
Figure 5. Relationship between the micropore, mesopore, and macropore percentage of the spectral area and number of impacts.
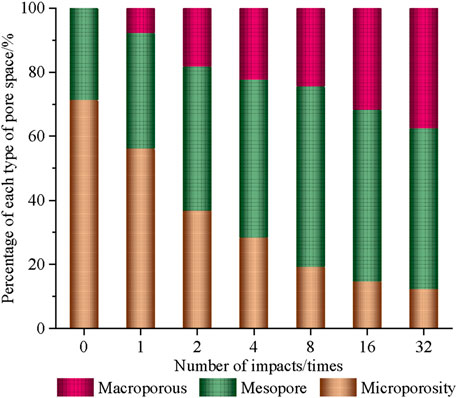
Figure 6. Relationship between the micropore, mesopore, and macropore percentages of the pore space and number of impacts.
As can be seen from Figure 5, with the increase in the number of impacts, the rate of decrease of the microporous percentage is faster at the initial stage, and then the rate of decrease becomes slower. Both the mesopores and macropores share a faster rate of growth initially, and then the rate of growth flattens out, but there is still growth in the T2 energy spectrum area. The negative value of the increase of the mesopores in the later stage indicates a tendency of the mesopore-to-macropore transition and indicates that the expansion and conversion of the pore size occur mainly at the initial stage and is also accompanied by the sprouting of micropores as the impact damage evolves.
As can be seen from Table 1 and Figure 6, with the increase in the number of impacts, the percentages of micropores, mesopores, and macropores showed different degrees of change. The percentage of micropores was 71.37% in the absence of impacts and finally decreased to 12.42%, which is a substantial reduction. Meanwhile, both mesopores and macropores increased. The rate of increase of mesopores was faster in the initial stage, and the rate of increase of macropores increased in the later stage. As a result, the damage evolution and extension of rock pores can be known from the pore size conversion.
3.3 Rock impact disturbance volume change rule
According to the author’s research results (She et al., 2022), the T2 energy spectrum area is directly proportional to the size of the pore volume of saturated rock samples. The relationship between the pore ratio and the signal intensity of the T2 energy spectrum can be established as Equation 3.
where e0 is the initial pore ratio; ∆mw is the mass of flowable water, g; ∆mw0 is the mass of flowable water, g, at initial conditions; ρb0,i(T2) and ρL0,i(T2) are the signal intensities of the T2 energy spectra of water-saturated rock and post-centrifugation rock specimens under initial conditions, ms−1. ρb,i(T2) and ρL,i(T2) are the signal intensities of the T2 energy spectrum of water-saturated rocks and rocks after centrifugation.
Again, based on the relationship between the pore ratio and expansion rate, it is known that:
where ed is the pore ratio of the rock specimen after impact power disturbance.
The NMR test data are shown in Table 2, and the pore ratio and expansion rate with the number of impacts change curve is shown in Figure 7.
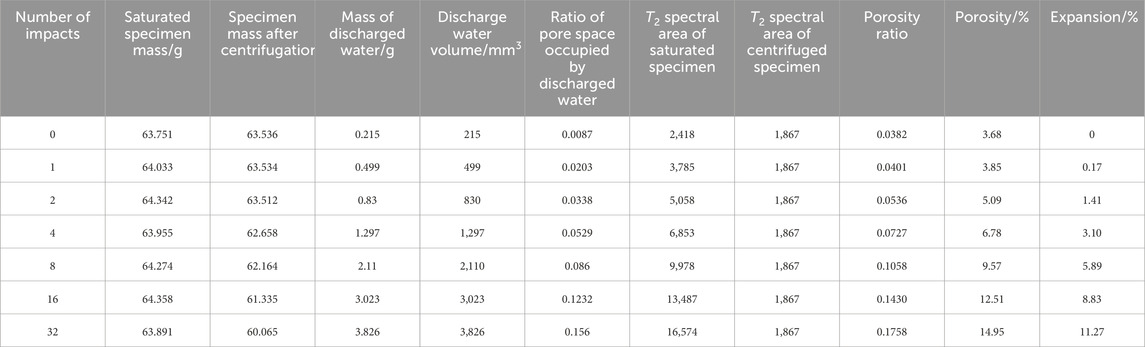
Table 2. The volume change law of a rock sample after different numbers of impacts.
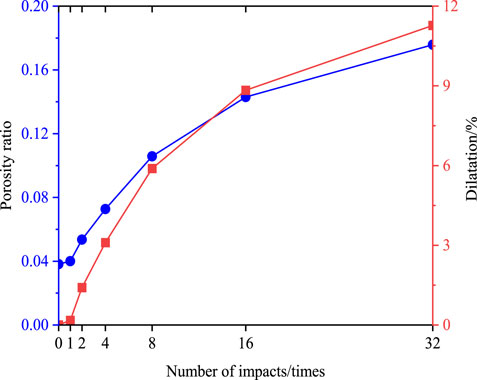
Figure 7. Changes in rock pore ratio and expansion rate after impacts. The relationship between the porosity ratio and the number of impacts is indicated by the blue curve. The relationship between dilatation and the number of impacts is indicated by the red curve.
As can be seen from Figure 7, the rock porosity ratio and expansion rate initially change slightly during the shock perturbation. There is a significant increase in the pore ratio and expansion rate with the increase in the number of impacts, indicating that the mechanical superposition effect produced by the successive application of impact perturbations is prominent. Then, as the number of impacts increases, the rate of increase of the pore ratio and expansion rate slows again, indicating that the increase of the internal pores or cracks of the rock has another buffering effect on the impact disturbance.
3.4 Rock impact disturbance and rock compressive strength change rule
The test results of the compressive strength of rock specimens with a laminar pinch angle of 90° measured by the triaxial compressive test with different numbers of impacts are shown in Figure 8.
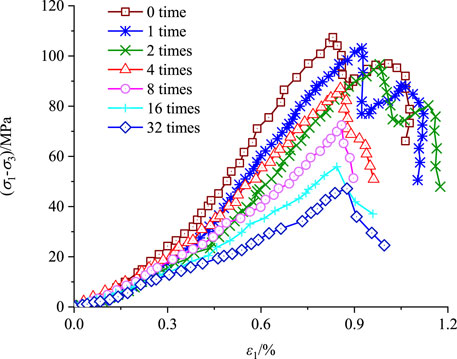
Figure 8. Triaxial compression curve of shale after different numbers of impacts.
As can be seen from Figure 8, the damage of the rock specimens after different numbers of impacts went through four stages: the compression-tight closure stage, the elastic linear deformation stage, the initiation and extension stage, and the post-peak damage stage. The main deformation characteristics are as follows: (1) Before the point of destruction, the stress–strain curve basically shows a linear relationship. After the damage point, the stress–strain curve decreases rapidly, indicating that the rock is a brittle material and that increasing the number of impacts does not change the brittleness of the rock. (2) With the increase in the number of impacts, the compressive strength limit value of the rock has a significant decrease, and the modulus of elasticity also has a significant decrease, indicating that the impact disturbance has a degrading effect on the mechanical properties of the rock. (3) When the number of impacts is 0, 1, or 2 (lower numbers), a second peak occurs after the point of destruction, while when the number of impacts is 4, 8, 16, or 32 (higher numbers), there is no significant second peak after the point of destruction. The reason for this is that the internal structure of the rock specimen is more severely damaged at a higher number of impacts, and the friction at the rupture surface is less when circumferential pressure is provided. The specific deterioration of shear stress limit values and modulus of elasticity is shown in Figure 9.
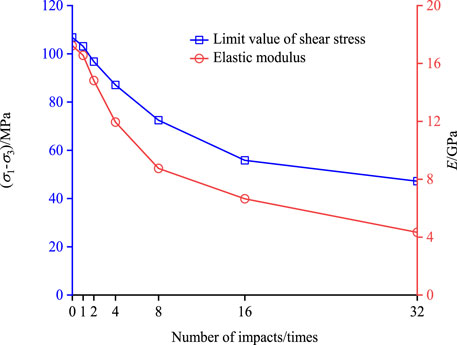
Figure 9. Changes in rock shear strength and elastic modulus after different numbers of impacts. The relationship between rock shear strength and the number of impacts is indicated by the blue curve. The relationship between rock elastic modulus and the number of impacts is indicated by the red curve.
As can be seen from Figure 9, with the increase in the number of impacts, the rock shear strength limit value decreases faster at the initial stage, indicating that the expansion of defects such as pores and cracks within the rock produces an obvious deterioration of the mechanical behavior of the rock. This is essentially consistent with the fine-scale pore structure perturbation response of rock specimens. At the beginning of the shock, the mechanical response produced by the shock action is smaller, and then the shock action produces a significant deterioration effect, indicating that the mutual coupling of shock and loading acts to produce a synergistic effect on the shock perturbation. Finally, this effect decreases again, suggesting that the increase in pore and crack size will in turn have a dampening effect on the impact disturbance effect.
4 Statistical damage variables and ontological modeling of rocks
4.1 Statistical impairment variables
The discussion of damage degradation patterns under shale loading continues through shale triaxial compression experiments, after a perturbing effect of a factor. The use of the Weibull distribution to examine the microscopic damage of rock materials has a strong theoretical basis. Its damage probability density function p(ε) is
where: F0 and m are Weibull distribution parameters, which can be determined by testing.
In any given interval [ε-dε, ε], the number of destructive microelements produced is Np(x)dx, and the number of destructive microelements, Nf (ε), is when the rock strain is made to reach a certain level, ε, under loading conditions:
The damage variable (D) of a rock under loading can be defined as the ratio of the number of destroyed microelements
From Equations 5, 7:
Similarly, with the volume expansion rate as the variable, the shock perturbation damage variable Dd is
Based on the generalized strain equivalence principle, rock damage can be modeled by coupled freeze-thaw loading (Zhang et al., 2020). We consider each of the factor disturbances of the rock to be analogous to the action of freezing and thawing on the rock. Therefore, the total damage variable of the loaded shale for each disturbance condition is obtained to be expressed as
Substituting Equations 8, 9 into Equation 10 yields a model of the total damage variable of the rock after impact perturbation and loading:
4.2 Statistical damage constitutive model formulation
According to the Lemaitre equivalent stress principle (Lemaitre, 1992), in continuous medium damage mechanics, substituting the total damage variable Dm into the rock damage constitutive equation yields
where: (
Under the conventional triaxial test stress state, Equation 12 is rewritten as a component form of the rock damage equation:
For rock specimen microelements, introducing the Drucker–Prager yield criterion, there are
where: I1 is the first invariant of the stress tensor; J2 is the second invariant of the stress bias. α0 is the strength parameter of the rock specimen micro metamorphic body and is only related to the angle of internal friction
where:
According to the principle of damage mechanics, the effective stress expression of the damaged body is
From the generalized Hooke’s law, the axial strain of a rock specimen is
where µ is Poisson’s ratio; Ed is the modulus of elasticity after shock perturbation, GPa; ε1 is the axial strain, %.
Substituting Equation 17 into Equation 18 reduces to
From Equations 17, 19, we get
Substituting Equation 20 into Equation 16 and taking into account the conventional triaxial test
Substituting Equation 21 into Equation 15 yields an expression for the distribution F in Equation 13 for the principal strain ε1:
Rocks are hard and brittle materials that essentially exhibit elastic deformation until the point of destruction. Again, based on the principle of equivalent stress, the modulus of elasticity can also be used as a covariate to measure the damage. Then, Dd defines the impact disturbance damage variable.
From Equations 11, 23, we get
Substituting Equation 24 into Equation 22 yields
4.3 Determination of the parametric model
When a rock specimen undergoes n impact perturbations, if the peak stress–strain curve at a specific circumferential pressure (60 MPa is chosen in this article) is represented by σdn, εdn indicates the strain corresponding to the stress at the peak of the stress–strain curve. Then, the geometric condition is satisfied at the peak (extreme) point of the stress–strain relationship curve: (a) when ε1 = εdn,σ1 = σdn; (b) when ε1 = εdn, ∂σ1/∂ε1 = 0.
Substituting the equation of the geometric condition (a) into Equation 13 yields
To utilize the geometric condition (b), Equations 13, 14 are considered functions for ε1, ε3,
where:
Where: F(1) is the distribution covariate of ε1.
where:
Where F(3) is the distribution covariate of ε3.
From Equation 25, dF in Equations 29, 30 is further fully differentiated, after which it is reduced to a relation containing only the terms dε1, dε3, dσ1, dσ3, and dn.
where:
where:
Assuming that F0, m,
where:
Substituting Equations 31–37 into Equations 29, 30, respectively, and replacing them yields
where:
Solving the system of Equation 38, eliminating dσ3 yields an expression for dσ1, which is then compared with Equation 27, based on the use of the geometric condition (b)
where
Solving Equation 39 gives
where: Fc is the corresponding F when ε1 = εcn.
From Equations 26, 40, we get
Equations 41, 42 are the theoretical expressions of the model parameters, and all the variables contained therein can be obtained from the conventional test, considering the theoretical impact perturbation role, reflecting the depth coupling of impact and loading, which, when substituted into the equations, can reflect the intrinsic model of the whole process of rock damage. From Equations 9, 25, 41, 42, the total rock damage variable can be reached.
Equation 43 can analyze the deformation damage of rock from the nature of damage mechanics, reflecting the relationship between the damage evolution and the amount of rock stress–strain state in the whole process of rock from impact perturbation to loading, which is also the embodiment of the mechanical behaviors of the microscopic perturbation effects on the macroscopic level.
Derivation of Equation 43 for the stress state, strain, and number of impacts yields the total damage evolution rate equation:
Equation 44 shows that the total rock damage variable develops along three evolutionary pathways: strain, peri-compressive stress state, and number of impacts.
Similarly, the damage isomorphic model of rock impact disturbance and loading coupling can be reached from Equations 13, 25, 41, 42.
4.4 Model validation and discussion
In order to verify the accuracy of the total damage model and the damage eigenmodel derived in this article, the mechanical test data of the rocks subjected to different numbers of impacts in Figures 8, 9 were collated. The test conditions for these data were a stratigraphic lamination angle of 90°, an enclosing rock stress of 60 MPa, and coupled post-impact full process effects of disturbance damage.
As can be seen in Figure 10, the starting points of the total damage variables are increased with increasing numbers of impacts, indicating that the damage values generated by the impacts have been taken into account. The rates of change of the total rock damage variable with the increase of strain are all faster at first until the strain reaches 0.1%, and then the rate of change of the damage value appears to decrease and finally becomes flat. The total damage evolution rate is shown in Figure 11.
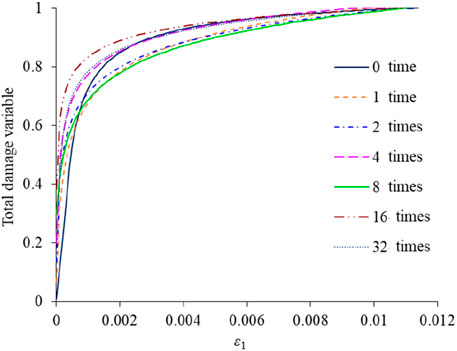
Figure 10. The relationship between the total damage variable and ε1 after different numbers of impacts.
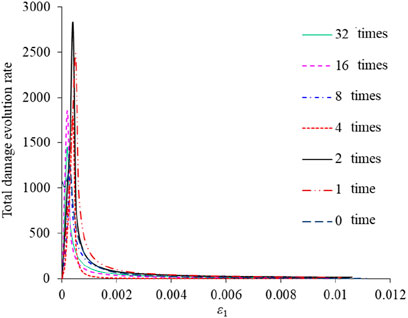
Figure 11. The relationship between total damage evolution rate and ε1 after different numbers of impacts.
As can be seen from Figure 11, with the increase in the number of impacts, the change in the damage evolution rate of the rock specimen varies from high to low. The maximum evolution rate was observed in the rock specimen after two impacts, while the evolution rates after other numbers of impacts are not very different from each other.
The model curves are then compared with the test curves in Figure 12.
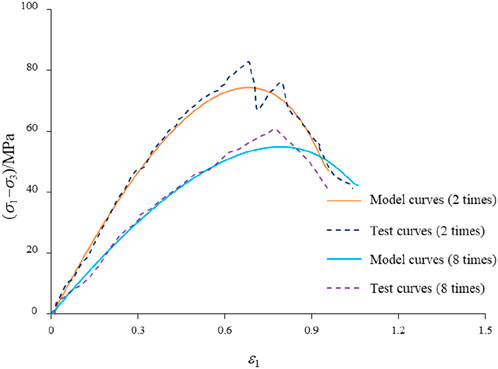
Figure 12. Comparison between the constitutive model and the test curves.
As can be seen from Figure 12, the predicted curve of the model is in better agreement with the experimental curve, which verifies the validity of the model. However, the experimental peak is slightly higher than the model peak, indicating that the use of the Drucker–Prager criterion is too conservative and can be adopted in the elastic modulus stage. However, the model cannot describe deformation near the limit of a hard, brittle rock with abrupt deformation.
5 Conclusion
(1) The distribution pattern of the T2 energy spectrum of rocks after different numbers of impacts was measured by nuclear magnetic resonance (NMR) testing, and the change rule of the pore structure of rock specimens was analyzed. There is a tendency for the different sizes of pores to increase with an increased number of impacts, with a smaller increase in micropores and a larger increase in both medium and large pores.
(2) Patterns of change in the volume disturbed by shocks: There is a significant increase in the pore ratio and expansion rate with the increasing number of impacts, indicating that the mechanical effects resulting from the superposition of successively applied impacts are prominent. Then, as the number of impacts increases, the rate of increase in the pore ratio and expansion rate slows again, suggesting that the number of internal pores or the size of the pores increases, buffering the impact effect.
(3) The deterioration law of the mechanical properties of rock specimens after the disturbance was analyzed by a triaxial compression test. The higher the number of impacts, the faster the rate of shear strength reduction in the pre-period, indicating that the expansion of defects such as pores and cracks within the rock specimens has a significant deteriorating effect on the mechanical behavior of the rocks. At the beginning of the shock, the mechanical response produced by the shock perturbation action is smaller, and then the shock action produces a significant deterioration effect, indicating that the mutual coupling of the shock perturbation and the loading action produces a synergistic effect on the shock perturbation. Finally, this effect decreases again, suggesting that the increase in pore and crack size inhibits the impact disturbance effect.
(4) The total damage variable (Dm) was substituted into the rock damage constitutive equation according to the Lemaitre equivalent stress principle in damage mechanics. A statistical damage model for rock specimens and a damage eigenstructure model coupled with impact and loading were established based on the Drucker–Prager strength criterion, and the reasonableness of the models was verified by experimental data.
Data availability statement
The raw data supporting the conclusions of this article will be made available by the authors, without undue reservation.
Author contributions
HS: funding acquisition, resources, supervision, writing – original draft, and writing – review and editing. YL: data curation, writing – original draft and writing – review and editing. SL: investigation and writing – review and editing. ZH: conceptualization and writing – review and editing.
Funding
The author(s) declare that financial support was received for the research and/or publication of this article. This work was supported by the National Natural Science Foundation of China (General Program) (Grant Nos. 52274007, 51974255), the Open Fund of the Hubei Key Laboratory of Oil and Gas Drilling and Production Engineering (Grant No. YQZC202204), the Open Fund of the Shaanxi Key Laboratory of Wellbore and Reservoir Flow and Rock Mechanics for Oil and Gas (Grant No. WSFRM20210101001), and the Development and Research Fund of the Key Laboratory of Reservoir and Dam Safety, Ministry of Water Resources (Grant No. YK323003).
Conflict of interest
Author SL was employed by The Third Engineering Co., Ltd. of China Railway Seventh Group.
The remaining authors declare that the research was conducted in the absence of any commercial or financial relationships that could be construed as a potential conflict of interest.
Generative AI statement
The author(s) declare that no Generative AI was used in the creation of this manuscript.
Publisher’s note
All claims expressed in this article are solely those of the authors and do not necessarily represent those of their affiliated organizations, or those of the publisher, the editors and the reviewers. Any product that may be evaluated in this article, or claim that may be made by its manufacturer, is not guaranteed or endorsed by the publisher.
References
Chen, Q., Zuo, Y., and Zheng, L. (2025). Deformation failure mechanism and stability-control technology of deep layered clastic-rock roadway under dynamic disturbance. Tunn. Undergr. Space Technol. 156, 106255. doi:10.1016/j.tust.2024.106255
Chu, S., Chen, S., Liu, M., Huang, J., and Wei, H. (2023). The time-dependent deformation and damage constitutive model of rock based on dynamic disturbance tests. Open Geosci. 15, 20220536. doi:10.1515/geo-2022-0536
Fu, J., Liu, M., Labuz, J. F., Zhang, Q., Haeri, H., and Hou, R. (2024a). Investigating rock-breaking mechanisms under TBM hobs: energy analysis and finite element modeling. Strength Mater-Engl. Tr. 56, 568–585. doi:10.1007/s11223-024-00672-2
Fu, S., Li, H., Liu, L., Li, Q., and Li, X. (2024b). Study on the characteristics of blast-induced damage zone by using the wave velocity field inversion technique. Comput. Geotech. 176, 106808. doi:10.1016/j.compgeo.2024.106808
Huang, D., Qiu, X., Shi, X., Gou, Y., and Zhou, J. (2019). Experimental and numerical investigation of blast-induced vibration for short-delay cut blasting in underground mining. Shock Vib. 2019, 5843516. doi:10.1155/2019/5843516
Huang, J., Chen, S.-H., Liu, M.-L., and Li, K.-P. (2023). Physical model test and numerical simulation study of cumulative damage to deep tunnel surrounding rock under cyclic blasting load. Int. J. Damage Mech. 32, 161–184. doi:10.1177/10567895221133133
Huang, M., Yu, D., Li, X., and Zhao, Y. (2024a). Study on the mechanical characteristics of sand pebble surrounding rock considering the disturbance effect of tunnel excavation. Front. Earth Sci. 12, 1341922. doi:10.3389/feart.2024.1341922
Huang, X., Lu, Y., Xia, B., and Luo, Y. (2024b). Permeability evolution of fractured coal subject to confining stress and true triaxial stress loading: experiment and mathematical model. Front. Earth Sci. 12, 1395372. doi:10.3389/feart.2024.1395372
Huang, X., Xu, L., Du, J., and Ding, D. (2024c). Propagation of the longitude stress wave through a filled fracture considering cyclic loading/unloading behaviours. Rock Mech. Rock Eng. 57, 4771–4786. doi:10.1007/s00603-024-03800-1
Jiang, H., Li, J., and Deng, S. (2019). Theoretical and experimental investigation of sliding instability in blocky rock system triggered by external disturbance. Acta Geophys 67, 775–787. doi:10.1007/s11600-019-00287-1
Jing, S., Wen, Z., Jiang, Y., Wen, J., and Du, W. (2024). Mechanical behaviors and failure characteristics of coal-rock combination under quasi-static and dynamic disturbance loading: a case based on a new equipment. Geomech. Geophys. Geo-Energy Geo-Resour. 10, 2. doi:10.1007/s40948-023-00717-x
Lemaitre, J. (1992). A course on damage mechanics. Berlin, Heidelberg: Springer Berlin Heidelberg. doi:10.1007/978-3-662-02761-5
Li, J., Xu, F., Du, Y., Liu, X., Ma, J., and Zhu, S. (2024). Evaluation method of tunnel cracking disease under biased pressure based on enhanced image fractal features. Constr. Build. Mater. 441, 137530. doi:10.1016/j.conbuildmat.2024.137530
Liang, J., Tong, D., Tan, F., Yi, X., Zou, J., and Lv, J. (2024). Numerical manifold method for thermo-mechanical coupling simulation of fractured rock mass. J. Rock Mech. Geotech. Eng. 16, 1977–1992. doi:10.1016/j.jrmge.2023.07.020
Liu, X. (2024). The study of the blast resistance performance of underground cavern support structures under the effect of explosive ground loads. Front. Earth Sci. 12, 1423731. doi:10.3389/feart.2024.1423731
Liu, Y., Lu, C.-P., Zhang, X.-F., Guo, Y., Song, C.-H., and Wang, C. (2022). Failure and instability characteristics of coal-rock parting-coal structures with rough discontinuities. Rock Mech. Rock Eng. 55, 7063–7080. doi:10.1007/s00603-022-03011-6
Luo, D., Su, G., and Zhang, G. (2020). True-triaxial experimental study on mechanical behaviours and acoustic emission characteristics of dynamically induced rock failure. Rock Mech. Rock Eng. 53, 1205–1223. doi:10.1007/s00603-019-01970-x
Ni, Y., Wang, Z., Li, S., Wang, J., and Feng, C. (2024). Numerical study on the dynamic fragmentation of rock under cyclic blasting and different in-situ stresses. Comput. Geotech. 172, 106404. doi:10.1016/j.compgeo.2024.106404
Niu, L., Zhu, W., Liu, X., Wang, J., Liu, K., and Chen, T. (2024). Shear creep deformation of rock fracture distrubed by dynamic loading. Int. J. Rock Mech. Min. Sci. 183, 105943. doi:10.1016/j.ijrmms.2024.105943
She, H., Liu, S., and Hu, Z. (2022). Analysis method of rock pore disturbance evolution law by nuclear magnetic resonance. Water Resources and Powe. doi:10.20040/j.cnki.1000-7709.2022.20210411
Sun, W., Qin, X., Liu, Q., Zhang, Y., Ma, W., Ma, Y., et al. (2024). Effect of stress unloading rate on fine-scale deformation mechanism of rock under high osmotic pressure. Front. Earth Sci. 12, 1445254. doi:10.3389/feart.2024.1445254
Tang, L., Cheng, L., Wang, C., Shu, J., Wu, J., and Chen, Y. (2016). Dynamic characteristics of serpentinite under condition of high static load and frequent dynamic disturbance. Rock Soil Mech. 37, 2737–2745. doi:10.16285/j.rsm.2016.10.001
Tao, J., Shi, A.-C., Li, H.-T., Zhou, J.-W., Yang, X.-G., and Lu, G.-D. (2021). Thermal-mechanical modelling of rock response and damage evolution during excavation in prestressed geothermal deposits. Int. J. Rock Mech. Min. Sci. 147, 104913. doi:10.1016/j.ijrmms.2021.104913
Wang, P., Bin, L., Ling, C., Ren, Q., Xu, B., and Hu, X. (2025). Mechanical behavior and acoustic emission characteristics of sandstone under different cyclic loading and unloading disturbance rates. Energy Sci. Eng. 13, 176–190. doi:10.1002/ese3.1978
Wang, S., Zhu, S., and Yuen, P.-L. (2021). Assessment of ground-borne vibration impact on nearby underground facilities induced by ground surface excavation. J. Constr. Eng. Manage. 147, 04021071. doi:10.1061/(ASCE)CO.1943-7862.0002065
Wen, X., Feng, G., Guo, J., Yu, L., Qian, R., Zhang, J., et al. (2024). Dynamic characteristics of coal specimens with varying static preloading levels under low-frequency disturbance load. J. Cent. South Univ. 31, 2644–2657. doi:10.1007/s11771-024-5708-2
Xie, X., and Li, L. (2024). Numerical simulation study on the deformation patterns of surrounding rock in deeply buried roadways under seepage action. Appl. Sci.-Basel 14, 5276. doi:10.3390/app14125276
Yang, R., Xu, Y., Yu, M., Ge, J., An, Q., and Ma, P. (2024). Rock-like material under large diameter SHPB dynamic splitting tension: meso-damage mechanical behavior and stress wave propagation model. Front. Mater. 11, 1394233. doi:10.3389/fmats.2024.1394233
Yang, Z., Zhao, Y., Wang, C., and Bi, J. (2022). Pore structure and fractal analysis of coal subjected to multiple treatments based on nuclear magnetic resonance. Energy Sci. & Eng. 10, 2842–2849. doi:10.1002/ese3.1172
Ying, P., Ying, Y., Wu, F., Li, X., Zhou, R., Zhu, Z., et al. (2024). Study of impact load directions on tunnel stability in a cracked rock mass. Rock Mech. Rock Eng. 57, 11283–11300. doi:10.1007/s00603-024-04136-6
Yu, S., Ren, X., and Zhang, J. (2024). Modeling the rock frost cracking processes using an improved ice - stress - Damage coupling method. Theor. Appl. Fract. Mech. 131, 104421. doi:10.1016/j.tafmec.2024.104421
Yue, R., Li, K., Qin, Q., Li, M., and Zuo, T. (2024). Influence of fissure distribution characteristics on the dynamic response of fissured Rock: quantity and spacing. Theor. Appl. Fract. Mech. 133, 104620. doi:10.1016/j.tafmec.2024.104620
Zang, Z., Li, Z., Yin, S., Kong, X., Niu, Y., Liu, B., et al. (2024). Study on the propagation and multifractal characteristics of stress waves in coal based on electric potential and DIC characterization. Chaos Solit. Fractals 184, 115059. doi:10.1016/j.chaos.2024.115059
Zhang, H., Meng, X., and Yang, G. (2020). A study on mechanical properties and damage model of rock subjected to freeze-thaw cycles and confining pressure. Cold Reg. Sci. Tech. 174, 103056. doi:10.1016/j.coldregions.2020.103056
Zhang, J., Jia, Z., Yang, T., Gao, S., Wu, J., Wu, H., et al. (2024a). Study on the stability of adjoining rock of lower roadway in close distance coal seam mining. Shock Vib. 2024, 6717604. doi:10.1155/vib/6717604
Zhang, L., Wang, E., Liu, Y., Yue, W., and Chen, D. (2024b). Research on the energy dissipation characteristics and stress wave spectrum analysis of red sandstone subjected to progressive load cyclic impact. Rock Mech. Rock Eng. 57, 10849–10876. doi:10.1007/s00603-024-04122-y
Zhao, J.-S., Zhang, J.-C., Pei, S.-F., Xing, L., Chen, C.-F., and Zhang, G.-D. (2024). Investigation on the failure mechanism of the collapse of the columnar jointed basalt in underground cavern. Front. Earth Sci. 12, 1378264. doi:10.3389/feart.2024.1378264
Zheng, Z., Li, R., Li, S., Lu, G., Zhang, Q., and Qiu, S. (2024a). A novel dynamic fractional mechanical model for rock fracture under true triaxial static-dynamic combined loading and its engineering application. Rock Mech. Rock Eng. 57, 9343–9369. doi:10.1007/s00603-024-04036-9
Zheng, Z., Xu, H., Zhang, K., Feng, G., Zhang, Q., and Zhao, Y. (2024b). Intermittent disturbance mechanical behavior and fractional deterioration mechanical model of rock under complex true triaxial stress paths. Int. J. Min. Sci. Technol. 34, 117–136. doi:10.1016/j.ijmst.2023.11.007
Keywords: impact disturbance, scanning electron microscopy, nuclear magnetic resonance, damage variable, statistical damage constitutive model
Citation: She H, Liang Y, Liu S and Hu Z (2025) Multiscale pore damage evolution and self-inhibition mechanism in rock after dynamic impact: a coupled statistical constitutive model integrating loading effects. Front. Earth Sci. 13:1586934. doi: 10.3389/feart.2025.1586934
Received: 03 March 2025; Accepted: 30 June 2025;
Published: 31 July 2025.
Edited by:
Zhentao Dong, China University of Petroleum (East China), ChinaReviewed by:
Xuesong Wang, University of Science and Technology Liaoning, ChinaAshutosh Tripathy, Indian Institute of Technology Dhanbad, India
Copyright © 2025 She, Liang, Liu and Hu. This is an open-access article distributed under the terms of the Creative Commons Attribution License (CC BY). The use, distribution or reproduction in other forums is permitted, provided the original author(s) and the copyright owner(s) are credited and that the original publication in this journal is cited, in accordance with accepted academic practice. No use, distribution or reproduction is permitted which does not comply with these terms.
*Correspondence: Yanxu Liang, bGlhbmdfeWFueHVAMTYzLmNvbQ==