- 1Geosteering & Logging Research Institute, Sinopec Matrix Corporation, Qingdao, China
- 2Sinopec Key Laboratory of Well Logging, Qingdao, China
Tight sandstone reservoirs exhibit low porosity, low permeability, significant heterogeneity, and complex gas-water distribution patterns, posing significant challenges for conventional logging methods in accurate gas reservoir identification. Incomplete comprehension of nuclear magnetic signal responses under varying temperature, pressure, and pore structure conditions further limits the precision of fluid identification through nuclear magnetic logging. To resolve these limitations, this study systematically investigates the distribution and dynamic behavior of methane gas and water in tight sandstone through nuclear magnetic resonance (NMR) analysis of samples under saturated water, saturated methane, centrifugation, and drying conditions, conducted at original geothermal pressures. Combined with water-flooding gas experiments, the study elucidates the variation in nuclear magnetic responses of tight sandstone under different pressure and temperature conditions. The research implements quantitative analysis of displacement pressure effects on fluid component redistribution during water invasion processes, ultimately establishing a two-dimensional NMR gas-water identification model for tight sandstone that enables both visual interface demarcation and differential substance characterization, while offering technical support for reservoir exploration and development.
1 Introduction
Tight sandstone gas reservoirs, as a crucial component of unconventional oil and gas resources, have become a major focus in global energy strategies (Jiao et al., 2022; Guo et al., 2022). According to the latest assessment by the International Energy Agency (IEA), the global technically recoverable reserves of tight gas are approximately 220 × 1012 m3. China’s recoverable tight gas resources are estimated at 9–13 trillion cubic meters, representing approximately 22% of the country’s recoverable natural gas reserves. Significant progress has been achieved in the development of tight sandstone gas in regions such as the Ordos, Sichuan, and Tarim Basins. The Chinese Academy of Engineering projects that, prior to 2030, China’s tight gas reserves will continue to grow steadily, with production expected to reach 80–120 billion cubic meters (Ji et al., 2013). However, the pronounced microscopic heterogeneity of these reservoirs leads to the “double low and one high” characteristics: porosity generally below 8%, permeability less than 0.1 mD, and water saturation as high as 40%–60% (Zhao et al., 2021). Consequently, gas-water identification has become a fundamental challenge in the well logging evaluation of tight sandstone gas reservoirs (Wu et al., 2022).
Although differences in acoustic and electrical responses between fluids and the rock matrix enable effective reservoir identification in conventional systems, these traditional methods are constrained by insufficient resolution and ambiguity under low-porosity and low-permeability conditions, making it challenging to accurately differentiate between gas and water layers. When the pore throat radius is less than 1 μm, the sensitivity of acoustic velocity to fluid substitution decreases by 58%, and resistivity response ambiguity can reach ±35% (Wang et al., 2024). Furthermore, the complex pore structure and high water saturation of tight sandstones further complicate the identification process, significantly impeding the efficient exploration and development of tight sandstone gas reservoirs (Liu et al., 2022; Lai et al., 2018; Li et al., 2017; Liu et al., 2025; Yanchun et al., 2024).
Nuclear Magnetic Resonance (NMR) technology, recognized for its strengths in fluid identification and pore structure characterization, offers a novel physical observation dimension for addressing the aforementioned challenges (Jian et al., 2022; Lin et al., 2023; Pang et al., 2024; Li et al., 2017; Guo et al., 2020). The classical Brownstein–Tarr relaxation theory demonstrates that surface relaxivity is positively correlated with the specific surface area of pores, thereby establishing a theoretical foundation for the characterization of microscopic pore structures.
In recent years, advancements in rapid polarization pulse sequences and two-dimensional spectral inversion techniques have expanded the application of NMR from conventional reservoirs to nanoporous systems, thus broadening its role in the exploration and development of unconventional reservoirs. The diffusion–relaxation (D–T2) coupling model developed by (Hürlimann and Venkataramanan, 2002) has facilitated the successful differentiation between capillary-bound water and movable fluids. Bai et al. argue that NMR can effectively eliminate the interference of the rock matrix in fluid identification, as it focuses on fluid properties and can provide more reliable results even in tight sandstone reservoirs characterized by low porosity and permeability (Bai et al., 2023).
Although one-dimensional NMR logging can address challenges related to complex lithological reservoir identification and petrophysical parameter estimation, it remains suboptimal for fluid property identification due to signal-to-noise ratio limitations, which result in the overlap of free water, bound water, and gas signals along the T2 spectra. In contrast, two-dimensional NMR overcomes the limitations of one-dimensional NMR in fluid type identification (Lou et al., 2014; Sun et al., 2020; Xie et al., 2009a). Considering that the physical properties of tight gas reservoirs are generally unfavorable, the diffusion of fluids within micropores is restricted, resulting in a negligible diffusion relaxation effect between natural gas and other fluid types, thereby limiting the effectiveness of using the diffusion coefficient (D) to distinguish between fluid signals.
Additionally, due to complex well conditions, a short echo time (TE) is selected to effectively acquire bound fluid signals (Mukhametdinova et al., 2021). The signal-to-noise ratio of NMR logging responses is typically low, and the D values of different fluid signals often fail to match those observed in laboratory simulations, resulting in significant overlap in the distribution ranges of D values for multiple fluids (Guo and Xie, 2017; Tan et al., 2013; Xie and Xiao, 2009b). Therefore, among the two commonly used two-dimensional NMR logging methods, it has been demonstrated that the longitudinal relaxation time–transverse relaxation time ((T1–T2) map is more suitable than the transverse relaxation time–diffusion coefficient (D–T2) map for evaluating tight reservoirs (Zhang et al., 2020). Zhou et al. (2022) utilized NMR log data to establish a permeability calculation model for heterogeneous sandstone, revealing that pore connectivity and movable fluid porosity are the primary factors influencing permeability. Gao et al. (2024) combined 2D NMR and conventional logging to determine the fluid types, which improved the accuracy of fluid identification in complex reservoirs. Qin et al. (2022) conducted 2D NMR experiments on Jimsar shale oil reservoir samples under different saturation conditions, obtaining porosity and relaxation characteristics and pore fluid information. Mukhametdinova et al. (2021) summarized that T1–T2 measurements reduce the effect of diffusion on measured T2 signal and provide more comprehensive understanding on fluid saturation. Fleury and Romero-Sarmiento (2016) established a T1–T2 map that shows the position of each fluid type of shale stone. Wang et al. (2024) have demonstrated the effectiveness of T1-T2 nuclear magnetic resonance in distinguishing fluid types across various rock types by employing an enhanced pressurized saturation treatment method, along with the incorporation of deuterium oxide (D2O). Zhang et al. (2018) analyzed T1–T2 and T1/T2 differences to map out the distribution of bound fluid, movable water, and natural gas signals on a 2D NMR fluid identification chart for dolomite reservoirs, and cross-verified these findings against actual drilling test results.
Despite considerable advancements in the study of tight sandstone, existing research still lacks a thorough examination of gas-water differentiation under real reservoir conditions. Variations in temperature and pressure significantly impact throat dimensions and pore structure evolution, thereby affecting fluid migration patterns and flow dynamics within porous media. This necessitates the use of multidimensional NMR characterization to systematically incorporate factors such as temperature, pressure, and pore architecture. This study employs an advanced high-pressure/high-temperature NMR displacement system to examine gas-water NMR responses in representative tight sandstone samples from the Hangjinqi area of the Ordos Basin. The experimental results reveal distinctive fluid occurrence characteristics, facilitating the development of 2D identification charts that offer practical methodologies for reservoir evaluation and development optimization.
2 Experimental section
2.1 Samples
Geological conditions, through their influence on reservoir performance, structural characteristics, geochemical properties, and fluid dynamics, collectively determine the hydrocarbon potential of tight sandstone gas reservoirs. Detailed geological analysis and comprehensive evaluation are crucial in predicting and developing these gas reservoirs. The tight sandstone samples analyzed in this study were collected from the Hangjinqi block, China (Ashraf et al., 2022; Tan et al., 2024). As illustrated in Figure 1, the Hangjinqi block in the northern Ordos Basin is characterized by Paleozoic-Mesozoic transitional sedimentary systems, with significant reservoirs concentrated in the Lower Permian Shanxi Formation tight sandstones (80–120 m thick) and the Triassic Yanchang Formation lacustrine shales. The Shanxi Formation consists of fluvial-deltaic sandstones interbedded with coal seams, which are characterized by strong diagenetic alteration and low permeability (0.1–2.0 mD). The reservoir porosity ranges from 4% to 12%, mainly consisting of secondary dissolution pores, with gas-bearing intervals (6–15 m thick) located at depths of 2,800–3,500 m. Stratigraphically, the block is characterized by a gentle SW-dipping monocline (<1°), intersected by NW-SE trending faults (20–50 m displacement), forming subtle lithologic-structural traps.
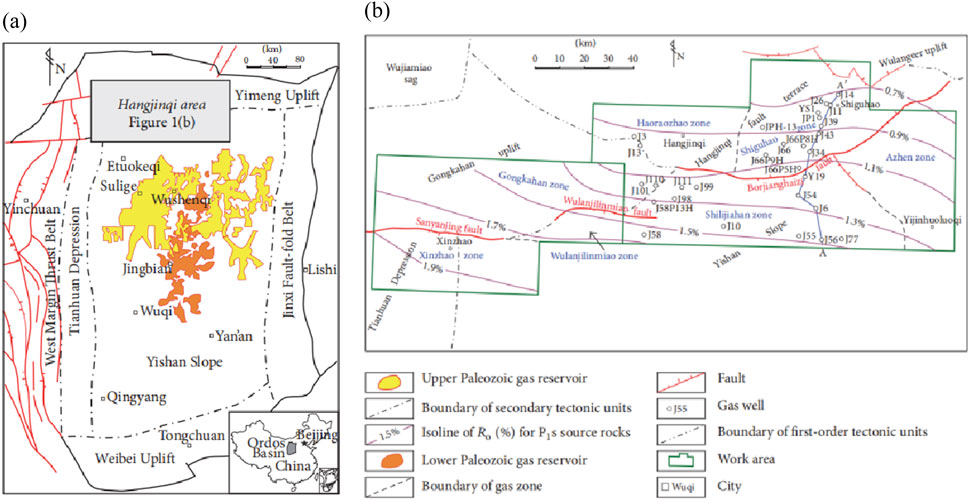
Figure 1. (a) Location of Hangjinqi area and the Ordos Basin; (b) location of Xinzhao zone an distribution map of the tectonic units, gas zones and gas (Wu et al., 2017).
Hydrocarbon accumulation is derived from the Carboniferous Benxi Formation coal measures (TOC 2.5%–5.8%, Ro 1.2%–2.0%), and is sealed by thick Shihezi Formation mudstones. The reservoirs exhibit significant heterogeneity, with logging responses showing “low resistivity (tens to hundreds Ω·m), low gamma-ray (20–45 API), and high acoustic impedance” in gas-saturated zones. Challenges stem from complex pore structures (microfractures and dissolution vugs) and reservoir anisotropy, necessitating advanced NMR logging for fluid identification. NMR T2 spectra indicate gas-bearing intervals through delayed peak positions (>50 ms); however, fluid differentiation remains ambiguous due to overlapping pore size and fluid property effects. Production depends on hydraulic fracturing to improve connectivity in these low-porosity, ultra-tight sandstones.
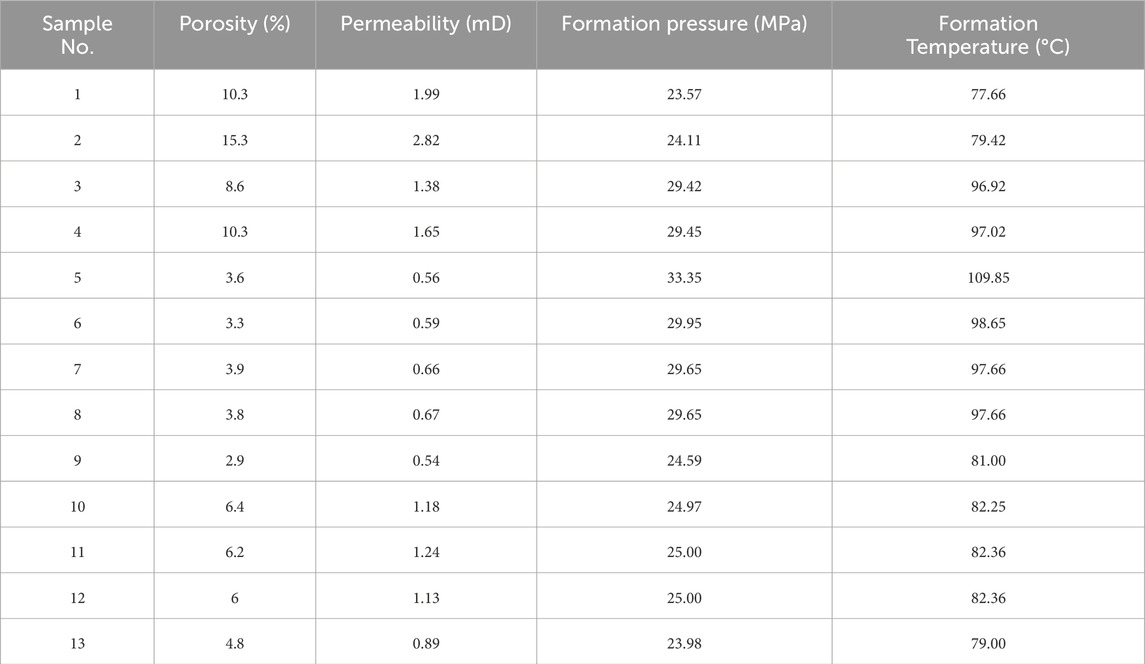
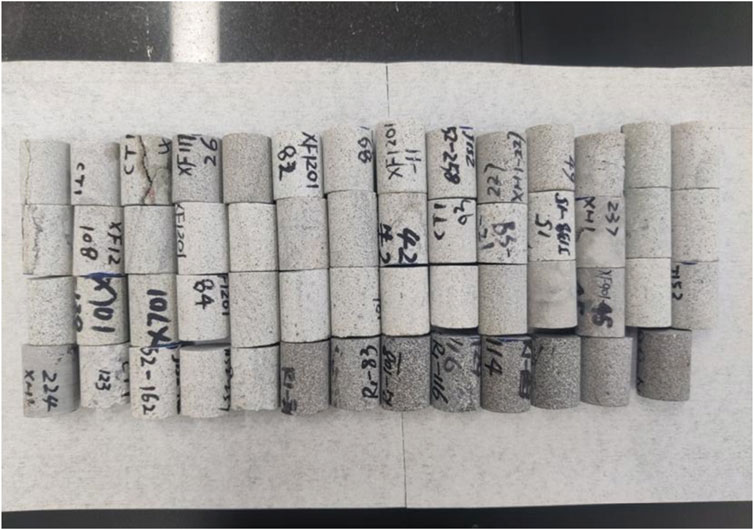
Table 1 summarizes the physical properties of the tight sandstone samples. These samples included key tight sandstone core samples from the Xinzhao block. To ensure the quality of the experiment, the samples were processed into cylinders with dimensions of 25 mm in diameter and 50 mm in height, the roughness of two end surface of rock were confined into ±0.05mm, and the deviation of diameter did not exceed ±0.05 mm. Following established experimental protocols, porosity and permeability were measured using the overpressure pore permeability system, the formation temperature and pressure were calculated from the sampling depth and logging data. Furthermore, samples exhibiting higher porosity and greater permeability were selected, as these properties suggest potential productive layers of significant research value. Consequently, 13 representative core samples were ultimately chosen for the experiment based on these criteria. Images of samples are provided in Figure 2.
2.2 Experimental procedures
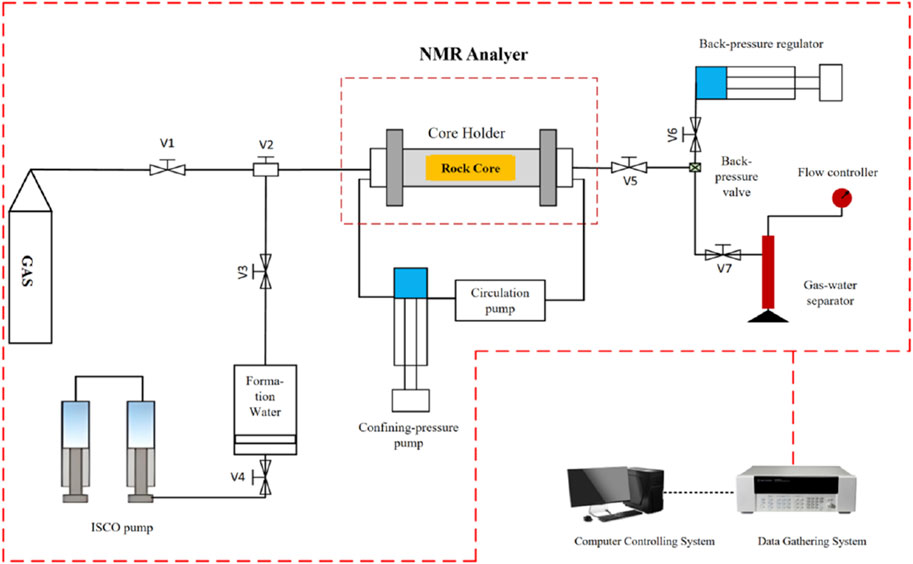
This study utilizes the MesoMR23-060HeI high-temperature, high-pressure nuclear magnetic resonance (NMR) online displacement system. The system incorporates a 0.3 T magnetic field strength, achieving operational parameters of 150°C maximum temperature and 70 MPa confining pressure, with minimum aperture resolution of 10 nm and liquid flow measurement accuracy of 0.01 mL/min. This combination of technical specifications enables precise control over experimental parameters during multiphase displacement processes. Figure 3 presents a schematic diagram of the dynamic NMR experimental setup, comprising a core holder, three precision pumps; and a computerized control system.
To achieve the research objective, thirteen samples with good lithology consistency and porosity variation ranging from 2.9% to 15.3% were selected from the core of key exploration Wells in the target area for experiment, the experimental design of this study comprises three main components: analysis of the effects of varying temperature and pressure conditions on the NMR response characteristics of tight sandstone, investigation of the NMR response characteristics of methane gas in tight sandstone under different saturation pressures, and examination of the NMR response characteristics of gas and water in tight sandstone under varying water flooding pressures.
The specific process of the experiment is as follows:
(1) The samples were placed in a constant-temperature oven at 80°C for 12 h to remove residual moisture. The dried samples were then positioned in the sample holder of the high-temperature, high-pressure, multi-dimensional NMR analyzer for testing. The temperature was gradually increased to the formation temperature of the core, and nitrogen was pressurized to the formation pressure. Subsequently, the T2 spectra and T1–T2 two-dimensional spectra were recorded to obtain the baseline signal.
(2) Samples with measured baseline signals were subjected to vacuum saturation for 24 h. Subsequently, Samples 1 and 2 were individually placed in nuclear magnetic core clamps. The temperature was increased to 70°C, and the water drive pressures were incrementally increased to 20, 25, 30, 35, and 40 MPa (This is primarily attributed to the increased convenience and precision in pressure control during the experiment.). Once pressure stabilization was achieved, T2 spectra and T1–T2 two-dimensional NMR signals were recorded for each sample. Subsequently, the pressure was gradually reduced to 20 MPa, and the temperature was incrementally increased to 80, 90, 100, and 110°C. This procedure was repeated to acquire 25 sets of NMR signals under varying temperature and pressure conditions.
(3) The water-saturated sample was then placed in the core holder of the analyzer. The temperature was slowly increased to the formation temperature, and pure water was pressurized to match the formation pressure of the core sample. Stabilization was maintained for half an hour, during which the T2 spectra was continuously measured to compare signals at various water saturation levels (0%–100%). Once no change in the peak value of the T2 spectra was observed, the core was deemed fully saturated. Subsequently, the final T2 spectra and T1–T2 two-dimensional spectra were measured to obtain information on the occurrence state of hydrocarbon components in the water-saturated sample core.
(4) Centrifugation Process. The core was removed from the core holder and placed in a high-speed, low-temperature centrifuge operating at 13,000 rpm for 30 min to remove the movable water from the core. The centrifuged sample was then placed in the core holder of the NMR analyzer. The temperature was increased to the formation temperature, and nitrogen was pressurized to match the core formation pressure. The T2 spectra and T1–T2 two-dimensional spectra were recorded to obtain information on the occurrence state of the bound water in the centrifuged core.
(5) Methane gas saturation process. The dry sample is placed into the core holder of the analyzer at 100°C. The confining pressure is set to 40 MPa, while the back pressure is adjusted to match the methane saturation pressure. The core sample is subsequently saturated with methane gas at pressures of 30 MPa, 20 MPa, and 10 MPa. The saturation process at each pressure level is meticulously monitored via T2 spectra measurements to ensure thorough saturation. Specifically, methane gas saturation requires 48–72 h at 30 MPa, approximately 48 h at 20 MPa, and 24–48 h at 10 MPa. Once inlet and outlet pressures stabilize and no changes are observed in the T2 spectra peak, saturation is deemed complete. The final T2 spectra and T1–T2 map are recorded after shutting down the inlet valve.
(6) Water flooding. After measuring the NMR signal of the core saturated with methane gas at 10 MPa, the system was switched to a water drive without disassembling the apparatus or removing the core. Formation water was sequentially injected at pressures of 10 MPa, 20 MPa, and 30 MPa. At each pressure level, the system was maintained for 24–48 h to ensure thorough displacement, and the T2 spectra was regularly measured during this period until stabilization was achieved. Subsequently, the final T2 spectra and T1–T2 map were recorded with the inlet valve closed.
The experimental parameters for NMR test are listed in Table 2. The T2 spectra of the sample was obtained by mathematical inversion calculation using the CPMG sequence, while the T1-T2 maps were obtained using the SR-CPMG sequence.
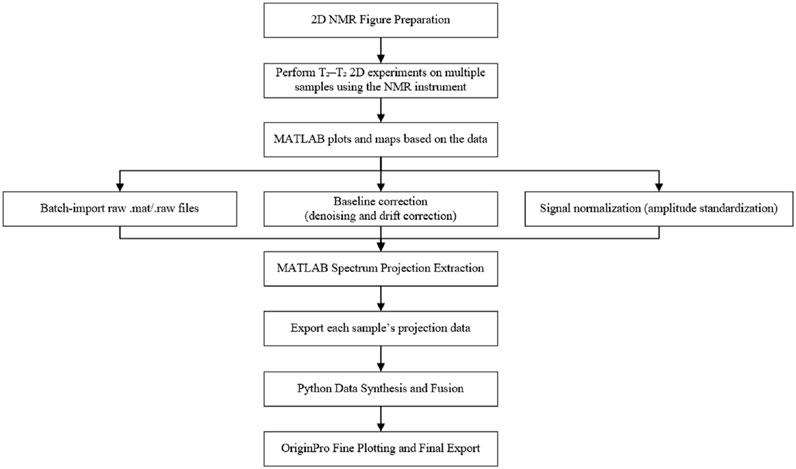
Figure 4 shows the data processing steps after conducting the NMR experiment. Details will be discussed in later section.
3 Results and discussions
3.1 Analysis of static NMR test results of saturated methane in tight sandstone
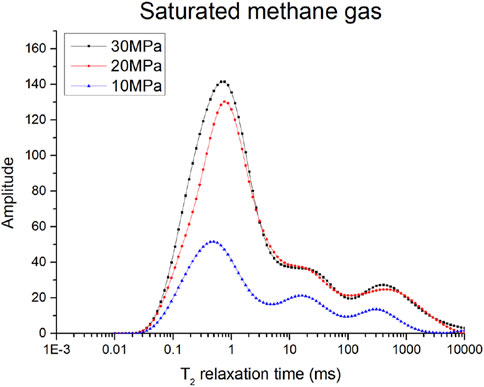
Due to the distinct relaxation mechanisms between gas and water, methane typically has a longer relaxation time than water, influenced by surface relaxation. Under varying methane gas saturation pressures, compressibility can lead to changes in the gas content within pores. At low pressures, gas may occupy larger pores, while at high pressures, it may enter smaller ones. Moreover, pressure fluctuations can significantly alter the morphology and opening of small pores, impacting gas migration and distribution. As shown in Figure 5, the T2 spectra and two-dimensional NMR results of tight sandstone samples clearly exhibit pressure-dependent characteristics, indicating significant changes in gas occurrence and pore structure. Experimental findings reveal that with increased methane gas saturation pressure, the distribution of the T2 spectra and the characteristics of two-dimensional NMR maps undergo significant evolution.
At a low saturation pressure (10 MPa), the main peak of the T2 spectra lies between 0.2 and 1 ms, with several secondary peaks in the long relaxation region. In comparison with higher saturation pressures, free gas occupies larger pore spaces, while gas in smaller pores is relatively less. The overall NMR signal is much lower than at higher saturation pressures. As the methane saturation pressure increases to 20 MPa, methane gas gradually adsorbs onto the mineral surface, increasing the proportion of adsorbed gas. According to the Langmuir adsorption model, the amount of adsorbed gas increases with pressure. At this stage, the gas content of the sample rises significantly, and the T2 spectra tends to a single peak, indicating that most of the methane gas has transitioned into an adsorbed or restricted diffusion state. Additionally, as the methane saturation pressure increases, the main peak shifts toward longer T2 times. When the sample saturation pressure increases to 30 MPa, the T2 spectra shape remains similar to that at 20 MPa, but the peak in the short relaxation section increases.
As illustrated in Figure 6, two-dimensional NMR maps offer more direct insights into fluid states. The signals are predominantly distributed in three regions: T2 ranging from 0.09 to 0.3 ms, T1/T2 from 100 to 1,000; T2 from 1 to 4 ms, T1/T2 from 25 to 100; and T2 from 30 to 200 ms, T1/T2 from 1 to 10. During pressure increases, the signal noticeably rises, marking the methane gas presence area. As methane gas compresses, the free gas region within the T2 spectra diminishes, whereas the adsorbed gas region enlarges. At high saturation pressure (30 MPa), the NMR maps exhibit typical expansion in the low T2 value region in the T1-T2 plot, indicating a substantial rise in the adsorbed phase proportion of methane gas, with restricted diffusion of gas within the pores.
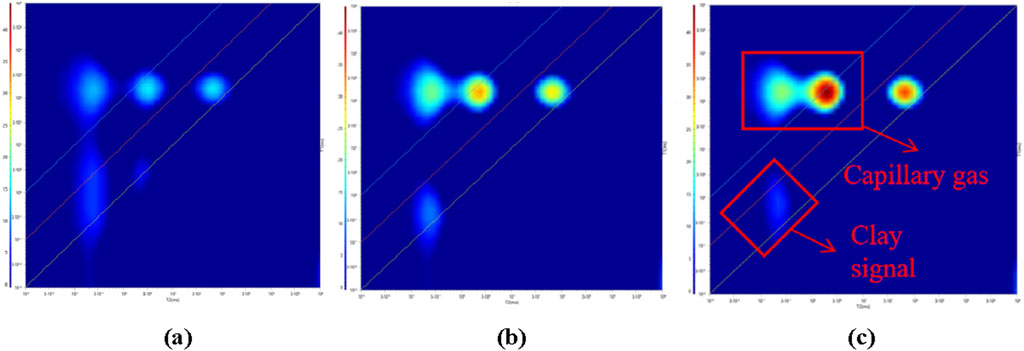
Figure 6. 2D NMR spectra at different methane saturation pressures. (a) 10 MPa (b) 20 MPa (c) 30 MPa.
3.2 Temperature and pressure effects on T2 spectra
The T2 spectra of water-saturated tight sandstone demonstrates significant characteristic variations under different temperature and pressure conditions. These changes stem from temperature/pressure-induced modifications in fluid viscosity and pore structure, which subsequently influence the T2 spectra’s distribution patterns. For tight sandstones with inherent low porosity-permeability and compromised signal-to-noise ratios, understanding these pressure-temperature interactions becomes particularly critical. In order to better reflect the influence of the parameter variation band, samples 1 and 2 with the largest porosity were selected for one-dimensional NMR experiments under different temperature and pressure conditions.
Figure 7 presents the T2 spectra of sample 2 under various pressures. Due to the incompressibility of water, the T2 spectra shows less significant changes compared to methane gas in Figure 5, as the pressure increased, the peak height rose only slightly, but the width narrowed slightly. The primary alteration occurs in the short relaxation section, which shifts rightward as pressure increases. This shift is likely caused by higher pressure expanding the pore spaces of smaller components, allowing for longer fluid relaxation times in larger pores. Pressure changes may induce deformations in pore shapes, influencing the flow paths and relaxation behaviors of the fluid. Additionally, due to the non-uniqueness of the Laplace transform, directly inverting experimental data to obtain the T2 distribution often leads to multiple solutions and noise amplification, which may also have an impact on the experimental results.
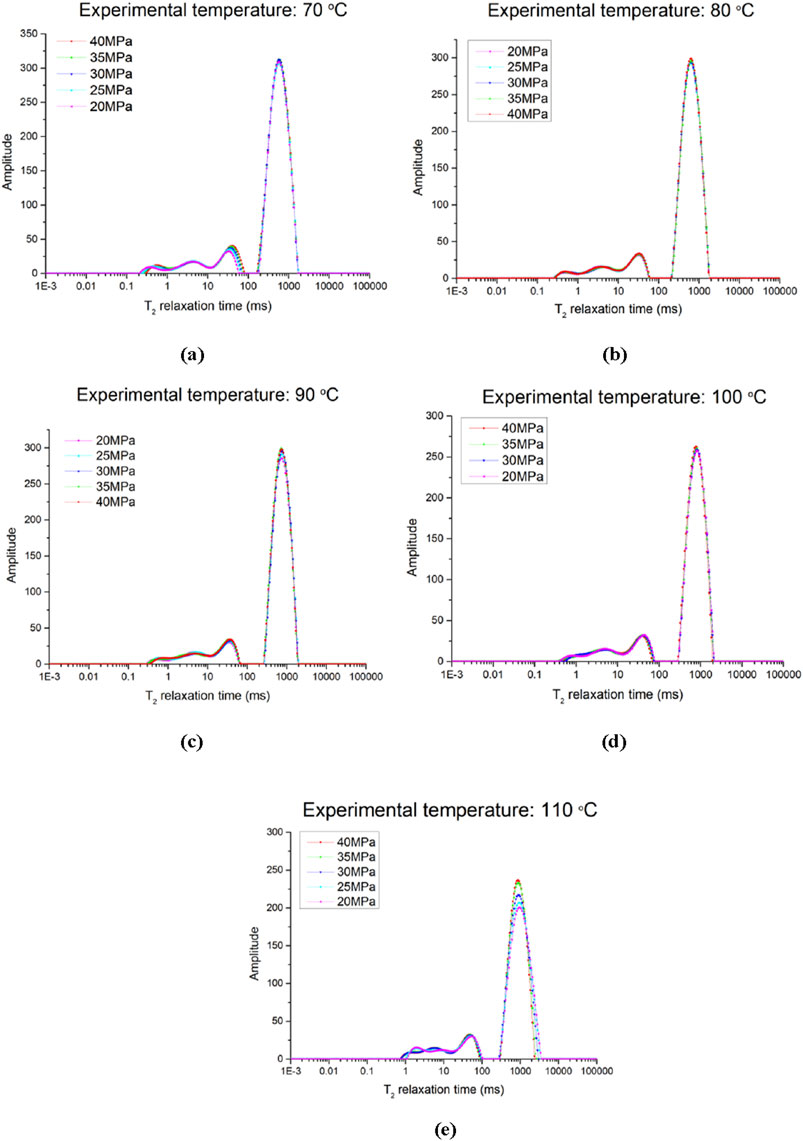
Figure 7. NMR T2 spectum of samples under different pressure. (a) Experimental temperature: 70°C, (b) Experimental temperature: 80°C, (a) Experimental temperature: 70°C, (c) Experimental temperature: 90°C, (d) Experimental temperature: 100°C, (a) Experimental temperature: 110°C.
In relative terms, temperature increases lead to more pronounced changes in the T2 spectra. As depicted in Figure 8, with rising temperature, the main peak of the T2 spectra becomes noticeably smaller and shifts to the right. This is mainly because higher temperatures reduce the viscosity of the fluid within pores, making fluid molecules more active and thus affecting the fluid’s relaxation properties. Additionally, high temperatures may cause microscopic changes in the rock’s pore structure, leading to pore expansion and consequently a rightward shift in the T2 spectra. By comparing T2 spectra under different temperature and pressure conditions, the changes in the pore structure of water-saturated tight sandstone and their effects on fluid dynamics can be revealed. This understanding is crucial for comprehending the reservoir properties of rocks and predicting their performance under various geological conditions.
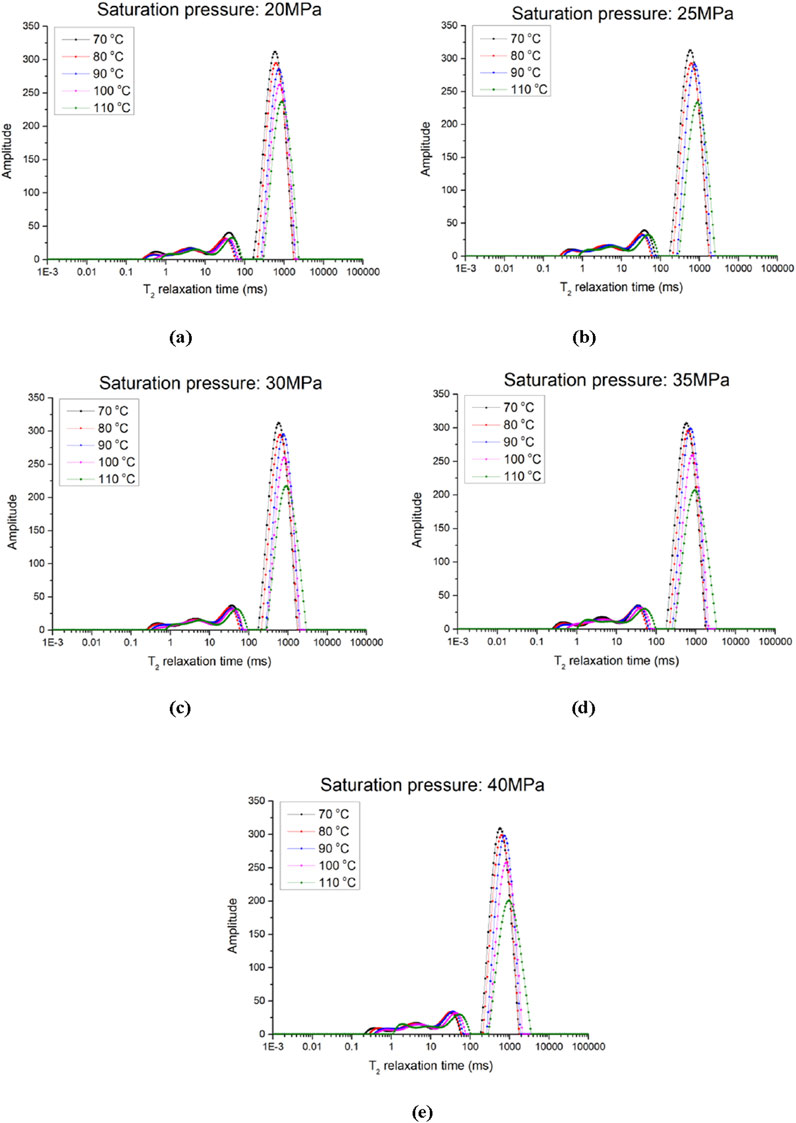
Figure 8. NMR T2 spectum of samples under different experimental temperature. (a) Saturation pressure: 20MPa, (b) Saturation pressure: 25MPa, (c) Saturation pressure: 30MPa, (d) Saturation pressure: 35MPa, (e) Saturation pressure: 40MPa.
3.3 NMR analysis of dynamic process of methane gas driven by water
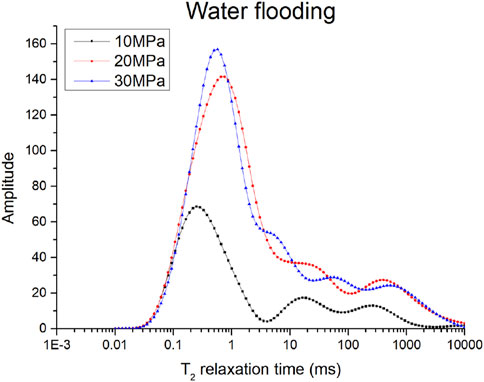
Figure 9 demonstrates the evolution of the T2 spectra during the water flooding process. As discussed in Section 3.1, at low pressures, methane in the sample predominantly exists as free gas, with the T2 spectra exhibiting a characteristic peak at short relaxation times, corresponding to the free gas phase in tight sandstone micropores. With increased regional pressure and water injection, the main peak of the T2 spectra expands and shifts toward the long relaxation time range, indicating a reduction in the proportion of free gas, while adsorbed and dissolved gases gradually dominate. This change reflects the substantial impact of water invasion on the gas phase within the pores. As the displacement pressure rises, the peak area increases significantly, with the main peak expanding markedly and shifting rightward, indicating that, at this stage, micropores are filled with water under displacement pressure, and the pore space is expanding.
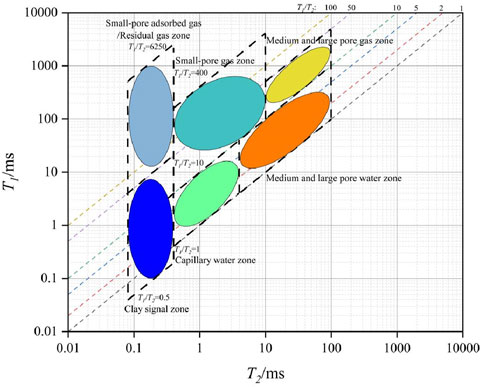
It is apparent that, owing to the issue of signal overlap, the analysis of changes in residual methane gas during the displacement process through the T2 spectra is challenging, which necessitates further analysis using the T1-T2 spectra. As shown in Figure10, the relaxation times of methane gas in the T1-T2 spectra demonstrate significant variations with changes in water displacement pressure. At low displacement pressures, methane gas exhibits shorter T1 and T2 relaxation times. As the water displacement pressure increases, the intensity within the short T1 and T2 regions of the spectra gradually increases, indicating that more methane gas is converted into adsorbed or dissolved states. At elevated water displacement pressures, the filling effect of water on pore spaces becomes more pronounced, predominantly filling capillary pores. Three distinct regions can be identified through comparison: T2 between 0.1 and 0.5 ms, T1/T2 between 1 and 100 as the clay signal zone; T2 between 0.5 and 10 ms, T1/T2 between 1 and 20 as the capillary water zone; and T2 between 0.1 and 0.5 ms, T1/T2 between 100 and 6,000 as the capillary residual gas/adsorbed gas zone.
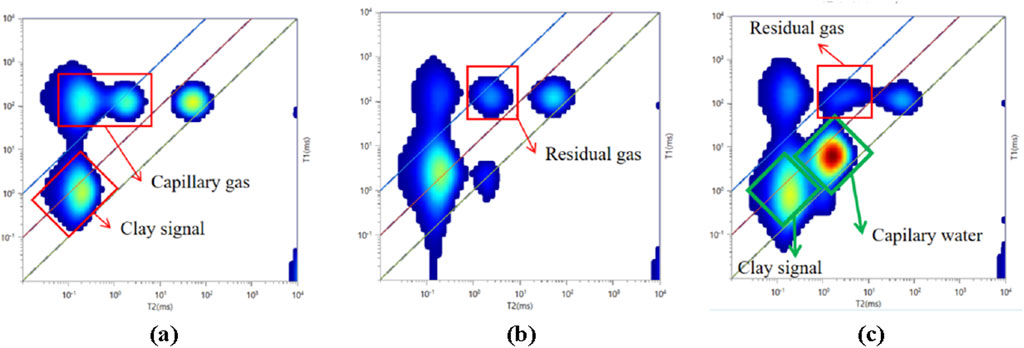
Figure 10. 2D NMR spectra at different water flooding pressures. (a) 10 MPa saturated gas (b) 20 MPa water flooding (c) 30 MPa water flooding.
3.4 2D NMR gas-water identification map of tight sandstone
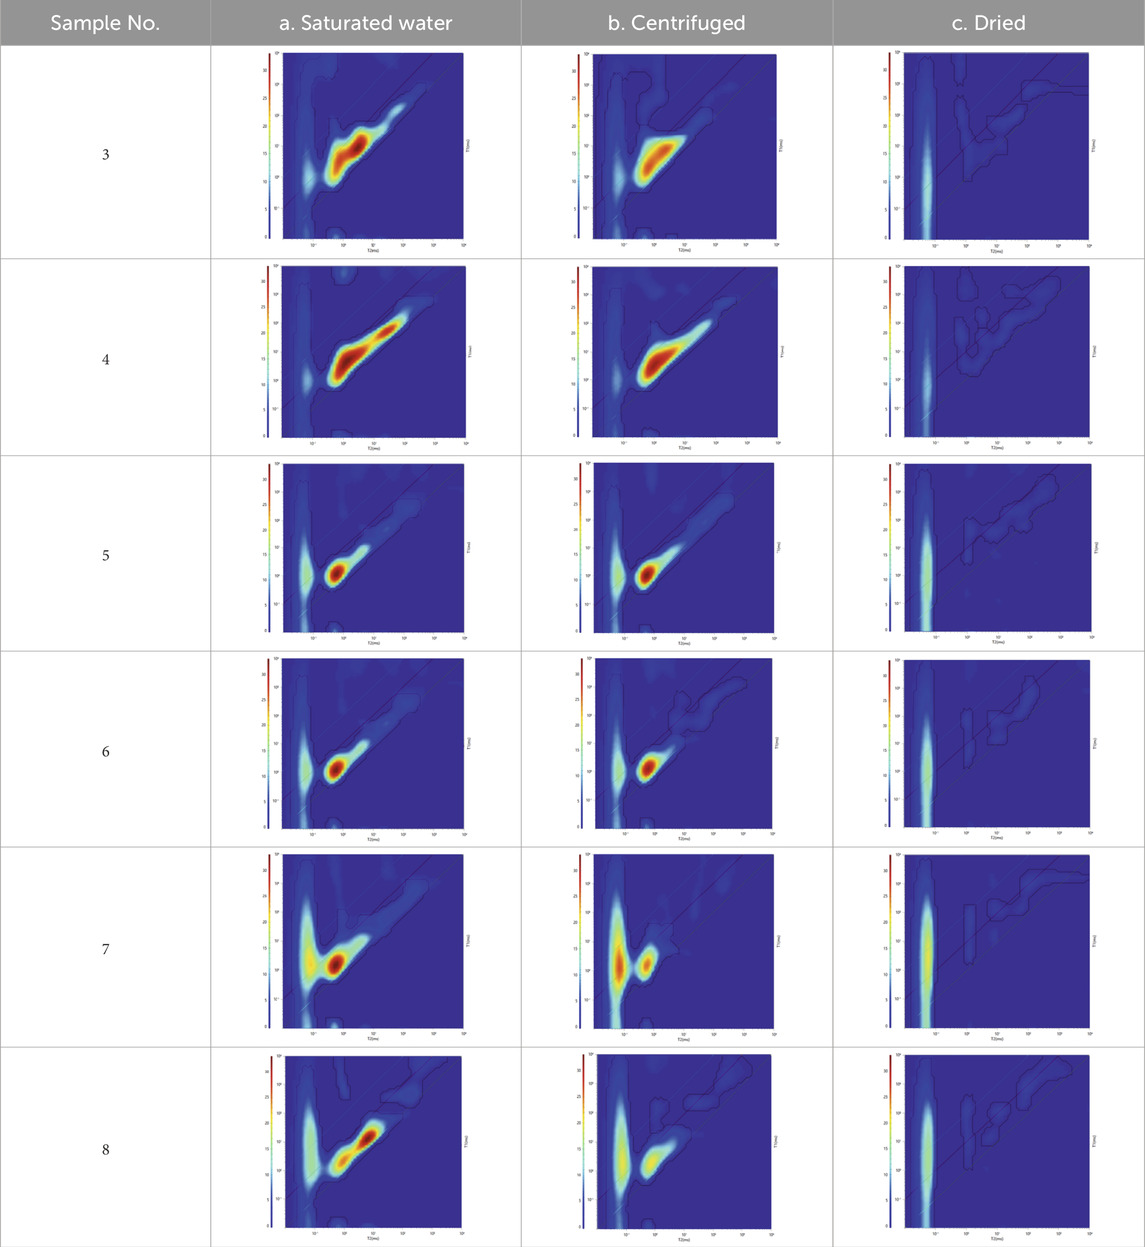
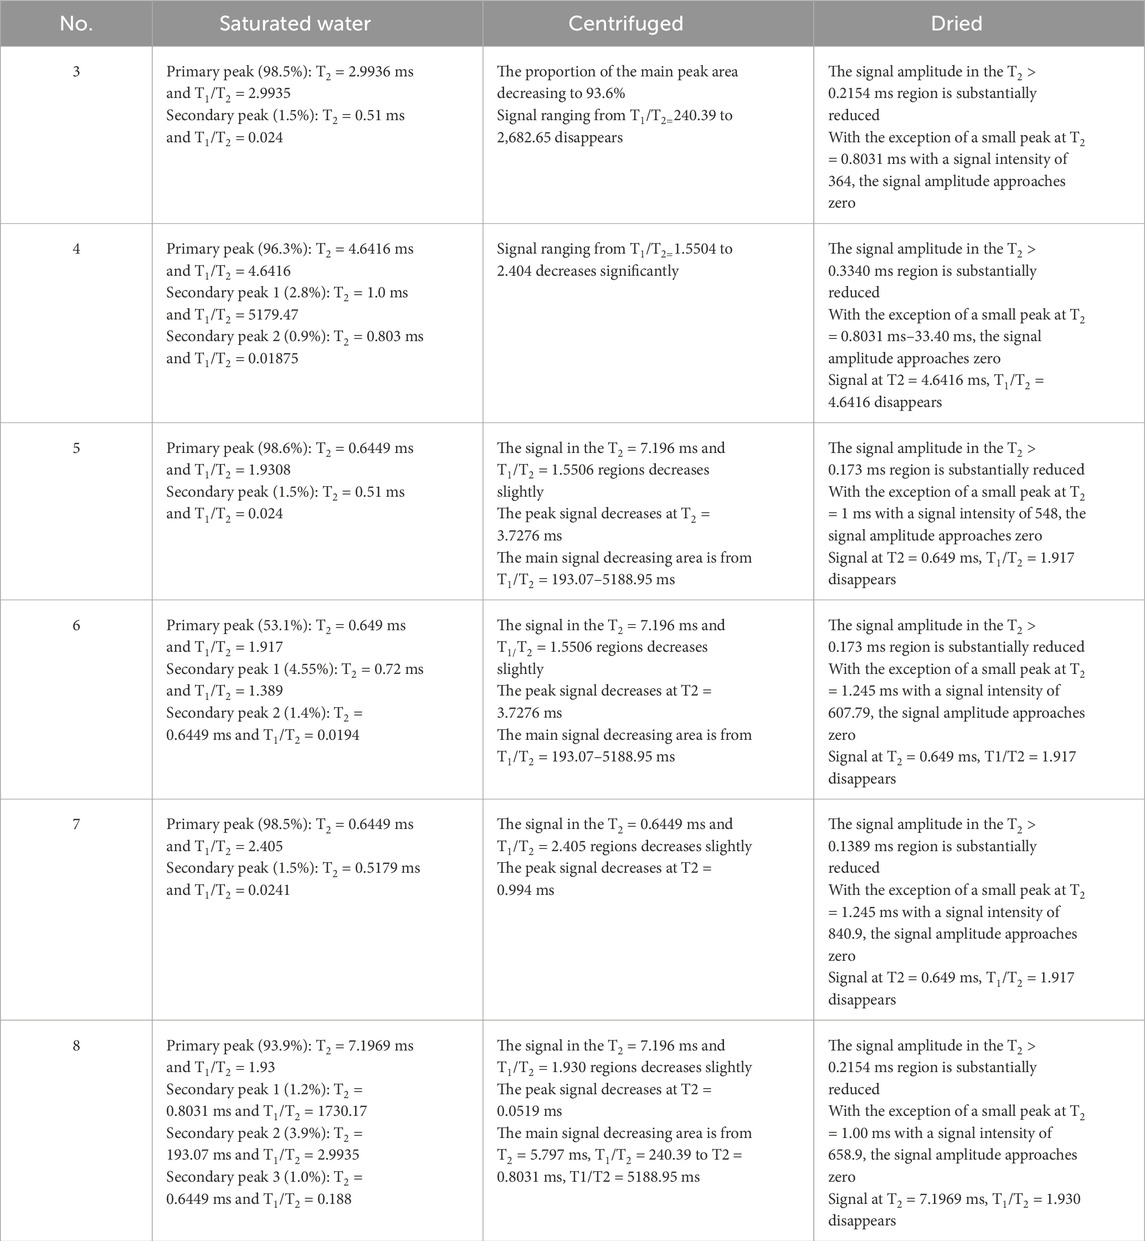
Based on the aforementioned results and the T1-T2 spectra of the dried and centrifuged samples, we performed a detailed analysis of the component signal positions. Table 3 illustrates the T1-T2 spectra of six samples under saturated, centrifuged, and dried conditions. A quantitative analysis of the component positions was conducted through comparative studies.
For example, in Table 3 No.1a, after saturation, the NMR T2-T1 spectra of the sample reveals two distinct component signal responses. The primary peak is located at T2 = 2.9936 ms and T1/T2 = 2.9935, contributing to 98.5% of the total signal. A secondary peak appears at T2 = 0.51 ms and T1/T2 = 0.024, contributing to 1.5%. Following centrifugation, as depicted in Table 3 No.1b, the signal intensity at T2 = 2.9936 ms and T1/T2 = 2.9935 decreases significantly. The T2 spectra transitions from a triplet to a doublet, with the signal peak at T2 = 2.99 ms diminishing, and the proportion of the main peak area decreasing to 93.6%. The most significant decrease occurs in the T1/T2 range from 240.39 to 2,682.65, where the signal disappears. In Table 3 No.1c, after drying, the signal amplitude in the T2 > 0.2154 ms region is substantially reduced. With the exception of a small peak at T2 = 0.8031 ms with a signal intensity of 364, the signal amplitude approaches zero. Table 4 is an overall summary for the variations in T2 and T1/T2 ratios for all samples after water saturation, centrifugation and drying.
Based on experimental data comparative analysis and literature research, the workflow begins with conducting T2-T2 2D NMR experiments on multiple samples using an NMR analyzer to acquire raw data. Following this, the raw data files are batch-imported into MATLAB, where preprocessing steps such as baseline correction (denoising and drift removal) and signal normalization (amplitude standardization) are applied. The processed data are then visualized as 2D plots and contour maps, after which projection data, such as spectral peaks, are extracted and exported individually for each sample. Subsequently, Python is utilized to synthesize and fuse the exported projection datasets basing on the average brightness of each signal zone, integrating multi-sample information into a unified format. Finally, the synthesized data are imported into OriginPro for detailed graphical refinement, including axis labeling and color mapping adjustments, see Figure 4. As a result, the two-dimensional nuclear magnetic gas-water identification map of tight sandstone as shown in Figure 11 can be obtained.
By comparing NMR spectra under different experimental conditions, a gas-water identification chart is created. The 2D NMR chart offers both an intuitive visualization of the gas-water interface and enables effective differentiation of NMR responses across distinct substance types, thereby supporting petrophysical characterization in geological analyses. Compared to conventional sandstone or carbonate rocks with higher porosity and permeability, due to the more complex pore space and tighter constraints on pore fluids, the gas-water boundary in two-dimensional plots is relatively indistinct, and signal separation characteristics are less pronounced. Additionally, the complexity of the pore structure means that nuclear magnetic resonance responses may exhibit lower signal intensity and shorter T1 and T2 relaxation times. Greater attention is required for the accuracy of the experiment, the inversion method, and the experimental details. To accurately identify the plot, meticulous handling of these signals is necessary to distinctly and accurately differentiate the characteristics of tight sandstone gas and water.
4 Conclusion
This study systematically investigated the fluid occurrence states and dynamic behaviors of methane gas and water in tight sandstone through static and dynamic NMR experiments under varying pressure and temperature conditions. The major conclusions are as follows:
(1) Methane exhibits longer relaxation times compared to water due to differences in relaxation mechanisms. The T2 spectra and T1-T2 two-dimensional NMR results demonstrate strong pressure dependence. As methane saturation pressure increases, free gas in large pores transitions into adsorbed states within smaller pores, accompanied by pore structure compression and shortened relaxation times. Two-dimensional NMR maps effectively reveal the evolution of gas occurrence modes, with a notable increase in adsorbed gas signals at higher pressures.
(2) Pressure changes have a moderate impact on the T2 spectra of water-saturated samples, mainly causing slight rightward shifts due to pore expansion under high pressure. In contrast, temperature exerts a more pronounced effect, significantly reducing fluid viscosity, enhancing molecular mobility, and shifting T2 spectra towards longer relaxation times. These findings highlight the importance of considering temperature-pressure coupling effects when evaluating reservoir properties in tight formations.
(3) Water flooding experiments reveal that as displacement pressure increases, free methane gas is progressively replaced by adsorbed and dissolved states. The T2 spectra shift towards shorter relaxation times, and two-dimensional T1-T2 maps clearly distinguish the clay-bound water, capillary water, and residual gas regions. Water invasion into micropores significantly alters fluid distribution patterns, underlining the critical role of capillary effects in gas recovery processes.
(4) By integrating static and dynamic NMR datasets and conducting systematic signal processing and comparative analysis, a two-dimensional gas-water identification chart for tight sandstone was established. This chart effectively characterizes gas-water occurrence states and interfaces, offering a novel and intuitive approach for distinguishing different fluid phases within complex pore structures. The 2D NMR identification map enhances the understanding of fluid-rock interactions and provides valuable support for optimizing enhanced gas recovery strategies and evaluating tight reservoir performance.
This research necessitates ongoing on-site verification and feedback in practical applications to validate and optimize the design and effectiveness of the chart. Through accumulating and analyzing on-site data, identification methods and tools can be continuously refined. Implementing these measures, the effectiveness of the two-dimensional gas-water identification chart for tight sandstone reservoirs can be further enhanced, providing enhanced support for the exploration and development of the petroleum and natural gas industries. Furthermore, the complexity of tight sandstone reservoirs has propelled advancements in nuclear magnetic resonance technology and rock physics models. In order to accurately identify the gas-water interface, researchers are continually developing advanced chart designs and data processing technologies, thereby promoting technological advancements in the field as a whole.
Data availability statement
The raw data supporting the conclusions of this article will be made available by the authors, without undue reservation.
Author contributions
RZ: Writing – review and editing, Writing – original draft. XC: Writing – review and editing, Writing – original draft. XS: Writing – original draft, Writing – review and editing. XG: Writing – original draft, Formal Analysis, Conceptualization, Data curation. HD: Investigation, Writing – review and editing, Software, Data curation. MY: Writing – review and editing, Data curation, Conceptualization.
Funding
The author(s) declare that no financial support was received for the research and/or publication of this article.
Conflict of interest
Authors RZ, XC, XS, XG, HD, and MY were employed by Sinopec Matrix Corporation and Sinopec Key Laboratory of Well Logging.
Generative AI statement
The author(s) declare that no Generative AI was used in the creation of this manuscript.
Publisher’s note
All claims expressed in this article are solely those of the authors and do not necessarily represent those of their affiliated organizations, or those of the publisher, the editors and the reviewers. Any product that may be evaluated in this article, or claim that may be made by its manufacturer, is not guaranteed or endorsed by the publisher.
References
Ashraf, U., Anees, A., Shi, W., Wang, R., Ali, M., Jiang, R., et al. (2022). Estimation of porosity and facies distribution through seismic inversion in an unconventional tight sandstone reservoir of Hangjinqi area, Ordos basin. Solid Earth Geophys. 10, 10–2022. doi:10.3389/feart.2022.1014052
Bai, Ze, Tan, M., Li, B., Shi, Y., Zhang, H., and Li, G. (2023). Fluid identification method of nuclear magnetic resonance and array acoustic logging for complex oil and water layers in tight sandstone reservoir. Process. (Basel). 11 (11), 3051. doi:10.3390/pr11113051
Fleury, M., and Romero-Sarmiento, M. (2016). Characterization of shales using T1–T2 NMR maps. J. Petroleum Sci. Eng. 137, 55–62. doi:10.1016/j.petrol.2015.11.006
Gao, S., Zhang, X., Li, G., Chen, W., Liang, X., and Guo, Y. (2024). Application of 2D NMR component definition method in complex shale reservoir evaluation. Well Logging Technol. 48 (2), 215–220. doi:10.16489/j.issn.1004-1338.2024.02.009
Guo, J., and Xie, R. (2017). Numerical simulation and parameter analysis of NMR T2–D distributions of tight sandstone saturated with a gas–water two-phase fluid. J. Nat. Gas Sci. Eng. 37, 502–511. doi:10.1016/j.jngse.2016.12.005
Guo, J. C., Zhou, H. Y., Zeng, J., Wang, K. J., Lai, J., and Liu, Y. X. (2020). Advances in low-field nuclear magnetic resonance (NMR) technologies applied for characterization of pore space inside rocks: a critical review. Pet. Sci. 17, 1281–1297. doi:10.1007/s12182-020-00488-0
Guo, T., Fu, D., Xiong, L., and Wang, Y. (2022). The investigation of microporous structure and fluid distribution mechanism in tight sandstone gas reservoirs: A case study on the second member of Xujiahe gas reservoirs in Yuanba area. Front. Energy Res.10, 974655. doi:10.3389/fenrg.2022.974655
Hürlimann, M. D., and Venkataramanan, L. (2002). Quantitative measurement of two-dimensional distribution functions of diffusion and relaxation in grossly inhomogeneous fields. J. Magn. Reson. 157 (1), 31–42. doi:10.1006/jmre.2002.2567
Ji, W.-M., Li, W.-L., Liu, Z., and Lei, T. (2013). Research on the upper paleozoic gas source of the Hangjinqi block in the northern Ordos Basin. Nat. Gas. Geosci. 24 (5), 905–914.
Jiao, P., Wang, P., Zhou, S., Wang, H., and Chen, X. (2022). Study on the microscopic pore in the Shanxi Formation, eastern Ordos Basi. Econ. Geol. 10. doi:10.3389/feart.2022.903588
Lai, J., Wang, G., Cai, C., Fan, Z., Wang, S., Chen, J., et al. (2018). Diagenesis and reservoir quality in tight gas sandstones: the fourth member of the upper triassic xujiahe formation, central sichuan basin, southwest China. Geol. J. 53 (2), 629–646. doi:10.1002/gj.2917
Li, X., Guo, Z., Wan, Y., Liu, X., Zhang, M., Xie, W., et al. (2017). Geological characteristics and development strategies for Cambrian Longwangmiao Formation gas reservoir in Anyue gas field, Sichuan Basin, SW China. Petrol. Explor. Dev. 44 (3), 428–436. doi:10.1016/S1876-3804(17)30049-6
Lin, Y., Lu, Z., Tang, X., Tang, L., and Zhang, W. (2023). Classification of reservoirs and fluids in tight sandstone based on the NMR logging technique—a case study of the upper paleozoic in the Ordos Basin. ACS Omega 8 (41), 37882–37898. doi:10.1021/acsomega.3c02777
Liu, C., Ma, L., Liu, X., Li, Y., Zhang, B., Ren, D., et al. (2022). Study and choice of water saturation test method for tight sandstone gas reservoirs. Front. Phys. 10. doi:10.3389/fphy.2022.833940
Liu, L., Jin, J., Liu, J., Cheng, W., Zhao, M., Luo, S., et al. (2025). Mechanical properties of sandstone under in-situ high-temperature and confinement conditions. Int. J. Minerals, Metallurgy Mater. 32 (04), 778–787. doi:10.1007/s12613-024-3047-9
Lou, L., Wang, Y., Yang, J., Liu, J., Wang, X., and Mao, Y. (2014). Preliminary evaluation of T2-D 2D NMR logging in the gas-water recognition. Well Logging Technol. (05). doi:10.3969/j.issn.1004-1338.2014.05.012
Mukhametdinova, A., Habina-Skrzyniarz, I., Kazak, A., and Krzyżak, A. (2021). NMR relaxometry interpretation of source rock liquid saturation- A holistic approach. Mar. Petroleum Geol. 123. doi:10.1016/j.marpetgeo.2021.105165
Pang, F., Wang, L., Zhang, H., and Zhang, X. (2024). Effect of temperature on enhanced oil recovery of SP flooding based on NMR T1-T2 Maps. Sci. Technol. Eng. 24 (32), 13788–13796. doi:10.12404/j.issn.1671-1815.2400592
Qin, Y., Zhang, G., Luo, C., Zhang, J., and Wang, Z. (2022). Two-dimensional NMR characteristics of Jimsar shale oil reservoir. J. Central South Univ. Technol. 53 (9), 3387–3400. doi:10.11817/j.issn.1672-7207.2022.09.009
Sun, Y., Zhai, C., Xu, J., Qin, L., and Tang, W. (2020). A method for accurate characterisation of the pore structure of a coal mass based on two-dimensional nuclear magnetic resonance T1-T2. Fuel 262, 116574. doi:10.1016/j.fuel.2019.116574
Tan, M., Zou, Y., and Zhou, C. (2013). A new inversion method for (T2, D) 2D NMR logging and fluid typing. Comput. & Geosciences 51, 366–380. doi:10.1016/j.cageo.2012.07.030
Tan, S., Shi, W., Wang, R., Liu, K., Zhang, W., Qi, R., et al. (2024). Characteristics of tight sandstone reservoirs and their controlling factors of He-1 member in Hangjinqi block, Ordos Basin. Earth Sci. 47 (5), 1604–1618. doi:10.3799/dqkx.2022.007
Wang, S., Gu, Z., Guo, P., and Zhao, W. (2024). Comparative laboratory wettability study of sandstone, tuff, and shale using 12-MHz NMR T1-T2 fluid typing: insight of shale. SPE J. 29 (9), 4781–4803. doi:10.2118/221496-PA
Wu, Ke, Chen, D., Zhang, W., Yang, H., Wu, H., Cheng, X., et al. (2022). Movable fluid distribution characteristics and microscopic mechanism of tight reservoir in Yanchang Formation, Ordos Basin. Front. Earth Sci. 10. doi:10.3389/feart.2022.840875
Wu, X., Ni, C., Liu, Q., Liu, G., Zhu, J., and Chen, Y. (2017). “Genetic types and source of the upper paleozoic tight gas in the Hangjinqi area, northern Ordos Basin, China,” China, 1–14. doi:10.1155/2017/4596273
Xie, R.-H., Xiao, L.-Z, Liu, J.-J, and Keh-Jim, D. (2009a). A method for multiple echo trains jointing inversion of NMR relaxation measurements. Chin. J. Geophys. 52, 1342–1349. doi:10.1002/cjg2.1459
Xie, R.-H., and Xiao, L.-Z. (2009b). The (T,D) NMR logging method for fluids characterization. Chin. J. Geophys. (in Chinese) 52 (9), 2410–2418. doi:10.3969/j.issn.0001-5733.2009.09.028
Yanchun, L., Deli, J., Suling, W., Qu, R., Qiao, M., and Liu, H. (2024). Surrogate model for reservoir performance prediction with time-varying well control based on depth generative network. Petroleum Exploration and Development 51 (05), 1287–1300. doi:10.1016/s1876-3804(25)60541-6
Zhang, S.-m., Zhang, S.-n., Ge, X., and Wu, J.-m. (2018). Optimal design and application of two-dimensional NMR logging in chuanxi tight gas reservoir. Chinese J. Magn. Reson. 35 (2), 234–242. doi:10.11938/cjmr20182613
Zhang, S.-m., Ge, X., Wang, X., and Hou, K.-j (2020). A two-dimensional NMR logging method for gas-water identification in dolomite reservoir of the western sichuan gas field. Chinese J. Magn. Reson. 37 (3), 360–369. doi:10.11938/cjmr20192754
Zhao, X., Yang, Z., Zhou, S., Luo, Y., Liu, X., Zhang, Y., et al. (2021). Research on characterization and heterogeneity of microscopic pore throat structures in tight oil reservoirs. ACS Omega 6 (38), 24672–24682. doi:10.1021/acsomega.1c03382
Keywords: tight sandstone, NMR, gas-water distribution, temperaturea and pressure, ordos
Citation: Zhang R, Chen X, Sun X, Ge X, Du H and Yao M (2025) Two-dimensional NMR characterization of gas–water distribution in tight sandstone reservoirs: a case study from the Ordos Basin, China. Front. Earth Sci. 13:1619197. doi: 10.3389/feart.2025.1619197
Received: 27 April 2025; Accepted: 30 June 2025;
Published: 30 July 2025.
Edited by:
Giovanni Martinelli, National Institute of Geophysics and Volcanology, ItalyReviewed by:
Muhsan Ehsan, Bahria University, PakistanMichal Fajt, AGH University of Science and Technology, Poland
Copyright © 2025 Zhang, Chen, Sun, Ge, Du and Yao. This is an open-access article distributed under the terms of the Creative Commons Attribution License (CC BY). The use, distribution or reproduction in other forums is permitted, provided the original author(s) and the copyright owner(s) are credited and that the original publication in this journal is cited, in accordance with accepted academic practice. No use, distribution or reproduction is permitted which does not comply with these terms.
*Correspondence: Xin Sun, dXBjc3VueGluQDE2My5jb20=
 Ran Zhang
 Xinyi Chen1,2
 Xin Sun