 Ellen Unland1*
 Andrew R. Gorman1
 Philip M. Barnes2†
 Christopher M. Moy1
 Hamish Bowman1
 Gary S. Wilson1,3
 Matthias Forwick4
 Jess I. T. Hillman2†
- 1Department of Geology, University of Otago, Dunedin, New Zealand
- 2Ocean Geology, National Institute of Water and Atmospheric Research (NIWA), Wellington, New Zealand
- 3Deputy Vice-Chancellor of Science at the University of Waikato, Hamilton, New Zealand
- 4Department of Geosciences, UiT The Arctic University of Norway, Tromsø, Norway
Temperate fjords serve as key environments for understanding glacial landscape evolution, sedimentary processes, and dynamics. These overdeepened, glacially carved inlets serve as high-resolution repositories of past climate and ice behaviour. While previous studies have highlighted the global significance of carbon trapping in temperate fjords, Te Rua-o-te-Moko Fiordland remains relatively understudied. This study provides a state-of-the-art overview of these fjords, integrating high-resolution bathymetry, marine seismic profiles, and topographic data to identify, discuss and assess spatial variability in fjord morphology. The results reveal a pronounced north-south gradient in geomorphic complexity. Northern fjords tend to be short, linear, and tectonically constrained, with narrow mouths and shallower basins. In contrast, southern fjords exhibit greater catchment areas, more complex geometries, deeper basins, and wider fjord mouths. These spatial variations reflect differences in glacial erosion efficiency, influenced by regional tectonics, bedrock lithology and catchment configuration. We identify widespread entrance sills, terminal moraines, and buried paleodeltas, suggesting episodic glacier retreat punctuated by stillstands. Overdeepened main basins show significant sediment infill, highlighting their potential as carbon sinks. The observed geomorphological patterns provide new insights into glacier dynamics, ice retreat mechanisms, and sediment depositional processes in a southern mid-latitude fjord setting. By establishing a spatial geomorphic framework of the fjords of Te Rua-o-te-Moko Fiordland, this study enhances our understanding of fjord development, controls on sediment transport, and the interplay between glacial, tectonic, and lithologic factors. These findings provide critical insights into fjord evolution, with implications for reconstructing past climates, glacial dynamics, and carbon burial potential.
1 Introduction
Fjords are glacially carved, steep inlets that represent the intersection of terrestrial, glacial, and marine environments (Syvitski et al., 1987; Dowdeswell et al., 2016b). Their distribution is restricted to mountainous coastal regions that experience past or ongoing glaciation and are found at high latitudes across both hemispheres (Syvitski and Shaw, 1995; Bianchi et al., 2020). These geomorphic systems are shaped by repeated cycles of glacial advance and retreat, leaving behind complex seafloor morphologies and overdeepened valleys, which are subsequently infilled and modified by numerous processes, including fluvial and marine sedimentary dynamics (Howe et al., 2010; Batchelor et al., 2018). Although fjords comprise only a small proportion of the global coastlines (Bianchi et al., 2020), they preserve climatic variability near oceanographic transition zones and provide insights into glaciation dynamics, marine inundation, and sedimentary processes. In recent decades, fjords have gained interest as globally significant carbon sinks due to effectively trap organic carbon (Smith et al., 2015; Cui et al., 2016; Smeaton and Austin, 2019). Most research on fjord morphology and sedimentation processes has been conducted in the Northern Hemisphere, especially in Norway (Syvitski and Shaw, 1995; Dowdeswell et al., 2016c), Svalbard (Forwick and Vorren, 2009; Ottesen and Dowdeswell, 2009; Fransner et al., 2016), Greenland (Storms et al., 2012; Dowdeswell et al., 2016a), and Canada (Bennett et al., 2016; Shaw and Lintern, 2016), however, few studies have investigated fjords in the Southern Hemisphere (Rodrigo et al., 2022).
As part of the temperate fjord belt in the Southern Hemisphere, Te Rua-o-te-Moko Fiordland in Aotearoa New Zealand, is an exceptional region for studying fjords, representing a fully deglaciated system which is actively shaped by tectonics, high precipitation, and densely vegetated catchments (Pickrill et al., 1992; Howe et al., 2010; Bianchi et al., 2020). While these fjords are exceptional repositories of environmental and climatic change (Pickrill et al., 1992; Hinojosa et al., 2015; Ramirez et al., 2016), their submarine geomorphology and sedimentary architecture remain limited to individual fjord studies (Bruun et al., 1955; Irwin et al., 1978; Pickrill et al., 1992; Barnes et al., 2016a; Barnes et al., 2016b). Compared to their Northern Hemisphere counterparts, the fjords of Te Rua-o-te-Moko Fiordland lack a regionally integrated geophysical characterisation that resolves spatial variability and elucidates their controlling processes.
This study presents the first integrated geomorphological and geophysical dataset for the fjords of Te Rua-o-te-Moko Fiordland, based on new multibeam bathymetry and high-resolution seismic reflection data. It provides the most spatially extensive coverage to date for 16 fjords, focusing on the morphology, sill distribution, basin architecture, and depositional patterns. The identification and mapping of key landforms offer a foundation for reconstructing fjord evolution, interpreting glacial and postglacial dynamics, and constraining sediment pathways. By establishing the spatial context of these features, this study sets the stage for future research into stratigraphy, marine inundation timing, and the climate and tectonic frameworks shaping the fjords of Te Rua-o-te-Moko Fiordland.
2 Regional setting
Te Rua-o-te-Moko Fiordland extends along the southwestern coastline of Aotearoa New Zealand’s Te Waipounamu South Island, situated between 44.5° and 46.5°S, and is incised by 16 fjords that range from 10 to 44 km in length and are generally <2 km wide (Figure 1). The region holds cultural and historical importance for Māori and is part of the broader UNESCO World Heritage Site, Te Wāhipounamu, preserving Gondwana history (Beattie, 1949; Mortimer, 2004). The geomorphic configuration of these fjords is the result of repeated Quaternary glaciations, which sculpted overdeepened glacial valleys that have been modified by postglacial sedimentation and marine transgression (Augustinus, 1992; Suggate and Almond, 2005; Alloway et al., 2007; Barrell, 2011; Shulmeister et al., 2019). The bedrock consists of Mesozoic plutonic, metamorphic, intrusive igneous, and sedimentary formations (Figure 1), subsequently altered by glacial erosion and tectonic activity (Syvitski et al., 1987; Allibone et al., 2009; Howe et al., 2010; Turnbull et al., 2010; Barrell, 2011; Heron, 2023).
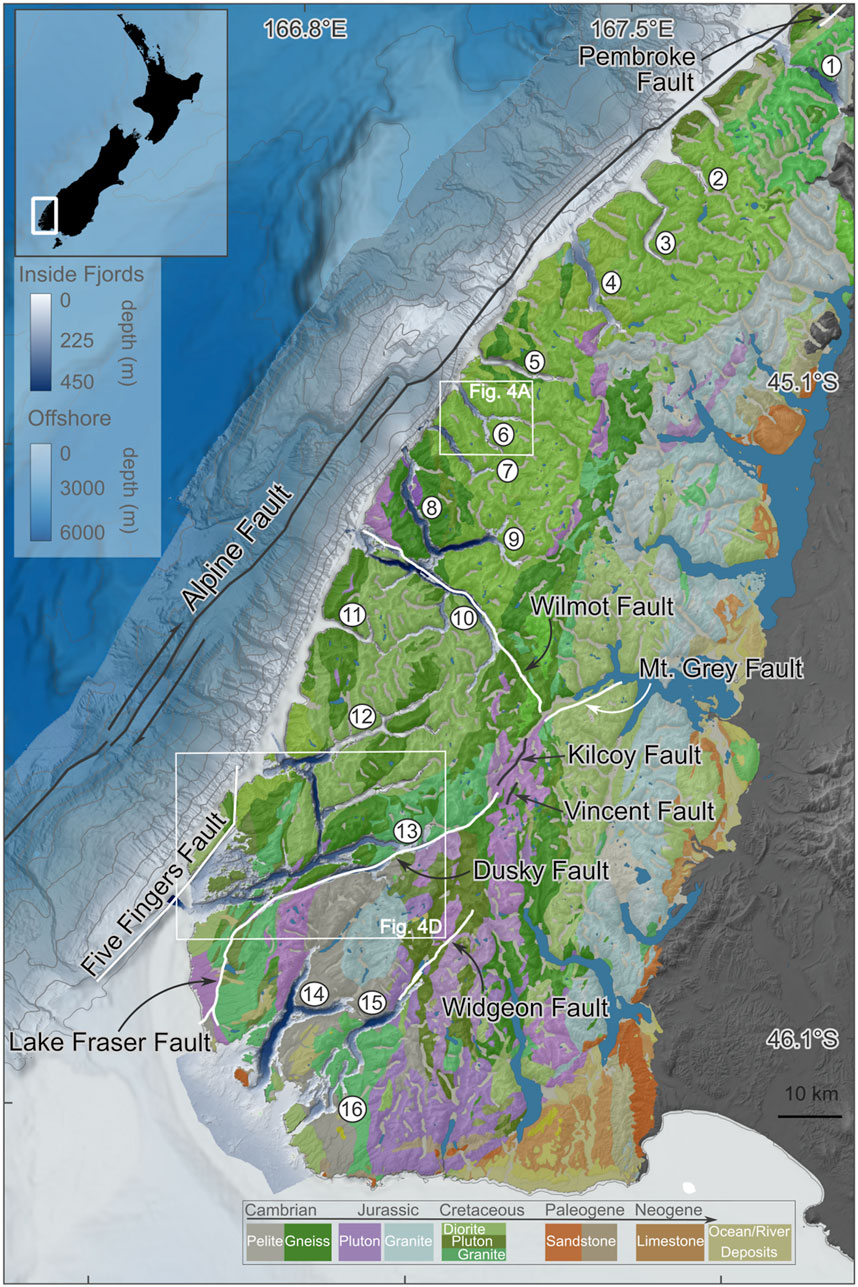
Figure 1. Upper left inset shows the regional setting of Te Waipounamu South Island of Aotearoa New Zealand, highlighting the study area Te Rua-o-te-Moko Fiordland (white box). Main panel shows the morphological map of Te Rua-o-te-Moko Fiordland, displaying multibeam bathymetry of 16 fjords [(1, 2, 5, and 15 m resolution, Land Information New Zealand (LINZ), National Institute of Water and Atmospheric Research (NIWA)] and SO309 (Supplementary Table S1), high-resolution offshore bathymetry (25 m resolution, NIWA), and greater offshore bathymetry (500 m resolution, General Bathymetric Chart of the Oceans (GEBCO Compilation Group, 2023). Active faults and basement faults (Alpine, Kilcoy, and Vincent faults) are shown in black, and inactive basement faults (Pembroke, Wilmot, Five Fingers, Mt. Grey, Dusky, Lake Fraser, and Widgeon faults) are shown in white, after Seebeck et al. (2024) and Turnbull et al. (2010). Bedrock geology is adapted from Heron (2023). Lakes in blue are derived from 1:1500k LINZ dataset and the topographic background is derived from a Digital Elevation Model (DEM, 8 m resolution, LINZ). (1) Piopiotahi Milford Sound; (2) Te Hāpua Sutherland Sound; (3) Hāwea Bligh Sound; (4) Te Houhou George Sound; (5) Taitetimu Caswell Sound; (6) Taiporoporo Charles Sound; (7) Hinenui Nancy Sound; (8–10) Pātea Doubtful Sound System (8) Te Awa-o-Tū Thompson Sound-(9) Kaikiekie Bradshaw Sound-(10) Pātea Doubtful Sound; (11) Te Rā Dagg Sound; (12–13) Tamatea Dusky Sound System (12) Te Puaitaha Breaksea Sound-(13) Tamatea Dusky Sound; (14) Taiari Chalky Inlet; (15–16) Rakituma Preservation Inlet System (15) Rakituma Preservation Inlet-(16) Te Awaroa Long Sound.
The tectonic framework of Te Rua-o-te-Moko Fiordland is defined by the Alpine Fault (Figure 1), which marks the boundary between the Australian and Pacific plates, and the Puysegur Subduction Zone to the south. Both influence the regional seismicity and contribute to the high frequency of mass wasting events and earthquake activity throughout the region (Barnes et al., 2005; Barnes et al., 2013; Clark et al., 2011; Seebeck et al., 2024). Numerous inactive basement faults, including the Prembroke, Wilmot, Mt. Grey, Five Fingers, Dusky, and Widgeon faults, as well as active basement faults such as the Kilcoy and Vincent (Figure 1), have been mapped throughout the area (Turnbull et al., 2010; Seebeck et al., 2024). While these faults intersect the Te Rua-o-te-Moko, Fiordland area, their role in fjord morphology and orientation has not yet been comprehensively assessed. Regional uplift rates range from <0.6 to 1.1 m/kyr, partially masking the isostatic rebound (Bishop, 1985; Syvitski et al., 1987; Kim and Sutherland, 2004).
Te Rua-o-te-Moko Fiordland is a key region for climate research, particularly monitoring the influence of Southern Hemisphere Westerly Winds (SHWW) (Knudson et al., 2011; Hinojosa et al., 2015; Hinojosa et al., 2017). These persistent winds drive high precipitation rates, enhance erosion and transport organic-rich material from the vegetated catchment into the fjords, emphasising the focus on carbon trapping and burial potential of Te Rua-o-te-Moko Fiordland, and further highlighting the significance of the region in understanding sedimentary and biogeochemical processes (Cui et al., 2016; Dlabola et al., 2015; Hinojosa et al., 2014; Pickrill et al., 1992; Pickrill, 1993; Ramirez et al., 2016; Stanton and Pickard, 1981).
Submarine landforms, such as sills, overdeepened basins, and deltaic systems, are characteristic of the fjords of Te Rua-o-te-Moko Fiordland and record glacial and postglacial processes (Dykstra, 2012; Barnes et al., 2016a; Dowdeswell et al., 2016b). Overdeepened basins are found at depths of 250–420 m below sea level (mbsl) (Stanton and Pickard, 1981; Dykstra, 2012; Barnes et al., 2016b; Barnes et al., 2016a), preserving stratigraphic accumulations influenced by fluvial input, marine processes and landslides (Domack and McClennen, 1996; Dowdeswell et al., 2016c; Hinojosa et al., 2017; Ottesen et al., 2008). Basin infill also hosts the most significant potential for carbon preservation and records the history of sedimentation and climate variability (Hinojosa et al., 2014; Howe et al., 2010; Ramirez et al., 2016). However, the understanding of the sediment infill history in Te Rua-o-te-Moko Fiordland is immature, hindering comprehensive insights into oceanographic dynamics and deglaciation history. Sills, formed of bedrock, occur as entrance sills, internal thresholds, or subaerial ridges. These features influence circulation (Howe et al., 2010), restrict deep-water exchange (Bianchi et al., 2020), and act as geomorphic markers of ice stillstands or re-advances (Syvitski and Shaw, 1995; Howe et al., 2010).
Despite the critical role of hydroacoustic imaging in systematically identifying, characterising, and quantifying the marine landforms (Bruun et al., 1955; Brodie, 1964; Glasby, 1978), the geophysical framework of Te Rua-o-te-Moko Fiordland remains sparsely resolved due to the limited availability of comprehensive, high-resolution multibeam bathymetry and reflection seismic data. This limits the ability to map the spatial distribution of key glacimarine landforms, such as basins, sills, and deltas, whose locations, extents, and morphologies are largely undocumented across the region. While some of the effects of relative sea-level changes in Te Rua-o-te-Moko Fiordland have been proposed (Dlabola et al., 2015), their integration with glacial history (Kaplan et al., 2010; Ohneiser et al., 2013) and retreat models (Augustinus, 1992) remains incomplete, limiting a comprehensive understanding of their evolution of the area.
3 Data and methods
3.1 Multibeam bathymetry
This study utilises a compilation of numerous multibeam bathymetry datasets covering 685 km2. Data was acquired for eight fjords during a Fiordland Hydrographic Survey project in 2019 by iXblue Pty Ltd., contracted by Land Information New Zealand (LINZ) (Supplementary Table S1). A Kongsberg EM2040C multi-beam echo sounder (MBES) was used, with acquisition managed through QPS Quinsy and processing using CARIS HIPS and SIPS software (iXblue, 2019). The final output consisted of 1, 2, and 5 m resolution grids, covering depths from ∼20 to 420 mbsl. The National Institute of Water and Atmospheric Research (NIWA; Figure 1; Supplementary Table S1) had previously surveyed three additional fjords and offshore areas during research cruise TAN0405 aboard R/V Tangaroa in 2004, using a Kongsberg EM300. The data were processed with C&C Technologies HydroMap and ArcInfo software, resulting in 5 m grid cells (Barnes et al., 2013; Barnes et al., 2016a; Barnes et al., 2016b). During research cruise SO309 aboard R/V Sonne, additional coverage gaps within the fjords were filled using a Kongsberg EM710, with resulting bathymetric grids produced at 15 m resolution, further enhancing the completeness of the regional compilation (Supplementary Table S1) (Freiwald et al., 2025).
3.2 Marine seismic reflection data
An extensive marine reflection seismic dataset was acquired during seven research cruises conducted between 2013 and 2024 by the University of Otago. This study presents 15 representative seismic profiles, one from each fjord where coverage is available, totalling 347 km in length (Supplementary Table S1; Figure 2). The dataset comprises both single-channel and high-resolution multi-channel seismic reflection profiles, providing comprehensive subsurface imaging of each fjord (Unland, 2025a; Unland, 2025b). Single-channel seismic data were collected using a Ferranti Ocean Research Equipment (ORE) Geopulse sub-bottom profiler, whereas multi-channel seismic data acquisition employed either the ORE or an Applied Acoustics boomer source with a Geometrics MicroEel streamer (Supplementary Table S1). Basic seismic processing using GLOBE Claritas included geometry set-up, common mid-point (CMP)-binning, signal processing (bandpass filtering, spherical divergence, despiking, and residual statics), velocity analysis, normal moveout correction, and CMP-stacking. Post-stack processing included swell removal, deconvolution, and time migration. For a simple time-to-depth conversion of subsurface features and sediment thicknesses, a constant seismic velocity of approximately 1550 m/s was used. This value is consistent with the typical sound speed in unconsolidated marine sediments and mud (Sheriff and Geldart, 1995; Yilmaz, 2001) and was confirmed through velocity analysis during seismic processing.
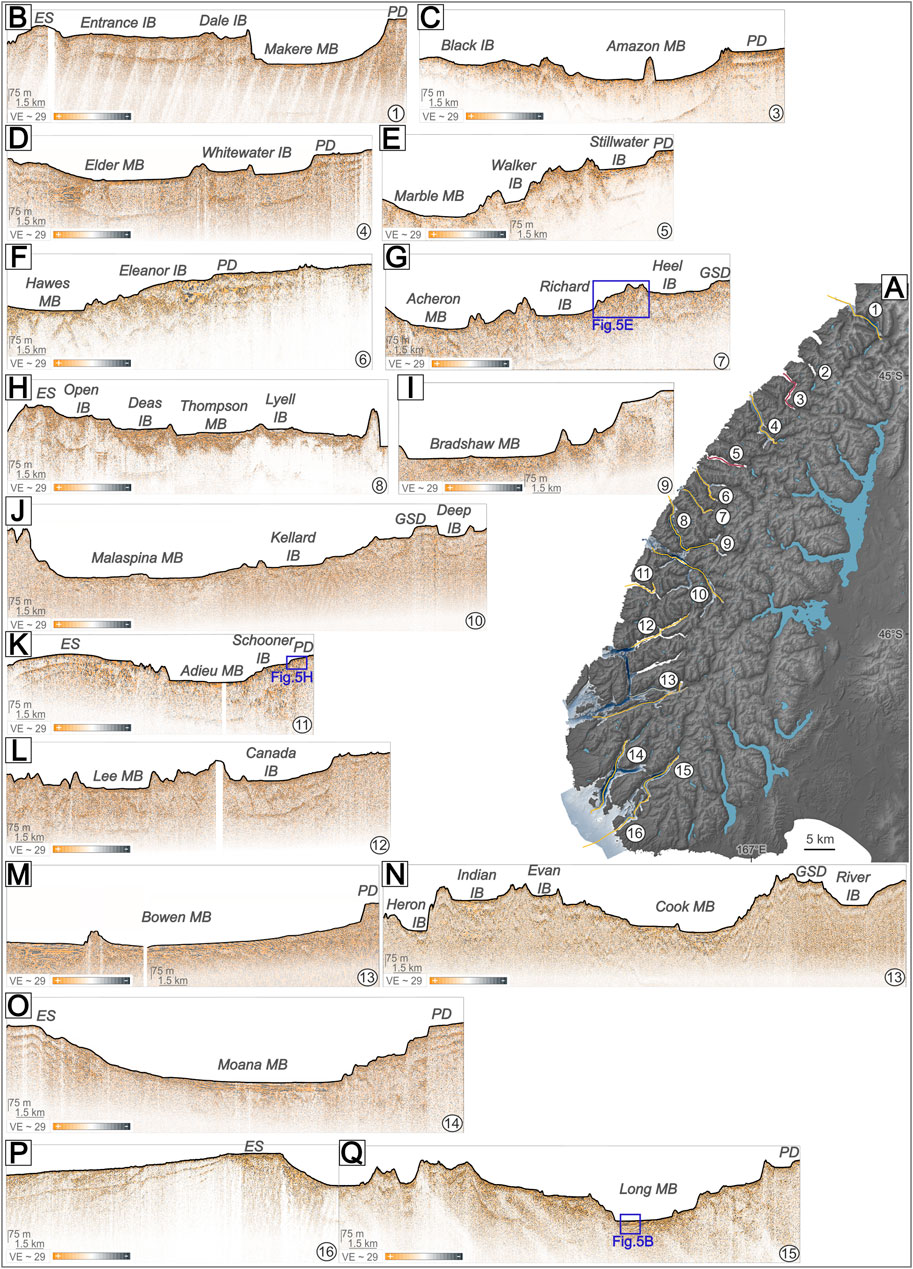
Figure 2. (A) Overview map of the location of seismic profiles. Yellow lines indicate multi-channel seismic profiles, while pink represents single-channel seismic profiles. (1) Piopiotahi Milford Sound; (2) Te Hāpua Sutherland Sound; (3) Hāwea Bligh Sound; (4) Te Houhou George Sound; (5) Taitetimu Caswell Sound; (6) Taiporoporo Charles Sound; (7) Hinenui Nancy Sound; (8-10) Pātea Doubtful Sound System (8) Te Awa-o-Tū Thompson Sound-(9) Kaikiekie Bradshaw Sound-(10) Pātea Doubtful Sound; (11) Te Rā Dagg Sound; (12-13) Tamatea Dusky Sound System (12) Te Puaitaha Breaksea Sound-(13) Tamatea Dusky Sound; (14) Taiari Chalky Inlet; (15-16) Rakituma Preservation Inlet System (15) Rakituma Preservation Inlet-(16) Te Awaroa Long Sound. (B-Q) 16 seismic profiles were compiled from north to south, providing representative along-profiles of each fjord. Profile numbers shown on the lower right part of each panel locate the profiles on the map (A). Significant submarine landforms are labelled as ES, Entrance Sill; IB, Intermediate Basin; MB, Main Basin; PD, Paleodelta; GSD,Gilbert-style Delta.
3.3 Geomorphometry
The analysis of fjord geomorphology was conducted using the free and open-source geographic information system QGIS 3.34, utilising custom PyGIS processing scripts (Supplementary Figure S1). These scripts are based on and expand upon the methods outlined by Nyberg et al. (2015). Fjord polygons were clipped from a LINZ Digital Elevation Model (DEM; 8 m resolution) to achieve precise fjord outlines. Based on the polygons, centrelines were calculated, defining the individual polygon lengths (Figure 3) (Nyberg et al., 2015). Further key geomorphological metrics, such as the total length, width, and sinuosity for each individual fjord, were computed to facilitate a geometric classification (Figure 3).
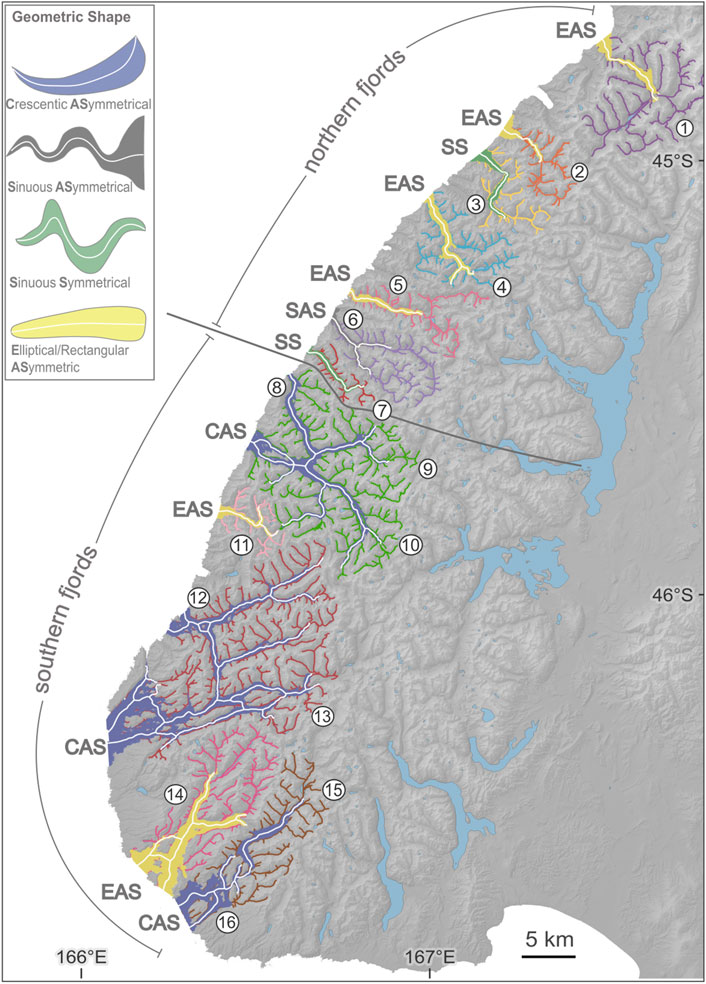
Figure 3. Geometric classification of Te Rua-o-te-Moko Fiordland fjords using the methodology from Nyberg et al. (2015). Fjords are colour-coded according to their geometric shape with centerlines in white, as indicated in the legend: EAS, Elliptical/Rectangular Asymmetrical; SS, Sinuous Symmetrical; SAS, Sinuous Asymmetrical; CAS, Crescentic Asymmetrical [after Nyberg et al. (2015)]. The figure delineates the northern and southern fjords, highlighting differences in fjord morphology. Catchment area values corresponding to Table 1 are outlined, with drainage pathways visualised to illustrate hydrological connectivity. Background topography is an 8 m resolution DEM from LINZ, also shown in blue is the position of the lakes (LINZ, 1:1500k). 1) Piopiotahi Milford Sound; (2) Te Hāpua Sutherland Sound; (3) Hāwea Bligh Sound; (4) Te Houhou George Sound; (5) Taitetimu Caswell Sound; (6) Taiporoporo Charles Sound; (7) Hinenui Nancy Sound; (8–10) Pātea Doubtful Sound System (8) Te Awa-o-Tū Thompson Sound-(9) Kaikiekie Bradshaw Sound-(10) Pātea Doubtful Sound; (11) Te Rā Dagg Sound; (12–13) Tamatea Dusky Sound System (12) Te Puaitaha Breaksea Sound-(13) Tamatea Dusky Sound; (14) Taiari Chalky Inlet; (15–16) Rakituma Preservation Inlet System (15) Rakituma Preservation Inlet-(16) Te Awaroa Long Sound.
The catchment area for each fjord was calculated using drainage networks, flow accumulations, and watersheds derived from a custom hydrology workflow in the SAGA Next-Generation Toolbox within QGIS 3.34 (Supplementary Figure S1). The 8 m resolution topographic DEM from LINZ was used to delineate drainage pathways, with the upslope limits set by lateral drainage divides and sea level as the downslope limit. Drainage divides are partly based on Barrell (2011). To prevent discontinuities in the drainage systems, sinks were filled (Wang and Liu, 2006). Finally, the Watershed Basin Tool was used to calculate drainage divides, which were rasterised to derive statistical metrics for each catchment area (Figure 3; Supplementary Figure S1; Table 1).
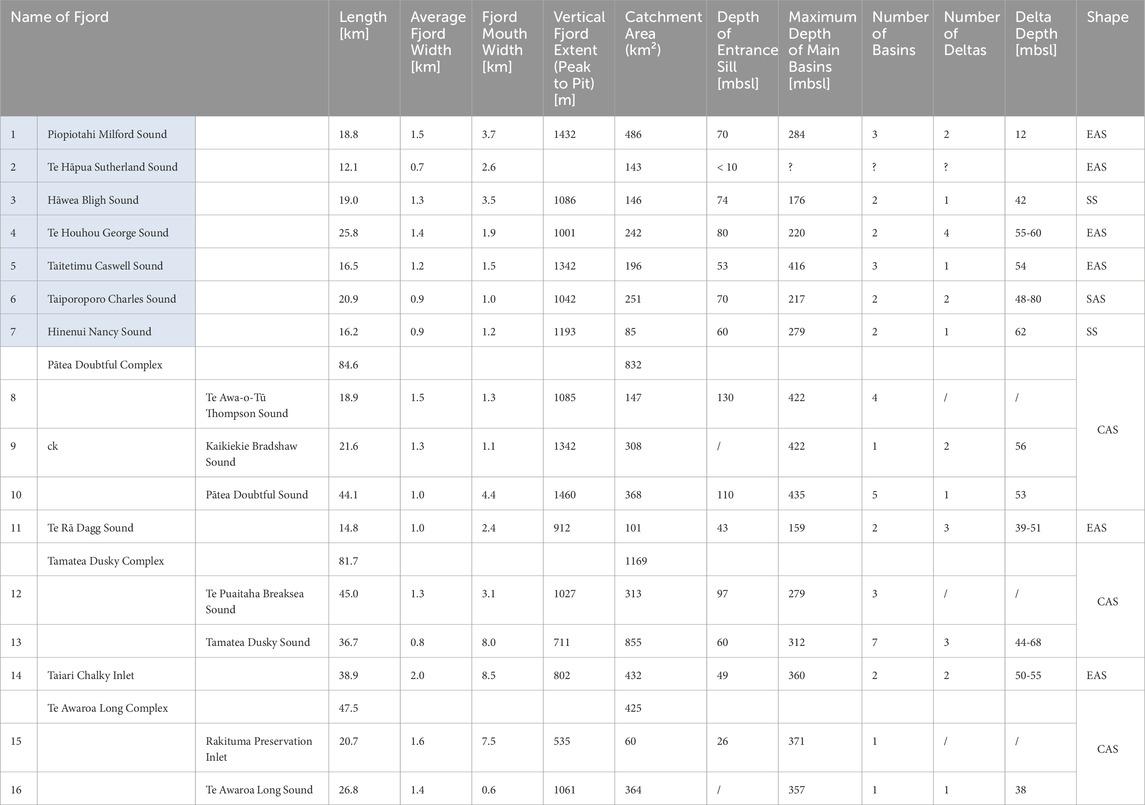
Table 1. Summary of key geomorphological and bathymetry characteristics of the ∼16 fjords in Te Rua-o-te-Moko Fiordland, Aotearoa New Zealand (see Figure 1for fjord location). Blue background shows the northern fjords and white shows the southern fjords.
3.4 Geomorphological terminology
To enhance clarity and consistency in the description of the geomorphological features of Te Rua-o-te-Moko Fiordland, several terms are used throughout the study area. Bedrock sills are erosional-resistant glacial landforms that expose underlying bedrock and can be overlain by morainal deposits, while moraines are depositional features composed of bedrock debris (Syvitski and Shaw, 1995; Howe et al., 2010; Batchelor et al., 2018). In some instances, bathymetric and seismic data do not provide sufficient differentiation, and the precise categorisation remains ambiguous. In these cases, visual interpretation and physical characteristics from bathymetry or seismic data are used to distinguish these features. Indicators such as the extent and degree of mounding can help distinguish the features, with layering disruptions observed in seismic data typically indicative of sills, whereas discontinuous internal reflection patterns are more characteristic of moraines. This differentiation can only be made if seismic data is available. Bedrock sills or moraines (often separate sedimentary basins within a fjord, and the sub-basins are categorised based on their relative size and position within the fjord system). The widest, deepest, and longest are referred to as main basins, and each fjord contains one main basin (Syvitski et al., 1987; Howe et al., 2010). This classification is based on their relative size and depth, rather than their position within the fjord. Intermediate basins, in contrast, are less extensive and shallower than the main basins, and may separate the main basin from the fjord mouth or the fjord head. These terms are not to be confused with back basins, which refer specifically to fjord-head basins known to accumulate the highest amounts of organic material (Smeaton and Austin, 2019).
4 Results and geomorphic overview
This section presents new findings based on multibeam bathymetry and high-resolution seismic reflection data from 16 fjords in Te Rua-o-te-Moko Fiordland, described from north to south. These new datasets are integrated with existing morphological and sedimentological knowledge to provide a consolidated overview of fjord structures. Given the sparse, low-resolution and uneven distribution of marine geophysical data in this region (Irwin et al., 1978; Stanton and Pickard, 1981; Pickrill et al., 1992; Barnes et al., 2016a), this study synthesises prior interpretations with new observations to offer a comprehensive understanding of the fjords geomorphology. The resulting compilation enables a regionally consistent framework from which fjord-scale variability can be analysed and interpreted.
4.1 Piopiotahi Milford Sound
Piopiotahi Milford Sound is the northernmost fjord in Te Rua-o-te-Moko Fiordland (Figure 1). It is 18.8 km long and characterised by minimum sinuosity, thus being classified as having an elliptical asymmetric shape (Figure 3; Table 1). This fjord has been extensively studied, being the most famous and only fjord that has significant infrastructure and accessibility (Bruun et al., 1955; Brodie, 1964; Skerman, 1964; Stanton and Pickard, 1981; Pickrill, 1993; Dykstra, 2012). Piopiotahi Milford Sound lies closest to the Alpine Fault, which intersects the fjord mouth (Figure 1) (Barnes, 2009; Barnes et al., 2005). The surrounding catchment exhibits the highest elevations in Te Rua-o-te-Moko Fiordland, expressed in the steepest fjord walls that make this area particularly susceptible to landslide events (Dykstra, 2012). Previous catchment calculations by Stanton and Pickard (1981) have been updated, resulting in a revised total catchment area of 486 km2 (Table 1). At the fjord head, a modern active delta has been observed, fed by the Cleddau River and leading into Deepwater Basin (Dykstra, 2012). Adjacent to that, a buried paleodelta extends 1.7 km in length and 1.4 km in width, located at ∼12 mbsl, previously referred to as the Cleddau Delta (Bruun et al., 1955; Dykstra, 2012). Prograding sequences are interbedded with chaotic and deformed reflections, suggesting the presence of debris flows and landslide deposits (Dykstra, 2012). Down-fjord from the Cleddau Delta, the Makere Basin (Supplementary Table S2; Supplementary Figure S2) represents the main basin of Piopiotahi Milford Sound and reaches a maximum depth of 284 mbsl. The basin is characterised by smooth sediment fill and is flanked by debris fields (Figure 2B) (Stanton and Pickard, 1981; Dykstra, 2012). The Makere Basin is separated from the intermediate Dale Basin by an inner sill, where the seafloor depth becomes abruptly shallower (126 mbsl), and deposits are interbedded with debris flows (Dykstra, 2012) (Supplementary Figure S2). The fjord narrows to a width of 1 km at Dale Point before broadening towards another intermediate basin (Entrance Basin), which leads into the Tasman Sea (Supplementary Figure S2). The crest of the entrance sill is at ∼70 mbsl, positioned near the edge of the continental shelf and ∼6 km from the fjord mouth, where terminal and lateral moraine deposits are revealed by multibeam bathymetry and seafloor photographs (Barnes, 2009; Barnes et al., 2005; Skerman, 1964).
4.2 Te Hāpua Sutherland Sound
Te Hāpua Sutherland Sound is the smallest, least studied fjord and designated Marine Reserve (Figure 1). With a length of 12.1 km, it has an estimated catchment of 143 km2 and shows an elliptical asymmetric shape (Figure 3; Table 1). Due to the absence of multibeam bathymetry and seismic reflection data, no geomorphological features or subsurface attributes can currently be identified. Te Hāpua Sutherland Sound is likely the shallowest fjord in the region, with the entrance sill at depths of <10 mbsl. This shallow threshold restricts marine inflow from the Tasman Sea and imparts the fjord with characteristics similar to an enclosed coastal lake.
4.3 Hāwea Bligh Sound
Hāwea Bligh Sound is a 19 km long single-channel fjord characterised by a sinuous, S-shaped morphology and a catchment of 145 km2 (Figures 1,3). This fjord was imaged by single-beam echo-soundings in 1977 as part of the FJORDS77 project (Stanton and Pickard, 1981). However, the absence of high-resolution multibeam bathymetric data limits detailed seafloor analysis (Supplementary Table S1). The existing single-channel seismic data reveal a buried paleodelta at the fjord head, which is ∼3 km long, 0.9 km wide, and 36.8 m high (Figure 2B), located at ∼20 mbsl. Beyond the delta, the slope descends into the main basin (Amazon Basin) and reaches a maximum depth of 176 mbsl (Table 1; Figures 1,2B). The Amazon Basin extends for 8.1 km before an inner sill separates it from Black Basin, the adjacent intermediate basin. Around 11.4 km along the fjord, a distinct 90-degree bend redirects the orientation of the fjord northwestward, where it continues toward the Tasman Sea. The entrance sill is at a depth of 74 mbsl (Table 1).
4.4 Te Houhou George Sound
Te Houhou George Sound extends over 25.8 km and has an elliptical asymmetric shape (Figures 1, 3). While primarily a single-channel fjord, it features a tributary known as South-West Arm (Stanton and Pickard, 1981; Pickrill, 1987; Barnes et al., 2016b). The catchment is characterised by steep terrain, yielding a catchment area of 242 km2 (Table 1). Seismic and multibeam bathymetric data reveal multiple paleodeltaic systems throughout the fjord. These include the Alice and South-West Arm deltas at the fjord heads, and the Whitewater and Anchorage deltas extending into the main basin (Barnes et al., 2016b) (Supplementary Figure S3). Adjacent to the fjord head deltas, the intermediate basin (Whitewater Basin) is located at depths of 177 mbsl, extending 2.47 km in length, and is separated by an inner sill from the deeper main basin (Elder Basin). The latter lies at depths below 220 mbsl and extends for 8.63 km (Figure 2C). Both basins contain significant basin fill with evidence of mass wasting deposits (Pickrill, 1987; Barnes et al., 2016b). The Elder Basin is separated from the sea by an entrance sill at 80 mbsl (Table 1). On top of the sill, successive layers of sediment wave deposits reach into the fjord (Supplementary Figure S3).
4.5 Taitetimu Caswell Sound
Taitetimu Caswell Sound is a single-channel fjord that extends for 16.5 km and features a straight-to-elliptical asymmetrical shape with a catchment covering an area of 196 km2 (Figures 1, 3; Table 1). Previous single-beam echo-sounding studies identified three basins (Figure 2E; Supplementary Table S1) (Irwin et al., 1978; Stanton and Pickard, 1981). Furthermore, single-channel seismic data imaged a buried oblique prograding paleodelta at the fjord head that is 0.75 km long. Adjacent to the paleodelta lies the intermediate Stillwater Basin (Irwin et al., 1978), found at depths of 138 mbsl, stretching 2.2 km in length. An inner sill at 110 mbsl separates the Stillwater Basin from another adjacent intermediate basin (Walker Basin), which lies at 167 mbsl and extends for 0.7 km. Progressing down-fjord, another sill divides the Walker Basin from the Marble Basin, representing main basin in the fjord. This main basin reaches depths of 416 mbsl and spans 4.3 km. The entrance sill lies at 53 mbsl, and the fjord mouth opens westward (Table 1).
4.6 Taiporoporo Charles Sound
Taiporoporo Charles Sound is a tributary fjord with a distinct Y-shaped configuration, branching into Emelius- and Kahukura Gold arms, and extending over a total length of 20.9 km (Figure 1). The fjord has a sinuous asymmetric morphology (Table 1; Figure 3) and is fed by a catchment area of 251 km2, primarily located in the inland reaches of the system. Multibeam bathymetric data reveal the presence of submarine fans and debris flows on the fjord walls of the arms, as well as several moraine features distributed throughout the fjord (Figure 4A). No fjord head delta is observed in seismic data within the Marine Reserve Kahukura Gold Arm. In contrast, Emelius Arm is partially sheltered by a lateral moraine and a subaerial island (Eleanor Island), which provides a natural limitation before it merges with the main channel of Taiporoporo Charles Sound (Figure 4A). While not imaged in seismic data, a modern delta is visible at the mouth of the Irne River within Emelius Arm, apparent from satellite imagery. At the junction of the arms, seismic data reveal another buried paleodelta (Figure 2E). Adjacent to the delta slope, the intermediate Eleanor Basin extends for <1 km before being interrupted by lateral moraines that lead into the main trunk (Hawes Basin) found at 217 mbsl. The main basin shows a homogenous seafloor, indicating smooth basin fill (Figures 4A,B). The entrance sill is located at a depth of 70 mbsl. Beyond the sill, iceberg ploughmarks are observed, while the landward slope of the sill displays features associated with sediment waves (Figures 2E, 4A).
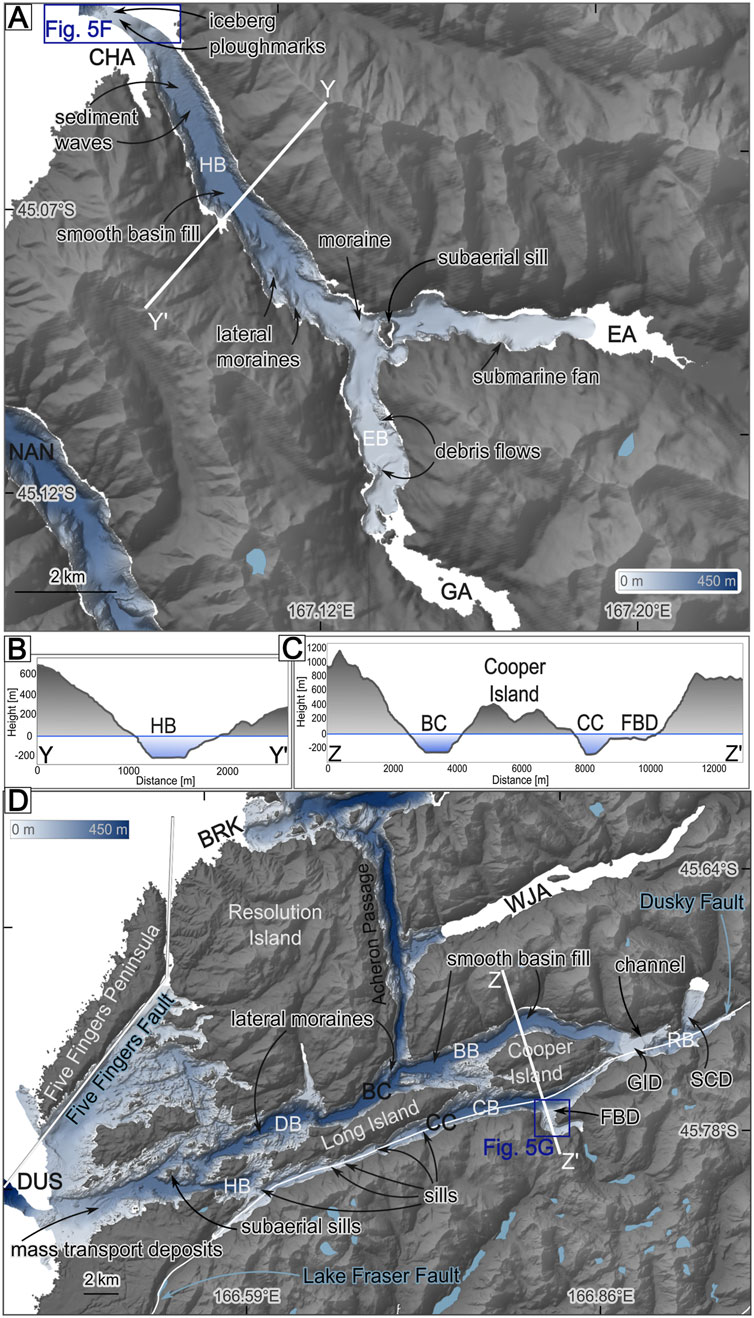
Figure 4. (A) Multibeam bathymetry of Taiporoporo Charles Sound (CHA) from LINZ (1 m resolution, Table S1), representing a typical northern fjord. EA, Emelius Arm; GA, Gaer Arm; EB, Eleanor Basin; HB, Hawes Basin; NAN, Hinenui Nancy Sound (Tables 1, S2). (B) Cross-section profile through the main basin of Taiporoporo Charles Sound. HB, Hawes Basin. (C) Cross-section through the main basins of Bowen Channel (Bowen Basin) and Cook Channel (Cook Basin), crossing Cooper Island and FBD. (D) Multibeam bathymetry of Tamatea Dusky Sound (DUS) from LINZ and SO309 (1 and 15 m resolution, Supplementary Table S1), representing a southern fjord. White lines indicate inactive basement faults (Dusky, Lake Fraser, and Five Fingers faults) after Seebeck et al. (2024) and Turnbull et al. (2010). BRK, Te Puaitaha Breaksea Sound; WJA, Wet Jacket Arm; BC, Bowen Channel; CC, Cook Channel; BB, Bowen Basin; RB, River Basin; CB, Cook Basin; HB, Heron Basin; DB, Duck Basin (Tables 1, Supplementary Table S2); SCD, Supper Cove Delta; GID, Girlies Island Delta; FBD, Fanny Bay Delta. Topography background from 8 m resolution DEM from LINZ, as well as the position of the lakes in blue (LINZ, 1:1500k).
4.7 Hinenui Nancy Sound
Hinenui Nancy Sound is a 16.2 km long single-channel fjord characterised by a sinuous symmetrical shape and surrounded by an estimated catchment area of 85 km2, the smallest catchment in Te Rua-o-te-Moko Fiordland (Table 1; Figures 1, 3). At the fjord head, seismic data reveal a submerged Gilbert-style (Gilbert, 1885) paleodelta extending 0.3 km and featuring clinoforms that are ∼27 m high, located at a depth of 62 mbsl (Figure 2F). Adjacent to the delta, the intermediate Heel Basin extends for 1.3 km (Irwin et al., 1978). The fjord takes a sharp 90-degree turn before opening seaward, where a sill rises to 70 mbsl (Figures 2G, 5A–C; Supplementary Figure S4). Beyond the sill, the intermediate Richard Basin is located at 211 mbsl and extends 0.5 km in length. Numerous submarine fans are observed along the base of fjord-walls (Figures 1, 5C). A second sill separates Richard Basin from the main basin (Acheron Basin), which reaches maximum water depths of 279 mbsl. Unlike Irwin et al. (1978), who identified another basin between the Richard Basin and Acheron Basin, only three basins are revealed by multibeam bathymetry and seismic data in this study (Figure 2F; Supplementary Figure S4). The entrance sill lies at a depth of 60 mbsl, and the fjord mouth, 1.2 km wide, opens northwestward. Sediment waves are observed along the landward slope of the entrance sill (Figure 5I; Supplementary Figure S4).
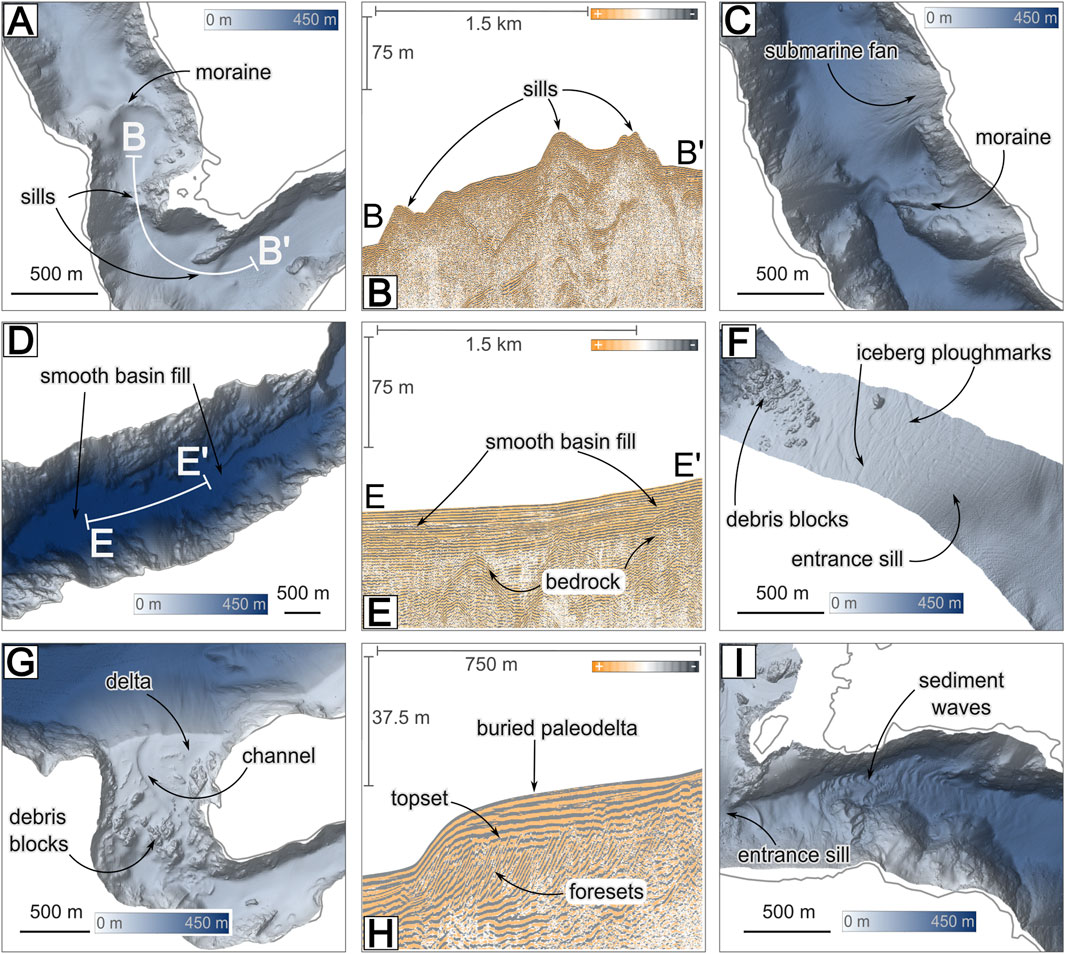
Figure 5. (A) Multibeam bathymetry of Hinenui Nancy Sound, highlighting a transverse moraine and associated sills (Supplementary Figure S4). (B) Multi-channel seismic profile excerpt from Hinenui Nancy Sound (24BG0604_103; full profile shown in Figure 2F), illustrating the sills identified in (A). (C) Multibeam bathymetry of Hinenui Nancy Sound, showing a prominent submarine fan and a well-defined, high-relief moraine ridge. (D) Multibeam bathymetry of Te Awaroa Long Sound, displaying smooth basin fill. (E) Multi-channel seismic profile excerpt (22PL1028_109; full profile shown in Figure 2P) corresponding to (D), depicting the well-stratified infill of the basin. (F) Multibeam bathymetry of the outer Taiporoporo Charles Sound, revealing iceberg ploughmarks, debris blocks, and an entrance sill (also shown in Figure 4A). (G) Multibeam bathymetry of Fanny Bay, Tamatea Dusky Sound, illustrating a delta with an incised submarine channel (see also Figure 4D). (H) Multi-channel seismic profile from Te Rā Dagg Sound, Anchorage Arm (23PL1101_106; full profile shown in Figure 2J), showing a buried paleodelta with well-preserved topset and foreset deposits. (I) Multibeam bathymetry of Hinenui Nancy Sound near the fjord mouth, highlighting sediment waves creeping into the basin and the associated entrance sill. Multibeam bathymetry shown is from LINZ (1 and 5 m resolution; also see Supplementary Table S1).
4.8 Pātea Doubtful Sound System
The Pātea Doubtful Sound System comprises three interconnected fjords: Te Awa-o-Tū Thompson, Kaikiekie Bradshaw, and Pātea Doubtful sounds, defining the transition from morphologically relatively simple-to morphologically complex fjords (Figures 1, 3). Together, they form a unique multi-branch system with a combined length of 84.6 km and a crescentic asymmetrical shape (Table 1). Te Awa-o-Tū Thompson Sound trends north-northwest and represents the seaward continuation of Kaikiekie Bradshaw Sound. At their junction, the shallow marine (<50 mbsl), Pendulo Reach saddle (Figure 1; Supplementary Figure S5) provides a connection to the southern Pātea Doubtful Sound. The complex is fed by a combined catchment area of 832 km2 (Table 1; Figure 3). Both Kaikiekie Bradshaw- and Te Awa-o-Tū Thompson sounds have been described in previous work by Barnes et al. (2016b). Significant deltaic deposits are absent in the latter, whereas Kaikiekie Bradshaw Sound features two prominent fjord-head paleodeltas, the Gaer Arm and Precipice Cove deltas (Supplementary Figure S5). The submerged Precipe Cove Delta features oblique prograding clinoforms over 0.81 km, capped by topset deposits, with an exposed delta brink (Figure 2I). Gaer Arm paleodelta lies at depths of 55 mbsl and exhibits distinct foresets, and a smaller modern delta is evident at its landward extent. Bathymetry data reveal isolated submarine fans along the base of the steep fjord-walls, especially within Kaikiekie Bradshaw Sound, where they are particularly well-developed (Barnes et al., 2016a) (Figure 1; Supplementary Figure S5). Seismic profiles show that Kaikiekie Bradshaw Sound contains a well-defined main basin, referred to as the Bradshaw Basin. In contrast, Te Awa-o-Tū Thompson Sound contains a series of 2–8 km long basins that are separated by concentric sills (Figure 2G; Supplementary Figure S6; Barnes et al., 2016b). These include the main basin, Lyall Basin, located near the connection to Kaikiekie Bradshaw Sound, followed by the central and seaward intermediate basins (Thompson, Dale, and Open basins; Supplementary Table S2) extending toward the Tasman Sea (Supplementary Figure S6). At the seaward end of the complex, the entrance sill reaches a minimum depth of 130 mbsl, and the fjord mouth is 1.5 km wide (Table 1). Seismic and bathymetric data reveal the relict Thompson Fan, on the upper Te Rua-o-te-Moko Fiordland margin beyond the entrance sill (Barnes et al., 2005; Barnes et al., 2016a) (Figure 1).
Pātea Doubtful Sound, the longest fjord within the Pātea Doubtful Sound Complex, extends for 44.1 km and has a main trunk valley joined by three arms ranging from 5 to 15 km in length. From inner to outer, the arms are named Hall, Crooked, and First arms, respectively (Figure 1; Supplementary Figure S7). At the fjord head lies the 1.6 km long intermediate Deep Basin and the Deep Cove Delta (Supplementary Figure S7; Figure 2I). This delta exhibits an exposed brink, is 1.1 km long and ∼33 m high, and multibeam bathymetry shows a continuation of deltaic deposits extending northward. Deltaic deposits terminate at a subaerial sill, represented at the surface by Taipari Roa Elizabeth Island (Supplementary Figure S7). The sill structure continues further north, initially buried by marine sediment, before emerging again. Adjacent to the Deep Cove Delta and the subaerial sill lies the intermediate Kellard Basin, which connects to Crooked Arm and spans ∼11 km in length (Figure 2I). An inner sill composed of exposed bedrock disrupts continuous sediment deposition before leading into the ∼14.3 km long and 435 mbsl deep main basin (Malaspina Basin) (Figures 1, 2I; Supplementary Figure S7). At the fjord mouth, the outflow splits into three channels around Bauza Island and smaller adjacent landforms, creating a rugged and irregular bathymetry (Supplementary Figure S7). The entrance sill is located at 110 mbsl (Table 1). The inactive Wilmot Fault extends along the entire length of the fjord, originating north of the fjord head, continuing through the main trunk, passing north of Bauza Island, and terminating near the fjord mouth (Figure 1; Supplementary Figure S7).
4.9 Te Rā Dagg Sound
Te Rā Dagg Sound is a simple tributary fjord with a Y-shape configuration, joined by Anchorage Arm at a striking 90-degree intersection, contributing to a total length of 14.8 km (Figures 1, 3). The fjord has an elliptical asymmetric geometry, is closely situated to Pātea Doubtful Sound and is fed by a catchment area of 100 km2 (Table 1). Although multibeam bathymetry is absent, sparse single-beam echo-sounding data have been acquired (Stanton and Pickard, 1981). Seismic data reveal the presence of buried oblique prograding paleodeltas in both Te Rā Dagg Sound and Anchorage Arm (Figures 2J, 5H). At Anchorage Arm, a paleodelta is found at depths of 51 mbsl, leading into the main Adieu Basin. At the junction of the two arms, and adjacent to an intermediate basin (Schooner Basin; Supplementary Table S2), a submerged Gilbert-style paleodelta is observed, characterised by oblique prograding clinoforms overlain by topset deposits and a well-defined delta brink (Figures 2J, 5H). Down-fjord, the Adieu Basin, is located at 159 mbsl (Table 1). This is the shallowest main basin identified in Te Rua-o-te-Moko Fiordland, extending across 3.1 km. The entrance sill rises to a shallow water depth of 43 mbsl. Seismic data show prograding deposits on the seaward slope of the sill, extending into the Tasman Sea, while sediment waves indicate sediment creep into the fjord (Figure 5I). The fjord mouth opens westward and has a width of 2.4 km (Figure 1).
4.10 Tamatea Dusky Sound System
The Tamatea Dusky Sound System exhibits a distinct E-shaped morphology, with Te Puaitaha Breaksea Sound positioned in the north, Moana Uta Wet Jacket Arm forming the central part, and Tamatea Dusky Sound lying in the south. These are all connected by the Acheron Passage (Figures 1, 4D). This fjord configuration is 81.7 km long with a crescentic asymmetrical shape (Figure 3). The size and extent mirror the largest catchment in Te-Rua-o-te-Moko Fiordland, measuring 1169 km2 (Table 1). Bathymetric analyses reveal a rugged seafloor, especially at the fjord mouth of Tamatea Dusky Sound, where the channels are punctuated by numerous small islands, subaerial sills, and morphological highs, creating an uneven and intricate topography (Figure 4D).
Te Puaitaha Breaksea Sound is the longest individual fjord in Te Rua-o-te-Moko Fiordland, measuring 45.0 km (Figure 3; Table 1). It is fed by tributaries from Vancouver and Broughton arms, both of which lack delta formations at their heads, evident from seismic data (Figures 1, 2K) (Stanton and Pickard, 1981). Multibeam bathymetry is not available for the sound. However, seismic data reveal a notable morphological high at the head of Vancouver Arm, which feeds into an intermediate basin (Canada Basin, ∼222 mbsl) (Figure 2K). Broughton Arm also hosts an intermediate basin (Wales Basin), which is 1.4 km long. At the junction of the arms, no delta formation could be identified. The main basin (Lee Basin) of Te Puaitaha Breaksea Sound spans 6.03 km and lies at 279 mbsl, leading onto the entrance sill in depths of 97 mbsl (Figure 2K).
Within Tamatea Dusky Sound, the Cook and Bowen channels are separated by Long Island and Cooper Island, with Paget Passage separating the two islands and connecting the channels (Figures 4C,D). At the fjord head, a buried paleodelta (Supper Cove Delta) is identified from seismic data, extending for 1.9 km and rising to a depth of 45 mbsl (Figure 2M). Between the Supper Cove and Girlies Island deltas lies the intermediate River Basin, lying at 167 mbsl (Figure 2M). The submerged Gilbert-style paleodelta is 2.5 km long and 3.4 km wide and is found on the inland side of Girlies Island, being a threshold between the fjord head and the two channels. The northern Bowen Channel hosts the 19 km long main basin (Bowen Basin). This basin is characterised by depths between 273–303 mbsl, maintaining a consistent width of about 1 km (Figure 2L). This is the longest main basin with smooth basin fill observed in Te Rua-o-te-Moko Fiordland (Figure 4). Cook Channel hosts one main basin (Cook Basin), which is 6.4 km long and reaches depths of 312 mbsl. It receives input from the Gilbert-style Fanny Bay Delta, a feature observed also on the southern margin of the channel (Figures 4D, 5G). Further down-channel, a succession of four sills separate multiple small (0.6–2 km) intermediate basins (Figure 4D). The inactive Dusky Fault runs along the length of Cook Channel and connects to the inactive Lake Fraser Fault near the seaward end of the channel (Figure 1). The fjord mouth is notably broader, spanning 8.0 km, and is characterised by an irregular bathymetry shaped by numerous islands of varying scales (Figure 4D). A relatively shallow entrance sill is identified by seismic data at 60 mbsl, facing west-southwest.
The entire complex, and particularly Moana Uta Wet Jacket Arm, is geographically and geologically constrained by the presence of the significant landmass barrier of Resolution Island and Toumoana Five Fingers Peninsula (Figure 4D). These Islands are the southern limit of Te Puaitaha Breaksea Sound and the northern limit of Tamatea Dusky Sound. Structurally, the Five Fingers Fault runs between the central eastern part of the islands and the peninsula to the west (Figures 1, 4D) (Barnes et al., 2005; Seebeck et al., 2024), and is associated with fault scarps, ridges, and depressions that influence local geomorphology (Figure 4D).
4.11 Taiari Chalky Inlet
Taiari Chalky Inlet is characterised by Moana-whenua-pōuri Edwardson and Te Korowhakaunu Kanáris sounds, converging into a single inlet (Figure 1). The combined length is 38.9 km, exhibiting an overall elliptical asymmetric morphology (Figure 3). The catchment area extends over 432 km2 (Table 1). At the head of Moana-whenua-pōuri Edwardson Sound, seismic profiles reveal a buried paleodelta system characterised by oblique prograding foresets (Figure 2N). Similarly, the Te Korowhakaunu Kanáris Sound paleodelta exhibits foresets of comparable lengths (0.6 km) but greater vertical extent, reaching ∼31.5 m. Both deltas are located at depths of ∼54 mbsl (Table 1). The main basin of Taiari Chalky Inlet (Moana Basin) begins in Moana-whenua-pōuri Edwardson Sound and extends seaward for 9.1 km, reaching a maximum depth of 360 mbsl (Supplementary Figure S8). The basin morphology is characterised by smooth sediment infill and is fed by the Western Passage, where sediment lobes have been identified (Table 1; Figure 1; Supplementary Figure S8). At the fjord mouth, the system exits through the Eastern Passage. The Western and Eastern passages trend southwestward, separated by two islands, and share a fjord mouth width of 8.5 km (Supplementary Figure S8). The entrance sill is located at a depth of 49 mbsl and is overlain by sediment deposits. Seaward of the sill, a reef system has developed close to the fjord mouth (Supplementary Figure S8).
4.12 Raktikuma Preservation Inlet System
The Rakituma Preservation Inlet System is the southernmost fjord system and comprises two fjords: Te Awaroa Long Sound, which is located inland and is isolated from the Tasman Sea by Rakituma Preservation Inlet and Isthmus Sound by the Narrow Bend (Figure 1; Supplementary Figure S9). The entire complex is 47.5 km long and is fed by a catchment covering 425 km2 (Table 1; Figure 3). Te Awaroa Long Sound exhibits a narrow, single-channel character, while Rakituma Preservation Inlet is notably more rugged and sinuous. Together, the system exhibits a crescentic asymmetrical shape (Figure 3). At the head of Te Awaroa Long Sound, the inactive Widgeon Fault lies beneath the fjord axis (Figure 1; Supplementary Figure S9). Seismic data also reveal a buried paleodelta at 32 mbsl, characterised by foresets extending 0.6 km in length and reaching 24.8 m in height (Table 1; Figure 2P). Down-fjord of Te Awaroa Long Sound lies Long Basin (Pickrill et al., 1992), a main basin that is 3.9 km long and up to 357 mbsl deep. Smooth basin fill is preserved in the basin and is surrounded by moraines and debris blocks that are deposited along the base of the fjord wall, apparent from multibeam bathymetry and seismic data (Figures 5D,E; Supplementary Figure S9). According to official records (The Marine Guardians of Fiordland and the Department of Conservation), Te Awaroa Long Sound terminates near Narrow Bend, which marks the transition to the more open and complex morphology of Rakituma Preservation Inlet (Figures 1, 2P; Supplementary Figure S9) (Pickrill, 1993). Multibeam bathymetric data reveal a heterogeneous seafloor beyond the sills, lacking a continuous fjord trunk or defined channel. Instead, numerous winding paths weave around subaerial sills and islands that end in coastal embayments or Isthmus Sound (Figure 1) (Pickrill et al., 1992). The entrance sill of the Te Awaroa Long Complex is found at 26 mbsl, marking the second shallowest entrance sill after Te Hāpua Sutherland Sound (Table 1). Seismic profiles show the development of prograding offshore deposits extending towards the Tasman Sea, and sediment waves reaching into the inlet, similar to observations made in other fjords in Te Rua-o-te-Moko Fiordland, such as Hinenui Nancy Sound (Figure 5I; Supplementary Figure S9), and similar to observations made by Pickrill (1987) and Pickrill et al. (1992).
5 Discussion
5.1 Spatial and lateral extent of fjords in Te Rua-o-te-Moko Fiordland: Northern vs. Southern trends
The general development of fjords is well established and attributed to former glacial processes, which resulted in carved out and overdeepened basins, that have subsequently been filled with glacial, lacustrine, terrestrial and ultimately marine sediments following inundation caused by post-glacial sea level rise (Stanton and Pickard, 1981; Syvitski et al., 1987; Pickrill et al., 1992; Pickrill, 1993; Anderson and Mackintosh, 2006; Howe et al., 2010; Hogan et al., 2020). While the presence of overdeepened basins, sills, and deltas has been previously identified in individual fjords in Te Rua-o-te-Moko Fiordland (Irwin et al., 1978; Stanton and Pickard, 1981; Augustinus, 1992; Dykstra, 2012; Barnes et al., 2016b; Barnes et al., 2016a), this study comprehensively shows the complexity and spatial variability of fjord geomorphology across the region (Table 1; Figures 2, 3). Furthermore, this study reveals distinct trends in the spatial and lateral extent of the fjords, which become apparent from the results, allowing for a division into northern- and southern regions (Table 1; Figures 3, 6). The northern fjords, extending from Piopiotahi Milford Sound to Hinenui Nancy Sound, are relatively short (21.1–25.8 km; Table 1; Figure 6) and exhibit simple single-channel morphologies with lower sinuosity values, reflecting linear glacier carving (Table 1; Figure 3). In contrast, the southern fjords, beginning with Pātea Doubtful Sound Complex and extending to the southernmost Rakituma Preservation Inlet Complex, are between 14.8–45.0 km long (Table 1; Figure 3). These fjords exhibit more pronounced geomorphological complexities linked to lithology variations and larger fault systems (Figure 1), often displaying multiple branching arms and tributaries, as well as deeper and larger basins (Table 1; Figure 6). The northernmost fjords intersect major lithological boundaries and major basement faults, including the inactive Pembroke Fault and active Alpine Fault, at a high angle (Figure 1). Consequently, these structures do not exert primary control on fjord orientation but instead act as structural limits, with the northernmost fjord terminating at the intersection with the Alpine Fault close to the fjord mouth. In contrast, the southern fjords exhibit close alignment and, in some cases, direct spatial correlation to both bedrock lithological contact and basement faults. These include the inactive Wilmot, Dusky, Lake Fraser, and Widgeon faults, which project into Pātea Doubtful, Tamatea Dusky, and Te Awaroa Long sounds, respectively (Figures 1, 4D; Supplementary Figures S7, S9). This suggests that basement structure and lithology in the southern region exert a stronger influence on fjord orientation, as glacial erosion likely followed pre-existing bedrock weaknesses associated with faults and lithologic contacts (Figure 1) (Glasser and Ghiglione, 2009). In addition, the observed submarine landforms, including wider fjord mouths and overdeepened basins in the southern region, reflect a geomorphic imprint influenced by bedrock with lower resistance to glacial erosion (Figure 1) (Bernard et al., 2021). Another significant attribute is the catchment area, which increases from the northern to the southern fjords and exhibits a positive correlation with fjord length, depth and width (Table 1; Figures 3, 6). The observed flow patterns align with the general concept that drainage follows the steep fjord walls, ultimately converging into the main fjord trunks (Figures 3, 4A). The steepness of fjord walls decreases from north to south, corresponding to an overall reduction in catchment topography across Te Rua-o-te-Moko Fiordland. In the northern fjords, such as Piopiotahi Milford Sound, maximum elevations exceed 2,700 m (Dykstra, 2012), and there is a sharp transition from steep terrain to the adjacent continental shelf. In contrast, the southern fjords are characterised by lower relief, with maximum elevation reaching ∼1340 m, and a more gradual transition onto a broader continental shelf (Figure 1). Despite these differences in absolute elevation, the vertical topographic relief from the adjacent fjord walls to the seafloor of the main basins remains relatively consistent throughout the region, averaging ∼1069 m (Table 1). Notably, a greater proportion of this vertical relief is submerged in the southern fjords. The southward decrease in topographic gradient, combined with increased fjord geometry complexity, reduced gravitational runoff velocities, and lower glacier driving stress, likely contributed to changes in glacier retreat behaviour. In the southern fjords, valley-bound glaciers were more likely to converge into the main fjord trunks and retreat along multiple pathways, guided by subaerial sills and tributary arms.
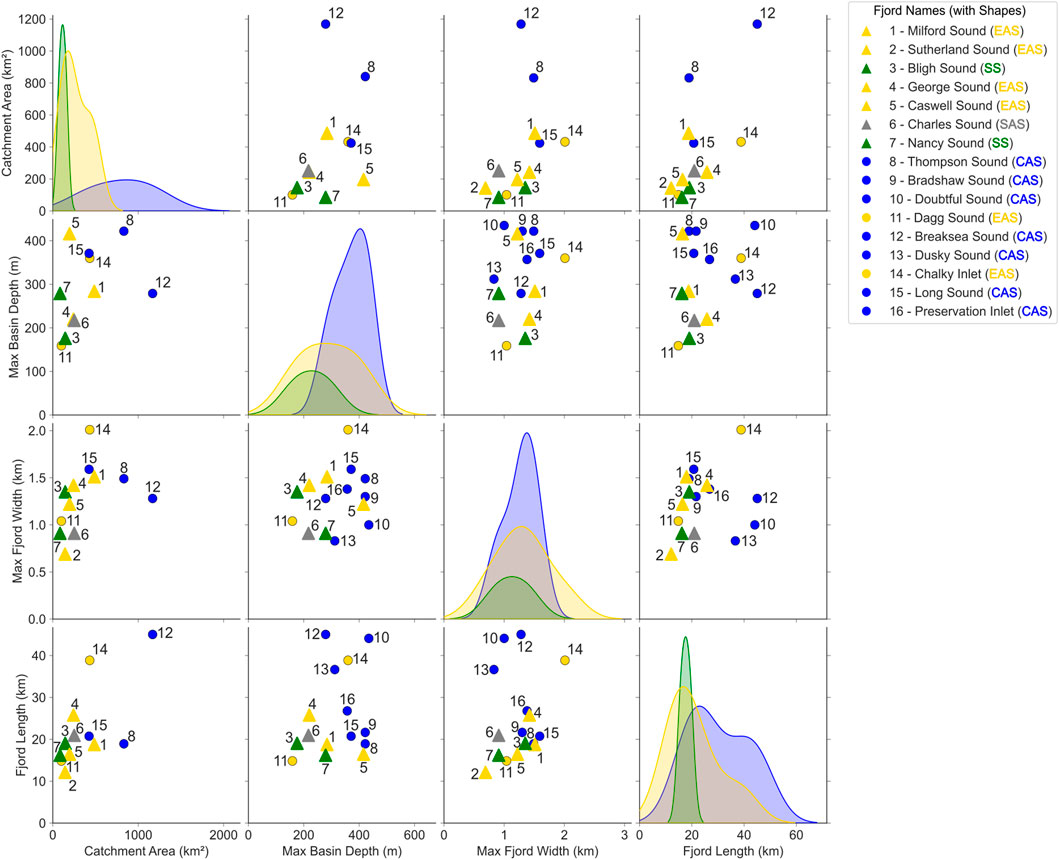
Figure 6. Pairplot scatter illustrating correlations among key geomorphic parameters across 16 fjords in Te Rua-o-te-Moko Fiordland, Aotearoa New Zealand. The variables include catchment area (km2), maximum basin depth (m), maximum fjord width (km), and fjord length (km). Northern fjords are displayed with a triangle, while southern fjords are represented by a dot, labeled by number (1-16) and color-coded by fjord shape classification: Elliptical/Rectangular Asymmetric (EAS, yellow); Sinuous Symmetrical (SS, green); Crescentic Asymmetrical (CAS, blue; Sinuous Asymmetrical (SAS, gray) (e.g., Figure 3). Diagonal panels show kernel density estimates (KDE) for each variable by shape class.
5.2 Distribution of sills and thresholds in temperate Te Rua-o-te-Moko Fiordland
Entrance sills have been identified in all fjords for which bathymetric and seismic data were available. They are typically located near fjord mouths (Figures 5A,B), apart from Piopiotahi Milford Sound, where the outermost sill and moraine are positioned further offshore at the continental shelf break (Dykstra, 2012). Entrance sills typically mark the margins of former glacial extents and serve as thresholds for ice-proximal depositional systems. Their location near the fjord mouths is consistent with the patterns observed in the fjords of Greenland, Norway, and Patagonia (Benn and Evans, 2014; Åkesson et al., 2018). Consequently, fjord mouth width plays a critical role in controlling the response of marine-terminating glaciers to external forcing, with wider fjords experiencing greater exposure and increased vulnerability to climate warming (Briner et al., 2009; Benn and Evans, 2014). In general, the measured fjord mouth width increases towards the south and exceeds 4 km in width (Table 1; Figure 6). This trend is associated with progressively shallower entrance sills that are positioned farther landward within the fjords (Table 1; Figures 5F,I), which may indicate that glaciers in these locations may not have extended to sea level during the Last Glacial Maximum, which was approximately 120 m below present sea level (Pickrill et al., 1992). As a result of wider fjord mouths, the glaciers in the southern area may have been more susceptible to ice retreat. Additionally, the combination of increasing fjord width and decreasing sill depth could have enhanced buoyancy and eventually led to floatation of the glacier ice where tide water is reached, further influenced by flow divergence due to open topography (Shoemaker, 1986; Benn and Evans, 2014). Complementing the observed submerged sills, numerous subaerial sills, often appearing as islands, have been identified in Te Rua-o-te-Moko Fiordland (Figures 4A,D). These landforms are more prevalent in the southern fjords, reflecting a pattern of erosion intensity inherited from preglacial fluvial networks and ultimately altered by glacial overprint and uplift (Bishop, 1985; Benn and Evans, 2014). The formation of subaerial sills depends on the erosional susceptibility of the regional bedrock, with lithological differences in the south potentially contributing to their increased occurrence, especially south of Tamatea Dusky Sound, which with the presence of the Dusky Fault marks a change in lithological bedrock (Figure 1) (Syvitski and Shaw, 1995; Turnbull et al., 2010). Isostatic rebound typically causes sills to become very shallow, a trend documented in Norwegian fjords (Syvitski et al., 1987; Benn and Evans, 2014). However, in Te Rua-o-te-Moko Fiordland, isostatic rebound is masked by tectonic uplift (Bishop, 1985; Pickrill et al., 1992). Studies from Svalbard, particularly in Billefjorden, indicate that deglaciation was characterised by multiple short-lived stillstands and minor readvances, as evidenced by closely spaced assemblages of small moraines (Baeten et al., 2010; Forwick et al., 2010). In contrast, the absence of similar moraine sequences in our study area, combined with the greater spacing between more prominent ridges, suggests that deglaciation in Te Rua-o-te-Moko Fiordland likely proceeded through fewer, more substantial retreat phases. Supported by the relatively narrow width of the fjords, accommodation space is limited (Glasby, 1978; Irwin et al., 1978), and instead individual moraines are dominant features within the fjords, indicating temporal halts or punctuations of retreating ice fronts (Figures 4, 5A,C). The widespread occurrence of sills demonstrates their importance as geomorphic markers and represents key targets for future analysis that will refine the stratigraphic framework of the fjords of Te Rua-o-te-Moko Fiordland.
5.3 Fjord basin configurations in Te Rua-o-te-Moko Fiordland
Each fjord in Te Rua-o-te-Moko Fiordland has always one main basin but shows differing numbers of intermediate basins throughout the area (Figures 2A–P; Table 1). These main basins also exhibit the most significant sediment infill (Figures 2, 5), preserving lacustrine and marine Quaternary deposits (Dykstra, 2012; Barnes et al., 2016a). Main basins are generally located where the fjord is widest, formed by glacial erosion during both glacier advances and retreats (Glasby, 1978; MacGregor et al., 2000; Åkesson et al., 2018). Initial glacial advances in Te Rua-o-te-Moko Fiordland are thought to have eroded into a pre-existing fluvial landscape during the Late Tertiary (Augustinus, 1992), with subsequent glacier discharge further modifying topography and producing the overdeepened basins. Augustinus (1992) demonstrated that fjord trough erosion increases proportionately to the glacier discharge volume, leading to the deepening, widening, and elongation of fjords as they adjust to glacier thinning. Furthermore, fjord length is constrained by tectonics (Augustinus, 1992), as evident in the northern fjords, which are shorter, more linear, and situated closer to the Alpine Fault and thus the plate boundary. This reflects a limited distance between the coastline and the main topographic divide in the northern region. The Alpine Fault intersects the northernmost fjord, Piopiotahi Milford Sound, at the fjord mouth and makes this fjord proximal to the plate boundary (Figure 1). Apart from Piopiotahi Milford Sound, the northern fjords have the smallest observed catchment areas (<255 km2; Table 1; Figure 6). This geomorphologic evidence suggests a continuous retreat but higher glacier flux to the grounding line driven by the higher topographic gradient (Table 1) (Augustinus, 1992; Åkesson et al., 2018). A distinct difference in main basin depths is observed, with the northern fjords generally featuring shallower main basins (<300 mbsl), except for Taitetimu Caswell Sound (Table 1; Figure 6). In contrast, southern fjords exhibit deeper main basins (>300 mbsl), except for Te Rā Dagg Sound (Table 1; Figure 6). However, in all examined northern fjords, at least one threshold (sill) has been identified, indicating either intermittent still-stands during retreat and with that a local reduction of glacial erosion, or subsequent re-advance (Shoemaker, 1986; Dowdeswell et al., 2016c). Some of these bedrock sills, which separate basins, are likely to outlast several glaciations and are, therefore, a multi-cycle net integral of ice discharge and erosion capacity (Shoemaker, 1986; Augustinus, 1992). All fjords in the northern parts contain multiple basins (2–3; Table 1), with a tendency for the main basin to be located closer to the seaward end of the fjord. Only Piopiotahi Milford and Hāwea Bligh sounds deviate from this pattern, with their main basins positioned more centrally within the fjords. This may reflect prolonged ice residence time in the inland portions of these catchments. The northernmost fjords were likely amongst the last to experience deglaciation, and Piopiotahi Milford Sound still hosts cirque glaciers in its upper catchment (Turnbull et al., 2010). The seaward position of the main basins in the other northern fjords may be attributed to intensified glacial erosion during deglaciation. Ice streaming and higher ice velocities, resulting from ice thinning, likely enhanced basal erosion and led to the formation of overdeepened basins close to the entrance sills (Hogan et al., 2020).
The longest fjords (Pātea Doubtful, Te Puaitaha Breaksea, and Tamatea Dusky sounds) are situated in the southern part of Te Rua-o-te-Moko Fiordland (Figures 1, 3). Although these fjords share similar bedrock lithologies with their northern counterpart (gneiss, granite, and diorite; Figure 1), they are less limited by the Alpine Fault. Instead, their morphologies and orientations are controlled by the inactive Wilmot Fault in Pātea Doubtful Sound, and the inactive Dusky and Lake Fraser Fault in Tamatea Dusky Sound and have large (>310 km2) catchment areas, thus a bigger glacier discharge contributing area (Figure 6). In addition, most fjords of the southern region feature multiple basins (>2), with single-basin systems, such as Te Awaroa Long or Kaikiekie Bradshaw sounds, representing exceptions (Table 1). Both fjords are distinct in forming the landward continuation of another sound and are part of a fjord complex. This configuration may indicate gradual and continuous glacial retreat through these fjords, without halts (Table 1; Figures 1, 3). Two of the southernmost fjords (Taiari Chalky and Rakituma Preservation to inlets) exhibit the greatest average widths (<1.6 km; Table 1) and largest catchment areas (<400 km2) while maintaining comparable main basin depths (360–370 mbsl; Table 1; Figure 6). Notably, most main basins identified in the southern fjords are situated in the central part of the fjord, suggesting either that maximum ice extent was less extensive compared to the northern fjords, or that ice persisted longer within the complex network of reaches, bends and tributary arms (Figures 4; Supplementary Figures S2–S9). This prolonged ice residence may be linked to the more intricate fjord geometries and the larger contributing catchments observed in the southern fjords (Table 1).
In addition to these morphological and catchment differences, the greater distance of the southern fjords from the Alpine Fault suggests that their morphology and glacial extent were structurally less constrained regarding lateral extent. Instead, the southern fjords exhibit a strong correlation between structural geological lineaments and fjord orientation (Figure 1). These structures likely served as zones of structural guidance, facilitating glacial erosion and enabling the development of relatively wide fjords during ice discharge. Comparable influences of structural control on fjord orientation and ice discharge patterns have been documented in the Patagonian and Fuegian Andes (Glasser and Ghiglione, 2009). Lithological influences are also apparent, with fjords eroded into less resistant bedrock, such as sedimentary rocks, generally exhibiting greater widths (Bernard et al., 2021). Therefore, bedrock lithology and tectonic lineaments exert primary control on the width and depth of the basins identified in southern fjords. However, this does not account for the north-south gradient in basin-depth. Two potential factors may explain this longitudinal gradient. First, the higher topographic elevations observed in the north may reflect a more pronounced pre-fjord landscape that predates the formation of the fjords. In this scenario, ice would have had to traverse greater vertical gradients, resulting in stronger gravitational forces, higher flow velocities, and increased erosion (MacGregor et al., 2000; Benn and Evans, 2014). However, measuring the total vertical extent of the fjords, from peak to pit (Table 1), reveals similar overall paleo-relief. Instead, the overdeepened basins in the southern fjords may have resulted from glacier bed lowering during progressive erosion, leading to a decline in ice-surface elevation and a less positive mass balance (MacGregor et al., 2000). Additionally, the increasing prominence of tributary junctions toward the south could have contributed to greater ice discharge, further deepening the main basins (Benn and Evans, 2014). Previous modelling suggests that decreasing temperatures are necessary for developing overdeepened basins (Oerlemans, 1984; MacGregor et al., 2000). Thus, colder conditions in the southern region of Te Rua-o-te-Moko Fiordland or subtle climatic differences may have influenced this pattern.
Both main and intermediate basins are associated with sills, where glaciers temporarily halted for thinning of ice mass, which allowed for the deposition of moraines. The smooth acoustic stratification of basin fills in fjords was introduced by active glacial processes primarily controlled by meltwater plumes that deposited coarser material closer to the grounding zone and fine material suspended near the more distal parts of the fjords (Batchelor et al., 2018). This deposition intercalates with small-scale mass wasting, contributing to the formation of a smooth basin fill (Forwick and Vorren, 2010). While high sedimentation rates in temperate fjords lead to the burial of relict glacial landforms, they also result in stratified depositional configurations and, thus, continue the smooth basin fill that can be observed in all the basins in Te Rua-o-te-Moko Fiordland (Figures 5D,E; Supplementary Figure S2–S9) (Elverhøi et al., 1983). Future research will focus on verifying these deposits through detailed thickness mapping of sedimentary sequences within the fjords.
5.4 Buried paleodeltas and submerged Gilbert-style deltas in Te Rua-o-te-Moko Fiordland
Submerged and buried paleodeltas are present at the heads of almost all fjords in Te Rua-o-te-Moko Fiordland and indicate periods of enhanced sediment deposition by riverine discharge in the past that favoured delta formations before being submerged and buried by rising sea levels (Figure 5H) (Syvitski et al., 1987). The submerged and buried paleodeltas at fjord heads likely formed from proglacial or glaciofluvial discharge, sustained by a continuous sediment supply sufficient for delta development. Larger catchments typically contribute greater volumes of sediment to the fjords, thereby influencing the size and development of associated deltas at the fjord heads (Stanton and Pickard, 1981). At present, nearly all fjord heads receive input from rivers sourced from lakes or the greater catchment area, delivering terrestrial sediment to the fjords. Since all paleodeltas at the fjord heads identified in this study are buried or lie well beyond current sea level (Barnes et al., 2016b), they are considered abandoned and relict. A likely mechanism that inhibited further delta growth is a shift in discharge pattern. Following sea level rise after the Last Glacial Maximum (<18–20 ka), the fjords were progressively inundated by the Tasman Sea, transitioning gradually from a lacustrine to a marine system, and with that, a quasi-contemporaneous transition from proglacial to non-glacial (<14 ka; Barnes et al., 2016b; Cattaneo and Steel, 2003). With a shift of the SHWW during that time, colder temperatures and increased precipitation, along with more frequent and intense storms, must have prevailed (Gomez et al., 2004; Hinojosa et al., 2017; Hinojosa et al., 2014; Ummenhofer and England, 2007). Rather than facilitating delta progradation, these conditions likely contributed to net sediment loss at the delta fronts through enhanced discharge and bypassing towards the fjord basins. Similar observations of sediment bypassing associated with increased discharge have been documented on a larger scale in the Ganges-Brahmaputra delta system in India (Raff et al., 2023). The absence of topsets in some deltas could support this interpretation, suggesting they either failed to develop, collapsed or were eroded due to intensified riverine fluxes linked to climate shifts. Additionally, seismic activity during or after delta formation resulted in delta slope collapses and mass wasting deposits on the relict topsets (Barnes et al., 2016b). Following these events and possibly occurring at the same time, reforestation likely led to a reduction of sediment supply to the fjord heads (Pickrill et al., 1992; Barnes et al., 2016b). At present, new deltaic systems are developing, exhibiting a retrogradational pattern and forming closer to the modern fjord head sources, beyond the resolution of the seismic data used in this study, but visible from satellite imagery.
Buried paleodeltas found at arm junctions or channel intersections, such as the submerged Girlies Island paleodelta in Tamatea Dusky Sound (Figure 4D) and the submerged Deep Cove paleodelta in Pātea Doubtful Sound, were likely proglacial in origin. These deltas reflect periods of glacier stillstand, during which sustained paleoglacial sediment discharge contributed to the development of foresets. In most cases, these paleodeltas are in water depths shallower than the entrance sill, making them susceptible to burial beneath marine deposits (Syvitski et al., 1987). If the now-submerged delta lies above the entrance sill depth, it suggests that delta progradation continued in a marine setting, regardless of whether ice remained present upstream (Table 1). However, these deltas do not show signs of eroded topsets. This is consistent with their location further down-fjord, sheltered from riverine discharge and marine erosion. At least four submerged Gilbert-style paleodeltas have been identified in Hinenui Nancy, Kaikiekie Bradshaw, Te Rā Dagg, and Tamatea Dusky sounds, with one located in the northern fjords and the remaining three in the south (Figures 2, 3). These deltas exhibit well-defined bottomsets, foresets, and topsets, along with exposed delta brinks, indicating no significant burial, partly attributable to their locations. The submerged Gilbert-style delta in Hinenui Nancy Sound is the only observed delta at a fjord head that is not overlain by younger deposits (Figures 1, 3). As it is not situated near a major riverine outlet, it is a relict feature, fed by glacier discharge and abandoned after complete retreat. Similarly, the Gilbert-style delta found in Te Rā Dagg Sound marks a retreat threshold at the confluence of the fjord arms. Since the southern arm is nearly connected to Pātea Doubtful Sound’s Crooked Arm, this delta and the arm is not connected to a riverine outflow and only receives minimal terrestrial input, preventing significant burial. As a result, it can also be classified as relict. The Gilbert-style delta in Kaikiekie Bradshaw Sound (Gaer Arm) has previously been described as relict (Barnes et al., 2016b), resulting from deglaciation and reforestation, leading to a reduction in riverine clastic sediment supply (Pickrill et al., 1992; Barnes et al., 2016b). The development of Fanny Bay Delta in Tamatea Dusky Sound should be similar (Figure 4D).
5.5 Implications for ice extent and retreat
Variations in bedrock and the occurrence of structural zones of weakness influenced the intensity of glacial erosion, shaping the glacial landforms described above. These differences may also reflect variations in glacier dynamics and the timing of glacial advance and retreat. The distribution and morphology of glacially derived geomorphological features provide valuable evidence for reconstructing past ice behaviour and flow regimes (Dowdeswell et al., 2016b). The maximum extent of glacier advance during the Quaternary was proposed by Barrell (2011), these interpretations are primarily based on the distribution of onshore moraines. The identification of entrance sills, referred to in some studies as terminal moraines, at the mouth of each fjord (Dowdeswell et al., 2016b) now allows for a better understanding of glacier retreat dynamics. Accordingly, entrance sills are positioned progressively farther landward along a north–south gradient. This trend, in combination with the increasing distance from the plate boundary, which acts as a tectonic constraint on glacial advance, could suggest that glaciers extended farther seaward toward the south. However, variations in bedrock lithology, combined with increasing fjord width, likely made southern glaciers more susceptible to melting. These factors may have limited the southern extent of glacier advance despite the reduced structural confinement.
Additionally, streamlined landforms, which typically develop parallel to the ice stream and serve as evidence for fast-flowing ice, with rates as high as several km per year, as observed in Norwegian or Antarctic fjords (Dowdeswell et al., 2016b; Batchelor et al., 2018; Mangerud et al., 2019), are absent in Te Rua-o-te-Moko Fiordland. Instead, numerous transverse submarine features, like submarine retreat ridges, sills, or moraines, indicate a retreat that was either shaped by stillstands that lasted long enough to build up proglacial deltas, or these features are glacimarine relicts of the numerous advances that occurred during the Quaternary (Figures 4, 5) (Ottesen et al., 2008; Batchelor et al., 2018). To enable more precise and quantitative reconstructions of glacier retreat dynamics, including the timing of stillstands and potential readvances, chronological frameworks still need to be established. While retreats in Te Rua-o-te-Moko Fiordland are irreversible (Augustinus, 1992), the retreat considered here is not considered rapid. Recessional moraines, prominently observed in the Cook Channel of Tamatea Dusky Sound (Figure 4D), can develop through a combination of processes, including sediment deformation and meltwater deposition, as documented in high-latitude fjords in both hemispheres, namely Norway, Svalbard, and Antarctica (Ottesen et al., 2007), or due to more frequent ice halts. In contrast, Bowen Channel displays one large basin that indicates gradual and continuous ice retreat, indicating a different retreat dynamic for the two channels (Figure 4D). Te Rua-o-te-Moko Fiordland is deglaciated, and no new glaciomarine landforms are emerging. Therefore, marine processes, such as tidal currents and waves, prevail and are sufficient in triggering mass transport deposits and sediment waves close to the entrance sills and into the fjords (Figure 5I). Combined with increased river discharge due to elevated precipitation (Hinojosa et al., 2017; Knudson et al., 2011), these processes contribute to the burial of glacial deltas and entrance sills, which are often found overlain by younger marine-influenced deposits (Figures 2, 5I) (Elverhøi et al., 1983; Batchelor et al., 2018). These findings suggest substantial post-depositional modifications, supported by modern sedimentation rates estimated to be between 0.09–0.38 cm yr-1 in the fjord basins (Hinojosa et al., 2014). Therefore, the proposed fjord formation process for Te Rua-o-te-Moko Fiordland involves ice-pushing of sediment during brief stillstands or re-advances of the grounded ice margin, initiated during a phase of gradual retreat beginning in the Pleistocene (<60 ka), followed by multiple subsequent re-advances (Ottesen and Dowdeswell, 2009; Dykstra, 2012; Batchelor et al., 2018). Ages for the individual glaciomarine landforms are yet to be determined. Evidence of extensive reworking and overprinting by multiple glacial advances and retreats during the Pleistocene is apparent across Te Waipounamu South Island (Suggate and Almond, 2005; Barrell, 2011; Shulmeister et al., 2019). Most of the glaciomarine features identified in this study (Figures 2, 5) likely formed, or were subsequently modified, during or after the most recent major advance. These features reflect processes associated with ice retreat following the onset of deglaciation around 18 kyr and have been overprinted and partially reworked landforms such as overdeepened basins and bedrock sills that are attributed to older glaciations (Shulmeister et al., 2019).
The data indicate a southward shift in glacial erosion dynamics, as reflected by variations in entrance sill depth, fjord mouth width, fjord length, overdeepened basin depth and position, and overall topographic elevation. These patterns are closely associated with changes in bedrock geology, the presence of basement faults and the reduction of plate boundary constraints (Figure 6). The observed geomorphological patterns highlight the dynamic interplay of glacial retreat dynamics, erosion rates, bedrock composition, basement faults, plate boundaries, tectonic uplift, erosion, and sea-level changes in shaping the fjords of Te Rua-o-te-Moko (Turnbull et al., 2010; Barrell, 2011; Barnes et al., 2013; Heron, 2023).
6 Conclusion
This study presents a comprehensive geomorphological overview and assessment of the fjords of Te Rua-o-te-Moko Fiordland, revealing distinct trends that subdivide the region into northern and southern fjord sections. The observed differences in fjord length, fjord mouth width, sinuosity, and basin morphology indicate varying glacial erosion dynamics, catchment influences, sediment deposition, and basement geology. The northern fjords are characterised by shorter, single-channel fjords with higher topography and steeper fjord walls, while the southern fjords feature more complex geometries, extensive branching, lower topographic relief, and close alignment with the inactive basement faults. These spatial variations suggest a southward gradient in glacier dynamics in response to the regional tectonic and lithological controls, as reflected in the morphology and distribution of basins, sills, and deltas. In the north, intersecting tectonic constraints have resulted in shorter, narrower fjords with shallower main basins, while in the southern fjords, lithological controls have facilitated the orientation and the development of wider, deeper basins. Fjords in the central region, such as Pātea Doubtful Sound and Tamatea Dusky Sound, represent a transitional configuration, with long fjord systems and overdeepened basins that predominantly align with the Wilmot and Dusky faults, respectively.
One observation of this study is the widespread occurrence of entrance sills, which consistently mark the maximum glacial extent and are located near fjord mouths. Notably, entrance sills and inner thresholds also pick up a north-south gradient, with wider fjord mouths and shallower entrance sills observed in the southern fjords. Assuming that ice reached the modern positions of these entrance sills, this pattern suggests that the southern fjords were more susceptible to melting and influenced by buoyancy effects. The greater width of the southern fjords likely facilitated ice flotation and divergence, contributing to differences in retreat dynamics compared to the more constrained northern fjords. It is further suggested that ice must have collapsed relatively rapidly through the wider basins and subsequently become temporarily grounded or stabilised within narrower sections or reaches between the main trunks. In addition, the increased prevalence of subaerial sills and isolated moraines in the south highlights the complex interplay between glacial processes, tectonic uplift, postglacial sea-level changes and marine coastal sediment supply that contribute to submarine barrier formation. The distribution of main basins reflects a pronounced southward trend, with the longest and deepest sections of the fjords typically located in their central reaches. This spatial pattern may indicate that glacial extent in the southern fjords was less extensive, or that ice persisted longer due to their more complex geometries. Overall, the main basins preserve sediment infill from syn-glacial and post-glacial periods during the Quaternary, highlighting their significance as long-term archives of glacial erosion and postglacial sedimentation. A clear north-to-south gradient in basin depth is evident, potentially driven by variations in ice mass balance, tributary glacier input, and regional climatic differences. An advancement on previous studies is the documentation of the widespread occurrence of buried paleodeltas at fjord heads, indicating past proglacial, periglacial, or riverine discharge. Their burial and submerged nature suggest a shift in depositional regimes influenced by Holocene sea-level rise and subsequent marine transgression, deglaciation, and reforestation, which altered sediment supply from catchment areas. However, it remains uncertain when these paleodeltas became abandoned. The presence of unburied submerged Gilbert-style paleodeltas, found at fjord arm junctions in the southern fjords, suggests they are proglacial relicts formed during deglaciation. In contrast, similar features at some fjord heads are not connected to active riverine or lacustrine inputs, indicating that sediment supply ceased following ice retreat, leaving the deltas unburied. The origin, timing, and postglacial evolution of these features will be the subject of future investigations.
By integrating seismic and geomorphological analyses, this study advances the understanding of the glacial history and postglacial evolution of Te Rua-o-te-Moko Fiordland. The findings emphasise the importance of regional geological controls, ice dynamics, and environmental conditions in shaping the modern fjord landscape. Future research should target refining the seismostratigraphy of Te Rua-o-te-Moko Fiordland to establish a more precise chronology of glacial retreat and marine inundation, contributing to a broader understanding of Southern Hemisphere climate variability.
Data availability statement
The datasets presented in this study can be found in online repositories. The names of the repository/repositories and accession number(s) can be found below: https://zenodo.org/records/15292794; https://zenodo.org/records/15292985.
Author contributions
EU: Conceptualization, Data curation, Formal Analysis, Investigation, Methodology, Software, Validation, Visualization, Writing – original draft, Writing – review and editing. AG: Conceptualization, Funding acquisition, Project administration, Resources, Supervision, Writing – review and editing. PB: Data curation, Validation, Writing – review and editing. CM: Funding acquisition, Project administration, Supervision, Writing – review and editing. HB: Software, Writing – review and editing. GW: Project administration, Writing – review and editing. MF: Validation, Writing – review and editing. JH: Conceptualization, Supervision, Writing – review and editing.
Funding
The author(s) declare that financial support was received for the research and/or publication of this article. EU receives a Doctoral Scholarship from the University of Otago, providing funding for this research. The research cruises were partly funded by the New Zealand Hīkina Whatutuki MBIE Endeavor Fund Programme: Natural carbon sequestration in our southern fjords–a pathway towards carbon neutrality (contract UOOX2101). PB and JIT are funded by NIWA Strategic Science Investment Fund (contract OCPR2501).
Acknowledgements
We thank the crew, the scientific participants, and Christina Riesselman for their support and assistance during the research voyages aboard R/V Polaris II (13PL018, 21PL0415, 22TU0627, 22PL1028, 23PL0515, and 23PL1101), helping in the acquisition of the seismic data presented in this study. The authors also want to thank the crew of the BreakSea Girl for their support and patience while collecting boomer seismic data. In addition, we also thank the BLAKE Explorers, Inspire Teachers, and the Team of BLAKE Expeditions for helping with the acquisition during cruises 23PL0515 and 24BG0604. We gratefully acknowledge the crew and science participants of R/V Sonne SO309, for their contribution in acquiring new bathymetry for Dusky and Doubtful sounds. The National Institute of Water and Atmospheric Research (NIWA) and Land Information New Zealand (LINZ) kindly provided the bathymetry data shown in this study. Seismic processing was carried out using an academic license for GLOBE Claritas, and seismic interpretation and analysis were conducted using an academic license for IHS Kingdom Suite. We are grateful to the reviewers and the editor for their constructive comments and careful handling of the manuscript, which helped improve its clarity and quality.
Conflict of interest
The authors declare that the research was conducted in the absence of any commercial or financial relationships that could be construed as a potential conflict of interest.
Generative AI statement
The author(s) declare that Generative AI was used in the creation of this manuscript. Artificial intelligence tools (ChatGPT) were used exclusively for grammar checking and minor language polishing during the preparation of this manuscript. No AI tools were employed for data analysis, interpretation, or drawing scientific conclusions.
Any alternative text (alt text) provided alongside figures in this article has been generated by Frontiers with the support of artificial intelligence and reasonable efforts have been made to ensure accuracy, including review by the authors wherever possible. If you identify any issues, please contact us.
Publisher’s note
All claims expressed in this article are solely those of the authors and do not necessarily represent those of their affiliated organizations, or those of the publisher, the editors and the reviewers. Any product that may be evaluated in this article, or claim that may be made by its manufacturer, is not guaranteed or endorsed by the publisher.
Supplementary material
The Supplementary Material for this article can be found online at: https://www.frontiersin.org/articles/10.3389/feart.2025.1620747/full#supplementary-material
References
Åkesson, H., Nisancioglu, K. H., and Nick, F. M. (2018). Impact of fjord geometry on grounding line stability. Front. Earth Sci. 6, 71. doi:10.3389/feart.2018.00071
Allibone, A. H., Jongens, R., Turnbull, I. M., Milan, L. A., Daczko, N. R., DePaoli, M. C., et al. (2009). Plutonic rocks of Western fiordland, New Zealand: field relations, geochemistry, correlation, and nomenclature. N. Z. J. Geol. Geophys. 52, 379–415. doi:10.1080/00288306.2009.9518465
Alloway, B. V., Lowe, D. J., Barrell, D. J. A., Newnham, R. M., Almond, P. C., Augustinus, P. C., et al. (2007). Towards a climate event stratigraphy for New Zealand over the past 30 000 years (NZ-INTIMATE project). J. Quat. Sci. 22, 9–35. doi:10.1002/jqs.1079
Anderson, B., and Mackintosh, A. (2006). Temperature change is the major driver of late-glacial and Holocene glacier fluctuations in New Zealand. Geology 34, 121–124. doi:10.1130/G22151.1
Augustinus, P. C. (1992). Outlet glacier trough size-drainage area relationships, fiordland, New Zealand. Geomorphology 4, 347–361. doi:10.1016/0169-555X(92)90028-M
Baeten, N. J., Forwick, M., Vogt, C., and Vorren, T. O. (2010). “Late Weichselian and Holocene sedimentary environments and glacial activity in billefjorden, Svalbard,”, 344. London, Special Publications: Geological Society, 207–223. doi:10.1144/SP344.15
Barnes, P. M. (2009). Postglacial (after 20 ka) dextral slip rate of the offshore alpine fault, New Zealand. Geology 37, 3–6. doi:10.1130/g24764a.1
Barnes, P. M., Sutherland, R., and Delteil, J. (2005). Strike-slip structure and sedimentary basins of the southern alpine fault, fiordland, New Zealand. Geol. Soc. Am. Bull. 117, 411–435. doi:10.1130/b25458.1
Barnes, P. M., Bostock, H. C., Neil, H. L., Strachan, L. J., and Gosling, M. (2013). A 2300-Year paleoearthquake record of the southern alpine fault and fiordland subduction zone, New Zealand, based on stacked turbidites. Bull. Seismol. Soc. Am. 103, 2424–2446. doi:10.1785/0120120314
Barnes, P. M., Pickrill, R. A., and Bostock, H. C. (2016a). Thompson and bradshaw sounds, fiordland, New Zealand: a relict, mid-latitude, temperate glacier system. Geol. Soc. Lond. Memoirs 46, 45–46. doi:10.1144/m46.45
Barnes, P. M., Pickrill, R. A., Bostock, H. C., Dlabola, E. K., Gorman, A. R., and Wilson, G. S. (2016b). Relict proglacial deltas in bradshaw and george sounds, fiordland, New Zealand. Geol. Soc. Lond. Memoirs 46, 91–92. doi:10.1144/m46.59
Barrell, D. J. A. (2011). “Chapter 75 - quaternary glaciers of New Zealand,” in Developments in Quaternary sciences. Editors J. Ehlers, P. L. Gibbard, and P. D. Hughes (Elsevier), 1047–1064. doi:10.1016/B978-0-444-53447-7.00075-1
Batchelor, C. L., Dowdeswell, J. A., and Ottesen, D. (2018). “Submarine glacial landforms,” in Submarine geomorphology. Editors A. Micallef, S. Krastel, and A. Savini (Cham: Springer International Publishing), 207–234. doi:10.1007/978-3-319-57852-1_12
Beattie, H. (1949). The maoris and fiordland. Dunedin: Otago Daily Times and Whitness Newspaper Ltd.
Benn, D., and Evans, D. J. A. (2014). Glaciers and glaciation, 2nd edition. London: Routledge. doi:10.4324/9780203785010
Bennett, R., MacLean, B., Blasco, S., and Clarke, J. E. H. (2016). Glacial lineations in navy board inlet, Nunavut, Canada. Geol. Soc. Lond. Memoirs 46, 49–50. doi:10.1144/m46.56
Bernard, M., Steer, P., Gallagher, K., and Egholm, D. L. (2021). The impact of lithology on fjord morphology. Geophys. Res. Lett. 48, e2021GL093101. doi:10.1029/2021GL093101
Bianchi, T. S., Arndt, S., Austin, W. E. N., Benn, D. I., Bertrand, S., Cui, X., et al. (2020). Fjords as aquatic critical zones (ACZs). Earth-Science Rev. 203, 103145. doi:10.1016/j.earscirev.2020.103145
Bishop, D. G. (1985). Inferred uplift rates from raised marine surfaces, southern fiordland, New Zealand. N. Z. J. Geol. Geophys. 28, 243–251. doi:10.1080/00288306.1985.10422224
Briner, J. P., Bini, A. C., and Anderson, R. S. (2009). Rapid early Holocene retreat of a laurentide outlet glacier through an arctic fjord. Nat. Geosci. 2, 496–499. doi:10.1038/ngeo556
Brodie, J. W. (1964). “The fiordland shelf and milford sound,” in Studies of a southern fiord” New Zealand oceanographic institute. Editor T. M. Skerman, 13–23.
Bruun, A. F., Brodie, J. W., and Fleming, C. A. (1955). Submarine geology of milford sound, New Zealand. J. Sci. Technol. B 36, 397–410.
Cattaneo, A., and Steel, R. J. (2003). Transgressive deposits: a review of their variability. Earth-Science Rev. 62, 187–228. doi:10.1016/S0012-8252(02)00134-4
Clark, K. J., Johnson, P. N., Turnbull, I. M., and Litchfield, N. J. (2011). The 2009 Mw 7.8 earthquake on the puysegur subduction zone produced minimal geological effects around dusky Sound. New Zealand. doi:10.1080/00288306.2010.543690
Cui, X., Bianchi, T. S., Savage, C., and Smith, R. W. (2016). Organic carbon burial in fjords: terrestrial versus marine inputs. Earth Planet. Sci. Lett. 451, 41–50. doi:10.1016/j.epsl.2016.07.003
Dlabola, E. K., Wilson, G. S., Gorman, A. R., Riesselman, C. R., and Moy, C. M. (2015). A post-glacial relative sea-level curve from Fiordland, New Zealand. Glob. Planet. Change 131, 104–114. doi:10.1016/j.gloplacha.2015.05.010
Domack, E. W., and McClennen, C. E. (1996). “Accumulation of glacial marine sediments in fjords of the antarctic peninsula and their use as late Holocene paleoenvironmental indicators,” in Foundations for ecological research west of the antarctic peninsula (American Geophysical Union AGU), 135–154. doi:10.1029/AR070p0135
Dowdeswell, J. A., Batchelor, C., Hogan, K. A., and Schenke, H. W. (2016a). Nordvestfjord: a major east Greenland fjord system. Geol. Soc. Lond. Memoirs 46, 43–44. doi:10.1144/m46.40
Dowdeswell, J. A., Canals, M., Jakobsson, M., Todd, B. J., Dowdeswell, E. K., and Hogan, K. A. (2016b). Introduction: an atlas of submarine glacial landforms. Geol. Soc. Lond. Memoirs 46, 3–14. doi:10.1144/M46.171
Dowdeswell, J. A., Canals, M., Jakobsson, M., Todd, B. J., Dowdeswell, E. K., and Hogan, K. A. (2016c). The variety and distribution of submarine glacial landforms and implications for ice-sheet reconstruction. Geol. Soc. Lond. Memoirs 46, 519–552. doi:10.1144/m46.183
Dykstra, J. L. (2012). The Post-LGM evolution of milford sound, fiordland, New Zealand: timing of ice retreat, the role of mass wasting and implications for hazards. Christchurch: University of Canterbury. doi:10.26021/6036
Elverhøi, A., Lønne, Ø., and Seland, R. (1983). Glaciomarine sedimentation in a modern fjord environment, spitsbergen. Polar Res. 1, 127–149. doi:10.3402/polar.v1i2.6978
Forwick, M., and Vorren, T. O. (2009). Late Weichselian and Holocene sedimentary environments and ice rafting in isfjorden, spitsbergen. Palaeogeogr. Palaeoclimatol. Palaeoecol. 280, 258–274. doi:10.1016/j.palaeo.2009.06.026
Forwick, M., and Vorren, T. (2010). Stratigraphy and deglaciation of the isfjorden area, spitsbergen. Nor. J. Geol. 90 (4), 163–179.
Forwick, M., Vorren, T. O., Hald, M., Korsun, S., Roh, Y., Vogt, C., et al. (2010). Spatial and temporal influence of glaciers and Rivers on the sedimentary environment in sassenfjorden and tempelfjorden, spitsbergen. Geol. Soc. Lond. Spec. Publ. 344, 163–193. doi:10.1144/SP344.13
Fransner, O., Noormets, R., Flink, A. E., and Hogan, K. A. (2016). Crag-and-tail landforms in outer rijpfjorden, nordaustlandet, Svalbard. Geol. Soc. Lond. Memoirs 46, 57–58. doi:10.1144/m46.125
Freiwald, A., Hebbeln, D., Davidson, S., and Beuck, L. (2025). Cold-water coral biology and geology off aotearoa New Zealand. CoralNewZ (SO309). Wellingt. Aotearoa N. Z. NIWA.
Gilbert, G. K. (1885). The topographic features of Lake shores. US Geol. Surv. Ann. Rep. (5), 69–123.
Glasby, G. P. (1978). Fiord studies: Caswell and nancy sound, 79. New Zealand: New Zealand Oceanographic Institute Memoir.
Glasser, N. F., and Ghiglione, M. C. (2009). Structural, tectonic and glaciological controls on the evolution of fjord landscapes. Geomorphology 105, 291–302. doi:10.1016/j.geomorph.2008.10.007
Gomez, B., Carter, L., Trustrum, N. A., Palmer, A. S., and Roberts, A. P. (2004). El niño–Southern Oscillation signal associated with middle Holocene climate change in intercorrelated terrestrial and marine sediment cores, north island, New Zealand. Geology 32, 653–656. doi:10.1130/G20720.1
Heron, D. W. (2023). Geological map of New Zealand 1:250 000. GNS Sci. Geol. map [digital data] Low. Hut (NZ) GNS Sci. doi:10.21420/5XTJ-5718
Hinojosa, J. L., Moy, C. M., Stirling, C. H., Wilson, G. S., and Eglinton, T. I. (2014). Carbon cycling and burial in new Zealand’s fjords. Geochem. Geophys. Geosystems 15, 4047–4063. doi:10.1002/2014GC005433
Hinojosa, J. L., Moy, C. M., Prior, C. A., Eglinton, T. I., McIntyre, C. P., Stirling, C. H., et al. (2015). Investigating the influence of regional climate and oceanography on marine radiocarbon reservoir ages in southwest New Zealand. Estuar. Coast. Shelf Sci. 167, 526–539. doi:10.1016/j.ecss.2015.11.003
Hinojosa, J. L., Moy, C. M., Stirling, C. H., Wilson, G. S., and Eglinton, T. I. (2017). A New Zealand perspective on centennial-scale southern hemisphere westerly wind shifts during the last two millennia. Quat. Sci. Rev. 172, 32–43. doi:10.1016/j.quascirev.2017.07.016
Hogan, K. A., Jakobsson, M., Mayer, L., Reilly, B. T., Jennings, A. E., Stoner, J. S., et al. (2020). Glacial sedimentation, fluxes and erosion rates associated with ice retreat in petermann fjord and nares strait, north-west Greenland. Cryosphere 14, 261–286. doi:10.5194/tc-14-261-2020
Howe, J. A., Austin, W. E. N., Forwick, M., Paetzel, M., Harland, R., and Cage, A. G. (2010). “Fjord systems and archives: a review,”, 344. London: Geological Society, Special Publications, 5–15. doi:10.1144/SP344.2Fjord Syst. archives
iXblue, P. L. (2019). Fiordland Hydrographic survey (Southern) for land information New Zealand. Fiordland: iXblue.
Kaplan, M. R., Schaefer, J. M., Denton, G. H., Barrell, D. J. A., Chinn, T. J. H., Putnam, A. E., et al. (2010). Glacier retreat in New Zealand during the younger dryas stadial. Nature 467, 194–197. doi:10.1038/nature09313
Kim, K. J., and Sutherland, R. (2004). Uplift rate and landscape development in southwest fiordland, New Zealand, determined using 10Be and 26Al exposure dating of marine terraces. Geochimica Cosmochimica Acta 68, 2313–2319. doi:10.1016/j.gca.2003.11.005
Knudson, K. P., Hendy, I. L., and Neil, H. L. (2011). Re-examining southern hemisphere westerly wind behavior: insights from a late Holocene precipitation reconstruction using New Zealand fjord sediments. Quat. Sci. Rev. 30, 3124–3138. doi:10.1016/j.quascirev.2011.07.017
MacGregor, K. R., Anderson, R. S., Anderson, S. P., and Waddington, E. D. (2000). Numerical simulations of glacial-valley longitudinal profile evolution. Geology 28, 1031–1034. doi:10.1130/0091-7613(2000)028<1031:nsogvl>2.3.co;2
Mangerud, J., Hughes, A. L. C., Sæle, T. H., and Svendsen, J. I. (2019). Ice-flow patterns and precise timing of ice sheet retreat across a dissected fjord landscape in Western Norway. Quat. Sci. Rev. 214, 139–163. doi:10.1016/j.quascirev.2019.04.032
Mortimer, N. (2004). New zealand’s geological foundations. Gondwana Res. 7, 261–272. doi:10.1016/S1342-937X(05)70324-5
Nyberg, B., Buckley, S. J., Howell, J. A., and Nanson, R. A. (2015). Geometric attribute and shape characterization of modern depositional elements: a quantitative GIS method for empirical analysis. Comput. and Geosciences 82, 191–204. doi:10.1016/j.cageo.2015.06.003
Oerlemans, J. (1984). Numerical experiments on glacial erosion. Z. für Gletscherkd. Glazialgeol. 20, 107–126.
Ohneiser, C., Acton, G., Channell, J. E. T., Wilson, G. S., Yamamoto, Y., and Yamazaki, T. (2013). A middle Miocene relative paleointensity record from the equatorial Pacific. Earth Planet. Sci. Lett. 374, 227–238. doi:10.1016/j.epsl.2013.04.038
Ottesen, D., and Dowdeswell, J. A. (2009). An inter–ice-stream glaciated margin: submarine landforms and a geomorphic model based on marine-geophysical data from Svalbard. GSA Bull. 121, 1647–1665. doi:10.1130/B26467.1
Ottesen, D., Dowdeswell, J. A., Landvik, J. Y., and Mienert, J. (2007). Dynamics of the late Weichselian ice sheet on Svalbard inferred from high-resolution sea-floor morphology. Boreas 36, 286–306. doi:10.1111/j.1502-3885.2007.tb01251.x
Ottesen, D., Dowdeswell, J. A., Benn, D. I., Kristensen, L., Christiansen, H. H., Christensen, O., et al. (2008). Submarine landforms characteristic of glacier surges in two spitsbergen fjords. Quat. Sci. Rev. 27, 1583–1599. doi:10.1016/j.quascirev.2008.05.007
Pickrill, R. A. (1987). Circulation and sedimentation of suspended particulate matter in New Zealand fjords. Mar. Geol. 74, 21–39. doi:10.1016/0025-3227(87)90003-X
Pickrill, R. A., Fenner, J. M., and McGlone, M. S. (1992). Late Quaternary evolution of a fjord environment in preservation inlet, New Zealand. Quat. Res. 38, 331–346. doi:10.1016/0033-5894(92)90042-h
Raff, J. L., Goodbred, S. L., Pickering, J. L., Sincavage, R. S., Ayers, J. C., Hossain, M. S., et al. (2023). Sediment delivery to sustain the ganges-Brahmaputra delta under climate change and anthropogenic impacts. Nat. Commun. 14, 2429. doi:10.1038/s41467-023-38057-9
Ramirez, M. T., Allison, M. A., Bianchi, T. S., Cui, X., Savage, C., Schüller, S. E., et al. (2016). Modern deposition rates and patterns of organic carbon burial in fiordland, New Zealand. Geophys. Res. Lett. 43 (11), 768–776. doi:10.1002/2016GL070021
Rodrigo, C., Cifuentes, E., Fernández, R., Andrade, J., Rebolledo, L., Muñoz, D., et al. (2022). Submarine geomorphology and glacimarine sedimentary processes associated to deglaciation in europa fjord, Chilean patagonia. Front. Mar. Sci. 9, 612021. doi:10.3389/fmars.2022.612021
Seebeck, H., Van Dissen, R., Litchfield, N., Barnes, P. M., Nicol, A., Langridge, R., et al. (2024). The New Zealand community fault model – version 1.0: an improved geological foundation for seismic hazard modelling. N. Z. J. Geol. Geophys. 67, 209–229. doi:10.1080/00288306.2023.2181362
Shaw, J., and Lintern, D. G. (2016). “Landforms in a Pacific fjord system: Douglas channel, British Columbia, Canada,”Geol. Soc. Lond. Memoirs, 46. 81–82. doi:10.1144/m46.105
Sheriff, R. E., and Geldart, L. P. (1995). Exploration seismology. 2nd Edn. Cambridge: Cambridge University Press. doi:10.1017/CBO9781139168359
Shoemaker, E. M. (1986). The formation of fjord thresholds. J. Glaciol. 32, 65–71. doi:10.3189/S0022143000006894
Shulmeister, J., Thackray, G. D., Rittenour, T. M., Fink, D., and Patton, N. R. (2019). The timing and nature of the last glacial cycle in New Zealand. Quat. Sci. Rev. 206, 1–20. doi:10.1016/j.quascirev.2018.12.020
Skerman, T. M. (1964). Studies of a southern fiord, 17. Wellington, Mem., 17: New Zealand Oceanographic Institute, 1–92.
Smeaton, C., and Austin, W. E. N. (2019). Where’s the carbon: exploring the spatial heterogeneity of sedimentary carbon in mid-latitude fjords. Front. Earth Sci. 7, 269. doi:10.3389/feart.2019.00269
Smith, R. W., Smith, R. W., Bianchi, T. S., Allison, M. A., Candida, S., Savage, C., et al. (2015). High rates of organic carbon burial in fjord sediments globally. Nat. Geosci. 8, 450–453. doi:10.1038/ngeo2421
Stanton, B. R., and Pickard, G. L. (1981). Physical oceanography of the New Zealand fiords, 88. Wellington, Mem., 88: New Zealand Oceanographic Institute Memoir.
Storms, J. E. A., de Winter, I. L., Overeem, I., Drijkoningen, G. G., and Lykke-Andersen, H. (2012). The Holocene sedimentary history of the kangerlussuaq Fjord-valley fill, west Greenland. Quat. Sci. Rev. 35, 29–50. doi:10.1016/j.quascirev.2011.12.014
Suggate, R. P., and Almond, P. C. (2005). The last Glacial maximum (LGM) in Western South Island, New Zealand: implications for the global LGM and MIS 2. Quat. Sci. Rev. 24, 1923–1940. doi:10.1016/j.quascirev.2004.11.007
Syvitski, J. P. M., and Shaw, J. (1995). Chapter 5 sedimentology and geomorphology of fjords. Dev. Sedimentology 53, 113–178. doi:10.1016/s0070-4571(05)80025-1
Syvitski, J. P. M., Burrell, D. C., and Skei, J. M. (1987). Fjords. New York, NY: Springer. doi:10.1007/978-1-4612-4632-9
Ummenhofer, C. C., and England, M. H. (2007). Interannual extremes in New Zealand precipitation linked to modes of southern hemisphere climate variability. J. Clim. 20, 5418–5440. doi:10.1175/2007JCLI1430.1
Unland, E. (2025a). Multi-channel boomer seismic dataset from fiordland. NZ. doi:10.5281/zenodo.15292985
Unland, E. (2025b). Single-channel boomer seismic dataset from fiordland. NZ. doi:10.5281/zenodo.15292794
Wang, L., and Liu, H. (2006). An efficient method for identifying and filling surface depressions in digital elevation models for hydrologic analysis and modelling. Int. J. Geogr. Inf. Sci. 20, 193–213. doi:10.1080/13658810500433453
Keywords: temperate fjords, Fiordland, geomorphology, bathymetry, marine seismic reflection, glaciology
Citation: Unland E, Gorman AR, Barnes PM, Moy CM, Bowman H, Wilson GS, Forwick M and Hillman JIT (2025) Exploring the submarine geomorphology of Te Rua-o-te-Moko Fiordland, Aotearoa New Zealand. Front. Earth Sci. 13:1620747. doi: 10.3389/feart.2025.1620747
Received: 30 April 2025; Accepted: 08 October 2025;
Published: 19 November 2025.
Edited by:
Joseph Licciardi, University of New Hampshire, United StatesReviewed by:
Abdolmajid Naderi Beni, Iranian National Institute for Oceanography and Atmospheric Science, IranJacques Giraudeau, Délégation Aquitaine (CNRS), France
Copyright © 2025 Unland, Gorman, Barnes, Moy, Bowman, Wilson, Forwick and Hillman. This is an open-access article distributed under the terms of the Creative Commons Attribution License (CC BY). The use, distribution or reproduction in other forums is permitted, provided the original author(s) and the copyright owner(s) are credited and that the original publication in this journal is cited, in accordance with accepted academic practice. No use, distribution or reproduction is permitted which does not comply with these terms.
*Correspondence: Ellen Unland, ZWxsZW4udW5sYW5kQHBvc3RncmFkLm90YWdvLmFjLm56
†Present address: Philip M. Barnes, Ocean Geology, Earth Science New Zealand (ESNZ), Wellington, New Zealand
Jess I.T. Hillman, Ocean Geology, Earth Science New Zealand (ESNZ), Wellington, New Zealand