 Hongyan Qi1
 Xiaochen Wei
 Tong Liu
 Yi Ding
- 1China University of Petroleum (Beijing), CNPC Xinjiang Oilfield Company, Karamay, China
- 2CNPC Xinjiang Oilfield Company, Karamay, China
- 3School of Geoscience and Technology, Southwest Petroleum University, Chengdu, China
- 4Petroleum Engineering School, Southwest Petroleum University, Chengdu, China
The frequent incidence of casing failure significantly hampers the efficiency of oil and gas development. Casing failure typically takes place at geological discontinuities, particularly at the formation interface during hydraulic fracturing operations. This occurrence is attributed to the high pressure generated, causing slippage at the formation interface and subsequently resulting in casing shear deformation. In this study, we present a fluid injection-driven slippage model incorporating a discontinuous medium to accurately depict the mechanical responses of the formation interface during the drilling and fracturing operations of a representative well in the Weiyuan gas field, China. The results indicate that interface slip predominantly occurs during the fracturing stage. The slip distance first increases and then decreases as the interface dip angle increases, and it is positively correlated with the permeability of the formation. The maximum interface slip position may not necessarily be at the wellbore due to the influence of the interface dip angle and the permeability difference between both sides of the interface. Furthermore, the maximum slip position tends to move away from the wellbore during fracturing operations. The stress induced by fracturing can alter the stress state near the wellbore, thereby affecting the direction of interface slip. When using low-viscosity fracturing fluid, the interface slip distance reached 0.63 mm, compared to 0.16 mm for high-viscosity fluid. This represents a 75% reduction in slip distance with increased fluid viscosity. Consequently, employing a multi-stage fracturing technique at the intersection of the horizontal wellbore and the discontinuities is recommended. In the early stages of fracturing, a low-viscosity fracturing fluid is suggested to reduce the breaking pressure of the reservoir and efficiently create fractures. In later stages, a high viscosity fracturing fluid can be employed to restrict the interface slip distance and further mitigate the risk of casing failure. This study provides actionable guidance for mitigating casing damage by suppressing interface slip during hydraulic fracturing, demonstrating significant value for field operations.
1 Introduction
More than 30% of wells in the Sichuan Basin have experienced casing deformation during hydraulic fracturing since 2009 (Ch et al., 2020). Severe casing deformation jeopardizes wellbore integrity and increases the risk of subsequent gas production; the plug fails to reach the predetermined position, reducing the number of exploitable sections in horizontal wells (Chaowei and Degui, 2022; Chaowei et al., 2021). As shown in Figure 1a, four development stages were operated in Changning-Weiyuan shale gas field, in the first stage (2009–2010), four wells were fractured, among which two wells underwent casing deformation. In the second stage (2011–2012), ten wells were fractured and three wells experienced casing deformation. In the third stage (2013–2014), nine wells were fractured and four wells experienced casing deformation. In the fourth stage (2014–2016), seventy-seven wells were fractured and twenty-five wells experienced casing deformation. The overall casing deformation rate was 31.7%. One hundred and ten intervals were abandoned, and the casing deformation rate at the formation interface accounted for 61.7% of the total (Xueli et al., 2018; Yan et al., 2017). Casing deformation tends to occur at the formation interface. Records of Ying Oilfield showed that the casing deformation rate reached 84.6% at the mud-sandstone interface (Figure 1b) (Yin et al., 2018a).
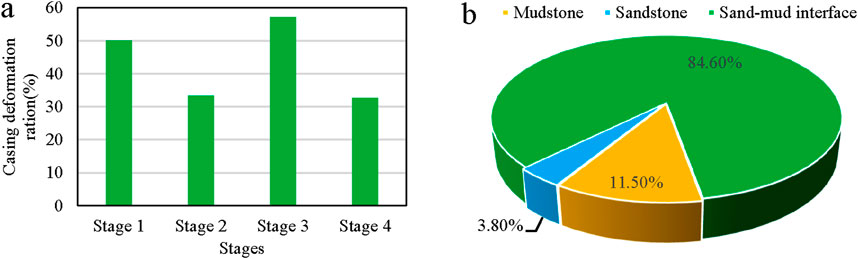
Figure 1. The casing deformation ratio during the drilling process (a) the casing deformation ratio of the Weiyuan-Changning shale gas reservoir (b) the location of the casing failure in Ying Oilfield.
The stress field around the wellbore varies during the drilling and fracturing processes. The interface slip could be induced by fluid injection at geological discontinuities such as faults, fractures, or formation interfaces (Qing et al., 2022; Hejuan et al., 2022; Hui et al., 2021; Sega et al., 2015). In particular, shear slip induced by fluid injection plays an important role in casing deformation. Thus it is essential to study the mechanical response at the discontinuity to ensure wellbore safety and integrity (Hongwei et al., 2002; Jun et al., 2021; Li et al., 2025; Qiang et al., 2025). At present, the basic research methods include displacement-driven and fluid injection-driven (Li et al., 2019).
Displacement-induced discontinuity slip tests can be conducted under constant confining pressure or constant normal stress (Ji et al., 2022). Direct shear tests have shown that the discontinuities are prone to slip when oriented at 30°–50° to the maximum principal stress (Giorgetti et al., 2019; Hayward and Cox, 2017). The slip characteristics are significantly affected by the stress evolution, as normal stress increases, the slip mode changes from stable slip to unstable slip (Buijze et al., 2021). A smaller friction coefficient on the discontinuity can promote increased slip distance and lead to an approximately exponential decrease in shear strength (Di Toro et al., 2006; Sheng et al., 2020; Kilgore et al., 2017). Displacement-driven numerical simulation could reveal the influence of discontinuity slip characteristics on casing, the results suggest a sinusoidal relationship between the casing deflection and its distance from the formation interface (Yin et al., 2018a; Liu, 2020). The maximum casing deformation occurs on both sides of the discontinuity, and presents noncontinuous vertical casing deformation on the fault surface (Yin et al., 2018b). Furthermore, parameter sensitivity analysis results have shown that casing deformation is most significantly affected by the intersection angle between the discontinuity and the wellbore (Zhang et al., 2021).
The displacement-driven study should assume the scale and direction of the slip on the discontinuity surface, as the interface slip is caused by the elevated pore pressure, the injection-driven study is better suited for replicating the actual field conditions (Ji et al., 2020). In the injection-driven experiment, when water is injected into the low-permeability sample at a high injection rate, the discontinuity surface is in local undrained state and causes uneven stress distribution, the induced fracture in high-stress area could lead to local instability and even reactivation of the discontinuity (Ji and Wu, 2020). The increasing pore pressure aggravates the inhomogeneity of stress distribution and leads to unstable slip on the discontinuity, and the stick-slip cases are triggered when the pore pressure increases at an accelerated rate (Scuderi et al., 2017; Proctor et al., 2020; Xing et al., 2019). The fluid injection-driven numerical simulation could be applied and the mechanical response characteristics of discontinuity during fluid injection could be studied from many perspectives (Liangjie et al., 2021). The increase of the total fluid volume and injection rate is beneficial to increase the slip distance of the discontinuity, and the effect of injection rate is more significan (Eyinla, 2022; Huang et al., 2020). With the increase of the distance between perforations and the discontinuity, the interface slip distance and the active range of the discontinuity first increase and then remain stable. Further, the interface slip distance could be reduced by optimizing the cluster spacing of the horizontal wells, the fracturing fluid viscosity and injection rate (Fengshou et al., 2020; Zhao et al., 2021). When the permeability difference between two sides of the layer interface is significant, high pore pressure will cause uneven distribution of stress, and the stress will be concentrated in the section with higher permeability, resulting in greater casing deformation in this section (Han et al., 2019; Xi et al., 2018). Wu et al. investigated controlling factors of hydraulic fracture-bedding interface interactions using the finite-discrete element method. Their results demonstrate that slip behavior along bedding interfaces governs HF crossing capability. Although high permeability of bedding interfaces delays crossing time, it does not prevent ultimate HF penetration (Wu et al., 2022). Humberto et al. investigated hydraulic fracture propagation in anisotropic formations. Their results demonstrate that fluid pressure remains stable when fractures deflect along bedding interfaces. Conversely, treatment pressure increases significantly during cross-interface propagation. Furthermore, higher elastic anisotropy promotes fracture penetration across interfaces (Celleri and Sánchez, 2024).
The mechanical response characteristics of structural surfaces during fluid injection are crucial for well drilling operations and fracturing design. Current research treats faults as continuous media and uses the Coulomb failure stress (CFS) of fault location obtained from fluid-solid coupling calculations as the criterion for fault activity (Fan et al., 2019; Haddad and Eichhubl, 2020). Empirical formulas are then used to predict fault slip distance, but some of these formulas require assumptions about the value of the dynamic friction coefficient or uniform distribution of shear stress, which may not reflect the actual conditions (Crouch, 1976). In our previous work, we used the shear displacement theory formula under uniform shear stress to characterize the sliding distance of faults (He et al., 2022). To minimize reliance on excessive assumptions in the theoretical model, this study employs a discontinuous medium to accurately portray the fault and employs the Mohr-Coulomb contact model to calculate the precise slipping characteristics of the fault under quasi-static, non-uniform shear stress conditions. Through a meticulous sensitivity analysis of parameters, the critical controlling factors influencing fault activity are identified. Subsequently, efforts are directed towards optimizing the processes of well completion and hydraulic fracturing, aiming to minimize slipping distance and effectively alleviate the risks associated with casing damage and deformation throughout the drilling and fracturing procedures.
2 Methodology
2.1 Governing equations
The crack initiation and propagation process is a dynamic coupling of hydraulic fracturing fluid flow and rock deformation. Based on Biot theory (Charlez, 1991; Chen et al., 1995), the linear elastic strain of reservoir rock and pore pressure variation can be represented by Equation 1 and Equation 2:
where
The stress balance equation, derived from the principle of virtual work, can be expressed by Equation 3:
where
Assuming the fracturing fluid is an incompressible Newtonian fluid, the flow control equation of Newtonian fluid in hydraulic fractures can be obtained through the fracture pressure loss equation and the law of conservation of mass (Charlez, 1991), as shown in Equation 4:
where
The leakage of fracturing fluid from the fracture into the rock matrix can be characterized by (Carter, 1957), as shown in Equation 5:
where
2.2 Contact method
The interaction between contact surfaces includes normal and tangential action. As shown in Equations 6, 7, when the clearance h between surfaces satisfies h < 0, the surfaces are considered to be in contact with each other with contact pressure p > 0 (Figure 2). Conversely, for h ≥ 0, the contact surfaces are separated from each other with p = 0.
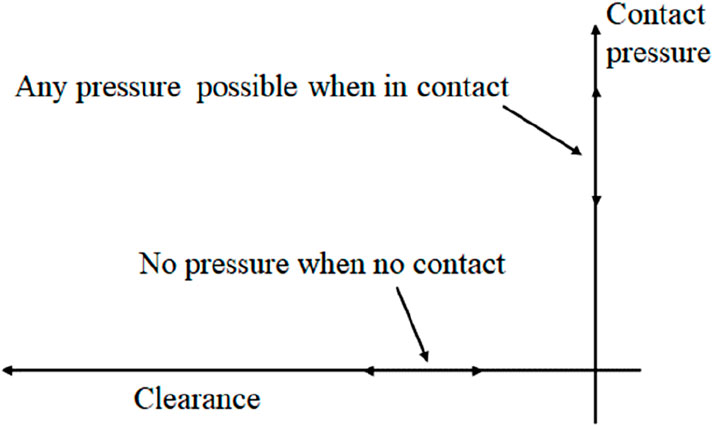
Figure 2. Contact pressure-interfacial clearance relationship.
The slip type includes smooth straight slip and smooth curve slip. The node X1 in the linear slip segment is the node on the slave surface. The node X is the closest point to X1 on the master surface, and
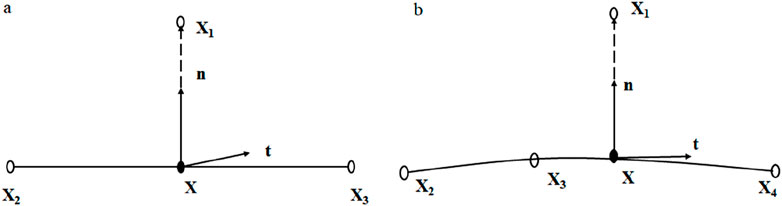
Figure 3. Schematic diagram of finite slip relationship (a) Linear slide line segment (b) Quadratic slide line segment.
An interpolation function
The tangent line
Linearize Equation 10 yields the contact slip equation:
where
The stress stiffness of point
where
2.3 Method validation
The simulation results were compared with experimental results by Wang et al. to validate the applicability of the proposed method (Wang et al., 2020). A cylindrical sandstone sample with a length of 1 m and a diameter of 0.5 m was prepared, a sawcut plane was located at the center of the cylinder with a dip angle α = 30°. The elastic modulus of sandstone was 15 GPa, Poisson’s ratio was 0.26, and the friction coefficient was 0.7.
The main test procedures were as follows. First, the sample was loaded until the required confining pressure of 35 MPa was reached, while the pore pressure was kept constant at 5 MPa. Subsequently, the shear strength (τss) was obtained by axial loading at an axial displacement rate of 1 μm/s. Next, the axial load was reduced with a displacement rate of 0.05 μm/s until the shear stress reached 0.92 × τss. The axial pressure was kept constant, and water was pumped into the sample to trigger fault slip. Notably, the confining pressure remained constant at 35 MPa throughout the test.
The top of the sample was sealed to create an undrained boundary condition and pore pressure was applied through Pump A at the bottom of the sample. In order to study the correlation between fault slip and fluid pressure, in the test the fluid pressure increased from an initial value of 5 MPa at a rate of 2 MPa/min, with each increment lasting 2 min. Subsequently, the pore pressure was kept constant for 8 min. Changes in pore pressure and slip character--ristics on the sawcut plane were recorded by acoustic emission (AE) sensors. The experimental setup is shown in Figure 4a.
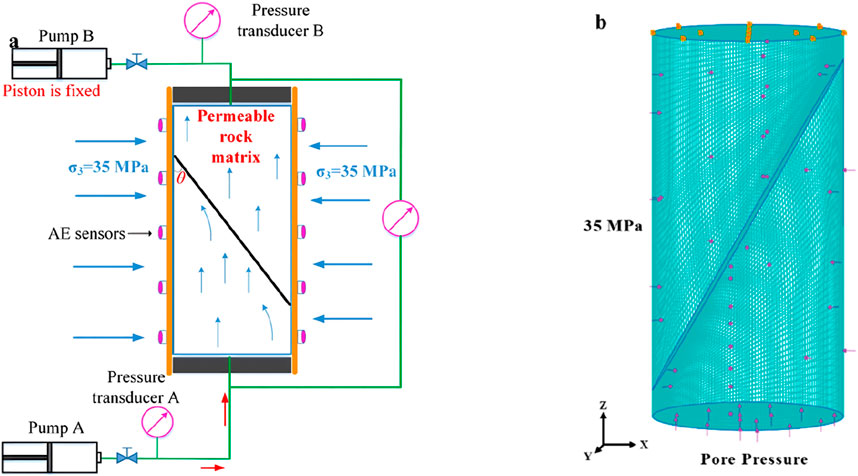
Figure 4. (a) Schematic diagram of the test and the (b) corresponding finite element model.
A 3D hydro-mechanical coupling model was established referring to the experimental settings (Figure 4b). The model geometry, material parameters and stress loading strategy were consistent with those of the test. The friction coefficient was set to 0.7, the void ratio was 0.29. The specific parameters were listed in Table 1 (Wang et al., 2020).
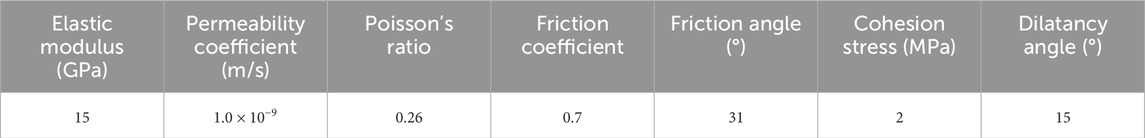
Table 1. Parameters used in the validation model (Wang et al., 2020).
The fluid pressures and the slip distance on the sawcut plane obtained by numerical model is compared with the experimental results (blue bar in Figure 5). In general, the results obtained by numerical model is basically consistent with the experimental results, the regression coefficient reaches 0.97, indicating the proposed method could be applied in further research.
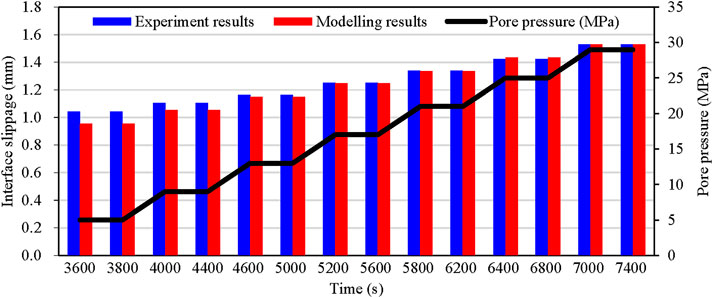
Figure 5. Comparative analysis of interface slippage: laboratory test (blue bar) vs simulation results (red bar) during pore pressure evolution (black line).
3 Interface slip during drilling and fracturing process
3.1 Calculation model of formation interface slip
A numerical model of a vertical well was constructed based on the lithological parameters and fracturing strategy for a representative well in the Weiyuan gas field, Sichuan Basin. The buried depth of mudstone-sandstone interface was 3,200 m, the sandstone layer and mudstone layer were in angular unconformity, with a stratum dip angle of 40°. The friction coefficient was 0.7, and the void ratios of mudstone and sandstone were 0.1 and 0.2, respectively. The lithological parameters are shown in Table 2. The model size was set as 10 × 10 × 20 m, and the diameter of the well was 0.18 m (Figure 6a), and the mesh was finer near the wellbore to accurately capture the response characteristics of the interface (Figure 6b). The stress regime around the well was strike-slip type. The model employed fixed-displacement boundary conditions with an initial stress field defining in-situ stresses: maximum horizontal stress σH = 75 MPa, minimum horizontal stress σh = 55 MPa, and vertical stress σv = 60 MPa. A constant pore pressure boundary of 40 MPa was applied.
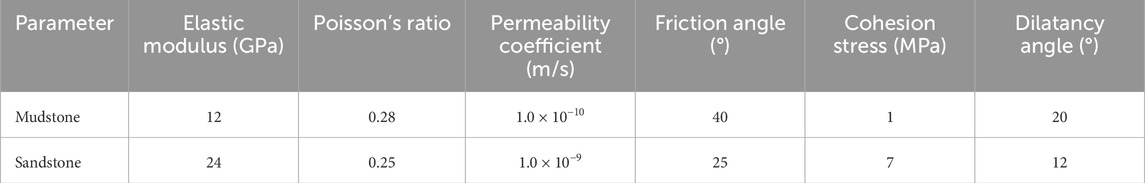
Table 2. Parameters are used in the model.
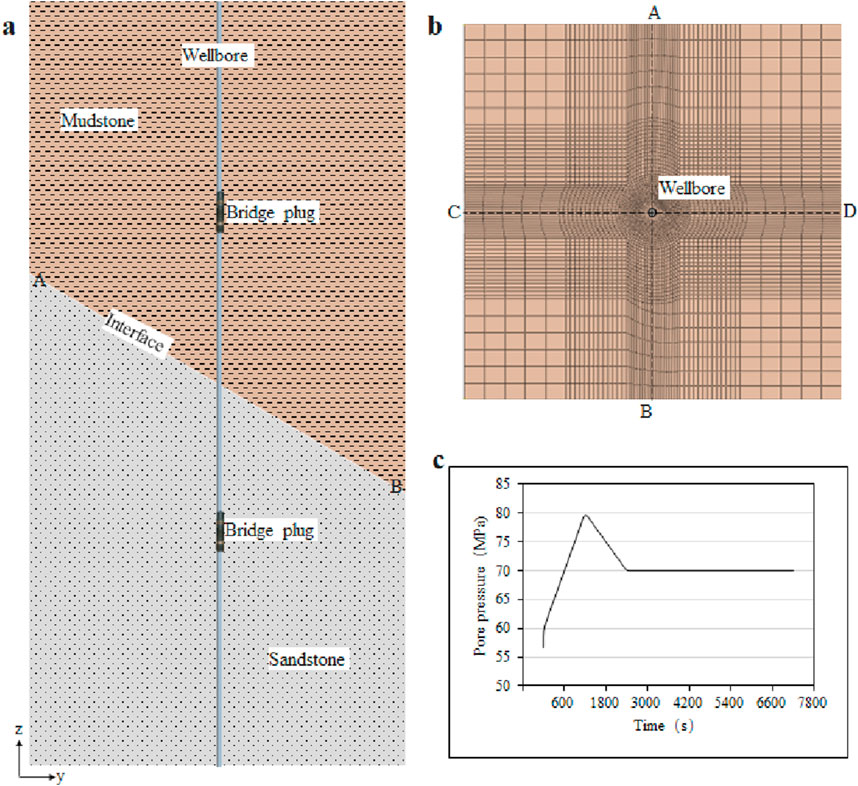
Figure 6. Numerical model of mud-sandstone formation (a) side view (b) top view (c) bottom hole pressure variation with time.
According to field reports, the drilling fluid density was 1,500 kg/m3 and the bottom hole pressure during the drilling stage was 60 MPa. During the multistage fracturing, the bottom hole pressure linearly increased from 60 MPa to 80 MPa (breaking pressure) over 1,200 s, then decreased to 70 MPa during 1,200 s–2,400 s, and finally stabilized at 70 MPa until 7,200 s (Figure 6c).
3.2 Calculation results
The pore pressure distribution and principal stress along the formation interface during drilling and fracturing process are shown in Figure 7. The pore pressure at the wellbore rose to 60 MPa after drilling, while the normal stresses σ1 and σ3 were reduced by 14.4 MPa and 6.97 MPa, respectively (Figure 7c). During fracturing, the pore pressure at the wellbore increased sharply and diffused outward. The permeability difference between the two sides of the formation interface and the dip angle hindered the lateral diffusion of the injected fluid, thus, the injected fluid to concentrate near the interface on the left side of the wellbore (Figure 7a), resulting in a larger pressure change on this side (Figure 7b). The pore pressure diffusion ranges on the left and right sides of the wellbore were 4.8 m and 3.5 m, respectively. The overpressure generated during the fracturing process led to a decrease in the contact stress at the interface, and the range of contact stress reduction increased with time. As shown in Figure 7c, the impact of pore pressure on the maximum principal stress was more significant than the minimum principal stress, thus reducing the stress difference around the wellbore. The contact stress near the wellbore reached 0 MPa, indicating that the tensile stress generated at the wellbore may open the interface.
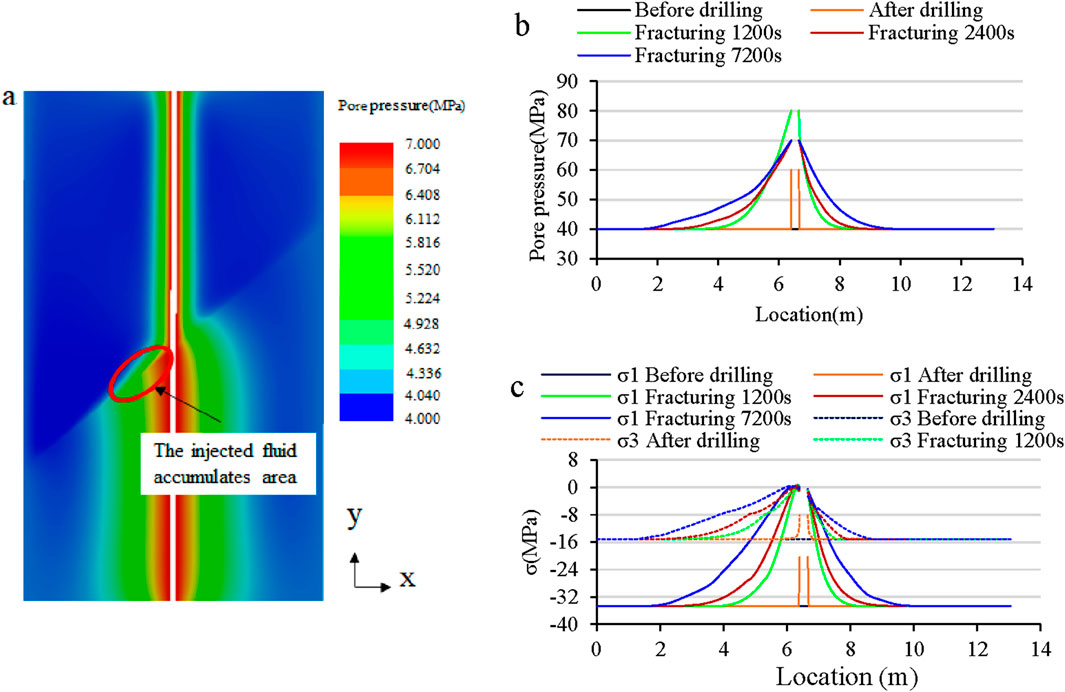
Figure 7. Variation of pore pressure and principal stress at formation interface with time. (a) Pore pressure distribution after fracturing (b) pore pressure variation along the formation interface with time (c) principal stress variation along the formation interface with time.
The stress variation, interface opening and slip distance at the formation interface during drilling and fracturing process were shown in Figure 8. In the drilling process, the changes of contact stress and shear stress were only observed near the wellbore, and no slip occurred at the formation interface. After fracturing, the stress change on the left side of wellbore was more significant due to the uneven fluid pressure distribution (Figures 8a,b). The tension stress led to partial opening of the formation interface, and the opening near the wellbore first increased and then decreased with time. At 1,200 s the opening was 0.015 mm. Between 2,400 s and 7,200 s, after a linear reduction the pore pressure remained constant. Fluid leakage at the formation interface reduced the opening to 0.013 mm, but enlarged its range (Figure 8c). The slip occurred mainly during the fracturing stage, and the slip distance increases with the fracturing time. Influenced by the dip angle and the difference in rock permeability, the injected fluid concentrated on the left side of the wellbore, resulting in a more significant reduction in principal stress. The interface opening and contact pressure decrease led to significant slip at the formation interface (Figure 8d). Fluid aggregation near the wellbore progressively expanded the stress-affected zone, displacing the peak slip location along the formation interface farther from the injection point over time.
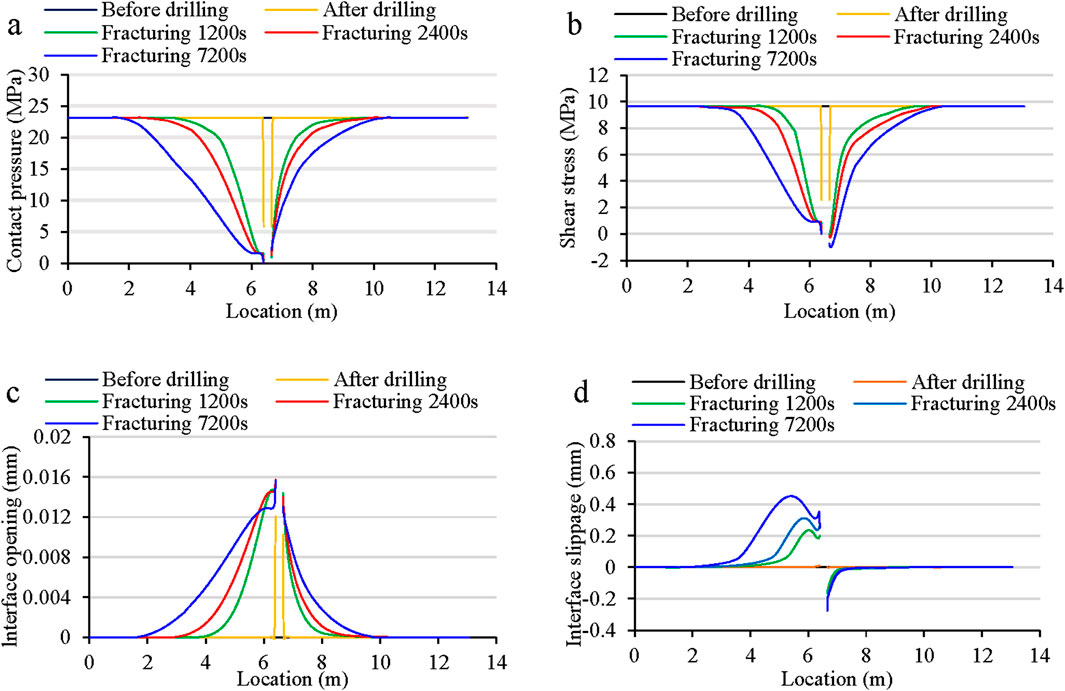
Figure 8. Variations of stress, opening, and slip along the interface during drilling and fracturing.
As shown in Figure 9, both contact pressure and shear stress at the wellbore decreased significantly by 2,400 s, but the contact pressure decreased more sharply than the shear stress. For this reason, slip occurred mainly in the first 2,400 s. After 2,400 s, as the contact stress and shear stress remained basically unchanged, the interface slip remained constant.
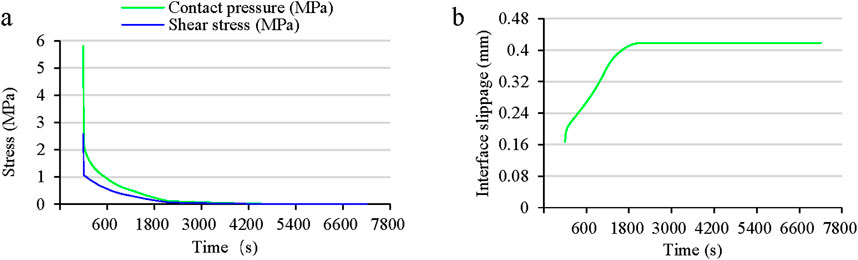
Figure 9. Evolution of stress and interface slippage at the wellbore with time.
4 Parameter sensitivity analysis
We conducted sensitivity analyses on key parameters governing formation interface slip, systematically evaluating the effects of in-stiu stresses, geological factors, and operational variables.
4.1 Formation interface dip angle
To study the mechanical response characteristics of different interface dip angles during fluid injection, the formation interface dip angle
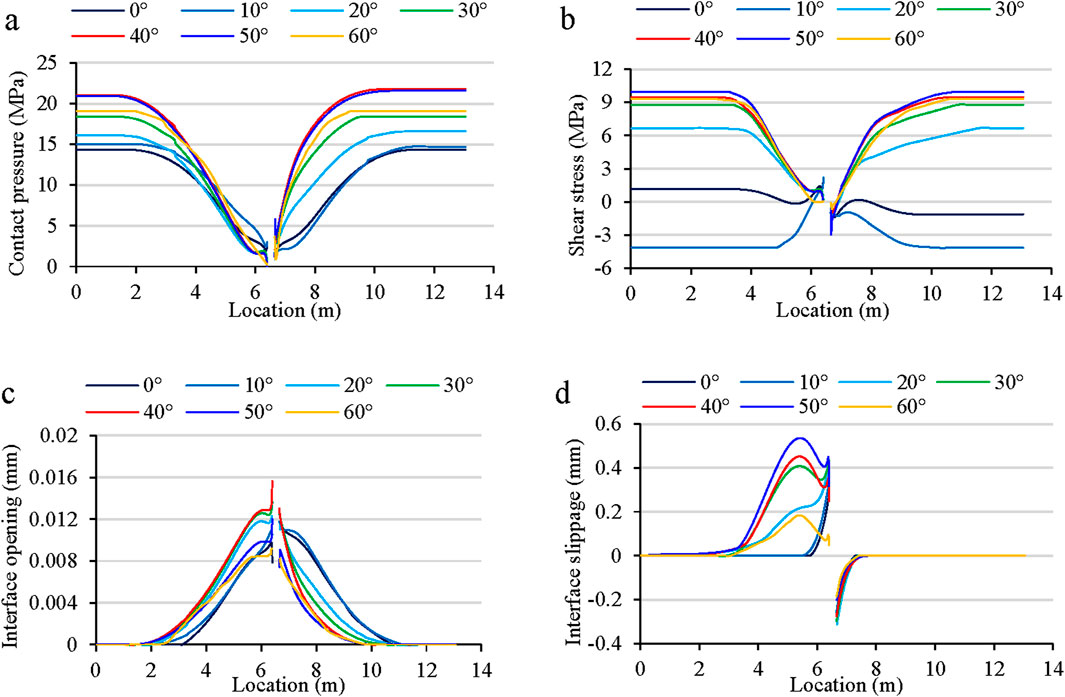
Figure 10. The impact of interface dip angle on (a) interface contact pressure, (b) interface shear stress, (c) interface opening and (d) interface slippage.
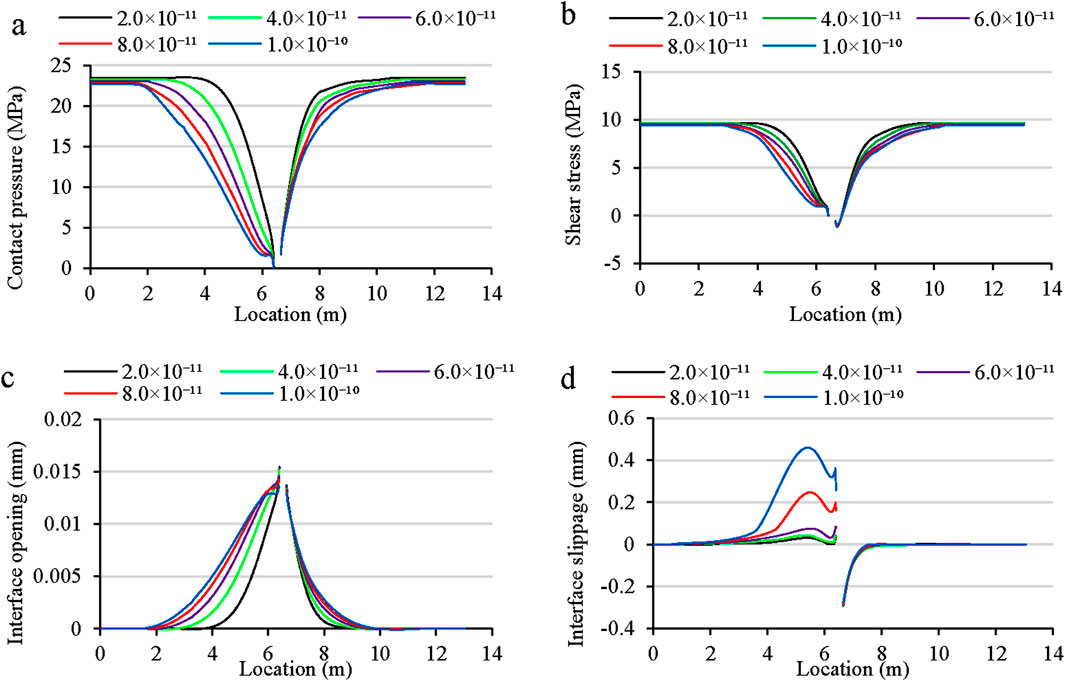
Figure 11. The impact of permeability coefficient on (a) interface contact pressure (b) interface shear stress (c) interface opening and (d) interface slippage.
Figure 10c presents the formation interface opening after fracturing. The opening first increases and then decreases as
4.2 Permeability coefficient
The permeability coefficient of sandstone formation increased from 2.0 × 10⁻¹¹ m/s to 1.0 × 10⁻¹⁰ m/s with other factors kept constant. The contact pressure of formation interface decreased as the increase of permeability coefficient (Figure 11a). As shown in Figure 11b, the shear stress decreased with the increase of sandstone permeability coefficient. Meanwhile, both the magnitude and range of the interface opening increased, extending from 4.5 m to 5.1 m (Figure 11c). The slip distance at the formation interface increased with permeability coefficient. The maximum slip distance was 0.45 mm, and the slip distance at the wellbore was 0.35 mm (Figure 11d). In addition, the maximum slip position at the formation interface occurred about 1 m to the left of the wellbore, which did not change with increasing permeability coefficient, indicating that the formation dip angle was the key control factor for the location of the maximum interface slip.
4.3 In-situ stress
The stress difference of the formation was adjusted by changing the maximum horizontal in-situ stress. The variation range of the horizontal maximum principal stress was set to 55 MPa–75 MPa, and the variation range of the horizontal stress difference was 0 MPa ∼ 20 MPa. As shown in Figure 12a, the contact pressure near the wellbore (within 1 m from the wellbore) decreased with the increase of the stress difference, indicating that the induced stress increased with stress difference, and shear stress similarly increased with stress difference. When the stress difference was 10 MPa–20 MPa, the model was in strike-slip state, and when the stress difference was reduced to between 0 MPa and 5 MPa, the model was in normal stress state, the direction of shear stress near the wellbore was reversed after fracturing (Figure 12b), leading to a change in slip direction in Figure 12d. As shown in Figure 12c, the opening of the formation interface increased as the stress difference rosed from 0 MPa to 20 MPa, and the opening range on the left side of the wellbore increased from 3.8 m to 4.9 m. Notably, when the stress difference was 10 MPa, fluid injection changed the local stress state near the wellbore from strike-slip to normal, causing slip direction vary along the interface and resulting in a smaller slip distance. Therefore, the slip distance around the wellbore first decreased and then increased with the increase of the stress difference, and the maximum slip distance was 0.36 mm when the stress difference rose to 20 MPa.
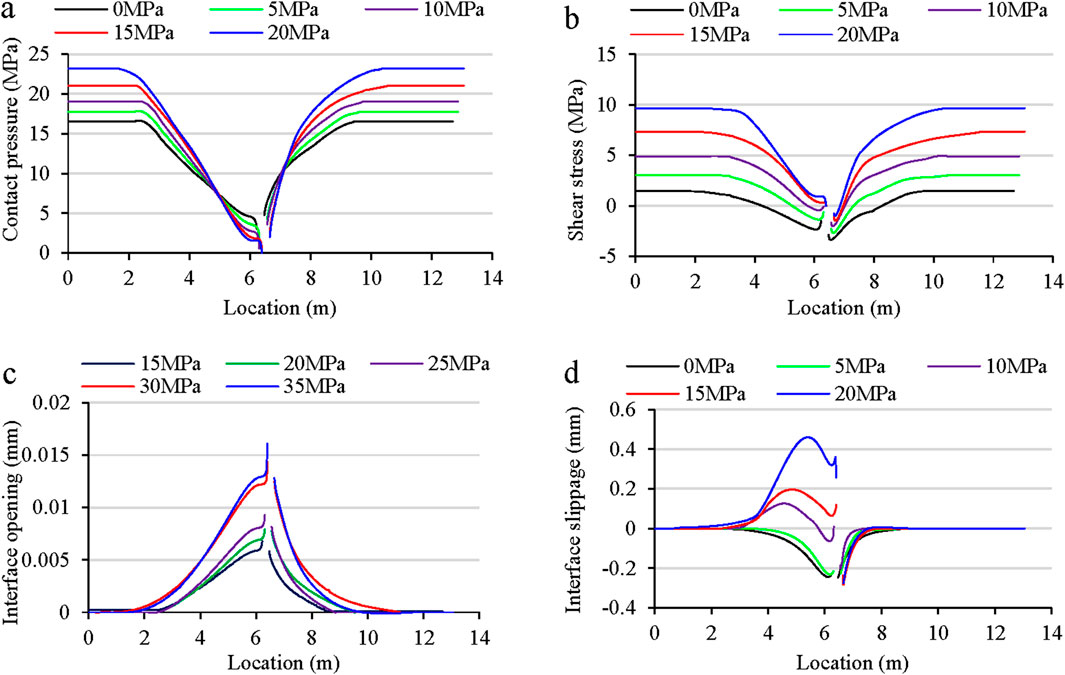
Figure 12. The impact of stress difference on (a) interface contact pressure (b) interface shear stress (c) interface opening and (d) interface slippage.
5 Discussion
The interface dip angle, the permeability coefficient and the horizontal stress difference all had a significant effect on the interface slip characteristics. The dip angle of the discontinuity cannot be changed. The permeability coefficient can be enhanced by reservoir volume fracturing, and the horizontal stress difference between fracturing clusters in a horizontal well can be reduced by optimizing cluster spacing.
Compared to other strategies of reducing interface slip distance, it was more feasible to optimize fracturing parameters such as the fluid pumping rate and fracturing fluid properties. Since the pump injection rate is closely related to the pumping pressure loading rate, the time for the bottom hole pressure to reach the breaking pressure was varied from 1,200 s ∼ 3,600 s (Figure 13). As shown in Figures 14a–c, the change in pump pressure loading rate shows an insignificant influence on interface contact pressure, shear stress and opening distance, and the change in interface slip distance is only 0.022 mm (Figure 14d), indicating that the fluid injection rate has limited effect on interface slip distance.
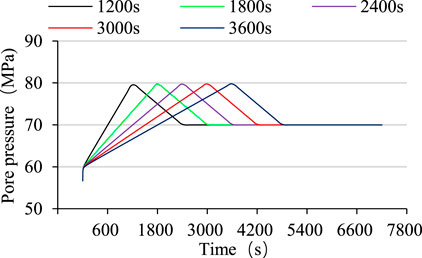
Figure 13. Bottom hole pressure for different injection rate.
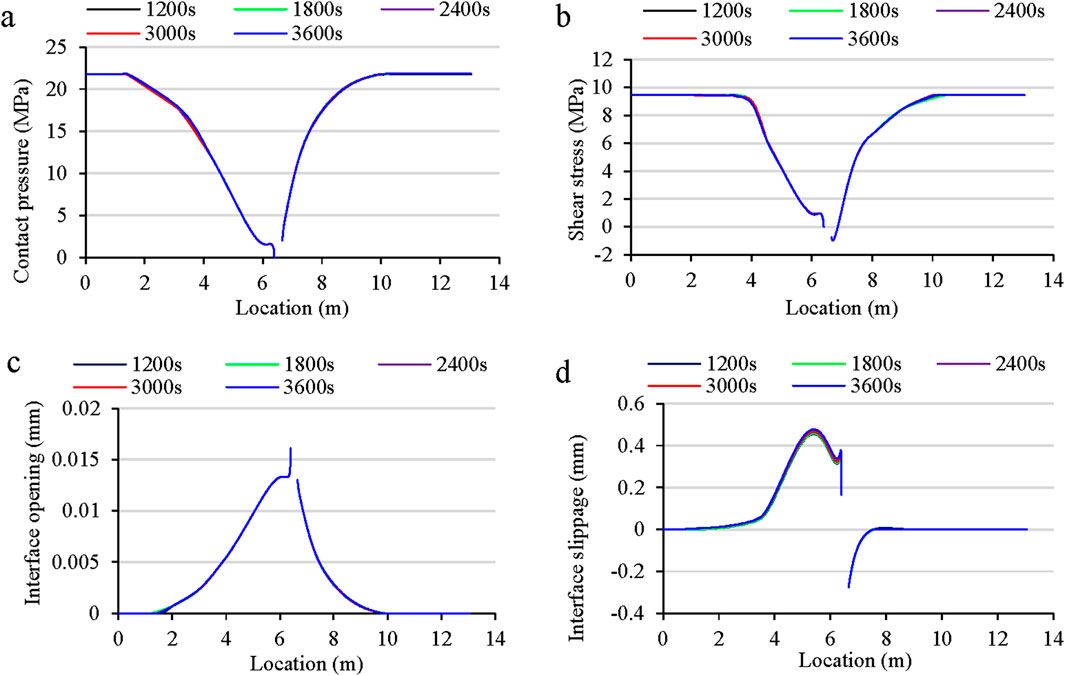
Figure 14. The impact of fluid injection rate on (a) interface contact pressure, (b) interface shear stress, (c) interface opening and (d) interface slippage.
The interface slip caused by fracturing can be reduced by using fracturing fluids of different viscosity. Water, slick water, guar gum and supercritical CO2 are commonly used as fracturing fluids in shale reservoir development, based on the lithological parameters in Table 2 and the stress state in Figure 6, the breaking pressure and expansion pressure for different fracturing fluids were calculated by the cohesive element model. For different fracturing fluid viscosities (water: 1.0 × 10⁻³ Pa·s, slick water: 6.0 × 10⁻³ Pa·s, guar gum: 2.0 × 10⁻² Pa·s, supercritical CO2: 0.05 × 10⁻³ Pa·s), the breaking pressure and expansion pressure increase with fluid viscosity (Figure 15).
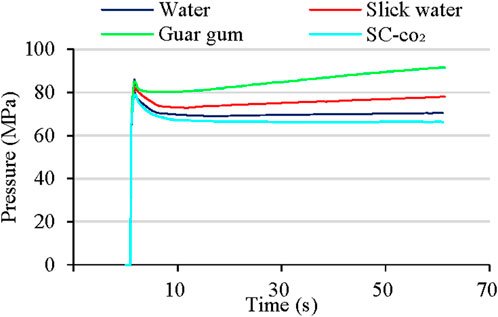
Figure 15. The breaking pressure and expansion pressure of the reservoir corresponding to different fracturing fluids.
Figure 16 illustrates the mechanical response characteristics of the formation interface after fracturing with different fracturing fluids. The results indicate that although the breaking pressure and expansion pressure of the reservoir are lower for low viscosity fracturing fluid (supercritical CO2, water). The strong diffusion significantly increases the range of induced stress and interface opening (Figures 16a–c), resulting in a maximum slip distance of 0.63 mm after supercritical CO2 fracturing (Figure 16d). When the high viscosity guar gum fracturing fluid is used, the breaking pressure and expansion pressure of the reservoir are significantly increased, but the corresponding lower permeability hinders the fluid diffusion and reduces the extent of formation interface opening. The maximum slip distance of formation interface (0.16 mm) occurs at the wellbore. Thus, the interface slip distance is negatively correlated with the fracturing fluid viscosity.
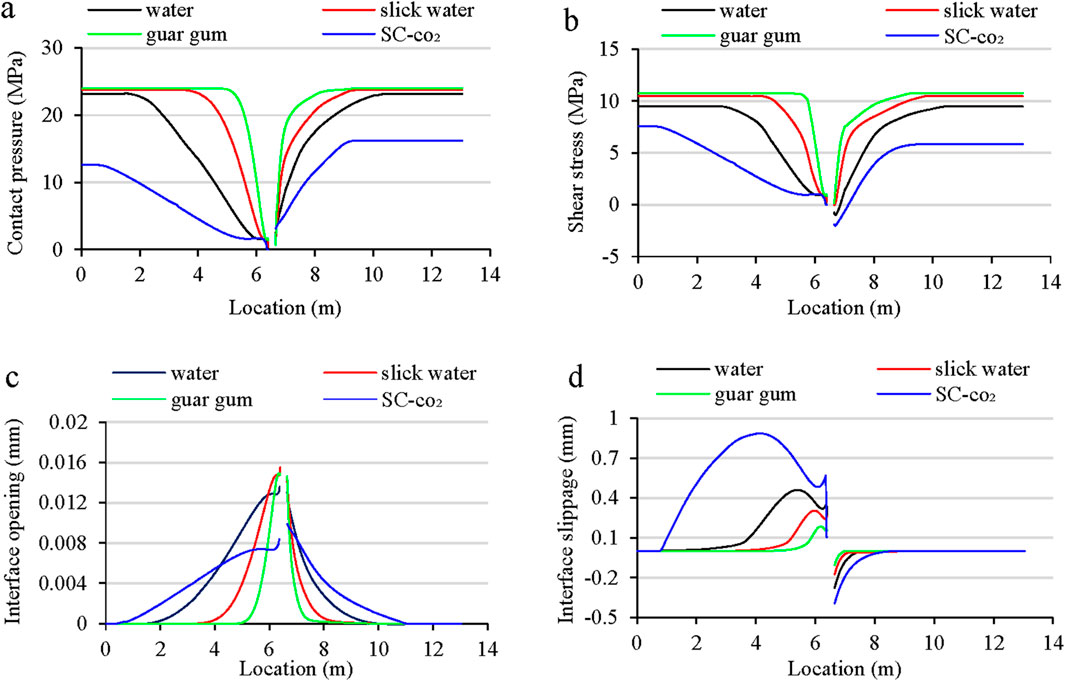
Figure 16. The impact of fracturing fluid type on (a) interface contact pressure, (b) interface shear stress (c) interface opening and (d) interface slippage.
The pore pressure and slip distance variation with time are shown in Figure 17. Interface slip caused by the injection of low viscosity fracturing fluid (supercritical CO2, water) occurs during the initial fracturing stage (0–1,200 s), while the slip caused by the injection of guar gum fracturing fluid runs through the entire fracture initiation and propagation stage. Although high viscosity fracturing fluid (guar gum) corresponds to higher expansion pressures, the slip distance at the formation interface is smaller after fracturing. Therefore, multi-stage fracturing technology could be adopted at intersection of the horizontal well and the discontinuities. Low viscosity fracturing fluid is suggested in the early stages of fracturing to reduce the breaking pressure while creating fractures efficiently. In the later stages, high viscosity fracturing fluid could be adopted to carry proppant while effectively restricting the interface slip distance, further reducing the risk of casing failure.
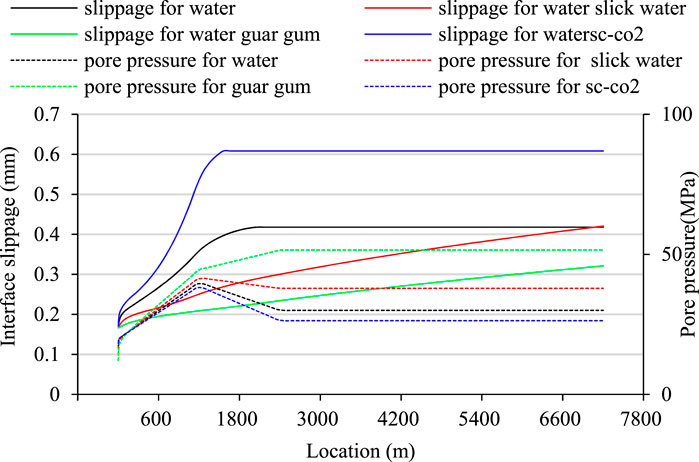
Figure 17. The pore pressure and slip distance at the wellbore corresponding to different fracturing fluids.
The method used in this study assumes constant interfacial friction coefficient and permeability. However, as fluid is injected and the interface slides, the friction coefficient decreases to a dynamic friction coefficient, which is velocity-dependent. Under drainage conditions, the increase in pore water pressure near the interface leads to a decrease in effective stress, resulting in an increase in permeability due to the stress sensitivity of the rock. Furthermore, if the clearance becomes negative during the interface sliding process, the contact pressure will increase exponentially. In this study, the geological interfaces are mainly in an open state, and this process is not considered.
This study establishes a conceptual model for typical shale gas wells in the Weiyuan Block of the Sichuan Basin. Although most of the casing deformation in shale occurs in the horizontal well section, its deformation mechanism is the same as that of the model in Section 3, the conclusions drawn in this paper are applicable to shale reservoirs. In reality, significant anisotropy can be observed near the formation interfaces, and the reservoir rocks can experience hydration damage and alteration of their elastic-plastic parameters under the influence of drilling and fracturing fluids. These complex mechanisms will be further investigated in our future work to develop a constitutive model for hydration damage and to discuss its implications on interface sliding characteristics.
During actual well drilling and construction, when the wellbore trajectory has been designed, the construction parameters that can be optimized include only the fluid injection rate, fracturing fluid viscosity, fracturing fluid volume, and proppant type. The results of this study indicate that reducing interfacial activity can be achieved by optimizing the viscosity of the fracturing fluid. Compared to conventional fracturing methods, it is recommended reducing the proportion of pad and appropriately increase the viscosity of the slurry in geological interface and natural fracture development zones. Based on the site geology and construction conditions, the proportions of pad and slurry can be further quantified, thus providing precise guidance for on-site operations.
6 Conclusion
In this study, we have developed a 3D hydro-mechanical coupling model incorporating a discontinuous medium to investigate the mechanical responses of the formation interface during drilling and fracturing operations. The key conclusions drawn from our research are as follows:
1. Interface slip predominantly occurs during the fracturing stage, and the presence of an interface dip angle and varying rock permeability on both sides of the interface results in an asymmetric distribution of slip around the wellbore. The overpressure generated during the fracturing process caused the contact stress at the interface decrease to 0 MPa, indicating that tensile stress generated at the wellbore can induce the opening of the interface.
2. The slip distance exhibits a positive correlation with rock permeability. It initially increases and then decreases with an increasing dip angle of the formation interface. Conversely, it initially decreases and then increases with an increasing stress difference. The location of maximum slip is significantly influenced by the dip angle of the formation.
3. The fluid pumping rate has a limited influence on the interface slip distance. While low viscosity fluids reduce the breaking pressure and expansion pressure of the reservoir, their high diffusion lead to an increased range of induced stress, enlarging the distance and range of interface slip. Conversely, the use of high viscosity fluids tends to result in smaller opening ranges and slip distances after fracturing.
4. We propose a multi-stage fracturing strategy to minimize interface slip. Specifically, we recommend employing low viscosity fracturing fluids in the early stages of fracturing to reduce breaking pressure and efficiently create fractures. In later stages, high viscosity fracturing fluids can be utilized to restrict the interface slip distance, further mitigate the risk of casing failure.
Data availability statement
The original contributions presented in the study are included in the article/supplementary material, further inquiries can be directed to the corresponding author.
Author contributions
HQ: Conceptualization, Writing – original draft. GZ: Investigation, Writing – original draft. XW: Writing – original draft, Writing – review and editing. GC: Methodology, Writing – review and editing. TL: Software, Writing – review and editing. WW: Project administration, Writing – review and editing. YD: Data curation, Writing – review and editing. HT: Software, Writing – review and editing.
Funding
The author(s) declare that financial support was received for the research and/or publication of this article. This work was supported by the National Natural Science Foundation of China (NSFC) under Grant No. 51809220 and CNPC Xinjiang Oilfield Company (Study on Fracture Coupling Mechanisms, Interference Patterns, and Preventive Measures in Horizontal Wells of Jimsar Shale Oil). The funder was not involved in the study design, collection, analysis, interpretation of data, the writing of this article, or the decision to submit it for publication.
Conflict of interest
Authors HQ, GZ, GC, and WW were employed by CNPC Xinjiang Oilfield Company.
The remaining authors declare that the research was conducted in the absence of any commercial or financial relationships that could be construed as a potential conflict of interest.
The reviewer QL declared a shared affiliation with the author HQ to the handling editor at time of review.
Generative AI statement
The author(s) declare that no Generative AI was used in the creation of this manuscript.
Publisher’s note
All claims expressed in this article are solely those of the authors and do not necessarily represent those of their affiliated organizations, or those of the publisher, the editors and the reviewers. Any product that may be evaluated in this article, or claim that may be made by its manufacturer, is not guaranteed or endorsed by the publisher.
References
Buijze, L., Guo, Y., Niemeijer, A. R., Ma, S., and Spiers, C. J. (2021). Effects of heterogeneous gouge segments on the slip behavior of experimental faults at dm scale. Earth Planet. Sci. Lett. 554, 116652. doi:10.1016/j.epsl.2020.116652
Carter, R. D. (1957). “Derivation of the general equation for estimating the extent of the fractured area,” in Appendix to optimum fluid characteristics for fracture extension [R]. Washington DC: AmericanPetroleum Institute, 261–270.
Celleri, H. M., and Sánchez, M. (2024). Hydraulic fracture propagation barriers induced by weak interfaces in anisotropic rocks. Int. J. Numer. Anal. Methods Geomechanics 45 (14), 2155–2173. doi:10.1002/nag.3260
Chaowei, C., and Degui, X. (2022). Integrated prevention and control technology of casing deformation in shale gas development in Sichuan Basin. Petroleum Explor. China 27 (01), 135–141. doi:10.3969/j.issn.1672-7703.2022.01.013
Chaowei, C., Hu, C., and Xiaojin, Z. (2020). Correlation between casing deformation and fracture zone of shale gas wells in Changning Block, Sichuan Basin. Nat. gas Explor. Dev. 43 (04), 123–130. doi:10.12055/gaskk.issn.1673-3177.2020.04.015
Chaowei, C., Rui, H., Bo, Z., Yi, S., and Xiaojin, Z. (2021). Optimization analysis of construction parameters of casing deformation wells in Changning shale gas block, Sichuan Basin. Pet. Drill. Technol. 49 (01), 93–100. doi:10.11911/syztjs.2020108
Charlez, P. A. (1991). Rock Mechanics: Petroleum application [M]. Second. Paris: Technical Publisher.
Chen, H. Y., Teufel, L. W., and Lee, R. L. (1995). “Coupled fluid flow and geomechanics in reservoir study-I. Theory and governing equations [R],” in SPE annual technical conf. And exhibition. Richardson,TX: Society of Petroleum Engineers.
Crouch, S. L. (1976). Solution of plane elasticity problems by the displacement discontinuity method. I. Infinite body solution. Int. J. Numer. Methods Eng. 124 (7), 7354–7369. doi:10.1002/nme.1620100206
Di Toro, G., Hirose, T., Nielsen, S., Pennacchioni, G., and Shimamoto, T. (2006). Natural and experimental evidence of melt lubrication of faults during earthquakes. Science 311 (5761), 647–649. doi:10.1126/science.1121012
Eyinla, D. S. (2022). Modelling of fault reactivation mechanisms and associated induced seismicity in rocks with different elastic materials. Petroleum Res. 7 (1), 91–105. doi:10.1016/j.ptlrs.2021.07.001
Fan, Z., Eichhubl, P., and Newell, P. (2019). Basement fault reactivation by fluid injection into sedimentary reservoirs; poroelastic effects. J. Geophys. Res. Solid earth 124 (7), 7354–7369. doi:10.1029/2018jb017062
Fengshou, Z., Yin, Z., Chen, Z., Maxwell, S., Zhang, L., and Wu, Y. (2020). Fault reactivation and induced seismicity during multistage hydraulic fracturing: microseismic analysis and geomechanical modeling. SPE J. 25 (2), 692–711. doi:10.2118/199883-pa
Giorgetti, C., Tesei, T., Scuderi, M. M., and Collettini, C. (2019). Experimental insights into fault reactivation in gouge-filled fault zones. J. Geophys. Res. Solid Earth 124 (4), 4189–4204. doi:10.1029/2018jb016813
Haddad, M., and Eichhubl, P. (2020). Poroelastic models for fault reactivation in response to concurrent injection and production in stacked reservoirs. Geomechanics Energy Environ. 24, 100181. doi:10.1016/j.gete.2020.100181
Han, L., Yin, F., Yang, S., Liu, W., and Deng, Y. (2019). Coupled seepage-mechanical modeling to evaluate formation deformation and casing failure in waterflooding oilfields. J. Petroleum Sci. Eng. 180, 124–129. doi:10.1016/j.petrol.2019.05.035
Hayward, K. S., and Cox, S. F. (2017). Melt welding and its role in fault reactivation and localization of fracture damage in seismically active faults. J. Geophys. Res. Solid Earth 122 (12), 9689–9713. doi:10.1002/2017jb014903
He, M., Li, Q., and Li, X. (2022). A new simulator for hydromechanical coupling analysis of injection-induced fault activation. Geomechanics Geophys. Geo-Energy Geo-Resources 8 (2), 43. doi:10.1007/s40948-022-00353-x
Hejuan, L., Rongchen, T., Zhengmeng, H., Bin, D., Haijun, M., and Guangtan, H. (2022). Summary of earthquake induced by underground fluid injection and its influence on geothermal development of deep high temperature rock mass. Eng. Sci. Technol. 54 (01), 83–96. doi:10.15961/i.isuese.202100612
Hongwei, C., Chun, F., Haixiang, W., Haixia, Z., and Guimei, X. (2002). Casing damage geological factor analysis and control technology. Oil Drill. Prod. Technol. (2), 25–27. doi:10.13639/j.odpt.2002.02.009
Huang, R., Chen, Z., Zeng, B., Song, Y., and Zhou, X. (2020). Casing deformation caused by hydraulic fracturing-induced fault slip in Sichuan Basin and optimization of treatment parameters. IOP Conf. Ser. Earth Environ. Sci. 570 (2), 022057. doi:10.1088/1755-1315/570/2/022057
Hui, G., Shengnan, C., and Fei, G. (2021). Fluid-geomechanics coupling modeling characterizes hydraulic fracturing-induced earthquakes: a case study of Fox Creek, Canada. Chin. J. Geophys. 64 (03), 864–875. doi:10.6038/cjg2021O0267
Ji, Y., Hofmann, H., Duan, K., and Zang, A. (2022). Laboratory experiments on fault behavior towards better understanding of injection-induced seismicity in geoenergy systems. Earth-Science Rev. 226, 103916. doi:10.1016/j.earscirev.2021.103916
Ji, Y., Wanniarachchi, W. A. M., and Wu, W. (2020). Effect of fluid pressure heterogeneity on injection-induced fracture activation. Comput. Geotechnics 123, 103589. doi:10.1016/j.compgeo.2020.103589
Ji, Y., and Wu, W. (2020). Injection-driven fracture instability in granite: mechanism and implications. Tectonophysics 791, 228572. doi:10.1016/j.tecto.2020.228572
Jun, L., Chaojie, Z., Gonghui, L., Hui, Z., Xin, Z., and Kai, R. (2021). Fault slip and its influencing factors under shale gas fracturing conditions. J. China Univ. Petroleum 45 (2), 63–70. doi:10.3969/i.issn.1673-5005.2021.02.007
Kilgore, B., Beeler, N. M., Lozos, J., and Oglesby, D. (2017). Rock friction under variable normal stress. J. Geophys. Res. Solid Earth 122 (9), 7042–7075. doi:10.1002/2017jb014049
Li, F., Kai, D., Pan, F., Lei, Q., Weiqianga, D., and Qinghua, S. (2019). Prediction and control of casing damage in large volume fracturing of horizontal gas wells. Nat. Gas. Ind. 39 (4), 69–75. doi:10.3787/j.issn.1000-0976.2019.04.009
Li, Q., Wu, J., Li, Q., Wang, F., and Cheng, Y. (2025). Sediment instability caused by gas production from hydrate-bearing sediment in northern South China Sea by horizontal wellbore: sensitivity analysis. Nat. Resour. Res. 34 (3), 1667–1699. doi:10.1007/s11053-025-10478-x
Liangjie, M., Haoyu, L., Xingying, Y., and Yang, M. (2021). Effect of fault slip in shale gas reservoir on casing deformation of horizontal well. Fault-Block Oil Gas Field 28 (06), 755–760. doi:10.6056/dkyqt202106007
Liu, D. (2020). A numerical method for analyzing fault slip tendency under fluid injection with XFEM. Acta Geotech. 15 (2), 325–345. doi:10.1007/s11440-019-00814-w
Proctor, B., Lockner, D. A., Kilgore, B. D., Mitchell, T. M., and Beeler, N. M. (2020). Direct evidence for fluid pressure, dilatancy, and compaction affecting slip in isolated faults. Geophys. Res. Lett. 47 (16). doi:10.1029/2019gl086767
Qiang, L., Qingchao, L., Fuling, W., Ning, X., Yanling, W., and Baojun, B. (2025). Settling behavior and mechanism analysis of kaolinite as a fracture proppant of hydro carbon reservoirs in CO2 fracturing fluid. Colloid. Surface. A. 724, 137463. doi:10.1016/j.colsurfa.2025.137463
Qing, D., Haoyu, L., Chunyu, C., Wei, Z., and Yang, M. (2022). Analysis of the influence of hydraulic fracturing on casing deformation of horizontal wells in shale gas wells. Mach. Des. Res. 38 (03), 118–121+126. doi:10.13952/j.cnki.jofmdr.2022.0164
Scuderi, M. M., Collettini, C., and Marone, C. (2017). Frictional stability and earthquake triggering during fluid pressure stimulation of an experimental fault. Earth Planet. Sci. Lett. 477, 84–96. doi:10.1016/j.epsl.2017.08.009
Segall, P., and Lu, S. (2015). LuInjection-induced seismicity: poroelastic and earthquake nucleation effects. J. Geophys. Res. Solid Earth 120 (7), 5082–5103. doi:10.1002/2015jb012060
Sheng, M., Li, P., Zhuang, X., and Wang, J. (2020). Influence of cyclic normal stress on shear friction of EGS granite fractures. Eng. Fract. Mech. 238, 107268. doi:10.1016/j.engfracmech.2020.107268
Wang, L., Kwiatek, G., Rybacki, E., Bonnelye, A., Bohnhoff, M., and Dresen, G. (2020). Laboratory study on fluid-induced fault slip behavior: the role of fluid pressurization rate. Geophys. Res. Lett. 47 (6), 1–12. doi:10.1029/2019gl086627
Wu, S., Gao, Ke, Huang, X., and Huang, X. (2022). Influence of slip and permeability of bedding interface on hydraulic fracturing: a numerical study using combined finite-discrete element method. Comput. Geotechnics 148, 104801. doi:10.1016/j.compgeo.2022.104801
Xi, Y., Li, J., Liu, G., Cha, C., and Fu, Y. (2018). Numerical investigation for different casing deformation reasons in Weiyuan-Changning shale gas field during multistage hydraulic fracturing. J. petroleum Sci. and Eng. 163, 691–702. doi:10.1016/j.petrol.2017.11.020
Xing, T., Zhu, W., French, M., and Belzer, B. (2019). Stabilizing effect of high pore fluid pressure on slip behaviors of gouge-bearing faults. J. Geophys. Res. Solid Earth 124 (9), 9526–9545. doi:10.1029/2019jb018002
Xueli, G., Jun, L., Gonghui, L., Chaowei, C., Kai, R., and Dongfeng, L. (2018). Casing deformation mechanism of shale gas fracturing wells based on focal mechanism. Fault-Block Oil Gas Field 25 (05), 665–669. doi:10.6056/dkyqt201805026
Yan, W., Zou, L., Li, H., Deng, J., and Wang, H. (2017). Investigation of casing deformation during hydraulic fracturing in high geo-stress shale gas play. J. Petroleum Sci. Eng. 150, 22–29. doi:10.1016/j.petrol.2016.11.007
Yin, F., Deng, Y., He, Y., Gao, D., and Hou, B. (2018b). Mechanical behavior of casing crossing slip formation in waterflooding oilfields. J. petroleum Sci. and Eng. 167, 796–802. doi:10.1016/j.petrol.2017.12.069
Yin, F., Han, L., Yang, S., Deng, Y., He, Y., and Wu, X. (2018a). Casing deformation from fracture slip in hydraulic fracturing. J. Petroleum Sci. Eng. 166, 235–241. doi:10.1016/j.petrol.2018.03.010
Zhang, X., Li, J., Zhang, H., Han, M., and Han, L. (2021). Analysis of casing deformation failure mechanism based on fault slip. Eng. Fail. Anal. 127, 105430. doi:10.1016/j.engfailanal.2021.105430
Keywords: frictional slip, hydraulic fracturing, formation interface, hydromechanical coupling, mitigation strategies
Citation: Qi H, Zheng G, Wei X, Chen G, Liu T, Wang W, Ding Y and Tang H (2025) Mechanical responses and mitigation strategies for formation interface slippage during well drilling and hydraulic fracturing. Front. Earth Sci. 13:1626878. doi: 10.3389/feart.2025.1626878
Received: 12 May 2025; Accepted: 26 June 2025;
Published: 25 July 2025.
Edited by:
Qingchao Li, Henan Polytechnic University, ChinaReviewed by:
Xiaying Li, Chinese Academy of Sciences (CAS), ChinaQiang Li, China University of Petroleum Beijing, China
Shaobin Hu, Hohai University, China
Copyright © 2025 Qi, Zheng, Wei, Chen, Liu, Wang, Ding and Tang. This is an open-access article distributed under the terms of the Creative Commons Attribution License (CC BY). The use, distribution or reproduction in other forums is permitted, provided the original author(s) and the copyright owner(s) are credited and that the original publication in this journal is cited, in accordance with accepted academic practice. No use, distribution or reproduction is permitted which does not comply with these terms.
*Correspondence: Xiaochen Wei, YWNoZW5jdW10QDE2My5jb20=