 Wenhai Kou1
 Jiahao Zhai
- 1School of Physical Education and Health Engineering, Taiyuan University of Technology, Taiyuan, China
- 2Research Center for Socialism with Chinese Characteristics, Xiamen University, Xiamen, China
- 3School of Geography and Ocean Science, Nanjing University, Nanjing, China
As a key emerging pillar, the sports industry plays a significant role in promoting the high-quality development of regional and national economies. However, research on the spatial distribution characteristics of sports venues is insufficient, particularly when considering population size and density. This study focuses on the six provinces in central China, examining the spatial distribution features of sports venues and the balance in service population coverage. Using point of interest (POI) data for sports venues, the seventh national census data, and population density data, this study employs GIS spatial analysis methods such as mean nearest neighbor distance, kernel density estimation, and overlay analysis. The findings reveal that sports venues in the six central provinces exhibit a pattern of high-density clustering in provincial capital. The spatial distribution of sports venues is most influenced by permanent population and GDP, while showing little correlation with land area. Most of these facilities are concentrated in areas with high population densities, particularly in the capital cities. However, the current distribution of sports venues in many cities across the six provinces does not adequately meet the needs of the local population. To address this imbalance, it is recommended that the number and placement of sports facilities in the six central provinces should fully account for the distribution and density of the local population. While prioritizing development in provincial capitals, efforts should also be made to accelerate the construction of sports venues in sub-high-density core areas, especially in economically underdeveloped cities. Furthermore, the development of sports venues in towns and townships should be leveraged to promote local leisure sports and sports tourism.
1 Introduction
Sports venues, as spatial carriers of sports events and foundational infrastructure for the sports industry, play a pivotal role in advancing national fitness campaigns, fostering public health, and driving regional economic growth (Miller, 2002). In China, the sports industry has emerged as a strategic pillar under the “Healthy China 2030″ initiative, with its economic contribution exceeding 1 trillion yuan in 2022, accounting for 1.1% of the GDP. However, despite rapid urbanization and infrastructure expansion, the spatial distribution of sports facilities remains uneven, exacerbating disparities in access to fitness resources between the urban and rural populations. This imbalance not only undermines the equitable development goals outlined in China’s 14th Five-Year Plan but also contradicts the global agenda for Sustainable Development Goal 11 (SDG 11), which emphasizes inclusive and accessible public spaces. The distribution and construction of sports venues are closely related to the deep integration of national fitness and national health initiatives as well as the smooth implementation of the major strategy to build a strong sports nation (Lyu, 2024; Lindlacher and Pirich, 2025). Against the backdrop of China’s economy entering a “new normal,” the sports industry’s development trend continues to show promising prospects (Duan et al., 2022; Tang, 2022). However, issues of unbalanced and insufficient development in the sports industry remain relatively prominent.
Existing research on sports venues has predominantly focused on operational efficiency, economic impact assessments, and sustainable design (Abbiasov and Sedov, 2023; Giri et al., 2024). For instance, studies in Europe and North America have quantified the “stadium effect” on local employment and tourism; however, such analyses often neglect spatial equity considerations. (Jones, 2002; Giri et al., 2024). Within the Chinese context, research has emphasized the post-event utilization of Olympic venues or the integration of sports venues with commercial real estate (Zhu et al., 2020; Yuan et al., 2023). A critical gap persists in understanding how sports venues are geographically distributed relative to population dynamics, particularly in transitioning regions where urbanization and rural revitalization intersect. This oversight is problematic, given that spatial mismatches between facilities and populations can perpetuate social inequities, limit the efficacy of national fitness policies, and hinder the sports industry’s potential to stimulate balanced regional development. Little attention has been paid to the spatial distribution characteristics of sports venues at large regional scales. Moreover, research that links the spatial distribution of sports venues to local population size or density is even more inadequate. With the rapid advancement of sports stadium construction, the scientific and reasonable planning and layout of sports venues has become a problem that needs to be solved. The spatial distribution of sports venues is not only affected by various factors, such as urban planning, economic development level, and population density (Jones, 2002; Dal and Akdag, 2011; Huang, 2017; Baumann and Bradbury, 2024), but is also closely related to regional social culture, transportation convenience, and the natural environment (Redhead, 2007; Bonser et al., 2020; Guo and Sun, 2024; Schallhorn et al., 2024).
The central region of China, comprising six provinces (Shanxi, Henan, Hubei, Hunan, Anhui, and Jiangxi), serves as a strategic focus for this study due to its unique socioeconomic and geographic significance. Beyond its substantial population size (364 million, 22.8% of China’s total), this region represents a critical transitional zone between China’s developed eastern coast and underdeveloped western interior, making it a microcosm of the nation’s urbanization and regional development challenges. The area’s rapid GDP growth (averaging 6.3% annually from 2020 to 2023) and its pivotal role in China’s “Rise of Central China” strategy further highlight its importance for infrastructure planning. However, stark disparities exist: provincial capitals like Wuhan and Zhengzhou concentrate over 40% of their provinces’ stadiums, while prefecture-level cities and rural areas face severe shortages. This urban-rural divide in sports infrastructure mirrors broader regional inequalities and directly impacts the effectiveness of national fitness policies. (Zhao et al., 2022; Lyu, 2024). By examining this region, our study provides insights into spatial equity challenges that are relevant to both developing and developed contexts, while also addressing a critical gap in research on large-scale regional distribution patterns of sports facilities.
In recent decades, China has experienced rapid stadium construction driven by the successive hosting of the 2008 Beijing Summer Olympics and the 2022 Beijing Winter Olympics (Guo, 2020; Zhu et al., 2020; Yuan et al., 2023). Landmark events have significantly accelerated the pace of stadium construction nationwide. However, the developmental disparities between different regions remain unclear (Zhao et al., 2022). The urgency to address these spatial inequities has been amplified by two recent policy shifts. First, China’s post-pandemic emphasis on “domestic circulation” prioritizes grassroots sports consumption, necessitating facilities that cater to diverse demographics. Second, the 2022 revision of the National Fitness Regulations mandates that local governments optimize sports resource allocation based on population distribution, a directive that remains poorly implemented in practice. As a transitional zone in China that bridges the east and west and connects the north and south, the central region holds strategic importance for the rise of national sports industry. What are the spatial distribution characteristics of sports venues in the central region? Is the number of sports venues in each area proportional to local population? Which regions are urgently needed for new sports venues? These pressing questions require answers.
To address these questions, this study employed a geospatial lens that integrates POI data, census statistics, and population density mapping. By adopting methodologies such as kernel density estimation and overlay analysis, we transcended conventional descriptive approaches to quantify spatial mismatches and identify priority areas for intervention. The findings aim to inform evidence-based policymaking, ensuring that stadium construction aligns with the dual objectives of economic efficiency and social equity. Ultimately, this research contributes to broader debates on inclusive urbanization by offering a replicable framework for spatial justice in infrastructure planning across emerging economies.
2 Data and methods
2.1 Data sources
The data used in this paper mainly include sports stadium POI data, population size data, and population density data, which were visualized using Arcgis 10.8 software (Figure 1). The sports stadium POI data are generated by crawling the Gaode map, which mainly includes stadium types such as comprehensive stadiums, soccer stadiums, ski resorts, swimming pools, basketball stadiums, table tennis stadiums, and badminton stadiums, which contain the name, latitude, longitude, and other information, and the year 2020. It is important to note that the sports venues referenced in this study do not include those affiliated with schools, government agencies, or other organizations. The population numbers of provinces and cities come from the seventh national population census, which was compiled from the official websites of local municipal statistics bureaus, and the census time node is 1 November 2020. The population density data were derived from the WorldPop (www.worldpop.org) Global High Resolution Population Program project, and the data were the estimated total number of people per grid cell. The dataset can be downloaded in the Geotiff format with a resolution of 1 km × 1 km, which is the geographic coordinate system WGS 1984, and the unit is the number of people per pixel. The WorldPop data are based on nighttime light data, land use data, distance factors to various land use types, and elevation information. The weighting layers of population distribution are estimated by the random forest model, and zonal density mapping is then utilized to spatialize the population. To ensure matching between the POI and census data, the download year was 2020.
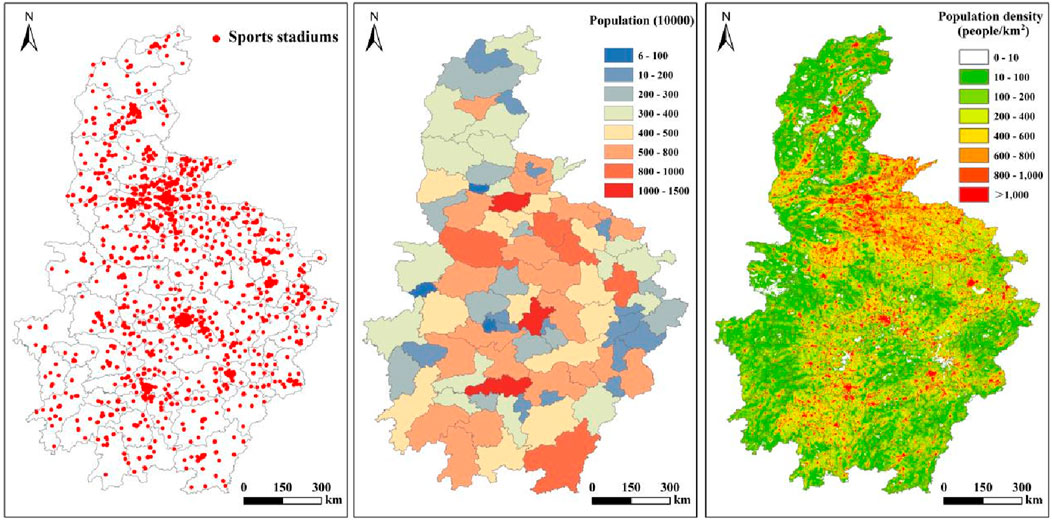
Figure 1. Sports venues, population size, population density in central China.
2.2 Methods
2.2.1 Nearest neighbor analysis
Nearest Neighbor Analysis (NNA) can be used to determine whether sports venues are characterized by clustered or dispersed distribution within the six central provinces. It reveals the spatial distribution hierarchy of point elements by comparing the actual nearest neighbor distance and the theoretical nearest neighbor distance between point elements in space (Nie et al., 2023). The calculation formula is expressed as shown in Equations 1, 2:
where R is the nearest-neighbor index,
Where:
where A is the area of the region, n is the number of sports venues. When R = 1, the point elements are characterized by a random distribution; when R < 1, the point elements are characterized by an agglomeration distribution; when R > 1, the point elements are characterized by a uniform distribution.
2.2.2 Kernel density estimation
Kernel density analysis, that is, Kernel Density Estimation (KDE), is a commonly used method for characterizing the distribution of research elements in the overall spatial density, which can clearly reflect the aggregation of research elements from the layers (Zhang et al., 2022). The larger the kernel density estimation, the more aggregated the spatial distribution of sports venues and the higher the probability of regional events. The calculation formula is expressed as shown in Equation 3:
Where:
2.2.3 Overlay analysis
Overlay analysis integrates the information of two or more layers into a new layer using the overlay fusion method and analyzes the correlation relationship between the elements through a comprehensive comparison of the elements in different layers (Zhai et al., 2022). In this study, the geographic location information layer of sports venues in six central provinces was overlaid with the WorldPop population density layer to compare and analyze the distribution differences of sports venues in different population density areas.
2.2.4 GeoDetector
As a tool for detecting spatial heterogeneity and revealing underlying drivers, Geodetector eliminates concerns about predictor multicollinearity and substantially reduces endogeneity bias caused by feedback loops between explanatory and response variables (Kou and Zhai, 2025; Xiao et al., 2025). We utilize its factor detector functionality to analyze the determinants of sports venues’ spatial distribution patterns. The calculation formula is expressed as shown in Equation 4:
Where: q denotes the indicator of influence detection of the explanatory variables; Ni and N denote the number of samples in the sub-level region and the number of samples in the whole region, respectively; L represents the number of sub-regions; σ2 and
3 Results
3.1 Spatial distribution characteristics of sports venues in central China
From the overall scale of central China, ArcGIS 10.8 was used to analyze the average nearest neighbors of the sports venues in the six central provinces and obtained the results: the average observed distance was 1999.5122 m, the expected average distance was 9,383.8364 m, the closest neighbor ratio R was 0.2131, and the Z score was −101.8367 with a significance level of p < 0.01, which indicates that the sports venues in the six central provinces showed a clear spatial distribution of agglomeration.
Then, the spatial clustering characteristics of the sports venues were analyzed through kernel density mapping (Figure 2). From the figure, it can be clearly seen that the sports venues in the six central provinces are all in provincial capital cities (Taiyuan, Zhengzhou, Wuhan, Changsha, Hefei, and Nanchang), presenting the characteristics of high-density agglomeration. However, there are also differences in the high-density core areas, with Zhengzhou and Wuhan having significantly larger high-density core areas, Changsha and Hefei being the next largest, and Taiyuan and Nanchang having relatively smaller high-density core areas compared to the other provincial capitals. In addition, more pronounced high-density cores were also found in Luoyang and Xinxiang, Henan Province, near provincial capitals.
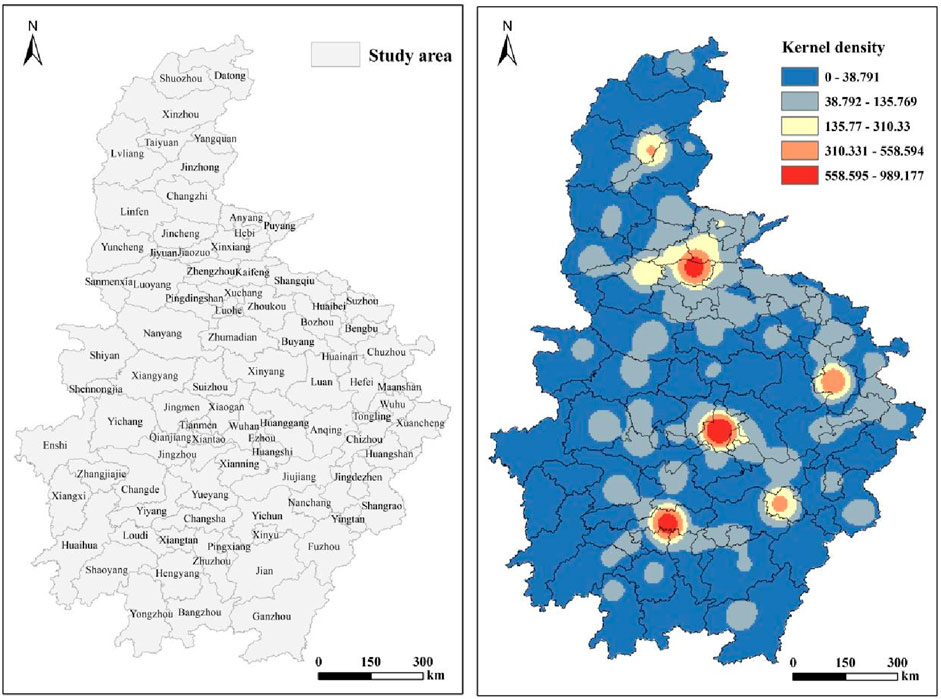
Figure 2. Kernel density of sports venues in central China.
To explore the differences in the distribution characteristics of sports venues at the provincial level, kernel density mapping was performed by province (Figure 3). It can be seen that Shanxi Province presents highly dense characteristics, with Taiyuan, the provincial capital, followed by Changzhi City as the most densely distributed prefecture-level city of sports venues. Comparatively, Shuozhou, Xinzhou, Luliang, and Yangquan have lower kernel density values for sports venues. Henan Province presents the basic characteristics of Zhengzhou City as the high-density core area, and Luoyang City and Xinxiang City as the second high-density core area. Spatial differences from other cities are obvious. In Puyang City, Xinyang City, Luohe City, Zhoukou City, and Zhumadian City, the spatial distribution of sports venues in the distribution of the characteristics of spatial agglomeration is less obvious than in other cities, especially Sanmenxia City, which did not show the obvious characteristics of agglomeration. Hubei Province presents the basic characteristics of Wuhan as a high-density core area, and Xiangyang City, Yichang City, and Jingzhou City also show more obvious agglomeration characteristics. In Suizhou, Huanggang, Tianmen, Qianjiang, Xiantao, Enshi Tujia, and Miao Autonomous Prefecture, sports venues are relatively less spatially distributed, and the Shennongjia Forestry Area does not exhibit any agglomeration characteristics. In Hunan Province, Changsha has the highest density core area, whereas the sports venues in Xiangtan City, Yueyang City, and Changde City also show more obvious clustering characteristics. In Huaihua City, Chenzhou City, Shaoyang City, Xiangxi Tujia, and Miao Autonomous Prefecture, the clustering characteristics are less obvious, and the concentrated part of the sports venues is more spatially dispersed. The vsports enues in Anhui Province showed the most obvious distribution of clustering in Hefei City, followed by Bengbu City with more obvious clustering characteristics, while the sports venues in the Maanshan and Wuhu Cities also showed some spatial clustering. The sports venues in other cities were less obvious, especially in Lu’an City, Huangshan City, Tongling City, and Xuancheng City. The distribution of sports venues in Jiangxi Province presents Nanchang City as the highest-density core area in Ganzhou City. Jiujiang City and Shangrao City were second. Yingtan City and Fuzhou City are relatively insignificant, and the distribution of sports venues in other cities is characterized by agglomeration.
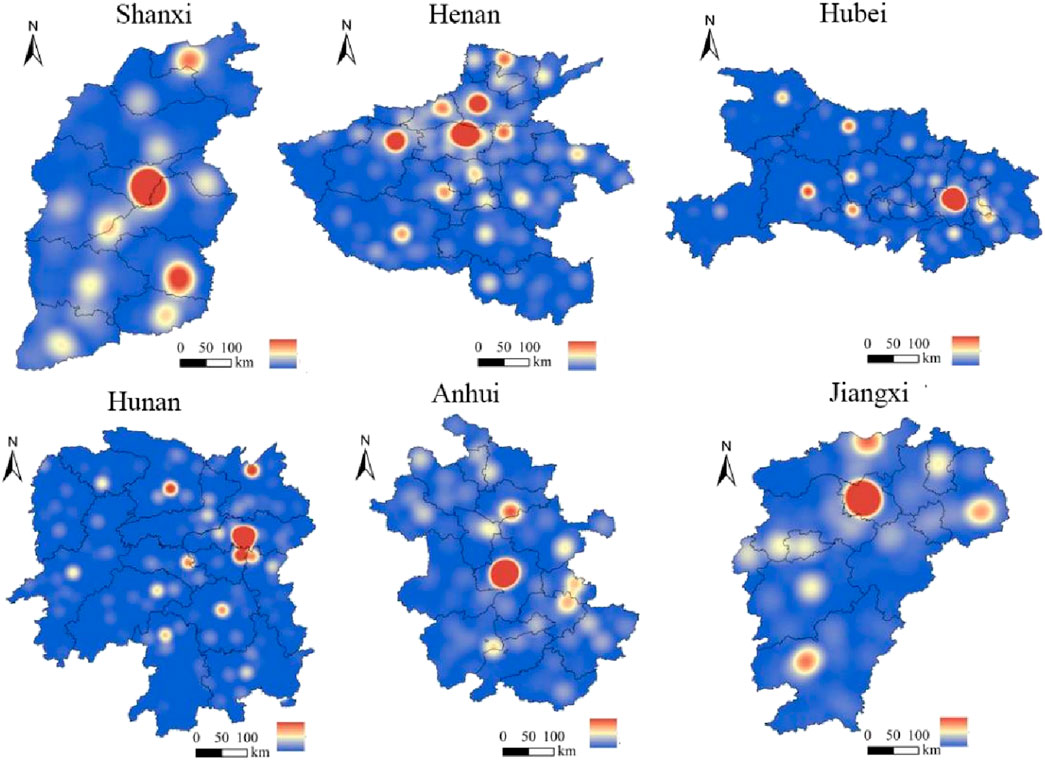
Figure 3. Kernel density of sports venues in different provinces in central China.
It is worth noting that the spatial clustering characteristics of sports venues in all provinces and cities occur within urban areas, while the distribution of sports venues in non-urban counties and remote areas is significantly lower. This indicates that the construction of sports venues is closely related to the level of local economic development. The better the economic development, the more obvious the clustering characteristics of the sports venues, and the opposite is not obvious.
3.2 Analysis of influencing factors of sports venues distribution in central China
Given that the spatial distribution of sports venues is jointly influenced by multiple factors such as policies, economy, and society (Liu et al., 2025). This study selects the following indicators for in-depth analysis: (1) Policy factors: The construction of many sports venues primarily relies on government financial support. Therefore, public fiscal expenditure and administrative level are selected as evaluation indicators. Administrative levels are categorized into provincial capital cities and prefecture-level cities. (2) Economic factors: The development of the sports industry aligns with economic growth and social progress, as economic conditions provide a solid foundation and support for the industry. Hence, GDP and GDP per capita are chosen as assessment indicators. (3) Social factors: Land area and population size influence the demand for sports venues and determine their spatial allocation. Thus, land area and permanent population are selected as measurement indicators. The data for these influencing factors are sourced from provincial and municipal statistical yearbooks, as well as statistical bulletins on national economic and social development.
The Geodetector analysis reveals that there are significant differences in the explanatory power of various influencing factors on the spatial distribution of sports venues in central China (Table 1). Overall, the explanatory power is ranked from highest to lowest as follows: permanent population > GDP > fiscal expenditure > administrative level > GDP per capita > land area.
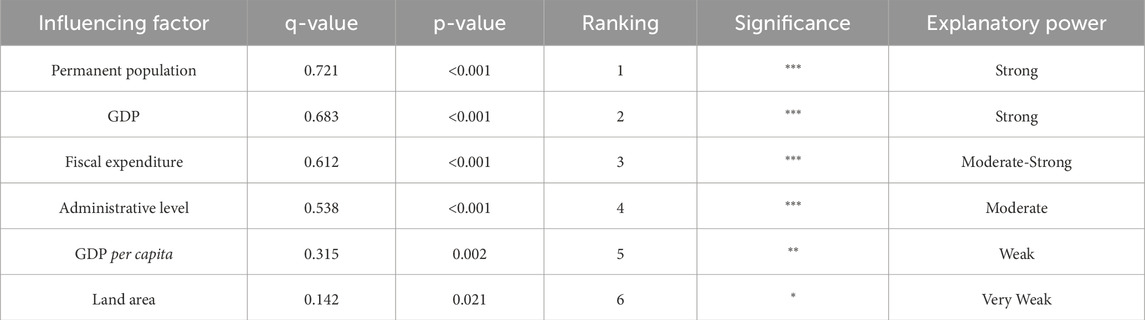
Table 1. Factor detection results of sport venues in central China.
The comprehensive interaction analysis reveals distinct patterns in how factors combine to influence sports venue distribution (Table 2). Permanent population demonstrates particularly strong synergistic relationships, showing nonlinear enhancement effects when interacting with both GDP (q = 0.815) and fiscal expenditure (q = 0.761), indicating these economic and policy factors multiply rather than simply add to permanent population’s influence. The administrative level exhibits bifactor enhancement with permanent population (q = 0.782) and GDP (q = 0.748), suggesting it consistently amplifies these primary drivers through policy advantages in provincial capitals. Notably, GDP and fiscal expenditure also show bifactor enhancement (q = 0.724), revealing coordinated economic-policy dynamics in sports venues development. In contrast, GDP per capita displays independent effects in most interactions (q ≈ 0.6-0.7), operating through different mechanisms than aggregate economic measures. Similarly, land area’s interactions remain relatively weak (q < 0.7), confirming its secondary role from the factor detector analysis.
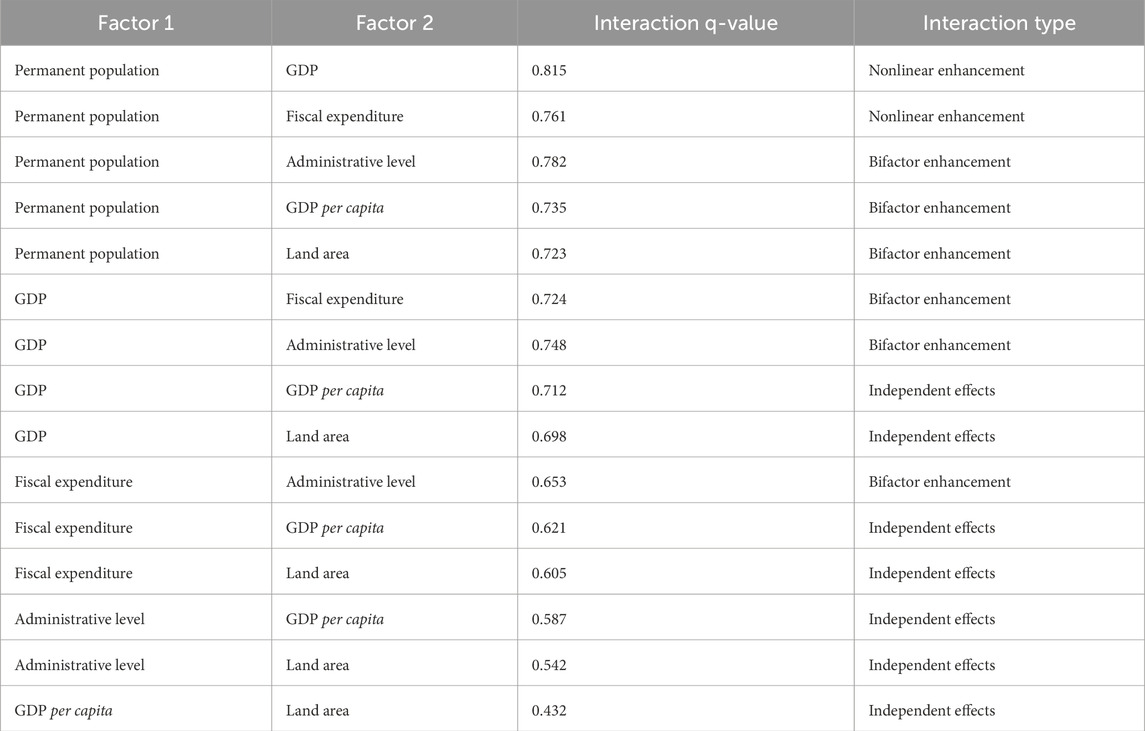
Table 2. Interactive detection results of sport venues in central China.
3.3 Analysis of the equilibrium between sports venues number and population size in central China
The number of sports venues in each province and city varies; however, the evaluation of whether the number of sports venues in a region is sufficient should not be based on the number alone, but should also consider the size of the local population to make a comprehensive evaluation. Therefore, based on the number of sports venues and seventh population census data, the number of venues per 100,000 people in different regions was calculated for a comprehensive analysis.
The number of sports venues per 100,000 people in different regions and cities is shown in Figure 4, and it is clear that the number of sports venues per 100,000 people is higher in provincial capital cities. Wuhan and Changsha had the highest number of sports venues per 100,000 people (more than three). Taiyuan, Zhengzhou, Nanchang, and Hefei had more than 2. The Shennongjia Forest District in Hubei Province also has more than two sports venues per 100,000 people owing to its small population.
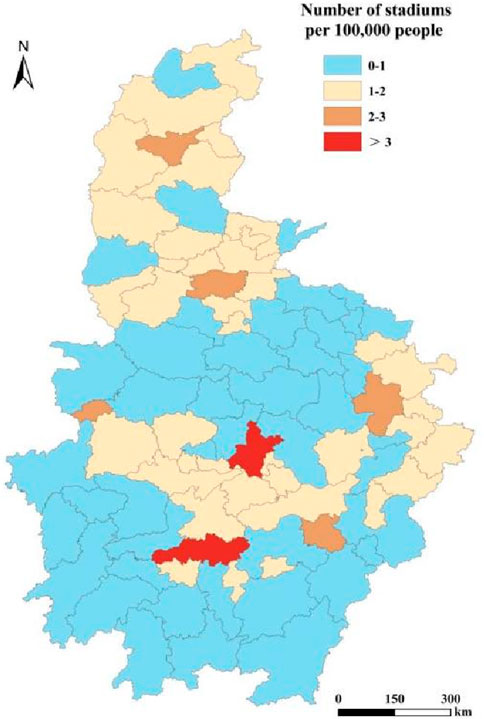
Figure 4. Relationship between the number of sports venues and population in central China.
At the provincial scale, the number of sports venues in Shanxi Province is relatively balanced compared to the population, with only three cities having less than one stadium per 100,000 people, namely, Xinzhou City, Changzhi City, and Yuncheng City. In Henan Province, Puyang City, Shangqiu City, Zhoukou City, Pingdingshan City, Nanyang City, Zhumadian City, and Xinyang City, six cities have less than one stadium per 100,000 people. Anhui Province, half of the cities per 100,000 people have less than one stadium: Suzhou City, Huaibei City, Huainan City, Bozhou City, Fuyang City, Liu’an City, Tongling City, and Chizhou City. Hubei Province, the number of sports venues per 100,000 people is less than one in Huanggang City, Xiaogan City, Tianmen City, Suizhou City, Xiangyang City, Shiyan City, Enshi Tujia, and Miao Autonomous Prefecture. Hunan Province, the number of sports venues per 100,000 people is obviously insufficient, in addition to the provincial capital of Changsha City (more than 3), Yueyang City, and Xiangtan City (more than 1), and the other 11 cities (less than one. The number of sports venues built in Jiangxi Province has not yet met the needs of the population, and the number of sports venues per 100,000 people is less than one, except for the capital city of Nanchang, which has more than two, and Jiujiang, Jingdezhen, Xinyu, and Pingxiang cities, which have more than one. To summarize, the balance between sports venues and the population they serve in the six central provinces is in descending order as follows: Shanxi Province, Henan Province, Anhui Province, Hubei Province, Jiangxi Province, and Hunan Province.
3.4 Analysis of the equilibrium between sports venues number and population density in central China
The population density of different regions has large differences, in order to further explore the distribution characteristics of sports venues and clarify the relationship between them and population density, the distribution percentage and differences of sports venues in different population density regions are obtained through the overlay analysis of sports venues and population density data.
The percentage of sports venues in the six central provinces located in areas with different population densities is shown in Figure 5, where the relationship between the distribution of sports venues and population density in each province is similar. The results indicate that sports venues are mainly distributed in areas with high population densities. More than 95% of the sports venues in the six central provinces were located in areas with population densities greater than 500 people/km2, and more than 85% of the sports venues were located in areas with population densities greater than 1,000 people/km2. This further suggests that the construction of sports venues has an important link with population distribution. However, the results of this study also reinforce the fact that the distribution of sports venues shows an uneven pattern. Areas with high population densities tend to be located in urban centers, while other areas with large populations, despite low population densities, lack the construction of sports venues. Sports venues located in urban centers have limited populations and spatial scopes to serve, resulting in a significant number of populations and areas that are not served by the sports venues.
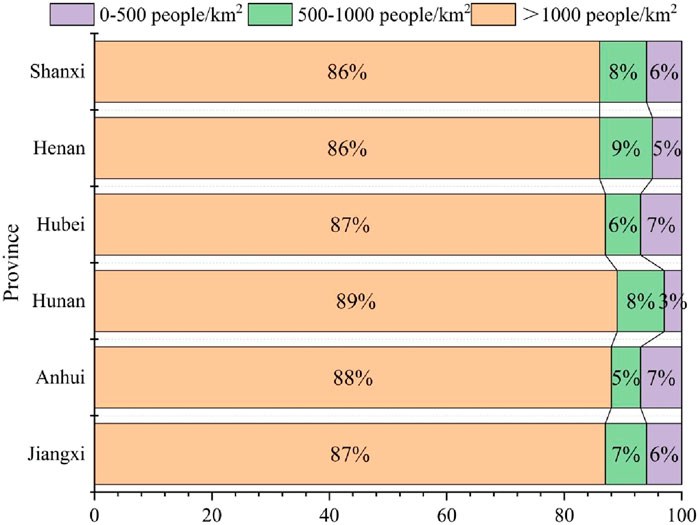
Figure 5. Proportion of sports venues in different population density regions in central China.
It can be concluded that all provinces and cities have a large number of sports venues distributed within urban centers, while there are almost no sports venues distributed in counties, townships, and other areas. These characteristics of the distribution of sports venues do not meet the requirements of sharing. In the context of rural revitalization today, the distribution of sports venues is far from sufficient if they are concentrated only in urban centers. It is necessary to constantly explore how to ensure the healthy development of sports industrialization, while also allowing more people to enjoy the services brought by the stadium.
4 Discussion
This study integrates POI data, 1 km2 population grid, and the GeoDetector model to construct a “facility-population” spatial mismatch quantification framework, overcoming the limitations of traditional research that relies on administrative unit data (Jing et al., 2018; Zhao et al., 2022). Compared to existing studies focusing on the economic benefits of individual venues (Jones, 2002; Giri et al., 2024) or post-event utilization (Zhu et al., 2020), this research is the first to reveal the pattern of regional sports facility distribution in China during the transition period, dominated by the “population-GDP synergistic effect” (q = 0.815). This finding challenges the presupposition of economic determinism (Baumann and Bradbury, 2024) and demonstrates that administrative hierarchy (q = 0.538) has a more significant impact on facility distribution than per capita GDP (q = 0.315), providing new evidence for the theory of infrastructure equity in emerging economies.
The spatial distribution patterns of sports venues in central China, as revealed by this study, reflect the deep-seated structural challenges in regional development and resource allocation. The pronounced clustering of facilities in provincial capitals, evidenced by the nearest neighbor ratio (R = 0.21) and kernel density maps, aligns with global trends, where urban centers dominate infrastructure investments due to economies of scale and market-driven priorities (Jones, 2002; Zhao et al., 2022). However, the extent of this urban bias in China’s central region is striking. For instance, Wuhan and Zhengzhou alone account for 38% and 34% of their provincial sports venues, respectively, despite housing only 15%–20% of their provinces’ populations. This discrepancy underscores the critical tension between efficiency-driven planning and equitable access, a well-documented theme in studies of public infrastructure in transitional economies (Turok and McGranahan, 2013). The concentration of sports venues in high-density urban cores (>1,000 people/km2) mirrors the patterns observed in Brazil’s favelas and India’s metropolitan regions, where commercial viability trumps social inclusivity.
The study’s finding that 85% of sports venues serve areas with population densities exceeding 1,000/km2 highlights the systemic neglect of low-density regions. Such disparities perpetuate a cycle of inequity; limited access to sports infrastructure correlates with lower physical activity rates, which in turn exacerbates public health burdens such as obesity and cardiovascular diseases, a linkage validated by longitudinal studies in both developed and developing contexts (Heinrich et al., 2011; Kim et al., 2012; Sallis et al., 2016; White et al., 2017; Halliday et al., 2019; Marques-Sule et al., 2021; Rodriguez-Romo et al., 2023). In China, this spatial mismatch directly contravenes the National Fitness Program (2021–2025), which mandates universal access to fitness facilities within a 15-min walking radius in urban areas and township-level coverage by 2025. The failure to meet these targets in central China’s hinterlands risks widening the urban-rural health gap, with long-term consequences for labor productivity and healthcare costs. The study’s proposal to prioritize sub-high-density areas and township-level construction is necessary, but insufficient without addressing structural barriers.
Although this study advances the understanding of stadium distribution patterns, several limitations warrant attention. First, reliance on POI data from commercial platforms (e.g., Gaode Map) may exclude informal or community-based sports facilities (e.g., village squares, school gyms open to the public), potentially overstating rural deficits. Second, while WorldPop data provide broad spatial coverage, their 1 km2 resolution of population obscures critical intra-urban variations. High-resolution mobility data (e.g., Tencent Location Big Data or mobile phone trajectories) may reveal micro-scale accessibility gaps within cities (e.g., disparities between urban cores and peripheral neighborhoods. Third, the static analysis fails to account for temporal dynamics. Post-pandemic shifts toward decentralized fitness behaviors (e.g., hiking, cycling, and home-based exercises) may reduce reliance on traditional stadiums. Integrating time-series data (e.g., Baidu Heat Maps of facility usage) or agent-based modeling could simulate how facility placement interacts with evolving demographic trends and mobility patterns. Beyond these, future research should explore causal mechanisms driving spatial mismatches. For instance, econometric models could quantify how fiscal capacity, land-use policies, and private investment incentives (e.g., PPP models) perpetuate urban-rural divides. Cross-regional comparative studies (e.g., central vs. western China) may further contextualize these findings within national development strategies.
5 Conclusion and policy recommendations
Based on the POI data of sports venues in six central provinces of China, the seventh national population census data, and population density data, this study reveals the spatial distribution characteristics of sports venues in six central provinces of China using geospatial analysis methods such as nearest-neighbor analysis, kernel density analysis, and superposition analysis, and further explores the equilibrium of their distribution characteristics matched with the number of the local population and the population density based on this. The main conclusions of this study are as follows:
(1) Nearest-neighbor analysis and kernel density analysis showed that sports venues in the six central provinces all exhibited high-density clustering in provincial capital cities (Taiyuan, Zhengzhou, Wuhan, Changsha, Hefei, and Nanchang). Within different provinces, they all present the provincial capital city as a high-density core area and have a few sub-high-density core area cities, while other cities and municipalities are characterized by inconspicuous aggregation.
(2) The explanatory power of single factors for sports venues, from largest to smallest, is as follows: permanent population > GDP > fiscal expenditure > administrative level > GDP per capita > land area. Based on the results of the interaction analysis, the interaction between permanent population and GDP has the greatest overall impact on sports venues.
(3) Based on the analysis of population size and stadium location, it was concluded that the ratio of sports venues to population size in Changsha and Wuhan had relatively better results. The construction of sports venues in many cities in the six central provinces has not yet been able met the needs of the local population. The balance between sports venues and the population they serve in the six provinces is in descending order: Shanxi Province, Henan Province, Anhui Province, Hubei Province, Jiangxi Province, and Hunan Province.
(4) After analyzing the data on sports venues and population density, we obtained the distribution ratio and difference of sports venues in different population density areas. The results show that the relationship between the distribution of sports venues and population density in each province is similar, indicating that most sports venues are located in areas with higher population density. More than 95% of the sports venues were located in areas where the population density was greater than 500 people/km2, and more than 85% of the sports venues were located in areas where the population density was greater than 1,000 people/km2.
Based on the above research, this paper puts forward the following suggestions:
Implement a tiered approach to venue allocation, prioritizing filling the service gaps in prefecture-level cities: To address the issue of excessive concentration in provincial capitals and severe shortages in prefecture-level cities, it is urgent to adopt a graded construction strategy. It is recommended to prioritize the construction of comprehensive stadiums in 10 cities with the most critical shortages, such as Zhoukou in Henan and Shaoyang in Hunan, ensuring that by 2030, there is at least one venue with over 3,000 seats for every 500,000 people, in compliance with the “Land Quota Standards for Urban Public Sports Venues.” Simultaneously, idle school and government venues in provincial capitals should be opened to the public, with a free evening opening system implemented on weekdays, expected to cover more urban residents. Provincial governments should establish annual special funds for targeted investment in cities with shortages, systematically alleviating the “provincial capital siphon effect”.
Innovating the Rural Land-Industry-Operation Linkage Model to Overcome Sustainability Challenges: To address the low coverage of sports facilities in underdeveloped regions and rural areas, we propose transforming idle school buildings and abandoned factories (which offer lower construction costs) while strictly limiting new land use for construction. A diversified financing model combining government investment, sports lottery subsidies, and corporate franchise operations should be adopted, drawing inspiration from successful cases like Zhejiang Anji’s rural sports complex, where enterprises were granted 20-year operational rights. New venues should be required to integrate sports-tourism functions—such as the Hunan Langshan Badminton Stadium’s accompanying homestay cluster—to boost operational revenue. Additionally, utility subsidies (water and electricity) should be provided based on service frequency in areas with population densities below 500 people/km2. Pilot programs could first be implemented in selected cities to establish a replicable, self-sustaining operational model.
Building a Dynamic Supervision and Assessment System to Ensure Precise Resource Allocation: It is recommended to establish a “Population-Facility Matching Index” decision-making tool, with the calculation formula being (actual service population/total population) × (15-min walking coverage rate/national standard). Areas with very low indices should be prioritized for fiscal funding. The “Population-Facility Matching Index” should be incorporated into the local government’s national fitness assessment system, integrating Tencent location big data and venue passenger flow monitoring systems to dynamically optimize resource allocation. Simultaneously, the “National Fitness Regulations” should be revised to require all counties to publish annual Population-Facility Matching Index assessment reports, forming a “monitoring-warning-optimization” closed-loop management to fundamentally address the chronic issue of resource mismatch.
Data availability statement
The original contributions presented in the study are included in the article/supplementary material, further inquiries can be directed to the corresponding author.
Author contributions
WK: Conceptualization, Data curation, Formal Analysis, Funding acquisition, Investigation, Methodology, Visualization, Writing – original draft. HL: Data curation, Formal Analysis, Methodology, Visualization, Writing – original draft. JZ: Conceptualization, Investigation, Methodology, Project administration, Supervision, Writing – review and editing.
Funding
The author(s) declare that financial support was received for the research and/or publication of this article. This research was funded by the Planning Project for Philosophy and Social Sciences in Shanxi Province (2023YJ026), the Research Project Supported by Shanxi Scholarship Council of China (2024-063), the Philosophy and Social Science Project of Shanxi Universities in 2022 (2022w014), the Industry-University Cooperative Education Project of the Ministry of Education in 2024 (230900591223344) and the National Educational Planning Project - Ministry of Education Youth Project: Spatial Narratives and Educational Inheritance of Folk Sports in the Yellow River Basin (ELA210436).
Conflict of interest
The authors declare that the research was conducted in the absence of any commercial or financial relationships that could be construed as a potential conflict of interest.
Generative AI statement
The author(s) declare that no Generative AI was used in the creation of this manuscript.
Publisher’s note
All claims expressed in this article are solely those of the authors and do not necessarily represent those of their affiliated organizations, or those of the publisher, the editors and the reviewers. Any product that may be evaluated in this article, or claim that may be made by its manufacturer, is not guaranteed or endorsed by the publisher.
References
Abbiasov, T., and Sedov, D. (2023). Do local businesses benefit from sports facilities? The case of major league stadiums and arenas. Regional Sci. Urban Econ. 98, 103853. doi:10.1016/j.regsciurbeco.2022.103853
Baumann, R. W., and Bradbury, J. C. (2024). Estimating the fiscal impact of stadium developments: evaluating a pro forma model. Public Finance Rev. 52, 399–438. doi:10.1177/10911421231199517
Bonser, S., Hughes, B. R., and Calautit, J. K. (2020). Investigation of the impact of roof configurations on the wind and thermal environment in football stadiums in hot climates. Int. J. Vent. 19, 260–279. doi:10.1080/14733315.2019.1665861
Dal, Z., and Akdag, N. Y. (2011). Noise disturbance caused by outdoor activities-a simulated-environment study for Ali Sami Yen Stadium, a stanbul. Environ. Monit. Assess. 174, 347–360. doi:10.1007/s10661-010-1462-z
Duan, Y., Li, P., Meng, D., Bu, T., Liu, X., Popovic, S., et al. (2022). The effects of demographic trends on the high-quality development of the Chinese sports industry. Sustainability 14, 1039. doi:10.3390/su14021039
Giri, A., Sagan, V., and Podgursky, M. (2024). The ballpark effect: spatial-data-driven insights into baseball's local economic impact. Appl. Sciences-Basel 14, 8134. doi:10.3390/app14188134
Guo, P. (2020). Sustainable development of the 2022 Beijing winter olympics Zhangjiakou stadium under the concept of ocean ecological environment. J. Coast. Res. 104, 151–155. doi:10.2112/jcr-si104-028.1
Guo, X., and Sun, Y. (2024). A thermal comfort assessment on semi-outdoor sports stadiums located in 3 different climate zones in China. Build. Environ. 261, 111660. doi:10.1016/j.buildenv.2024.111660
Halliday, A. J., Kern, M. L., and Turnbull, D. A. (2019). Can physical activity help explain the gender gap in adolescent mental health? A cross-sectional exploration. Ment. Health Phys. Activity 16, 8–18. doi:10.1016/j.mhpa.2019.02.003
Heinrich, K. M., Maddock, J., and Bauman, A. (2011). Exploring the relationship between physical activity knowledge, health outcomes expectancies, and behavior. J. Phys. Activity and Health 8, 404–409. doi:10.1123/jpah.8.3.404
Huang, H. (2017). Planning interior and exterior spaces of a modern gymnasium: case study Yubei stadium. Open House Int. 42, 55–60. doi:10.1108/ohi-03-2017-b0012
Jing, Y., Liu, Y., Cai, E., Liu, Y., and Zhang, Y. (2018). Quantifying the spatiality of urban leisure venues in Wuhan, central China – GIS-based spatial pattern metrics. Sustain. Cities Soc. 40, 638–647. doi:10.1016/j.scs.2018.05.015
Jones, C. (2002). The stadium and economic development: cardiff and the millennium stadium. Eur. Plan. Stud. 10, 819–829. doi:10.1080/0965431022000013239
Kim, Y. S., Park, Y. S., Allegrante, J. P., Marks, R., Ok, H., Cho, K. O., et al. (2012). Relationship between physical activity and general mental health. Prev. Med. 55, 458–463. doi:10.1016/j.ypmed.2012.08.021
Kou, W., and Zhai, J. (2025). Spatial distribution patterns and influencing factors of sports intangible cultural heritage in China. Front. Earth Sci. 13, 1556652. doi:10.3389/feart.2025.1556652
Lindlacher, V., and Pirich, G. (2025). The impact of China's “sadium Ddplomacy” on Llcal Eeonomic dvelopment in Sub-Saharan Africa. World Dev. 185, 106765. doi:10.1016/j.worlddev.2024.106765
Liu, J., Hui, T., Su, C., and Li, X. (2025). Spatial distribution characteristics and influencing factors of public cultural facilities in the urban agglomeration of the middle reaches of the yangtze river. Econ. Geogr. 45, 85–92. doi:10.15957/j.cnki.jjdl.2025.05.009
Lyu, S. O. (2024). Unveiling willingness to pay for green stadiums: insights from a choice experiment. J. Clean. Prod. 434, 139985. doi:10.1016/j.jclepro.2023.139985
Marques-Sule, E., Miro-Ferrer, S., Munoz-Gomez, E., Bermejo-Fernandez, A., Juarez-Vela, R., Gea-Caballero, V., et al. (2021). Physical activity in health care professionals as a means of primary prevention of cardiovascular disease A STROBE compliant cross-sectional study. Medicine 100, e26184. doi:10.1097/md.0000000000026184
Miller, P. A. (2002). The economic impact of sports stadium construction: the case of the construction industry in St. Louis, MO. J. Urban Aff. 24, 159–173. doi:10.1111/1467-9906.00120
Nie, X., Ma, M., Ji, J., and Zheng, L. (2023). The spatial distribution of traditional intangible cultural heritage medicine of China and its influencing factors. Herit. Sci. 11, 90. doi:10.1186/s40494-023-00929-0
Redhead, S. (2007). Those absent from the stadium are always right - accelerated culture, sport media, and theory at the speed of light. J. Sport and Soc. Issues 31, 226–241. doi:10.1177/0193723507301051
Rodriguez-Romo, G., Acebes-Sanchez, J., Garcia-Merino, S., Garrido-Munoz, M., Blanco-Garcia, C., and Diez-Vega, I. (2023). Physical activity and mental health in undergraduate students. Int. J. Environ. Res. Public Health 20, 195. doi:10.3390/ijerph20010195
Sallis, J. F., Cerin, E., Conway, T. L., Adams, M. A., Frank, L. D., Pratt, M., et al. (2016). Physical activity in relation to urban environments in 14 cities worldwide: a cross-sectional study. Lancet 387, 2207–2217. doi:10.1016/s0140-6736(15)01284-2
Schallhorn, C., Symons, K., Kunert, J., and Rose, L.-D. (2024). Inclusive, inviting, inspiring: insights into the experiences of women's football fans in Australia and Germany. Int. Rev. Sociol. Sport 59, 619–641. doi:10.1177/10126902231215296
Tang, L. (2022). Study on coupling coordination degree between regional sports industry development and healthy China construction. J. Healthc. Eng. 2022, 1–5. doi:10.1155/2022/7785267
Turok, I., and McGranahan, G. (2013). Urbanization and economic growth: the arguments and evidence for Africa and Asia. Environ. Urbanization 25, 465–482. doi:10.1177/0956247813490908
White, R. L., Babic, M. J., Parker, P. D., Lubans, D. R., Astell-Burt, T., and Lonsdale, C. (2017). Domain-specific physical activity and mental health: a meta-analysis. Am. J. Prev. Med. 52, 653–666. doi:10.1016/j.amepre.2016.12.008
Xiao, C., Liu, Y., Yang, Y., and Chiaka, J. C. (2025). Patterns and drivers of population in the borderlands of mainland southeast Asia. Habitat Int. 157, 103321. doi:10.1016/j.habitatint.2025.103321
Yuan, X., Pan, H., and Fu, B. (2023). Models and analysis of stadium and commercial space integration: a case study from China. Build. Res. Inf. 51, 915–936. doi:10.1080/09613218.2023.2206990
Zhai, J., Xiao, C., Feng, Z., and Liu, Y. (2022). Spatio-temporal patterns of land-use changes and conflicts between cropland and forest in the mekong river basin during 1990-2020. Land 11, 927. doi:10.3390/land11060927
Zhang, X., Xiang, H., and Liu, R. (2022). Spatial pattern and influencing factors of intangible cultural heritage of music in xiangxi, central China. Herit. Sci. 10, 39. doi:10.1186/s40494-022-00672-y
Zhao, H., Li, J., Li, K., Du, Y., and Wang, J. (2022). Spatial differences and influencing factors of stadia and fitness centers at different scales in China. Arid. Land Geogr. 45, 1938–1948. doi:10.12118/j.issn.1000-6060.2022.153
Keywords: sports venues, population size, population density, spatial distribution, equity
Citation: Kou W, Liu H and Zhai J (2025) Spatial distribution and service equity of sports venues in central China. Front. Earth Sci. 13:1627827. doi: 10.3389/feart.2025.1627827
Received: 13 May 2025; Accepted: 23 July 2025;
Published: 30 July 2025.
Edited by:
Xufeng Cui, Zhongnan University of Economics and Law, ChinaReviewed by:
I. Gusti Bagus Rai Utama, Dhyana Pura University, IndonesiaQiuying LI, General Hospital of Hunan Medical College, China
Copyright © 2025 Kou, Liu and Zhai. This is an open-access article distributed under the terms of the Creative Commons Attribution License (CC BY). The use, distribution or reproduction in other forums is permitted, provided the original author(s) and the copyright owner(s) are credited and that the original publication in this journal is cited, in accordance with accepted academic practice. No use, distribution or reproduction is permitted which does not comply with these terms.
*Correspondence: Jiahao Zhai, emhhaWpoQGp4bnUuZWR1LmNu