- 1CCCC Second Harbor Engineering Company Ltd., Wuhan, China
- 2School of Civil and Architectural Engineering, Wuhan University, Wuhan, China
This paper performs a series of laboratory static lateral pressure coefficient (K0) tests on coral sands with five typical gradations in dry and saturated states via water bladder type lateral pressure apparatus to investigate their ranges of K0 values. The results reveal that the K0 values of coral sands in dry and saturated states range from 0.22 to 0.32 and 0.27 to 0.33, respectively, and that there is an exponential function relationship between the particle gradation and the K0. On this basis, a discrete element model is established with the aid of particle flow code (PFC), and the numerical simulation and laboratory test are in good agreement. The displacement field of coral sand with a narrower gradation is revealed to be more prone to exhibit a horizontally stratified compression feature at the meso-scale. The coral sand with a wider gradation exhibits a more obvious gradient distribution of internal contact forces with more uniform directional distribution and better compaction. The K0 decreases and then stabilizes with increasing particle bonding strength, and the evolution law between them conforms to the exponential function form. A theoretical calculation formula of K0 for coral sand based on the distribution coefficient is further proposed according to the laboratory test results. The research results of this paper can provide parameter support for construction and design of wharf retaining structures on islands and reefs.
1 Introduction
With the implementation of the ‘One Belt One Road’ policy and the ‘Maritime Power’ strategy, an increasing number of island and reef projects have been launched. Since they are far away from the mainland, they usually need to utilize coral sands formed by reclamation. Coral sand (Chen et al., 2022) is a kind of geotechnical body with special engineering properties formed by the remains of coral communities under geological action, its genesis and chemical composition are significantly similar to carbonate rocks in karst areas,and it is irregular in shape (Smith and Cheung, 2003), porous (Xu et al., 2022), easy to cement (Meng et al., 2014), and easy to fracture (Donohue et al., 2009). Its engineering mechanical properties are quite different from those of ordinary terrestrial sediments (Wang et al., 2017). In island and reef engineering and similar geological environments (such as weathered residual soil or filling materials in karst areas), the static lateral pressure coefficient (K0) is a key parameter for geotechnical engineering investigation, design (such as soil pressure calculation of support structures), and construction (analyzing the horizontal stress state of the site) (Zhang et al., 1998). Its accurate control is crucial for ensuring engineering safety and preventing disasters such as foundation instability and slope collapse caused by abnormal soil stress. This study focuses on the K0 characteristics of coral sand, and its results not only directly serve the construction of islands and reefs, but also provide important theoretical basis and data support for understanding the stress evolution mechanism of similar carbonate derived soils in karst areas and disaster prevention (such as foundation treatment and slope reinforcement).
Scholars around the world have carried out a large number of theoretical and experimental studies on the K0, and put forward a series of formulas for calculating the K0. At present, the K0 is mostly obtained by empirical formulas, in situ tests, and laboratory geotechnical tests (Michalowski et al., 2005; Wang et al., 2020). There are few studies on the K0 of coral sand. Wang et al. (2021) determined the range of K0 values of coral sands with different relative densities and water contents through laboratory tests, but they only studied coral sand with a single gradation. However, the coral sand formed by reclamation has a wide range of gradation distribution, and it is necessary to carry out research on coral sand with multiple gradations to obtain more comprehensive and practical K0.
To fully study the K0 of coral sands with different particle gradations, this paper measures the K0 of coral sands with five typical gradations through laboratory tests, analyses the ranges of K0 values in dry and saturated states, and deduces the influence laws of particle gradation on the K0. A particle flow numerical model is established via PFC to reveal the macroscopic test mechanism from contact force chain and coordination number at the meso-scale. The influence law of bonding strength on K0 is explored, and the formula for calculating K0 based on distribution coefficient and strength parameter is further established. It is expected to clarify the stress distribution of coral sand sites and to provide mechanical parameter support for determination the earth pressure on wharf retaining structures in island and reef projects.
2 Test programme
2.1 Materials
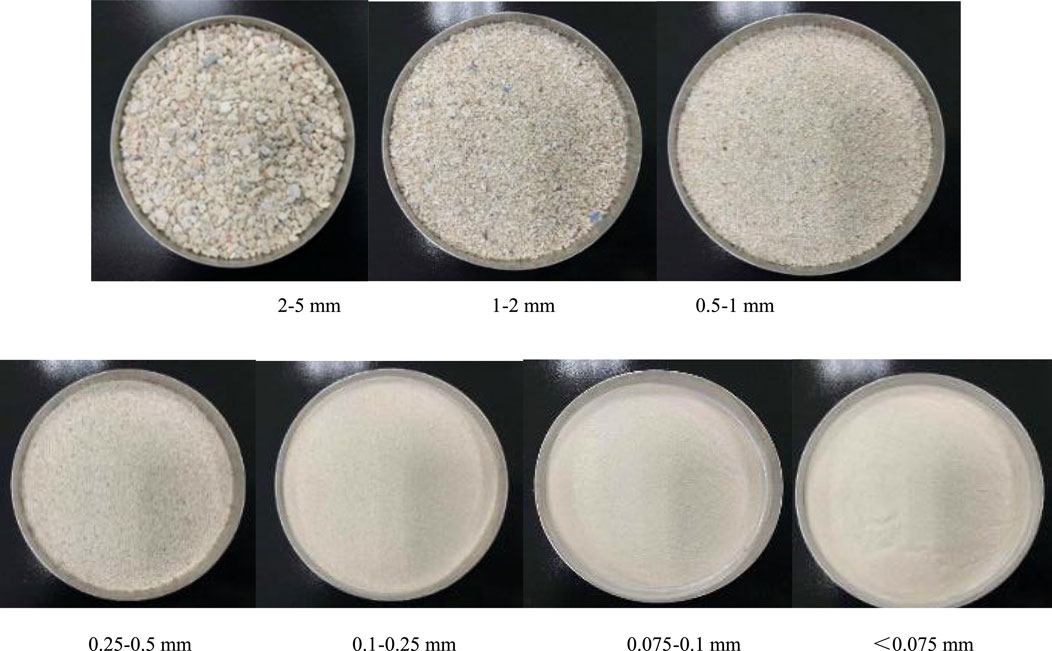
The test sample is coral sand from an island reef in the Maldives, and the coral sand samples are sieved to obtain the particle groups of different sizes of <0.075 mm, 0.075–0.25 mm, 0.25–0.5 mm, 0.5–1 mm, 1–2 mm, and 2–5 mm, which are presented in Figure 1. According to the ‘Code for Geotechnical Investigation on Port and Waterway Engineering (Partial Revision)-Geotechnical Investigation of Coral Reefs (General Revision Draft)’ (CCCC Second Navigation Engineering Survey and Design Institute, 2022), coral gravel sand, coral coarse sand, coral medium sand, coral fine sand, and coral powder sand are prepared, respectively. The five types of coral sands have a wide range of particle gradation distribution, which allows for the acquisition of all mechanical parameters of coral sands with typical representativeness.
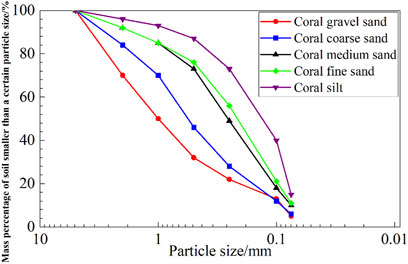
The control particle size and gradation indexes are summarized in Table 1. The gradation curves of the five types of coral sands are depicted in Figure 2.

Table 1. This is a table. Tables should be placed in the main text near to the first time they are cited.
2.2 Test apparatus
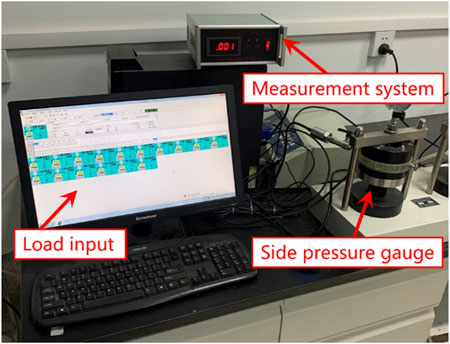
The tests are carried out on GZQ-1 type fully automatic pneumatic consolidation apparatus. The equipment is produced by Nanjing Ruitai Geotechnical Testing Instrument Co., Ltd., with an axial load error of ±0.5% FS and a lateral pressure sensor nonlinearity of 0.1%. The whole system consists of a consolidation apparatus, a pneumatic pressure controller, a multi-channel communication converter, and a data acquisition system, as presented in Figure 3. The interior of the pressure chamber is inlaid with a ring-shaped rubber membrane, and the water is filled between the rubber membrane and the outer wall of pressure chamber. Coral sand squeezes the rubber membrane, leading to a varying water pressure on the side wall, which allows for the determination of the lateral pressure of coral sand sample by water pressure. The pressure chamber has a diameter of 61.8 mm and a height of 40 mm, and the maximum axial consolidation pressure it can withstand is 6 kN. It is able to provide a horizontal stress measurement range of 0–1,000 kPa and an axial displacement effective test range of 0–10 mm. The vertical load can be set freely by computer programme, and six vertical load levels of 50 kPa, 100 kPa, 150 kPa, 200 kPa, 400 kPa, and 600 kPa are designed for the tests.
2.3 Test procedure
The test procedure includes sample preparation, sample installation, loading, and data acquisition, while the dry and saturated scenarios are configured. For preparation of dry sample, the dried sand samples weighed according to the design density of 1.45 g/cm3 are loaded into the pressure chamber of the lateral pressure gauge for compaction in three times, and the compactness designed for the test is achieved by controlling the mass of sample added each time and the height of sample after compaction. The specific operation is as follows: the sample is filled in three layers, and each layer is manually compacted 10 times using a standard compaction hammer (hammer weight 2.5 kg, drop distance 200 mm). The height error of each layer after compaction is controlled to be ≤0.5 mm. For preparation of saturated sample, according to the design density, the coral sand sample of the corresponding mass is placed into the pressure chamber of the lateral pressure gauge, and then the lateral pressure gauge is put into the vacuum bucket. The vacuum pump is activated to evacuate the sample for 48 h to achieve a complete saturation.
The test adopts the rapid loading method, with a stabilization duration of 1 h for each level of loading (NSAI, 2017). The gas-free distilled water is selected for the test to ensure that no gas exists in water bladder, which results in a more accurate measurement of the horizontal pressure. The saturated coral sand sample is always covered by water during the testing process, and a certain amount of pre-pressure needs to be applied first to make the sample reach the design compactness prior to the test. The lateral pressure after stabilization of each level of load is continuously recorded during the test, and the test is terminated when the deformation under the last level of load is less than 0.005 mm/h. The preloading load is uniformly set at 30 kPa (equivalent to 60% of the minimum formal load of 50 kPa), which has been verified through pre testing as the optimal solution for eliminating sample gaps.
3 Results and analysis
3.1 K0
The relationships between the horizontal and vertical stresses of samples in dry and saturated states are obtained, respectively, and then the K0 curves of coral sand are determined, as presented in Figure 4.
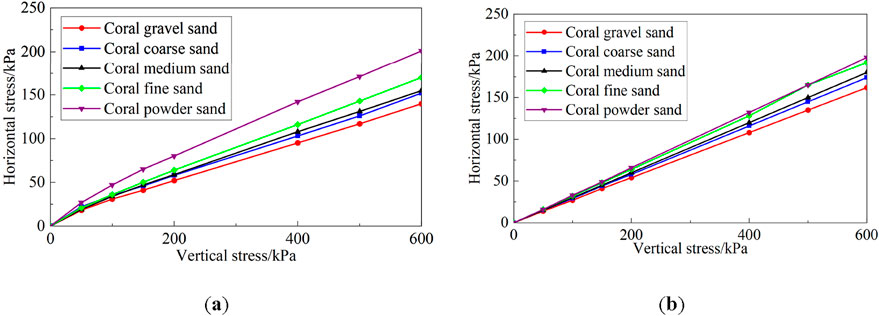
Figure 4. Relationship between horizontal and vertical stresses of coral sand.(a) Horizontal stress versus vertical stress in dry state. (b) Horizontal stress versus vertical stress in saturated state.
As indicated in Figure 4, the horizontal stress increases linearly with the increase of vertical stress, which demonstrates a basically constant K0 along the coral sand at different depths. The K0 values of coral sands in dry and saturated states are statistically obtained, as summarized in Table 2.
The values of the K0 of coral powder sand, coral fine and medium sand, as well as coral coarse and gravel sands in dry state are 0.32, 0.25–0.27, and 0.22–0.23, respectively, while those in saturated state are 0.33, 0.30–0.32, and 0.27–0.27, respectively. These values are smaller than the laboratory test results of quartz sand (whose K0 is 0.39–0.47) (Xu et al., 2007) (The test conditions for quartz sand are relative density Dr = 70% and dry state). Also, the K0 values in saturated state are higher than those in dry state. The increase in K0 of saturated coral sand is essentially due to the dual influence of water on the geotechnical system - firstly, pore water forms pressure chambers in the particle gaps, similar to a micro hydraulic system that converts vertical loads into lateral thrust, directly pushing up horizontal stress; Secondly, water molecules wrap around the edges and corners of coral sand to form a lubricating film, weakening the mechanical interlocking friction between particles and making them more prone to rolling adjustment. This lubricating effect further releases the originally locked horizontal stress. The synergistic effect of these two mechanisms results in a significantly stronger horizontal stress response in the saturated state than in the dry state.
3.2 Influence of particle gradation on K0
Figures 5, 6 illustrate the relationships between particle gradation and K0 in dry and saturated states, where the quantitative calculation formulas are also presented. The correlation coefficients are all above 0.9, indicating a good correlation between particle gradation and K0 and a high calculation accuracy of the listed formulas. It is observed that the K0 tends to decrease gradually with the increase of coefficient of uniformity and coefficient of curvature. This is due to the fact that with the increase in the gradation range from coral powder sand to coral gravel sand, the requirements of Cc = 1-3 and Cu ≥ 5 are gradually fulfilled, and the particle gradation changes from poor to good. Coarse particles form the skeleton, which is filled by fine particles. The occlusion between particles is enhanced while the overall resistance to deformation is increased. Under the vertical load, the horizontal stress is smaller, which leads to a lower K0 value measured. Narrow graded sand (such as silt) has uniform particles, concentrated force chains under vertical loads, and high horizontal stress transmission efficiency, resulting in a K0 of 0.32; Coarse particles form the main skeleton in wide graded sand (such as gravel sand), and fine particles fill the pores to enhance the “three-dimensional interlocking effect”, converting more vertical loads into particle interlocking internal forces and reducing horizontal stress release. Therefore, K0 is reduced to 0.22. The decreasing trend of K0 suggests that the magnitude of change of K0 in saturated state is significantly smaller than that in dry state. This is due to the fact that the lubrication of water in coral sand in saturated state reduces the occlusal friction between the particles, which leads to a decrease in the effect of the gradation on the K0.
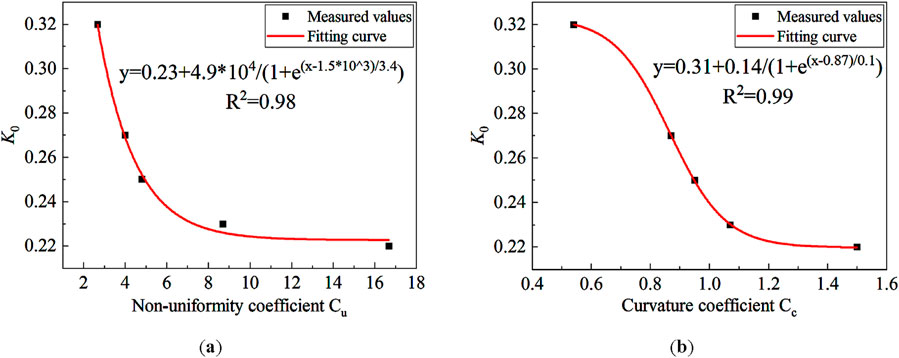
Figure 5. Relationship between particle gradation and K0 in dry state.(a) K0 versus Cu. (b) K0 versus Cc.
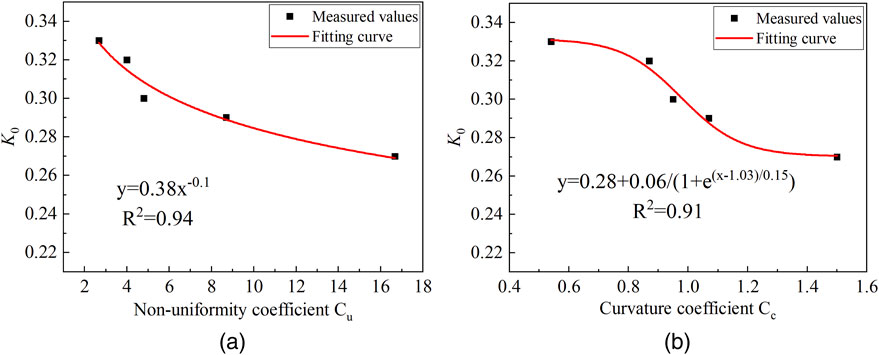
Figure 6. Relationship between particle grading and K0 in saturated state.(a) K0 versus Cu. (b) K0 versus Cc.
4 Particle flow simulation
4.1 Preparation of numerical sample
The existing numerical tests report that the particle size enlargement method has less influence on the mechanical behavior of the material (Evans and Valdes, 2011; Belheine et al., 2009). The simulation in this study uniformly enlarges the particle size by 1.5 times. The numerical test procedure is as follows:
(1) Coral sand particles of the same gradations as those in laboratory tests are generated in a cylinder with a diameter of 61.8 mm and a height of 40 mm. Finally, 7,394 coral gravel sand particles, 10,263 coral coarse sand particles, 14,840 coral medium sand particles, 15,268 coral fine sand particles, and 17,196 coral powder sand particles are generated, respectively.
(2) The particle sample model with a set porosity is firstly developed. Then, a specific pressure is applied to the walls for pre-compression to achieve a homogeneous and dense sample, as illustrated in Figure 7.
(3) The contact between the particles is assigned with a parallel bond model. Relevant parameters are assigned to create a bond between the coral sand particles to simulate their occlusion.
(4) The displacements of the particles are set to zero and the upper wall is compressed with a given velocity to load the numerical sample.
4.2 Calibration of meso-scale parameters
This paper utilizes a parallel bond model to simulate the bonding force between the coral sand particles. The parallel bond model can describe the contact characteristics between the bonded particles, where spring components with constant normal and tangential stiffness are distributed within the contact surface of the particles. When the displacement or force between particles exceeds the critical parallel bonding strength, the parallel bonding between particles fails and fracture occurs.
Discrete element numerical simulation requires the input of meso-parameters such as contact stiffness and friction coefficient. Referring to its range in previous numerical experiments (Stratton and Wensrich, 2010; Thompson et al., 2009), the particle normal stiffness in this study is set to 100 MN/m, while the particle stiffness ratio is set to 1.0, which meets the recommended range of 1.0–1.5 by Goldenberg and Goldhirsch (2005). By reverse fitting the key characteristics of the stress-strain curve of the indoor triaxial test, it is achieved that the basic microscopic parameters (friction coefficient, stiffness, etc.) are first fixed, and then the cohesion and friction angle are gradually adjusted to make the peak stress, residual strength trend, and elastic segment slope simulated by PFC consistent with the test curve. The iterative process aims to match the overall shape of the curve, and the final parameter values are listed in Table 3 after multiple verifications.
5 Numerical simulation results
5.1 Comparison with laboratory tests
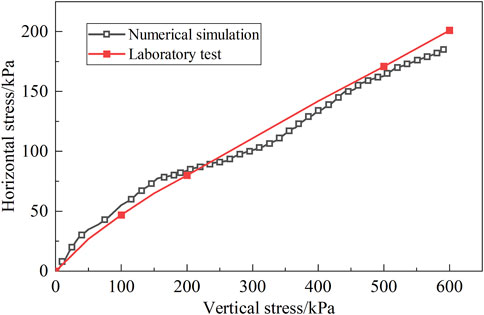
Figure 8 presents the comparison between the numerical and experimental results regarding the relationship between the horizontal and vertical stresses for coral powder sand. It is observed that there is only a minimal discrepancy between the K0 values obtained from numerical simulations and laboratory tests, indicating a high overall agreement between the two results. This verifies the feasibility of numerical simulation and the rationality of calibrated meso-parameters. An in-depth analysis of the numerical simulation results can be conducted based on this foundation.
5.2 Meso-scale evolutionary laws
5.2.1 Variation of displacement nephogram
Figure 9 displays the displacement nephograms of coral gravel sand and coral powder sand, where the red and blue regions represent the largest and smallest displacements, respectively. The applied vertical load causes the particles at the top of the sample to be continuously compressed downward, producing downward displacement. The particle displacement in the nephogram decreases gradually from top to bottom, which corresponds to the observation that the compression of the sample decreases gradually from top to bottom in the laboratory test. Comparison of the two displacement nephograms (a) and (b) in Figure 9 identifies an obvious horizontal stratification of the displacement for coral powder sand, which exhibits an overall compression characteristic. This is due to the fact that the smaller difference in particle sizes of coral sand, the weaker dislocation occlusion between particles, and the small differences in motion states of neighboring particles produce an overall downward compression feature. As the gradation of coral gravel sand becomes wider, the difference in particle size is larger. As a result, the particles are more prone to embedded dislocation occlusion, leading to a complex variation pattern of displacement field.
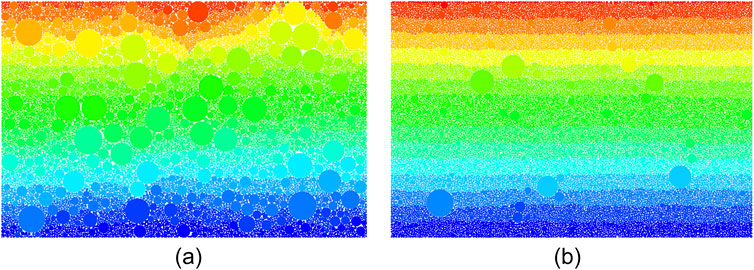
Figure 9. Displacement nephograms of coral sand particle.(a) coral gravel sand. (b) coral powder sand.
Figure 10 depicts the particle displacement vector diagram of coral gravel sand and coral powder sand, indicating a general downward movement trend for coral powder sand particles. In the bottom part of the sample, particles tend to move horizontally. Due to its wide grain size distribution, there is a certain amount of large-grain particles in coral gravel sand, while filling and interlocking between coarse and fine grains lead to more horizontal movements of particles. This also explains the mechanism of compressive deformation of coarse-grained soils from a meso-scale point of view, i.e., the deformation mainly consists of embedded occlusion and dislocation filling between coarse and fine particles.
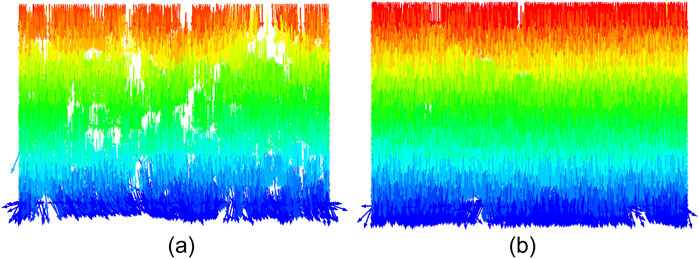
Figure 10. Displacement vector diagram of coral sand particles.(a) Coral gravel sand. (b) Coral powder sand.
5.2.2 Distribution of contact force chains
Figure 11 illustrates the distribution of contact force chains within the coral sand sample. The redder the color and the thicker the force chain, the greater the contact force; while the bluer the color and the thinner the force chain, the smaller the contact force. It is observed that gradient distribution of contact force inside the coral gravel sand with a wider gradation is more obvious, while magnitude range of contact force varies greatly, and the direction of contact force is distributed within 360°, which confirms a stronger embedded occlusion between the particles inside the coral gravel sand with a wider gradation. Most of the contact force chains of the internal particles of the coral gravel sand with a narrower gradation are blue, which represents a more concentrated distribution of the contact force, indicating a weaker occlusion between the internal particles of the coral gravel sand with a narrower gradation.
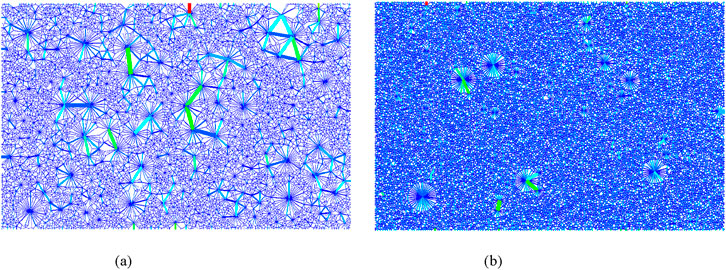
Figure 11. Distribution of contact force chains of coral sand particles. (a) Coral gravel sand. (b) Coral powder sand.
5.2.3 Evolution laws of coordination number
The coordination number reflects the average contact number per ball. The specific definition is presented in Equation 1:
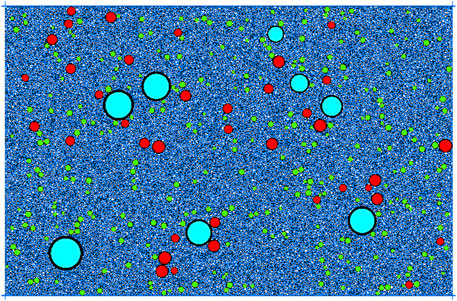
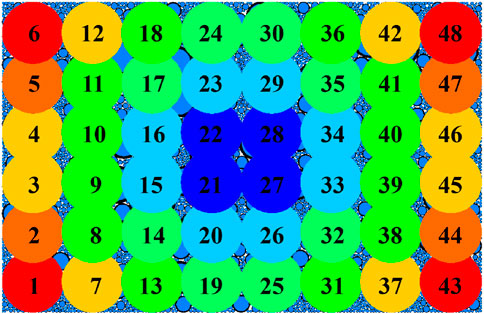
To accurately obtain the number of contacts inside the sample, 48 measurement circles are arranged inside it, as depicted in Figure 12. The coordination number inside the sample is obtained by averaging the data from the measurement circles.
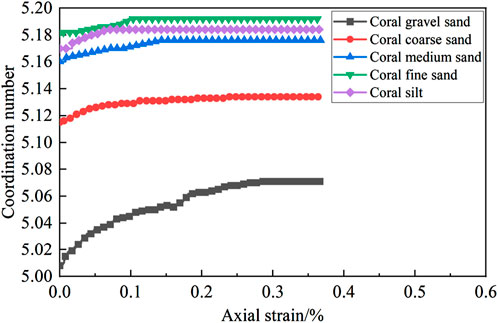
Figure 13 illustrates the evolution curve of coordination number inside the sample. It is observed that the coral gravel sand has the smallest coordination number, while the coral powder sand has the largest one. As the gradation of coral sand gradually narrows from coral gravel sand to coral powder sand, the coordination number gradually increases. This is mainly due to the difference in the number of particles among the five gradations of coral sands, with narrower gradations having more particles and therefore larger coordination numbers. Also, as the sample is compacted, the coordination number inside the sample increases and eventually stabilizes. The coral gravel sand with a wider gradation has the largest increase in coordination number, indicating better compaction of the sample, which corresponds to the larger compression observed in macroscopic compression tests of samples with wider gradations.
5.3 Influence of bonding strength on K0
Coral sand particles are angular with irregular shapes, and exhibit relatively strong inter-particle cohesion, which is characterized by the bonding strength in PFC simulation. To study the influence of bonding cohesion on K0, K0 tests are conducted under six different bonding cohesion cases of 5 × 10⁴, 1 × 10⁵, 5 × 10⁵, 1 × 10⁶, 3 × 10⁶, and 5 × 10⁶ Pa. The particle gradation of coral powder sand is used for all cases, and the other meso-scale parameters are the same as those in Table 3. The obtained K0 values for different bonding cohesions are presented in Figure14a. It is evident that as the inter-particle cohesion increases, the K0 value of coral sand gradually decreases. Once the cohesion exceeds 1 × 10⁵ Pa, the K0 tends to stabilize gradually and finally remain unchanged as cohesion increases. The relationship between them approximately follows an exponential function relationship, as depicted by the red fitted curve.
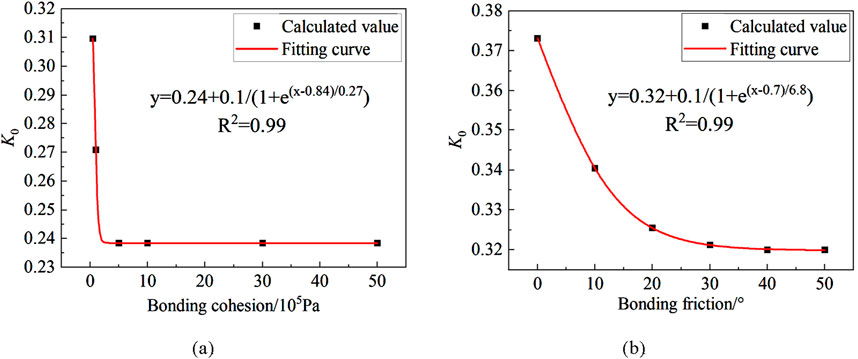
Figure 14. Relationship between bonding strength and K0.(a) K0 versus bonding cohesion. (b) K0 versus bonding friction angle.
To explore the influence of bonding friction angle on K0, K0 tests are conducted under six different bonding friction angle cases of 0°, 10°, 20°, 30°, 40°, and 50°. The particle gradation of coral powder sand is used for all cases, and the other meso-scale parameters are the same as those in Table 3. The obtained K0 values for different bonding friction angles are displayed in Figure14b. It is observed that the K0 of coral sand gradually decreases as the inter-particle bonding friction angle increases. When the friction angle is greater than 30°, the K0 tends to stabilize gradually with minimal change in magnitude as friction angle increases. The relationship between the K0 and the bonding friction angle approximately satisfies an exponential function relationship, as indicated by the red fitted curve.
6 Calculation formula for K0
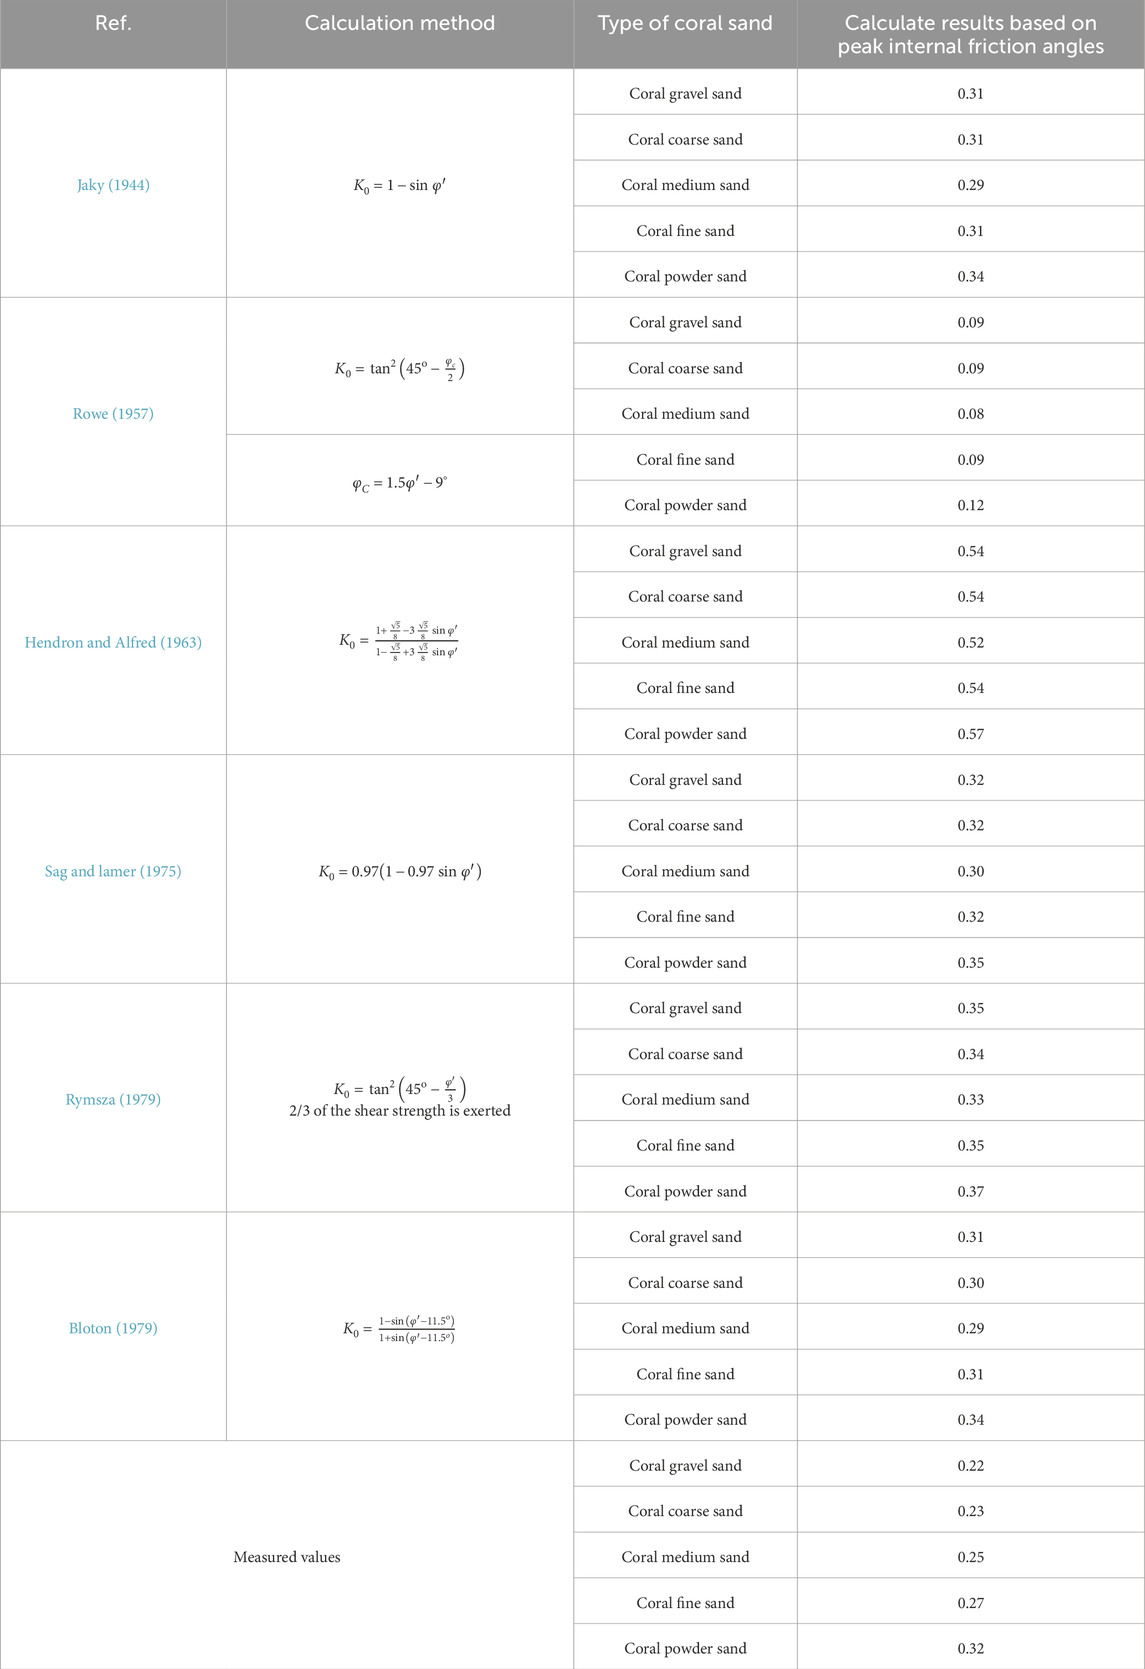
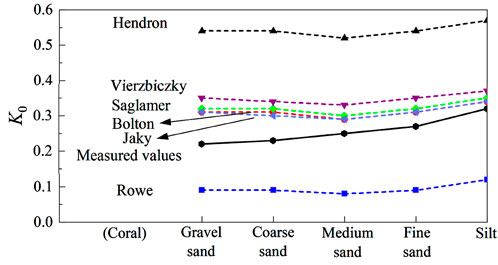
A large number of research results have been achieved for calculation methods of K0 for land-sourced sandy soils, which are detailed in Table 4. These K0 values are generally applicable for small deformation scenarios. The peak internal friction angles gained from triaxial compression tests (Zhang et al., 2023) (see Table 3) are substituted into the six theoretical formulas mentioned to verify their applicability in the highly deformed coral reef debris layer. A comparison of the calculated K0 values with the measured values is presented in Table 4 and Figure 15. Among them, the theoretical calculated K0 values by five formulas are higher than the measured values, while only the theoretical formulae proposed by Rowe (based on the shear strength exertion angle) gives smaller calculated values than the measured values, which reveal that the particle occlusion and the difficulty of particle rotation are the reasons for the low K0 value (Yuhang et al., 2021).
Considering that the measured K0 values of coral sand are between the theoretically calculated values proposed by Rowe (1957) and Bloton (1979), a formula for calculating the K0 based on the distribution coefficient and the strength parameter is proposed, as presented in Equation 2, where
Based on the measured data, the suggested values of the distribution coefficients for coral powder sand, coral fine and medium sands, as well as coral coarse and gravel sands are 0.1, 0.2, and 0.4, respectively. Table 5 presents a comparison between the calculated values obtained from the proposed formula and the measured values with the dry coral sands as examples. The maximum error observed is only 6.1%, which demonstrates the high accuracy of the calculation formula.
7 Conclusion
This study analyzes the influence of particle gradation on the K0 by performing laboratory experiments and PFC particle flow simulations on coral sands with five typical gradations. The macroscopic test mechanism is revealed from a meso-perspective, and the influence of bonding strength on the K0 is derived. A formula for calculating the K0 of coral sand is established based on the experimental results. The conclusions are as follows:
(1) The K0 values of coral sands in dry state range from 0.22 to 0.32, while that in saturated state range from 0.27 to 0.33. The K0 in saturated state is higher than that in dry state, but the K0 of coral sand is smaller than land-sourced sand. There is an exponential function relationship between the particle gradation of coral sand and the K0. With the increase of the coefficient of inhomogeneity and the coefficient of curvature, the K0 decreases gradually. The rate of change of K0 in saturated state is obviously smaller than that in dry state.
(2) The particle flow numerical model reveals that coral sand with a narrower gradation is more likely to exhibit horizontal stratification and overall compression characteristics at meso-scale. As the gradation gradually becomes wider, the stratification and compression characteristics are gradually weakened, and the particles manifest stronger dislocation occlusion. The contact force chains demonstrate a more obvious gradient distribution for coral sand with a wider gradation, with contact forces being distributed in all directions, while the distribution of contact force chains is more concentrated for the coral sand with a narrower gradation. The coordination number inside the coral sand with a wider gradation is smaller, but it experiences a larger changing amplitude under the action of vertical force, which is macroscopically manifested as more significant volume compression effect.
(3) As the bonding strength (cohesion and friction angle) increases, K0 gradually decreases, but it no longer changes after the bonding strength reaches a threshold. The relationship between the bonding strength and the K0 approximately follows an exponential function. The theoretical formula with the highest computational accuracy is preferred on the basis of the existing formulas for calculating the K0 of land-sourced sand and the lower K0 value for coral sand. Furthermore, the distribution coefficient is introduced to propose a formula for calculating the K0 based on the distribution coefficient and the strength parameter. A comparison of calculated values with measured values demonstrates the high computational accuracy of this formula.
Data availability statement
The original contributions presented in the study are included in the article/supplementary material, further inquiries can be directed to the corresponding author.
Author contributions
RZ: Formal Analysis, Methodology, Software, Writing – original draft, Visualization. YoZ: Project administration, Conceptualization, Writing – review and editing, Supervision. PC: Writing – review and editing. FJ: Resources, Writing – review and editing. HL: Data curation, Writing – review and editing. YuZ: Writing – review and editing, Funding acquisition.
Funding
The author(s) declare that financial support was received for the research and/or publication of this article. This research was funded by the Natural Science Foundation of Hubei Province of China (Grants No. 2023AFB508 and 2025AFB432).
Conflict of interest
Authors RZ, YoZ, PC, FJ, HL, and YuZ were employed by CCCC Second Harbor Engineering Company Ltd.
Generative AI statement
The author(s) declare that no Generative AI was used in the creation of this manuscript.
Publisher’s note
All claims expressed in this article are solely those of the authors and do not necessarily represent those of their affiliated organizations, or those of the publisher, the editors and the reviewers. Any product that may be evaluated in this article, or claim that may be made by its manufacturer, is not guaranteed or endorsed by the publisher.
References
Belheine, N., Plassiard, J. P., Donzé, F. V., Darve, F., and Seridi, A. (2009). Numerical simulation of drained triaxial test using 3D discrete element modeling. Comput. Geotechnics 36 (1-2), 320–331. doi:10.1016/j.compgeo.2008.02.003
CCCC Second Navigation Engineering Survey and Design Institute (2022). JTS133. Specification for geotechnical investigation of water transport engineering (partial revision) - coral reef geotechnical investigation. Beijing: Beijing People's Communications Publishing House.
Chen, Y. Y., Tang, Y., Guan, Y. F., Liu, R. M., Han, X., Zhao, X., et al. (2022). Study on the mechanical properties of coral sands with different particle gradations. Marine Georesources and Geotechnology, 41 (3), 327–338. doi:10.1080/1064119X.2022.2037112
Donohue, S., O'sullivan, C., and Long, M. (2009). Particle breakage during cyclic triaxial loading of a carbonate sand. Géotechnique 59 (5), 477–482. doi:10.1680/geot.2008.T.003
Evans, T. M., and Valdes, J. R. (2011). The microstructure of particulate mixtures in one-dimensional compression: numerical studies. Granul. Matter 13 (5), 657–669. doi:10.1007/s10035-011-0278-z
Goldenberg, C., and Goldhirsch, I. (2005). Friction enhances elasticity in granular solids. Nature 435 (7039), 188–191. doi:10.1038/nature03497
Hendron, J., and Alfred, J. (1963). The behavior of sand in one-dimensional compression. Illinois: University of Illinois.
Jaky, I. (1944). The coefficient of Earth pressure at rest. J. Soc Hung. Archit. and Eng. doi:10.1139/t93-056
Meng, Q. S., Yu, K. F., Wang, R., Qin, Y., Wei, H. Z., and Wang, X. Z. (2014). Characteristics of rocky basin structure of yongshu reef in the southern South China Sea. Mar. Georesources and Geotechnol. 32 (4), 307–315. doi:10.1080/1064119x.2013.764553
Michalowski, R. L. (2005). Coefficient of earth pressure at rest. Journal of geotechnical and geoenvironmental engineering 131 (11), 1429–1433. doi:10.1061/(ASCE)1090-0241(2005)131:11(1429)
Rowe, P. (1957). “Ce = 0 hypothesis for normally loaded clays at equilibrium,” in Proceedings of the fourth international conference on soil mechanics and. London: Foundation Engineering, 189–192.
Rymsza, B. (1979). “Earth pressure at rest in design of retaining structures,” in Proceedings of 7th European conference on Soi1 mechanics and. Brighton: Foundation Engineering, 35–40.
Saglamer, A. (1975). “Soil parameters affecting coefficient of Earth pressure at rest of cohesionless soils,” in Proceedings of istanbul conference on soil mechanics and. Istanbul: Foundation Engineering, 34–41.
Smith, D. A., and Cheung, K. F. (2003). Settling characteristics of calcareous sand. J. Hydraulic Eng. 129 (6), 479–483. doi:10.1061/(asce)0733-9429(2003)129:6(479)
Stratton, R. E., and Wensrich, C. M. (2010). Modelling of multiple intra-time step collisions in the hard-sphere discrete element method. Powder Technol. 199 (2), 120–130. doi:10.1016/j.powtec.2009.12.008
Thompson, N., Bennett, M. R., and Petford, N. (2009). Analyses on granular mass movement mechanics and deformation with distinct element numerical modeling: implications for large-scale rock and debris avalanches. Acta Geotech. 4 (4), 233–247. doi:10.1007/s11440-009-0093-4
Wang, C., Liu, H., Ding, X., Wang, C., and Ou, Q. (2021). tudy on horizontal bearing characteristics of pile foundations in coral sand. Canadian Geotechnical Journal, 99 (999), 1928–1942. doi:10.1139/cgj-2020-0623
Wang, X. Z., Wang, X., Jin, Z. C., Meng, Q. S., Zhu, C. Q., and Wang, R. (2017). Shear characteristics of calcareous gravelly soil. Bull. Eng. Geol. Environ. 76, 561–573. doi:10.1007/s10064-016-0978-z
Wang, X., Zhu, C. Q., and Wang, X. Z. (2020). Experimental study on the coefficient of lateral pressure at rest for calcareous soils. Marine Georesources and Geotechnology, 38 (8), 989–1001. doi:10.1080/1064119X.2019.1646361
Xu, L. J., Wang, X., Wang, R., Zhu, C. q., and Liu, X. p. (2022). Physical and mechanical properties of calcareous soils: a review. Mar. Georesources and Geotechnol. 40 (6), 751–766. doi:10.1080/1064119x.2021.1927270
Xu, Z.-w., Zhou, G.-q., Liu, Z.-q., Zhao, X.-d., Li, S.-s., Zhang, L., et al. (2007). Study on the Test Method of Static Earth Pressure Coefficient of Deep Soils. Journal of China University of Mining and Technology, 17 (3), 330–334. doi:10.1016/S1006-1266(07)60099-6
Yuhang, T., Zhong, C., Weixia, H., Zhengyu, H., Wen, Y., Xuesong, W., et al. (2021). P-wave velocity properties and its influencing factors of coral reef limestone in Nansha area. Journal of Tropical Oceanography, 40 (1), 133–141. doi:10.11978/2020015
Zhang, J., Shamoto, Y., and Tokimatsu, K. (1998). Evaluation of earth pressure under any lateral deformation. Soils and foundations, 38 (1), 15–33. doi:10.3208/sandf.38.15
Keywords: road engineering, static lateral pressure coefficient, laboratory tests, coral sand, particle flow code, calculation formula of K0
Citation: Zhang R, Zhang Y, Chen P, Ji F, Luo H and Zhong Y (2025) K0 test and particle flow simulation of coral sands with different gradations. Front. Earth Sci. 13:1644997. doi: 10.3389/feart.2025.1644997
Received: 11 June 2025; Accepted: 17 July 2025;
Published: 30 July 2025.
Edited by:
Zhang Cong, Central South University Forestry and Technology, ChinaReviewed by:
Haifeng Liu, Chinese Academy of Sciences (CAS), ChinaBing Liu, Business School, Guilin University of Technology, China
Shasha Zhang, Chang’an university, China
Copyright © 2025 Zhang, Zhang, Chen, Ji, Luo and Zhong. This is an open-access article distributed under the terms of the Creative Commons Attribution License (CC BY). The use, distribution or reproduction in other forums is permitted, provided the original author(s) and the copyright owner(s) are credited and that the original publication in this journal is cited, in accordance with accepted academic practice. No use, distribution or reproduction is permitted which does not comply with these terms.
*Correspondence: Ruiyuan Zhang, MTM1NTQwODIxNTBAMTYzLmNvbQ==
 Ruiyuan Zhang
 Yongtao Zhang1