 Xin Qiao1
 Chengwen Wang
- 1PetroChina Tarim Oilfield Company, Korla, Xinjiang, China
- 2China University of Petroleum, Qingdao, Shandong, China
- 3CNPC Xibu Drilling Engineering Company Limited, Karamay, Xinjiang, China
Introduction: Optimizing fracturing parameters under multi-factor, complex conditions remains challenging in low-permeability reservoirs.
Methods: We extract stage-aware construction-curve features, compute composite correlations (Pearson, Kendall’s Tau, Random Forest), train an SSA-BP surrogate to predict open flow capacity (OFC), and apply a GA to optimize fluid volume, pump rate, and proppant concentration.
Results: Twenty key factors were retained. Among four regressors, SSA-BP performed best (highest R², lowest MSE). GA-optimized parameters improved OFC in multiple wells; a field application (Well A-X) showed increased daily gas and OFC after adjustments.
Discussion: The integrated feature-extraction + SSA-BP + GA workflow provides accurate OFC prediction and practical parameter optimization. Limitations include single-field data (∼70 wells) and SSA-BP computational cost; future work will expand datasets and explore lighter models.
1 Introduction
As the exploration and development of unconventional oil and gas resources continue to deepen, hydraulic fracturing technology has become a key method for enhancing the productivity of low-permeability reservoirs (Soliman et al., 2012; Wenrui et al., 2018; Li and Xu, 2024). However, optimizing fracturing parameters to maximize production remains a significant challenge in the oil and gas industry. Traditional methods for optimizing fracturing parameters often rely on numerical simulations and empirical formulas, which tend to be inefficient and insufficiently accurate when dealing with complex reservoir conditions and multivariable optimization (Clarkson, 2013; Lin et al., 2021).
In recent years, with the rapid development of big data and artificial intelligence technologies, data-driven methods have been widely applied in oil and gas development (Sircar et al., 2021; Tariq et al., 2021). Deep learning, in particular, has shown great potential in optimizing fracturing parameters due to its powerful data processing and pattern recognition capabilities. By learning from a large amount of historical fracturing data, deep learning models can automatically extract key features from the fracturing process and predict production performance under different parameter combinations, thereby achieving optimized fracturing design (Wang et al., 2021; Tabasi et al., 2022).
Fracturing parameter optimization methods can be broadly divided into two categories: traditional optimization methods and intelligent optimization methods (Yao et al., 2021; Deng et al., 2022). Traditional optimization methods include single-parameter optimization and multi-parameter optimization (Li et al., 2021). The former often employs sensitivity analysis to determine the impact of a single parameter on production, while the latter uses methods such as orthogonal experimental design or grey relational analysis to optimize multiple factors in combination (Gul et al., 2020). However, these methods typically focus on optimizing a single or a few fracturing parameters, failing to fully consider the overall impact of multi-parameter combinations on fracturing outcomes, and they lack in-depth analysis of parameter interactions under complex geological conditions (Mi et al., 2016; Al-Fatlawi et al., 2019). Furthermore, traditional optimization methods have a narrow search range and involve a large workload in the optimization process (Gao et al., 2006).
In contrast, intelligent optimization methods, which employ single or hybrid intelligent algorithms, can automatically design and optimize fracturing parameter combinations (Ahmed et al., 2021; Zhou et al., 2022). For example, Ma et al. proposed a hybrid intelligent algorithm capable of optimizing multiple types of fracturing parameters simultaneously (Jahandideh and Jafarpour, 2016). However, these intelligent methods still face certain limitations when dealing with multi-parameter combinations, especially when considering the strong heterogeneity of shale reservoirs.
To address these issues, researchers have proposed new integrated optimization algorithms. For instance, Deng et al. (Deng et al., 2022) introduced an integrated optimization method based on the SPSA algorithm nested with a binary search algorithm, which realizes the integrated optimization of discrete and continuous fracturing parameters. This method can automatically optimize fracturing parameter combinations and combined with a numerical flow model of subdivided horizontal wells, selects the optimal fracturing parameter combination by taking net present value (NPV) as the objective function. Luo et al. (Luo et al., 2024) proposed an automatic optimization process based on genetic algorithms (GA) and a modified PKN model to quickly predict fracture geometries and optimize fracture locations and fluid injection volumes. Liu et al. (2023) applied a method combining random forest algorithms and principal component analysis to optimize the fracturing parameters of shale oil horizontal wells, significantly improving post-fracture productivity.
In addition, with the rapid advancement of machine learning technology, deep learning and fracturing curve feature extraction techniques have gradually been applied to the optimization of fracturing parameters. For example, Chen et al. (2022) proposed a shale gas horizontal well production prediction model based on LSTM neural networks, successfully predicting future productivity of shale gas wells using time series forecasting methods. Similarly, Muther et al. (2022) proposed a fracturing optimization design method based on multi-agent algorithms, combining artificial neural networks and optimization algorithms to improve the efficiency of fracturing parameter design. However, these methods mostly focus on optimizing a single or a few fracturing parameters and fail to fully consider the overall impact of multi-parameter combinations on fracturing effectiveness, and they lack in-depth analysis of parameter interactions under complex geological conditions.
To address these shortcomings, this study proposes a new method combining deep learning and fracturing curve feature extraction for the optimization of fracturing parameters. First, we use fracturing curve feature extraction algorithms to identify key features closely related to productivity from fracturing data. Then, based on the extracted features, we build a deep learning model to predict productivity under different parameter combinations. Finally, we iteratively train the model using optimization algorithms to identify the optimal fracturing parameter combination that maximizes post-fracture productivity.
2 Methods and models
2.1 Comprehensive correlation coefficient
In this study, to more comprehensively evaluate the correlation between various features and the target variable, we combined Pearson correlation coefficient, Kendall’s Tau coefficient, and Random Forest feature importance to propose a method for calculating a comprehensive correlation coefficient (Sen, 1968; Archer and Kimes, 2008; Cohen et al., 2009). This method allows for an integrated assessment of the importance of each feature while preserving information on linear correlation, nonlinear correlation, and feature importance. The specific steps are as follows (see Equations 1–3).
First, we calculate the Pearson correlation coefficient, Kendall’s Tau coefficient, and Random Forest feature importance between each feature and the target variable.
Pearson correlation coefficient
Where
Kendall’s Tau coefficient
Where
Random Forest feature importance
Due to the differing scales of these correlation coefficients, we perform Min-Max normalization on each coefficient to standardize their impact in the comprehensive evaluation. Through normalization, the values of each coefficient are mapped to the range of 0–1, facilitating subsequent weighted summation.
To comprehensively consider Pearson correlation, Kendall’s Tau, and Random Forest feature importance, we assign weights
Where is the comprehensive correlation coefficient of feature, In this study, the weights are set as follows: = 0.4, = 0.3, and = 0.3. These weights were determined through sensitivity analysis on a subset of 10 wells, and the results were consistent with previous findings (Archer and Kimes, 2008), ensuring objectivity in parameter assignment.
2.2 Algorithm for extracting construction curve features
To enhance the predictive effectiveness of the data and increase the diversity of parameters, we propose an algorithm for extracting construction curve features. The purpose of this algorithm is to calculate the time ratio and fluid volume ratio at different stages (such as artificial main fracture extension, blockage-induced pressure, multi-fracture competition, filtration balance, filtration increase, etc.) during the hydraulic fracturing process at the wellhead. These ratios help us understand the relative contribution of each stage to the entire construction process. The algorithm determines the construction stage at each time point based on the logarithmic slope of net pressure and other conditions (such as bottomhole pressure, flow rate, etc.), and accumulates the corresponding time and fluid volume. The pseudocode (see Algorithm 1) for the algorithm is as follows:
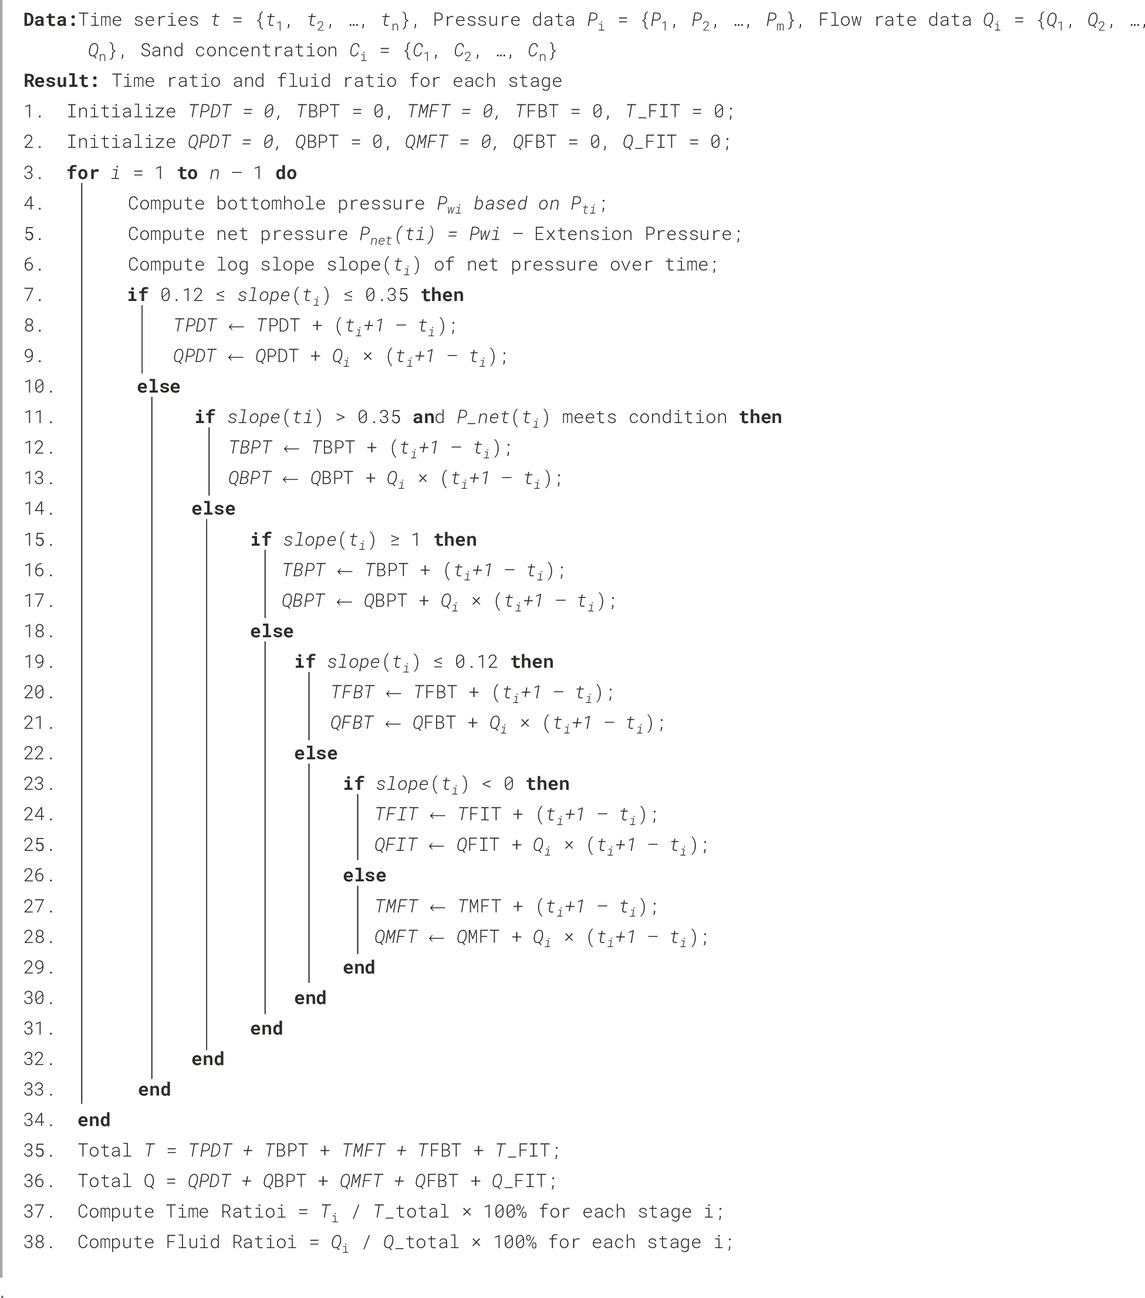
Algorithm 1. Algorithm for Calculating Time and Fluid Ratios for Different Extension Stages.
2.3 SSA-BP
SSA-BP (Salp Swarm Algorithm-Back Propagation) is a hybrid optimization algorithm that combines the Salp Swarm Algorithm (SSA) with the Back Propagation (BP) algorithm (), aimed at optimizing the training process of neural networks. The traditional BP algorithm works by calculating the gradient of the loss function with respect to the network weights and updating the weights through gradient descent, bringing the network’s output closer to the target value. However, BP algorithms tend to get trapped in local optima and converge slowly when dealing with complex non-convex optimization problems. The SSA-BP algorithm introduces the global search capability of SSA to overcome these limitations. In this study, the neural network consisted of an input layer with 20 neurons (corresponding to the selected features), one hidden layer with 15 neurons, and an output layer with one neuron representing OFC. The SSA population size was set to 50 and the maximum iteration number to 200, based on parameter tuning experiments to balance accuracy and efficiency. These implementation details ensure reproducibility of the model.
The basic idea of the SSA-BP algorithm is to use SSA for global search to find better initial weights, followed by local optimization and fine-tuning using the BP algorithm. SSA simulates the swarm behavior of salps, exploring better solutions within the search space. In SSA, the individuals (i.e., salps) are divided into leaders and followers. The leader is responsible for guiding the entire swarm towards a better solution, while the followers follow the leader, forming a continuously converging swarm. Figure 1 illustrates the Salp chain. Specifically, the SSA-BP algorithm is executed as follows:
1. Initialization: Randomly generate the initial weights and biases of the neural network, and initialize the position vectors
2. Salp Swarm Update: Based on the SSA algorithm, the salp individuals adjust their positions
3. Back Propagation: Using the current positions and states of the salp swarm, execute the BP algorithm to calculate the gradients of the neural network. Specifically, the BP algorithm updates the weights using the following formula as given in Equation 5.
where
4. Parameter Update: Update the neural network weights and biases based on the gradient information calculated by the BP algorithm, further reducing the error between the predicted output and the target value.
5. Termination Condition Check: If the preset termination conditions (such as reaching the maximum number of iterations or the error being below a certain threshold) are met, the algorithm terminates; otherwise, return to step 2 for the next iteration.
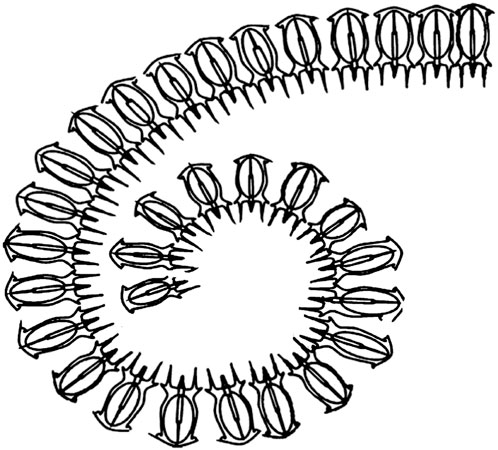
Figure 1. Salps chain.
By combining SSA and BP algorithms, the SSA-BP algorithm conducts a global search while performing local optimization with the BP algorithm, effectively enhancing the training performance of the neural network. It is particularly suitable for complex non-convex optimization problems and the training of large-scale neural networks.
2.4 Genetic algorithm
Genetic Algorithm (GA) is an optimization technique based on the principles of natural selection and genetics (Ghose, 2002). It simulates the process of biological evolution to search for the global optimal solution in a complex multi-dimensional space and possesses strong global search capabilities, making it widely used in engineering optimization fields. GA evolves a group of potential solutions (i.e., a population) to progressively approach the optimal solution. Each individual in the population is represented as a chromosome, usually encoded as a binary string or a real-valued vector. The core operations of the algorithm include the following:
1. Selection: Individuals are selected based on their fitness (i.e., the value of the objective function) to generate the next-generation. Common selection methods include roulette wheel selection, tournament selection, etc.
2. Crossover: The crossover operation combines the genetic information of two parent individuals to generate new offspring. This process helps explore new areas of the search space. Common crossover methods include single-point crossover, multi-point crossover, and uniform crossover.
3. Mutation: The mutation operation randomly alters the genes of an individual, ensuring diversity within the population and preventing the algorithm from becoming trapped in local optima. The mutation rate is generally set low to avoid excessive disruption of the current best solutions.
GA starts with an initial random population and evolves through the operations of selection, crossover, and mutation. Each generation produces a new population, which replaces the old one. The algorithm continues iterating until a termination condition is met, such as reaching the maximum number of iterations or achieving the desired objective function value.
In this study, the objective function is defined as the Open Flow Capacity (OFC), and the parameters to be optimized include fluid volume, pump rate, and proppant concentration defined in Equation 6.
where
2.5 Proposed model
This paper proposes a comprehensive framework based on machine learning, construction curve feature extraction, and a hybrid optimization model, aiming to improve the accuracy of parameter optimization. The core structure of the model, as shown in Figure 2, consists of four parts:
1 Construction Curve Feature Extraction: A construction curve feature extraction algorithm is used to extract key features from the fracturing construction curves. These features include the Proppant-dominated Fracture Extension Time Ratio (PDT), Blockage-induced Pressure Time Ratio (BPT), Multi-Fracture Competition Time Ratio (MFT), Filtration Balance Time Ratio (FBT), Filtration Increase Time Ratio (FIT), and corresponding fluid volume ratio features such as the Proppant-dominated Fracture Extension Fluid Ratio (PDF), Blockage-induced Pressure Fluid Ratio (BPF), Multi-Fracture Competition Fluid Ratio (MFF), Filtration Balance Fluid Ratio (FBF), and Filtration Increase Fluid Ratio (FIF). These features effectively reflect the dynamic changes during different stages of the construction process and provide critical input for model training and optimization.
2. Feature Selection: A comprehensive correlation coefficient method is employed, which combines Pearson correlation coefficient, Random Forest feature importance, and Kendall’s Tau coefficient. This method is used to obtain the comprehensive correlation coefficients of the features with the target variable (such as Open Flow Capacity, OFC). The goal is to select features that significantly influence OFC while eliminating those with low correlation, thus enabling rapid dimensionality reduction.
3. SSA-BP Model Training: The extracted feature data are utilized to construct and train an SSA-BP model, which combines the Salp Swarm Algorithm (SSA) and Back Propagation (BP) algorithm. SSA is first used to perform a global search and determine the initial parameters, after which BP is applied to locally optimize the parameters, progressively enhancing the model’s predictive accuracy.
4. Fracturing Parameter Optimization: Based on the trained SSA-BP model, the fracturing construction parameters (fluid volume, pump rate, and proppant concentration) are optimized. These three parameters were selected because they exhibited the highest comprehensive correlation scores with OFC in our dataset, and because they are widely recognized as critical factors controlling fracture geometry and conductivity. Although these parameters are generally important across fracturing operations, the proposed framework is flexible and can incorporate additional parameters (e.g., fluid viscosity, stage spacing) under different reservoir conditions. with the objective of maximizing OFC. During the optimization process, the best parameter combination is identified with the goal of maximizing production capacity, ultimately yielding an optimal fracturing construction plan.
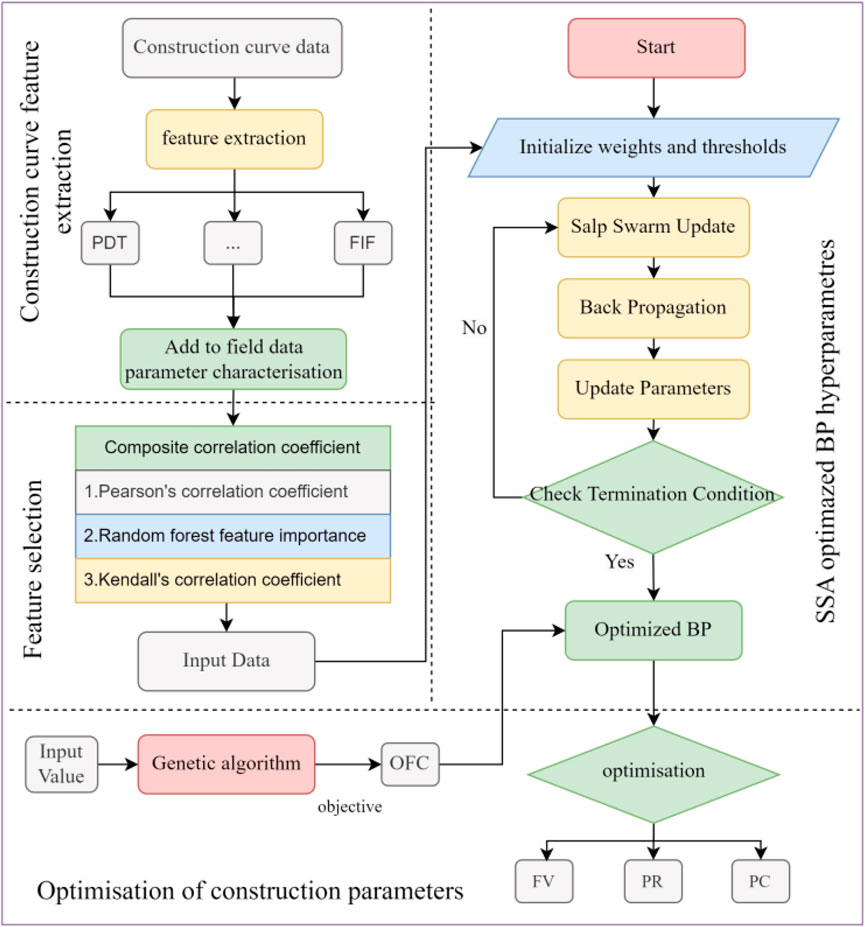
Figure 2. Flowchart of the proposed framework combining machine learning and hybrid optimization, including Construction Curve Feature Extraction, Feature Selection, SSA-BP Model Training, and Fracturing Parameter Optimization.
3 Results and discussion
3.1 Field data
The study area is located in the A gas field of the Tarim Basin, which is a typical fractured gas reservoir. The reservoir is primarily composed of the Bashijiqike Formation and Baxigai Formation of the Cretaceous system. The lithology mainly consists of fine to medium-grained feldspathic lithic sandstones and lithic feldspathic sandstones. The reservoir exhibits significant characteristics of extremely low porosity and permeability. The porosity ranges from 3.5% to 10%, while the matrix permeability varies between 0.035 mD and 0.5 mD. The reservoir pore types mainly include residual intergranular pores, intergranular dissolution-enlarged pores, and intragranular dissolution pores. In certain areas, micropores and microfractures are also developed. The natural fracture system in this area is well developed, and the presence of fractures significantly enhances the reservoir’s flow capacity. The fracture permeability can reach millidarcy or even Darcy levels, significantly improving the effective flow capacity of the reservoir, which has low matrix permeability and limited utilization. The development of fractures in the vertical direction is controlled by lithology, with fractures being more densely distributed in fault zones or structurally complex areas, exhibiting strong heterogeneity. Additionally, the formation pressure coefficient in the area ranges from 1.58 to 2.08, indicating abnormally high pressure. The formation temperature ranges between 101.85 °C and 165.63 °C, representing a normal temperature system. The complex geological conditions and reservoir properties make the development of this area challenging, necessitating precise optimization of construction parameters and advanced machine learning methods to enhance production capacity and development efficiency.
The data sources include on-site construction records, geological data, and production data. To improve the accuracy of prediction results, this paper introduces construction curve features and collects favorable parameters from a total of 70 wells subjected to proppant fracturing. A database dedicated to analyzing the main control factors affecting Open Flow Capacity (OFC) was established, as shown in Table 1.
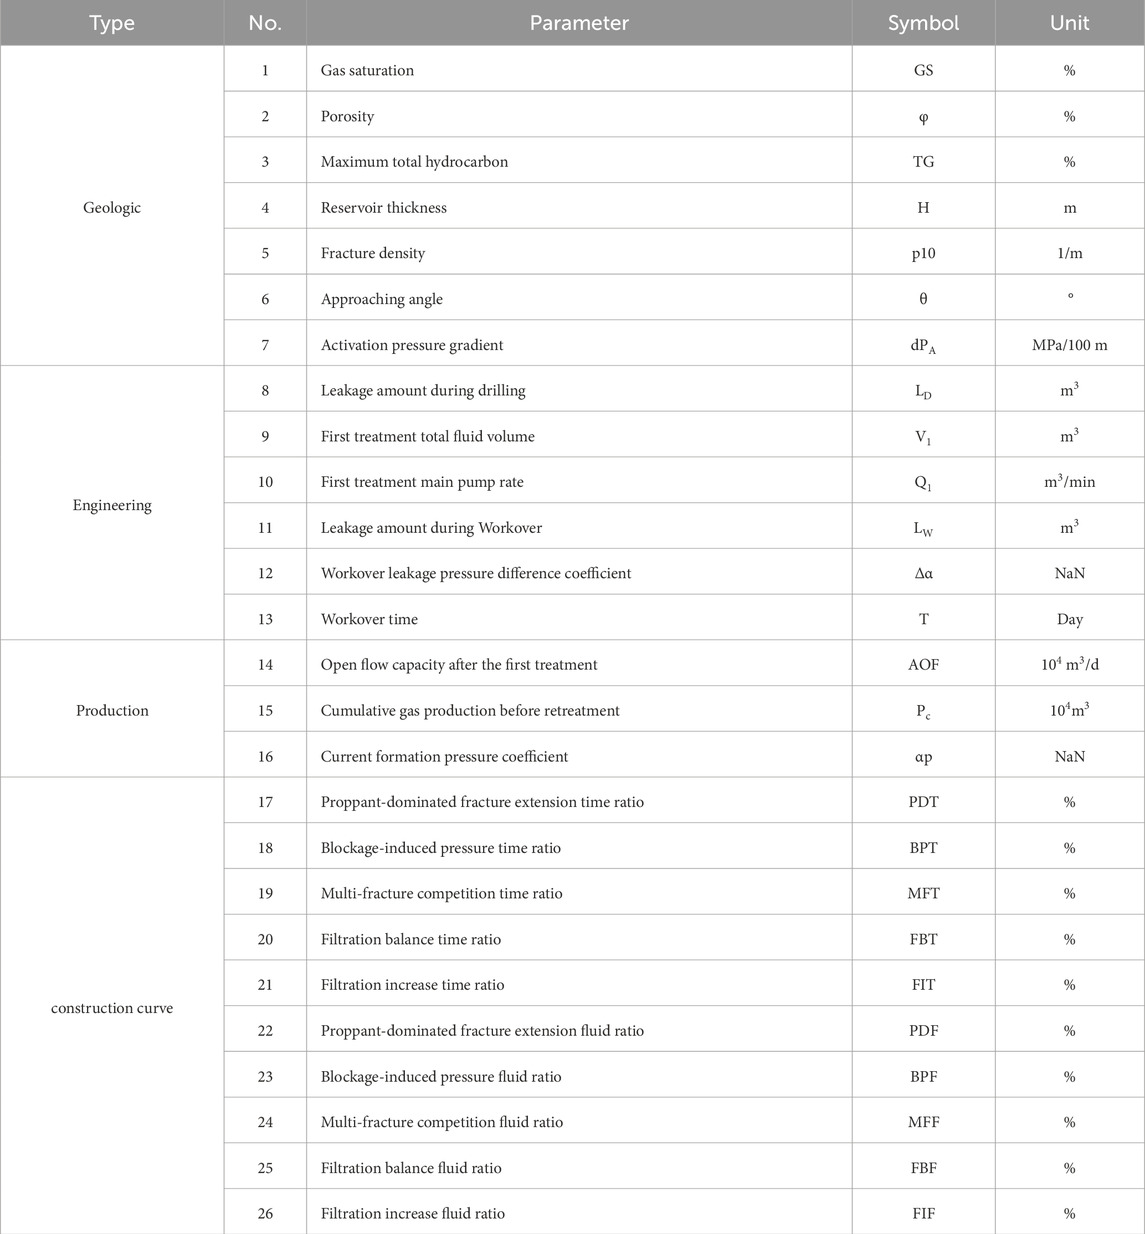
Table 1. Possible factors influencing open flow capacity (OFC).
3.2 Identification of key influencing factors
In the process of hydraulic fracturing, identifying the key factors that influence Open Flow Capacity (OFC) is a crucial step for optimizing construction parameters. By conducting an in-depth analysis of the features extracted from the construction curves, it is possible to effectively identify parameters closely related to OFC. These features, combined with geological, engineering, and production data, form a new dataset for analysis.
Initially, several characteristic parameters from the construction curves are preliminarily screened, including time ratio features (such as Proppant-Dominated Fracture Extension Time Ratio and Blockage-Induced Pressure Time Ratio) and fluid ratio features (such as Proppant-Dominated Fracture Extension Fluid Ratio and Blockage-Induced Pressure Fluid Ratio). Subsequently, a comprehensive correlation coefficient method is applied, which integrates Pearson correlation, random forest feature importance, and Kendall’s Tau coefficient to quantitatively evaluate the correlation between each feature and OFC. By calculating the comprehensive correlation coefficient for each feature, the degree to which each feature impacts OFC during hydraulic fracturing can be determined.
Finally, based on the magnitude of the comprehensive correlation coefficients, the most significant factors affecting OFC are identified. These key influencing factors will be the focus of subsequent optimization of construction parameters, aiming to enhance the overall effectiveness of hydraulic fracturing and maximize OFC.
Based on the Open Flow Capacity (OFC) key influencing factors ranking calculated using the comprehensive correlation coefficient method, factors with a comprehensive correlation score lower than 0.1 were discarded. A total of 20 key factors affecting the repeated stimulation outcomes were selected, as shown in Figure 3. The factors are listed in descending order of their scores, with the most significant ones being: Filtration Increase Time Ratio (FIT, 0.38), Workover Time (T, 0.38), Multi-Fracture Competition Time Ratio (MFT, 0.33), Filtration Increase Fluid Ratio (FIF, 0.28), Multi-Fracture Competition Fluid Ratio (MFF, 0.28), Post-First Stimulation Open Flow Capacity (AOF, 0.36), Reservoir Thickness (H, 0.23), Fluid Loss During Workover (LW, 0.18), Total Scale of First Stimulation (V1, 0.16), Porosity (φ, 0.14), Approaching Angle (θ, 0.13), Fracture Activation Pressure Gradient (dPA, 0.13), Filtration Balance Time Ratio (FBT, 0.12), Cumulative Gas Production After First Stimulation (Pc, 0.12), Current Formation Pressure Coefficient (αp, 0.12), Proppant-Dominated Fracture Extension Fluid Ratio (PDF, 0.11), Proppant-Dominated Fracture Extension Time Ratio (PDT, 0.11), Maximum Total Hydrocarbon Content (TG, 0.11), and Fracture Density (p10, 0.10).
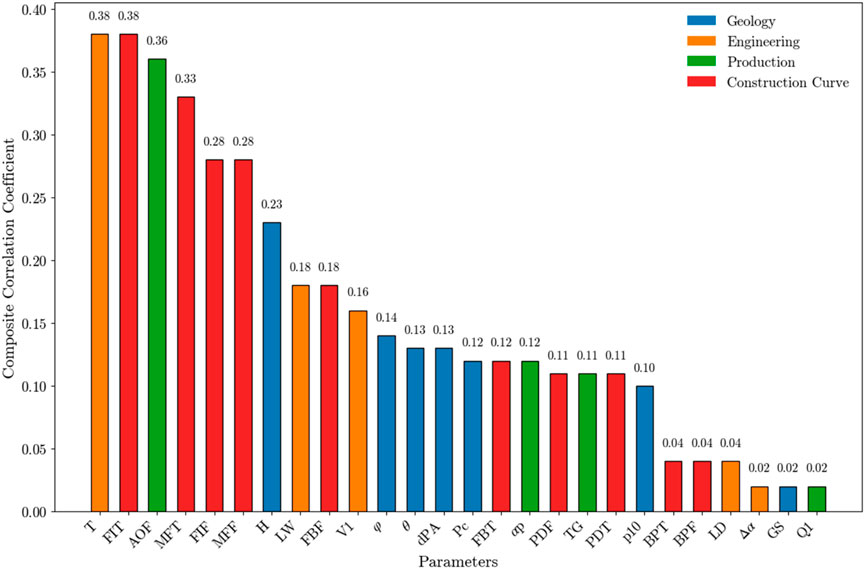
Figure 3. The ranking results based on the composite correlation coefficients for Open Flow Capacity (OFC).
3.3 Prediction model construction and validation
In constructing the prediction model, this study integrates data-driven models with optimization algorithms to enhance the accuracy and robustness of the predictions. Initially, feature extraction and selection methods are applied to the construction curves to identify the variables most strongly correlated with Open Flow Capacity (OFC). The SSA-BP (Salp Swarm Algorithm-Back Propagation) hybrid optimization algorithm is then employed to train and fine-tune the model.
The SSA-BP algorithm leverages the global search capabilities of the Salp Swarm Algorithm (SSA) alongside the local optimization characteristics of the Back Propagation (BP) neural network. This combination effectively prevents the model from becoming trapped in local optima and accelerates the convergence process. During training, the SSA algorithm is first used to globally optimize the initial weights and thresholds of the neural network. Subsequently, the BP algorithm is employed to further fine-tune the parameters locally, gradually improving the model’s prediction accuracy.
For model validation, 80% of the data was randomly selected as the training set, with the remaining 20% used as the test set. The experimental results from four regression models (as shown in Table 2) and the comparison between the predicted and actual values of the test samples (as shown in Figure 4) reveal that, except for the Adaboost algorithm, the coefficient of determination (R2) of the other three algorithms exceeds 0.7. The SSA-BP algorithm achieved the highest coefficient of determination and the lowest mean squared error, indicating that its fit was closest to the actual values. This demonstrates that the key factors selected in this study explain up to 84% of the productivity variation, confirming the strong predictive capability of the SSA-BP model.
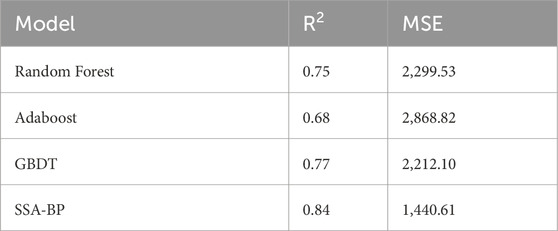
Table 2. Evaluation results of four regression models.
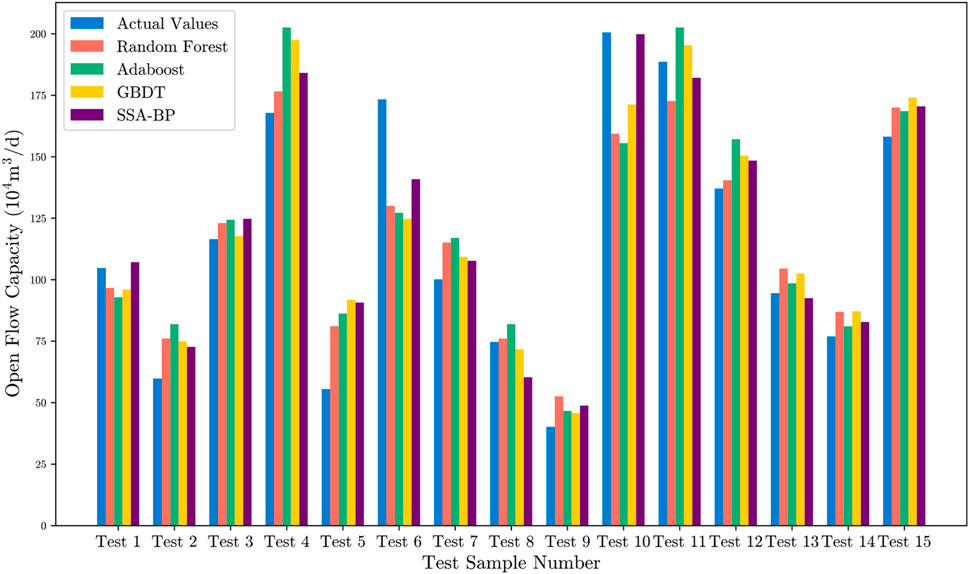
Figure 4. Comparison between predicted and actual values on the test set across four regression models.
3.4 Fracturing parameter optimization
Using the SSA-BP model as a predictive surrogate model for post-fracturing open flow capacity (OFC), systematic optimization was conducted on the key parameters of the fracturing process to maximize OFC. The optimization process mainly involved three critical parameters: fluid volume, pump rate, and proppant volume. The search ranges were set within controllable limits: fluid volume between 200 and 2,500 m3, proppant volume between 0.69 and 220.0 m3, and pump rate between 1.5 and 6.0 m3/min.
The genetic algorithm involved several parameter settings and methods. In this study, binary encoding was chosen following the genetic algorithm’s workflow; the initial population size was set to 200, and the fitness function was the SSA-BP production prediction model. Roulette wheel selection, uniform crossover, and simple inversion mutation were employed as genetic operators. The optimization objective was set to maximize post-fracturing OFC, and the genetic algorithm was applied to optimize the fracturing parameters for wells A-2, A-13, and A-15. The comparison results of parameter optimization are shown in Table 3.
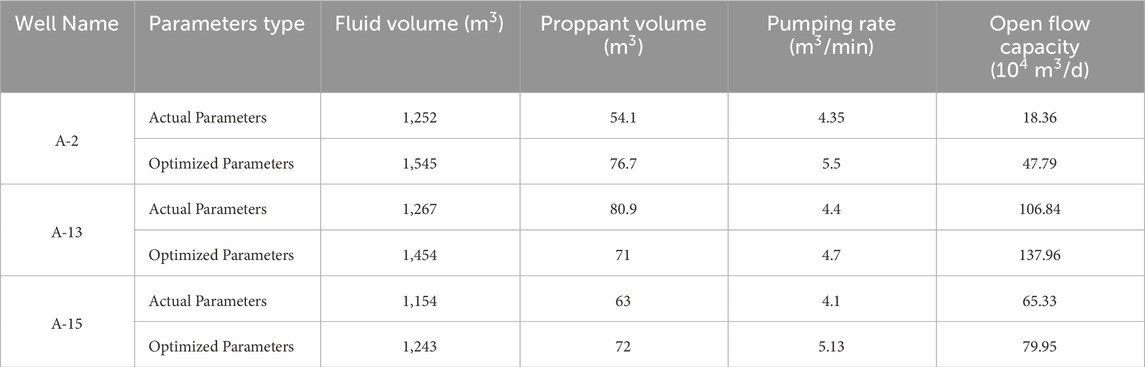
Table 3. Genetic algorithm parameter optimization R.
By comparing the fracturing parameter optimization results of the three wells, it was found that the optimized fluid volume and pump rate were significantly higher than the actual total volume, and the optimized proppant volume also increased notably. The parameter relationship diagram for the optimized A-13 well is shown in Figure 5, where the factor value distribution is relatively reasonable. After optimization, the OFC of wells A-2, A-13, and A-15 increased by 29.43 × 10⁴ m3/d, 31.12 × 10⁴ m3/d, and 14.62 × 10⁴ m3/d, respectively. Therefore, the fracturing parameter optimization method, combining the SSA-BP production prediction model and genetic algorithm, can effectively enhance post-fracturing production, achieving significant production improvement. This optimization method employs a surrogate model-based approach, avoiding dependence on fracturing numerical simulation, thus significantly reducing optimization time.
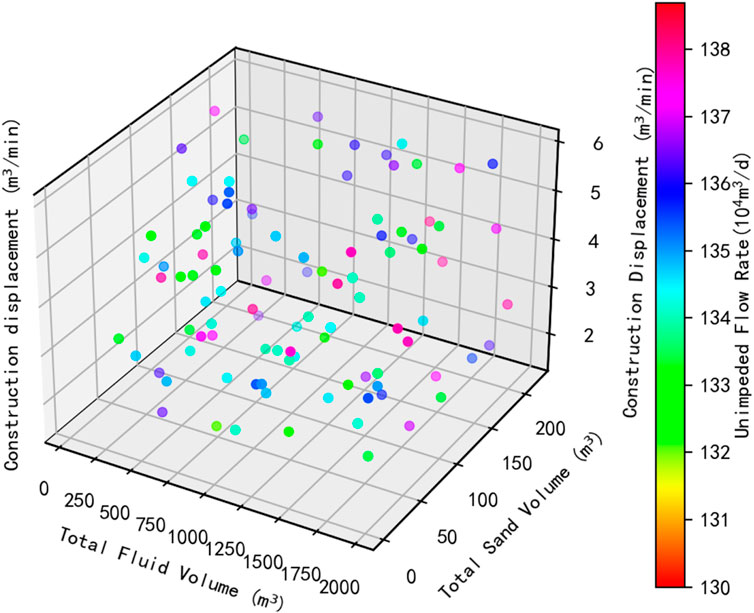
Figure 5. Distribution of optimized fracturing parameters for well A-13.
4 Field application
During the first fracturing operation of well A-X, a total fluid volume of 687.3 cubic meters was used. This included 251.69 cubic meters of high-displacement pad fluid (with stage plug, 4.83 tons of 70/100 mesh proppant), 180.32 cubic meters of high-displacement proppant-laden fluid (with 5.05 tons of 40/70 mesh proppant), 241.79 cubic meters of high-displacement pad fluid (with stage plug, 2.93 tons of 40/70 mesh proppant), and 176.89 cubic meters of high-displacement proppant-laden fluid (with 4.91 tons of 40/70 mesh proppant). The maximum pumping rate was 4.4 cubic meters per minute, with a total proppant usage of 76.5 tons. The highest pump pressure reached 105 MPa, and all operational parameters were within the design range, with no abnormal fluctuations or incidents. The fracturing curve is shown in Figure 6.
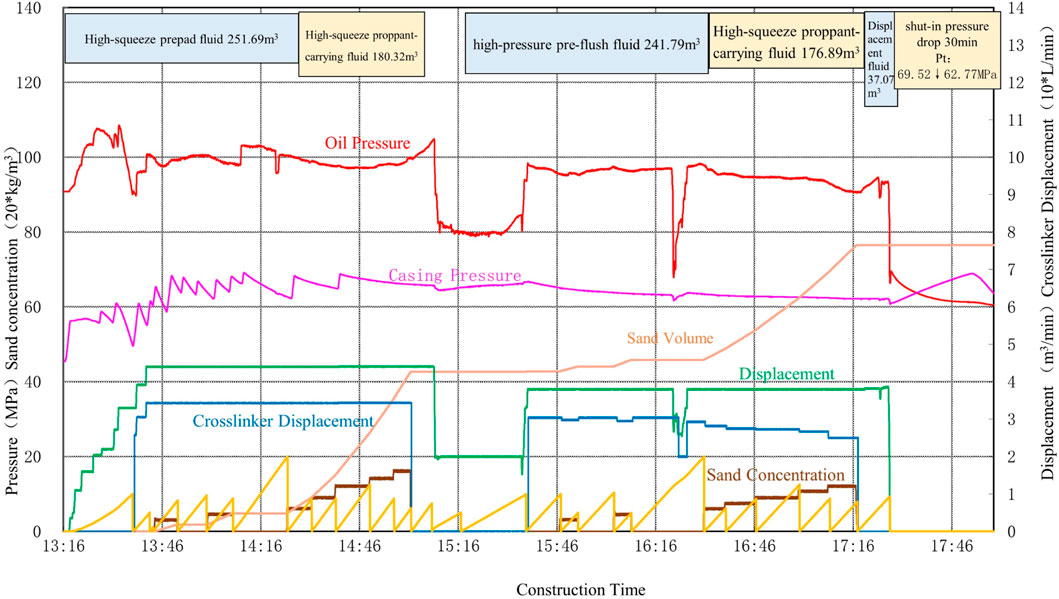
Figure 6. The initial fracturing operation curve of Well A-X.
Based on the actual data from the initial fracturing and feedback from the model, we made adjustments to the operational parameters. The adjusted total fluid volume and proppant volume were optimized, with the maximum pumping rate slightly increased to 4.7 cubic meters per minute and the proppant volume optimized to 80.2 tons to further enhance fracture conductivity and improve production capacity. The production test results showed a significant increase in daily gas production for well A-X, reaching 558,000 cubic meters, with the open flow capacity increasing to 1.01 million cubic meters per day, further validating the effectiveness of the model and its application in operational optimization.
5 Conclusion
1. By employing the construction curve feature extraction method, key characteristics such as time and fluid ratios at different stages of the fracturing process—including proppant-dominated fracture extension, blockage pressure, multi-fracture competition, filtration balance, and filtration increase—were effectively identified. These characteristics significantly impact production capacity and provide valuable guidance for optimizing fracturing outcomes.
2. Considering geological, engineering, production parameters, and construction curve characteristics of individual wells, a combined analysis method using Pearson correlation, Kendall’s Tau correlation, and random forest feature importance was employed. This method comprehensively identified 20 key factors influencing the open flow capacity (OFC) of the A gas field.
3. Based on the identified key factors, the SSA-BP hybrid optimization model was used to optimize the fracturing parameters of wells in the A gas field. This model successfully enhanced prediction accuracy by combining the global search capability of the Salp Swarm Algorithm (SSA) with the local optimization capability of the Back Propagation (BP) algorithm.
4. The fracturing construction parameters for wells in the A gas field were optimized using a genetic algorithm, ultimately determining the optimal combination of key parameters such as fluid volume, pump rate, and proppant concentration. This optimization significantly improved the effectiveness of the fracturing operation.
5. Following the initial fracturing operation, we made adjustments to the construction parameters. By increasing the total fluid volume, optimizing the proppant concentration, and slightly increasing the maximum pump rate, we successfully enhanced the production capacity of Well A-X. The adjusted construction parameters resulted in a significant increase in daily gas production, reaching 558,000 cubic meters, with an open flow capacity of 1.01 million cubic meters per day. This validated the effectiveness and applicability of the model in optimizing fracturing operations. Main findings: (1) Construction curve feature extraction effectively captured critical dynamic characteristics; (2) A total of 20 key influencing factors were identified through comprehensive correlation analysis; (3) The SSA-BP model explained 84% of the productivity variation, outperforming other algorithms; (4) Genetic Algorithm optimization significantly improved open flow capacity in multiple wells. Limitations: The study used data from 70 wells in a single field, which may restrict generalizability. SSA-BP also involves relatively high computational cost. Future work: Expanding the dataset, validating in other reservoirs, and exploring lightweight models will further enhance applicability. Contributions: This work is among the first to integrate construction curve feature extraction with hybrid optimization for fracturing parameter design in Tarim Basin, providing methodological innovation and field-proven improvements in gas production.
Data availability statement
The original contributions presented in the study are included in the article/supplementary material, further inquiries can be directed to the corresponding author.
Author contributions
XQ: Formal Analysis, Data curation, Writing – original draft. DR: Resources, Project administration, Writing – review and editing, Data curation. JL: Project administration, Investigation, Writing – original draft. CW: Writing – review and editing, Data curation, Formal Analysis, Writing – original draft, Conceptualization. FnP: Visualization, Project administration, Methodology, Writing – original draft. BZ: Writing – original draft, Validation, Supervision. FiP: Writing – original draft, Methodology, Validation. QF: Writing – original draft, Methodology, Project administration. CH: Validation, Writing – review and editing, Supervision.
Funding
The author(s) declare that financial support was received for the research and/or publication of this article. This research was supported by the D-Class Project T202316—“Notice on the Budget Approval for the Second Batch of Scientific and Technological Projects in 2023 (Budget Office (2023) No. 2)” under “Research and Application of Well Reconstruction Technology in Complex Reservoirs.”
Conflict of interest
Authors XQ, DR, JL, FnP, BZ, and FiP were employed by PetroChina Tarim Oilfield Company. Author CH was employed by CNPC Xibu Drilling Engineering Company Limited.
The remaining authors declare that the research was conducted in the absence of any commercial or financial relationships that could be construed as a potential conflict of interest.
Generative AI statement
The author(s) declare that no Generative AI was used in the creation of this manuscript.
Any alternative text (alt text) provided alongside figures in this article has been generated by Frontiers with the support of artificial intelligence and reasonable efforts have been made to ensure accuracy, including review by the authors wherever possible. If you identify any issues, please contact us.
Publisher’s note
All claims expressed in this article are solely those of the authors and do not necessarily represent those of their affiliated organizations, or those of the publisher, the editors and the reviewers. Any product that may be evaluated in this article, or claim that may be made by its manufacturer, is not guaranteed or endorsed by the publisher.
References
Ahmed, A., Elkatatny, S., and Ali, A. (2021). Fracture pressure prediction using surface drilling parameters by artificial intelligence techniques. J. Energy Resour. Technol. 143 (3), 033201. doi:10.1115/1.4049125
Al-Fatlawi, O., Hossain, M., and Essa, A. (2019). Optimization of fracture parameters for hydraulic fractured horizontal well in a heterogeneous tight reservoir: an equivalent homogeneous modelling approach. Richardson, TX: Society of Petroleum Engineers (SPE).
Archer, K. J., and Kimes, R. V. (2008). Empirical characterization of random forest variable importance measures. Comput. statistics and data analysis 52 (4), 2249–2260. doi:10.1016/j.csda.2007.08.015
Chen, X., Li, J., Gao, P., and Zhou, J. (2022). Prediction of shale gas horizontal wells productivity after volume fracturing using machine learning–an LSTM approach. Petroleum Sci. Technol. 40 (15), 1861–1877. doi:10.1080/10916466.2022.2032739
Clarkson, C. R. (2013). Production data analysis of unconventional gas wells: Review of theory and best practices. Int. J. Coal Geol. 109, 101–146. doi:10.1016/j.coal.2013.01.002
Cohen, I., Huang, Y., Chen, J., Benesty, J., Benesty, J., Chen, J., et al. (2009). Pearson correlation coefficient. Noise reduction in speech processing. 1–4.
Deng, H., Sheng, G., Zhao, H., Meng, F., Zhang, H., Ma, J., et al. (2022). Integrated optimization of fracture parameters for subdivision cutting fractured horizontal wells in shale oil reservoirs. J. Petroleum Sci. Eng. 212, 110205. doi:10.1016/j.petrol.2022.110205
Gao, H., Cheng, L., and Qu, Z. (2006). Optimization of the fracture parameters of fractured horizontal wells. Xian Shiyou Daxue Xuebao Ziran Kexue Ban. 21 (2), 29.
Ghose, T. (2002). Optimization technique and an introduction to genetic algorithms and simulated annealing, 1–19.
Gul, M., Kalam, M., Mujtaba, M., Alam, S., Bashir, M. N., Javed, I., et al. (2020). Multi-objective-optimization of process parameters of industrial-gas-turbine fueled with natural gas by using Grey-Taguchi and ANN methods for better performance. Energy Rep. 6, 2394–2402. doi:10.1016/j.egyr.2020.08.002
Jahandideh, A., and Jafarpour, B. (2016). Optimization of hydraulic fracturing design under spatially variable shale fracability. J. Petroleum Sci. Eng. 138, 174–188. doi:10.1016/j.petrol.2015.11.032
Li, Y., and Xu, Y. (2024). Recent advances in tight oil reservoir development: integrated technology of horizontal drilling and hydraulic fracturing. Adv. Resour. Res. 4 (3), 300–317.
Li, Y., Hu, W., Zhang, Z., Zhang, Z., Shang, Y., Han, L., et al. (2021). Numerical simulation of hydraulic fracturing process in a naturally fractured reservoir based on a discrete fracture network model. J. Struct. Geol. 147, 104331. doi:10.1016/j.jsg.2021.104331
Lin, Y., Liu, S., Gao, S., Yuan, Y., Wang, J., and Xia, S. (2021). Study on the optimal design of volume fracturing for shale gas based on evaluating the fracturing effect—A case study on the Zhao Tong shale gas demonstration zone in Sichuan, China. J. Petroleum Explor. Prod. 11, 1705–1714. doi:10.1007/s13202-021-01134-0
Liu, X., Li, D., Jia, Y., Liyong, Y., Xiaoting, G., Tao, Z., et al. (2023). Optimizing construction parameters for fractured horizontal wells in shale oil. Front. Earth Sci. 10, 1015107. doi:10.3389/feart.2022.1015107
Luo, Z., and Xi, H. (2024). Hybrid model based on copula mutual information and SSA-BP: analysis of key factors and prediction of stable gas production. Arabian J. Sci. Eng. 50, 4673–4685. doi:10.1007/s13369-024-09205-0
Luo, S., Tang, H., Zhang, L., Wang, T., Zhao, Y., and Chen, W. (2024). Efficient optimization of fracturing parameters with consideration of fracture propagation and heterogeneity in tight gas reservoirs. Comput. and Geosciences 186, 105563. doi:10.1016/j.cageo.2024.105563
Mi, L., Jiang, H., Wang, Y., Pei, Y., Li, J., Gao, S., et al. (2016). Hydraulic fracture optimization based on discrete fracture network model in shale reservoirs. IPTC, D031S044R001. doi:10.2523/iptc-18884-ms
Muther, T., Syed, F. I., Dahaghi, A. K., and Negahban, S. (2022). Socio-inspired multi-cohort intelligence and teaching-learning-based optimization for hydraulic fracturing parameters design in tight formations. J. Energy Resour. Technol. 144 (7), 073201. doi:10.1115/1.4052182
Sen, P. K. (1968). Estimates of the regression coefficient based on Kendall's tau. J. Am. Stat. Assoc. 63 (324), 1379–1389. doi:10.2307/2285891
Sircar, A., Yadav, K., Rayavarapu, K., Bist, N., and Oza, H. (2021). Application of machine learning and artificial intelligence in oil and gas industry. Petroleum Res. 6 (4), 379–391. doi:10.1016/j.ptlrs.2021.05.009
Soliman, M., Daal, J., and East, L. (2012). Fracturing unconventional formations to enhance productivity. J. Nat. gas Sci. Eng. 8, 52–67. doi:10.1016/j.jngse.2012.01.007
Tabasi, S., Tehrani, P. S., Rajabi, M., Wood, D. A., Davoodi, S., Ghorbani, H., et al. (2022). Optimized machine learning models for natural fractures prediction using conventional well logs. Fuel 326, 124952. doi:10.1016/j.fuel.2022.124952
Tariq, Z., Aljawad, M. S., Hasan, A., Murtaza, M., Mohammed, E., El-Husseiny, A., et al. (2021). A systematic review of data science and machine learning applications to the oil and gas industry. J. Petroleum Explor. Prod. Technol. 11, 4339–4374. doi:10.1007/s13202-021-01302-2
Wang, S., Qin, C., Feng, Q., Javadpour, F., and Rui, Z. (2021). A framework for predicting the production performance of unconventional resources using deep learning. Appl. Energy 295, 117016. doi:10.1016/j.apenergy.2021.117016
Wenrui, H., Yi, W., and Jingwei, B. (2018). Development of the theory and technology for low permeability reservoirs in China. Petroleum Explor. Dev. 45 (4), 685–697. doi:10.1016/s1876-3804(18)30072-7
Yao, J., Li, Z., Liu, L., Fan, W., Zhang, M., and Zhang, K. (2021). Optimization of fracturing parameters by modified variable-length particle-swarm optimization in shale-gas reservoir. SPE J. 26 (02), 1032–1049. doi:10.2118/205023-pa
Zhou, J., Wang, H., Xiao, C., and Zhang, S. (2022). Hierarchical surrogate-assisted evolutionary algorithm for integrated multi-objective optimization of well placement and hydraulic fracture parameters in unconventional shale gas reservoir. Energies 16 (1), 303. doi:10.3390/en16010303
Nomenclature
T Workover time (Day)
AOF Open flow capacity after the first treatment (104 m3/d)
H Reservoir thickness (m)
LW Leakage amount during Workover (m3)
V1 First treatment total fluid volume (m3)
φ Porosity (%)
θ Approaching angle (°)
Keywords: fracturing optimization, construction curve feature extraction, deep learning, hybrid optimization model, open flow capacity
Citation: Qiao X, Ren D, Liu J, Wang C, Peng F, Zhong B, Peng F, Feng Q and Huang C (2025) Research on intelligent fracturing parameter optimization method based on deep learning and construction curve feature extraction. Front. Earth Sci. 13:1658142. doi: 10.3389/feart.2025.1658142
Received: 02 July 2025; Accepted: 10 September 2025;
Published: 21 November 2025.
Edited by:
Soroush Abolfathi, University of Warwick, United KingdomReviewed by:
Zhengzheng Cao, Henan Polytechnic University, ChinaNadège Mbula Ngoy, Central South University, China
Copyright © 2025 Qiao, Ren, Liu, Wang, Peng, Zhong, Peng, Feng and Huang. This is an open-access article distributed under the terms of the Creative Commons Attribution License (CC BY). The use, distribution or reproduction in other forums is permitted, provided the original author(s) and the copyright owner(s) are credited and that the original publication in this journal is cited, in accordance with accepted academic practice. No use, distribution or reproduction is permitted which does not comply with these terms.
*Correspondence: Chengwen Wang, ODQ4MDIxNjRAcXEuY29t