 Chaofei Li
 Tianbin Li1*
 Fuan Lan
- 1 State Key Laboratory of Geohazard Prevention and Geoenvironment Protection, Chengdu University of Technology, Chengdu, Sichuan, China
- 2 Sichuan Lexi Expressway Co., Ltd., Chengdu, Sichuan, China
Introduction: Frequent landslides along the Lexi highway have significantly hindered the construction and operation of engineering projects, impeding regional development. This study aims to clarify the distribution patterns and regional risks of these landslides to support risk management.
Methods: An ensemble learning fusion model, combining Random Forest (RF) and Extreme Gradient Boosting (XGBoost) via a Stacking algorithm, was first constructed to evaluate landslide susceptibility. Subsequently, the SBAS-InSAR method was applied to analyze long-term Sentinel-1A ascending and descending orbit data to determine surface deformation rates. Finally, a comprehensive susceptibility evaluation matrix was developed by integrating the susceptibility results with the deformation rates to generate a landslide comprehensive susceptibility map.
Results: Landslide sites are densely distributed along the Lexi highway, with an areal density of 15 landslides per 100 km2 and a linear density of 0.89 landslides per kilometer; The influence of distance to the fault zones, human activity intensity and rainfall on the distribution of landslides along the Lexi highway is the most significant, with the importance indexes of 0.27, 0.24, 0.21, respectively; Compared to other models, the Stacking ensemble learning fusion model shows superior predictive performance and generalization ability, achieving an AUC of 0.977 in evaluating landslide susceptibility along the Lexi highway; The landslide comprehensive susceptibility map effectively identifies regions with significant deformation, reducing very low and low susceptibility zones while increasing very high susceptibility zones by about 1.1%.
Discussion: The ensemble learning fusion model with InSAR-derived deformation data significantly improved the accuracy of the landslide susceptibility assessment. This comprehensive approach effectively reduces false alarms in areas with intensive engineering and high deformation rates, providing a more scientifically-grounded basis for landslide risk prevention and control along the Lexi highway.
1 Introduction
The western Sichuan Plateau gradient zone is located on the eastern edge of the Qinghai-Tibet Plateau. It is a region with highly complex topography and geology, featuring steep terrain, high seismic intensity, a fragile geological environment, and frequent geohazards (Gong et al., 2022; Wang et al., 2022; Xu et al., 2022; Peng et al., 2023). The Lexi Highway is located within the edge of this gradient zone, where a large number of landslide hazards have had serious impacts on both the ongoing highway construction and its future normal operation (Lu and Cai, 2019; Peng et al., 2020; Yi et al., 2023). Therefore, reliable landslide susceptibility assessment plays a crucial role in managing landslide risks along the highway and identifying potential landslides.
Landslide susceptibility evaluation involves analyzing the spatial distribution law to establish the relationship between environmental factors and landslide occurrence, thus predicting areas prone to landslides within the study region. This is of great significance for landslide hazard prevention and mitigation. Experts and scholars worldwide have extensively analyzed the formation mechanisms of landslide hazards and studied their spatial distribution, thereby proposing numerous susceptibility assessment models. These models can be broadly categorized into three types: heuristic models, statistical models, and machine learning models (Zhao et al., 2017; Huang et al., 2020). Finite element analyses have also been employed to evaluate stability in underground excavations, underscoring the importance of numerical methods in hazard assessment. The research results indicate that machine learning models do not require a correlation of data and environmental factors to follow a normal distribution, and have significant advantages in processing big data. They are most widely used in regional evaluation of landslide hazards (Reichenbach et al., 2018; Zhao et al., 2022), and are particularly suitable for areas with complex geological environments (Cemiloglu et al., 2023; Mao et al., 2024). Different models and methods have been applied to evaluate landslide susceptibility in various regions (Samia et al., 2020; Kohno and Higuchi, 2023). These include generalized additive statistical models, convolutional neural networks, and support vector machines (Cao et al., 2020; Yi et al., 2020). However, a single machine learning model often struggles to be applicable in all case scenarios. Ensemble learning models, which combine multiple classifiers, can deal with complex, multidimensional data more reliably and are considered a cutting-edge topic in the field of geosciences.
Landslides are controlled by various internal and external geodynamic factors. In landslide susceptibility evaluation, the selection of evaluation factors is another critical issue. Previous studies have analyzed the landslide distribution patterns and evaluated susceptibility at different scales in different regions, systematically discussing the development and distribution characteristics of landslides (Huang and Li, 2008; Zhao et al., 2024). These studies have focused on analyzing the control effects and sensitivity of different influencing factors on landslide development and distribution (Yang et al., 2018; Fan et al., 2018; Shu et al., 2022; Gu et al., 2023). However, previous factor selections have primarily focused on external geodynamic factors such as topography, stratigraphy, and hydrology, while less attention has been given to the influence of deep geodynamic factors.
In susceptibility evaluations, many studies focus only on static influence factors, such as elevation and lithology (Convertino et al., 2013; Dandridge et al., 2023), but often neglect information on the stage activity of the region. However, for highway landslides, which are significantly affected by engineering activities, this stage activity information is crucial. Therefore, static susceptibility evaluations can no longer adequately address the needs of landslide hazard prevention and mitigation. InSAR (Interferometric Synthetic Aperture Radar) technology, which has a short data cycle and is not affected by weather, can timely reflect the surface deformation of landslides. Incorporating deformation data into landslide susceptibility evaluation can update regional deformation information in a timely manner and help identify potential landslides that are undergoing deformation (Piacentini et al., 2015; Ciampalini et al., 2016; Calvello et al., 2017; Zhou et al., 2022).
In recent years, studies have attempted to integrate InSAR technology with ensemble learning models for landslide susceptibility assessment (Zeng et al., 2023; Shan et al., 2024). These efforts provide effective tools for regional-scale landslide risk identification. However, in terms of research subjects and application scenarios, most of these studies focus on regional or watershed scales, resulting in relatively broad assessment extents. The evaluation factors also predominantly concentrate on surface-level influences such as topography and land cover, while insufficient consideration is given to the controlling effects of deep-seated tectonic activities. For linear transportation infrastructure such as the Lexi Highway, engineering activities during construction, particularly cutting and filling, significantly alter the stress state of slopes along the route. Consequently, the distribution of landslides differs markedly from regional susceptibility patterns under natural conditions. Moreover, the Lexi Highway is located in the transition zone of the western Sichuan Plateau, where active geological structures and deep-seated tectonic processes, such as fault activity and crustal deformation, play a non-negligible role in landslide development. To address the limitations of existing research, this study employs a Stacking ensemble learning fusion model. This model integrates a landslide inventory from the study area with various internal and external geodynamic evaluation factors to assess the landslide susceptibility along the Lexi highway. Subsequently, a landslide comprehensive susceptibility evaluation matrix is utilized to integrate the susceptibility evaluation results with SBAS-InSAR deformation data (from both ascending and descending orbits). This process generates a comprehensive landslide susceptibility map, thereby enhancing the accuracy of the susceptibility assessment along the Lexi highway. Emerging AI-based predictive diagnostic approaches from other civil infrastructure domains, such as corrosion assessment in reinforced concrete (Ahmad et al., 2025a), could inspire further advancements in data-driven landslide susceptibility modeling.
2 Study area
The western Sichuan Plateau gradient zone is a trapezoidal transition area that extends from the hilly regions on the western side of the Sichuan Basin to the Longmenshan Mountain in northwestern Sichuan and the eastern edges of the Tibetan Plateau. This region features deeply incised valleys, complex lithology, and multiple tectonic units, presenting a highly unique geological environment (Yang et al., 2016; Zhang et al., 2016). The Lexi highway is situated at the southeastern edge of the gradient zone, as illustrated in Figure 1. The highway spans a total length of 151 km, and the ecological environment along its route is sensitive, featuring complex geological structures and harsh local climatic conditions. The study area has a well-developed river system and abundant rainfall, with an average annual precipitation exceeding 1,200 mm. The primary landforms include tectonic denudation, erosion-deposition, and tectonic erosion landforms. Major faults in the area include the Ebian-Jinyang Fault, Mabian-Yanjin Fault, and Daliangshan Fault. The study area primarily comprises the Quaternary, Jurassic, Triassic, Permian, Silurian, and Ordovician strata. Among these, the Ordovician strata consist of early-stage sandstone and shale and mid-to-late-stage carbonate rocks interbedded with sandstone and shale. The Silurian strata are composed of sandstone and shale intercalated with limestone. The Permian strata range from early-stage thick-bedded limestone to late-stage Emeishan Basalt. The Triassic strata transition from early-stage sandstone and shale to mid-stage sandstone and shale interbedded with limestone, and finally to late-stage coal-bearing sandstone and shale. The Jurassic strata are dominated by mudstone, including silty mudstone and alternating sandstone and mudstone deposits. The Quaternary deposits include residual-slope deposits, alluvial-pluvial deposits, debris flow accumulations, landslide deposits, and colluvial deposits. The slopes in the region predominantly consist of layered structures composed of sedimentary sandstone, shale, limestone, basalt, mudstone, and alternating layers of sandstone and mudstone.
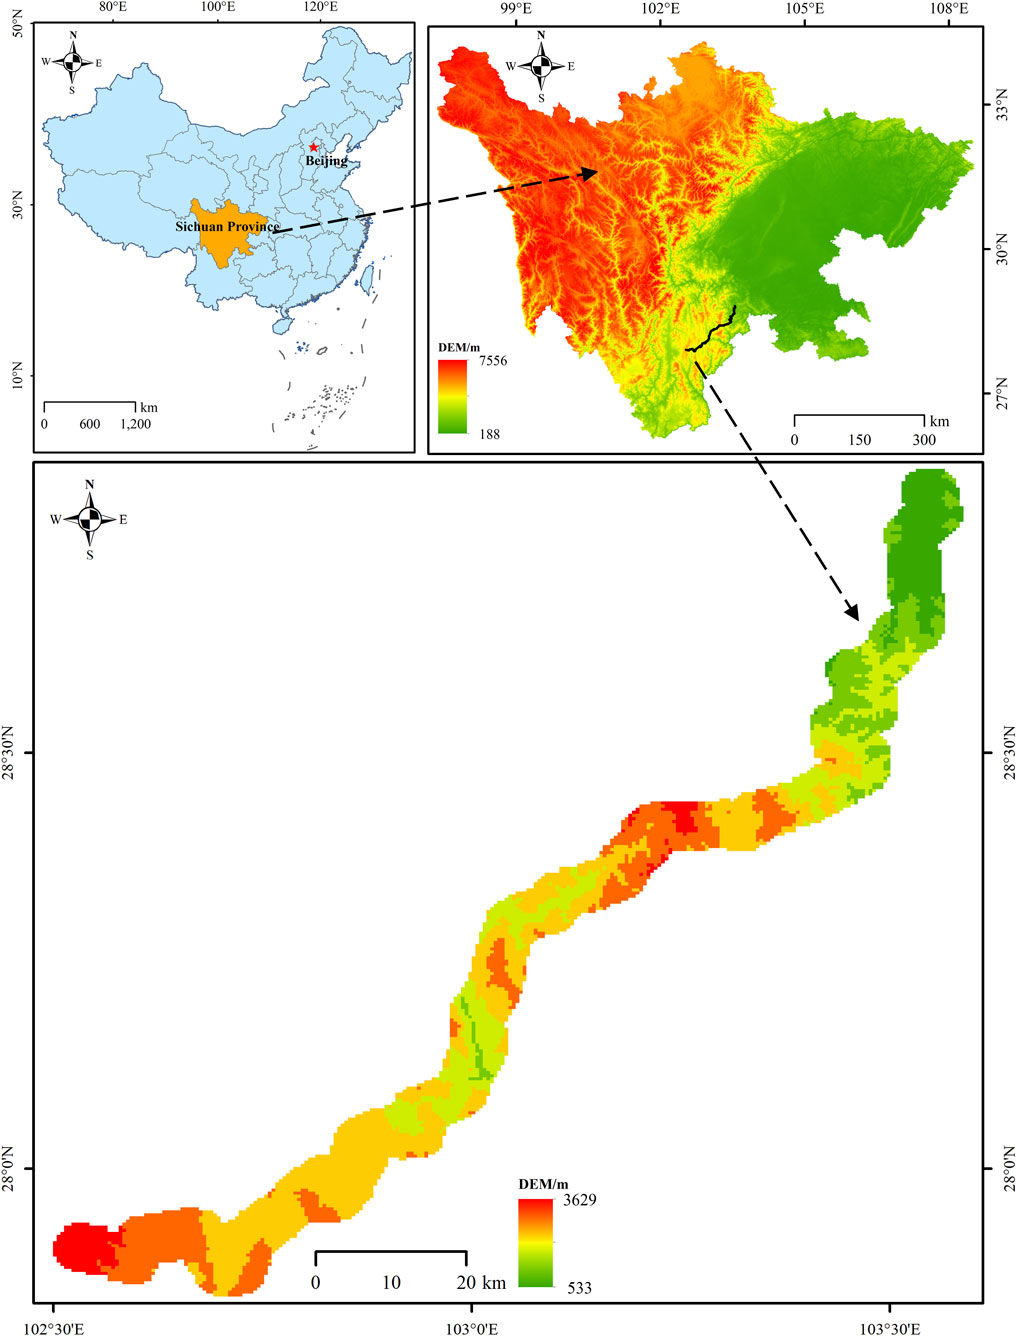
Figure 1. Geographic location of Lexi Highway.
3 Data sources and research methods
3.1 Data sources
3.1.1 Landslide sites and susceptibility evaluation factors
A total of 135 landslide hazard sites within a 3 km range along the Lexi highway were collected. Four external geodynamic factors were selected as evaluation criteria: elevation, NDVI (Normalized Differential Vegetation Index, NDVI), rainfall and human activity intensity. Additionally, four internal geodynamic factors were considered: engineering geological rock group, distance to the fault zones, Bouguer gravity anomaly gradient and vertical deformation gradient.
Specifically, elevation influences slope stability through gravitational effects; rainfall is a primary trigger for slope failure; NDVI serves as a proxy for vegetation cover, which stabilizes slopes; and human activity intensity reflects anthropogenic disturbances such as construction (Fiorucci et al., 2019). Regarding the internal factors, the engineering geological rock group classifies rock and soil mass by strength; distance to the fault zones indicates proximity to geological discontinuities; the Bouguer gravity anomaly gradient reflects variations in crustal density; and the vertical deformation gradient quantifies the rate of surface displacement (Hayes et al., 2008).
The required data sources include several key elements: 30m precision DEM (Digital Elevation Model, DEM) from the SRTM (Shuttle Radar Topography Mission, SRTM) satellite of NASA (National Aeronautics and Space Administration, NASA) (https://www.earthdata.nasa.gov/), 30 m precision Google Maps (https://earth.google.com), annual rainfall data from the National Climate Center (https://www.ncc-cma.net/), 30 m precision NDVI data for 2022 from Google Earth Engine (https://earthengine.google.com/) and information on regional engineering geology rock group, land use type and location of the fault zone from the China Geological Survey (https://www.cgs.gov.cn/). Additionally, relevant studies will be referenced for Bouguer gravity anomaly gradient and vertical deformation gradient data (Yao et al., 2015; Huang et al., 2018).
3.1.2 InSAR data
Sentinel-1 satellite is an Earth observation satellite under the Copernicus program of the European Space Agency (ESA), carrying C-band synthetic aperture radar and providing continuous SAR images.
Short-term surface deformation can be influenced by factors like differential vegetation growth and atmospheric delays. Therefore, this study used Sentinel-1A data from January 2019 to December 2023, which provides a long time series from both ascending and descending orbits. A total of 132 scenes from descending orbit Track 62 were obtained. As the study area was not fully covered by a single ascending track, we also collected 94 scenes from ascending orbit Track 26 and 134 scenes from ascending orbit Track 128 during the same period. To improve processing efficiency, the acquired SAR images were cropped to focus on the target monitoring area. Subsequently, standard preprocessing steps including co-registration, differential interferometry, and filtering were applied. The basic Sentinel-1A data used in this study are summarized in Table 1.
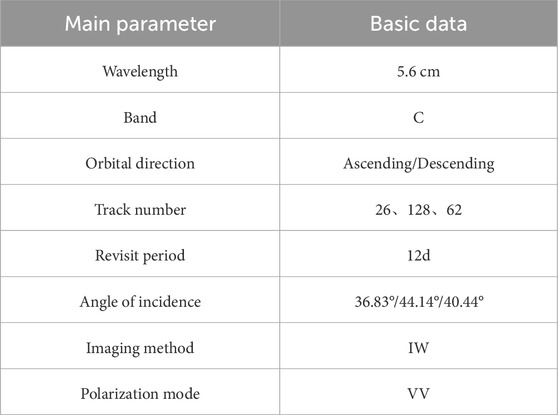
Table 1. Basic parameters of Sentinel-1A satellite data.
3.2 Research methods
This study first employs numerical statistical methods to analyze the distribution patterns of landslide hazards along the Lexi highway. Subsequently, landslide susceptibility is evaluated based on an inventory of landslide points and multiple internal and external geodynamic factors within the study area. The susceptibility evaluation was performed using a Stacking ensemble learning fusion model. Finally, a comprehensive landslide susceptibility evaluation matrix is utilized to integrate the susceptibility evaluation results with surface deformation information derived from ascending and descending SBAS-InSAR data, producing a comprehensive landslide susceptibility map. The technical workflow of this study is shown in Figure 2.
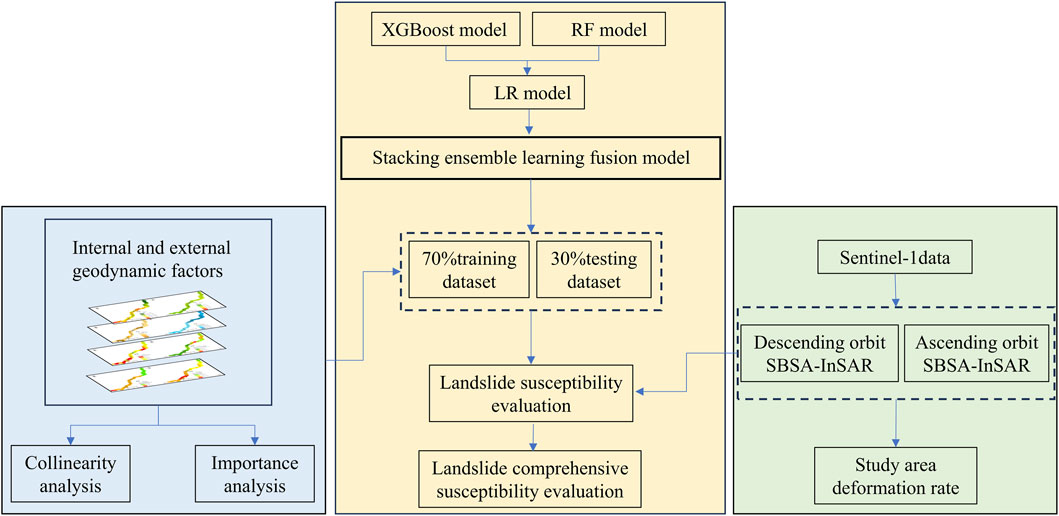
Figure 2. Technical workflow of the study.
3.2.1 Random forest (RF)
The core concept of the Bagging ensemble learning method is to generate multiple new datasets of equal size from the original dataset using repeated random sampling with replacement. These new datasets are then used to train several weak learners. The predictions from these weak learners are then combined through methods such as voting or averaging to determine the final classification result. A representative algorithm of this method is the RF model (Goetz et al., 2015; Breiman, 2001). The RF algorithm operates on the principle of bootstrap sampling, drawing K samples with replacement from the original training set. A decision tree model is built for each of the K samples, yielding K sets of classification results. The final output of the RF is determined by averaging the results from all decision trees. The tree structure of the RF allows it to be used to approximate solutions to discrete optimization problems, often with improved accuracy. The relevant formula is as follows:
In the formula:
3.2.2 Extreme gradient boosting (XGBoost)
Boosting is an ensemble learning method that transforms weak learners into strong learners (Freund and Schapire, 1997). It works by iteratively adjusting the weights of misclassified samples in the base classifier. In each iteration, a new weak classifier is trained to minimize the loss function, and the final decision is obtained by a weighted combination of all base classifiers. A representative algorithm of this method is the XGBoost model, whose uniqueness lies in an objective function that incorporates both a loss function and a regularization term (Chen and Guestrin, 2016). The loss function measures the model’s goodness of fit. Unlike methods that rely only on first-order derivatives, XGBoost also uses second-order derivatives to capture the trend of gradient changes, thereby accelerating convergence and improving precision. The regularization term controls model complexity by penalizing the number of leaf nodes-a greater number results in a stronger penalty. This mechanism effectively prevents overfitting and degradation in classification performance. The optimal objective function is defined as:
In the formula: λ denotes the fixed coefficient; γ represents the complexity parameter; T indicates the number of leaf nodes in the tree; Gⱼ is the sum of first-order partial derivatives of the samples contained in leaf node j; Hⱼ is the sum of second-order partial derivatives of the samples contained in leaf node j.
3.2.3 Stacking ensemble learning fusion model
The Stacking algorithm is an ensemble learning method (Wolpert, 1992). It works by first training multiple base learners on the initial training dataset. The predictions from these base learners are then used as new input features to form a new dataset. This new dataset is used to train a meta-learner in the second layer, which produces the final prediction result.
In ensemble learning, the base models in a bagging algorithm are correlated to some degree, and an averaging strategy is used to reduce variance. In contrast, the boosting algorithm improves prediction accuracy by reducing bias but is less effective at reducing variance. In Stacking ensemble learning, the stronger the learning ability and the lower the correlation among the base learners, the better the prediction performance of the fused model. The integration of data-driven models with physically based numerical approaches, such as lattice element modeling (Rizvi et al., 2020) can further improve prediction reliability in heterogeneous geological settings. In this study, the RF algorithm from the bagging ensemble learning family and the XGBoost algorithm from the boosting ensemble learning family are selected as the base learners for the Stacking model. For the second-layer meta-learner, the Logistic Regression (LR) algorithm is chosen due to its simple structure and strong generalization ability, which helps prevent overfitting. This approach combines the advantages of different ensemble models to achieve more robust and reliable results than a single model, enabling more reliable handling of data across various scenarios.
To minimize redundancy and promote complementary learning between the base learners. The RF model was configured to enhance stability and diversity by optimizing parameters such as n_estimators and max_features, which strengthens its ability to model global feature interactions. In contrast, the XGBoost model was tuned with a focus on its sequential learning capability through parameters like learning_rate, max_depth, and reg_lambda, refining its skill in detecting complex local patterns. Using a 5-fold cross-validated grid search, this differentiated strategy effectively leverages the inherent differences between the bagging and boosting paradigms, ensuring their predictions provide diverse and complementary inputs to the meta-learner.
3.2.4 SBAS-InSAR
SBAS-InSAR (Small Baseline Subset InSAR) is a technology developed from Differential InSAR and Permanent Scatterer InSAR techniques. It was first proposed by Berardino et al. to extract large-scale, low-rate surface deformation information (Berardino et al., 2002). The technique involves freely combining the acquired SAR images based on the principle of maintaining relatively short spatial baselines for interferometric pairs within a subset and longer baselines between different subsets. This process creates several small baseline subsets and establishes a connection map for the interferometric pairs. Additionally, it employs a spatial baseline threshold to select small baseline interferometric pairs, thereby reducing the impact of spatial decorrelation. In surface inversion, Singular Value Decomposition (SVD) is utilized to merge the multiple small baseline subsets. This approach enables the calculation of least-squares solutions for deformation parameters and elevation errors with minimum norm constraints. Finally, nonlinear deformation and atmospheric phases are estimated. This method not only addresses the issue of temporal discontinuity caused by long spatial baselines but also increases the temporal sampling rate. The combination of a high temporal sampling rate and stabilized interferometric phases improves the spatial resolution of the monitoring results.
3.2.5 landslide comprehensive susceptibility evaluation method
The deformation rate, which quantifies the velocity of landslide movement, is a key indicator of its future evolution. Generally, a higher deformation rate corresponds to a greater susceptibility level. A comprehensive susceptibility evaluation matrix (Table 2) was employed to integrate the model-predicted static susceptibility results with regional deformation rates derived from SBAS-InSAR analysis, enabling a more dynamic assessment (Ciampalini et al., 2016). In areas lacking InSAR monitoring data, the original susceptibility values were retained.
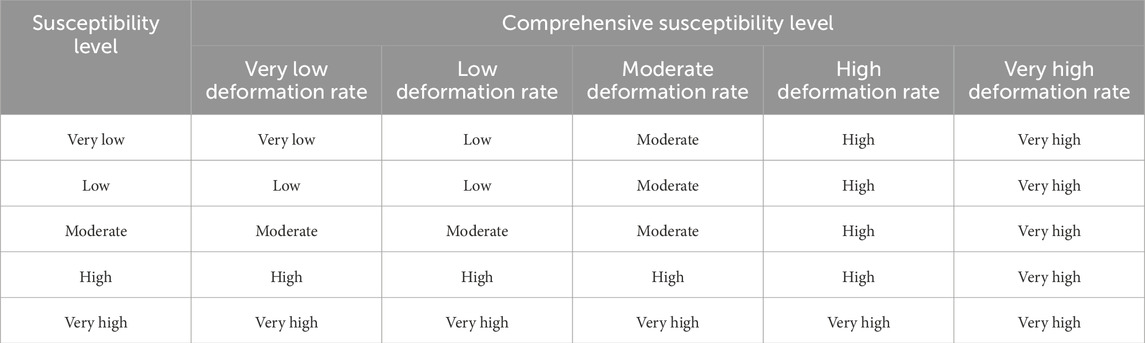
Table 2. Landslide comprehensive susceptibility evaluation matrix.
4 Results and analysis
4.1 Overall spatial distribution law of the highway landslides
The Lexi Highway spans 151 km in length, with a total of 135 landslide sites identified within a 3 km buffer zone on either side of the route. In terms of areal distribution, the landslide density along the highway reaches 15 landslides per 100 km2. When measured by the number of landslides per unit length of the highway, the linear density is 0.89 landslides per kilometer. Both indicators demonstrate that landslides are very densely distributed along the Lexi Highway.
4.2 Distribution law of the highway landslides under the influence of internal and external geodynamic factors
4.2.1 Elevation
Based on elevation values, the study area is classified into six levels: 191–1,000 m, 1,000–1,500 m, 1,500–2000 m, 2000–2,500 m, 2,500–3,000 m, and >3,000 m. The resulting zoning is shown in Figure 3a. It can be observed that the elevation of the study area is predominantly between 1,000 and 3,000 m, with landslides mainly distributed in areas with elevations ranging from 1,500 to 2,500 m.
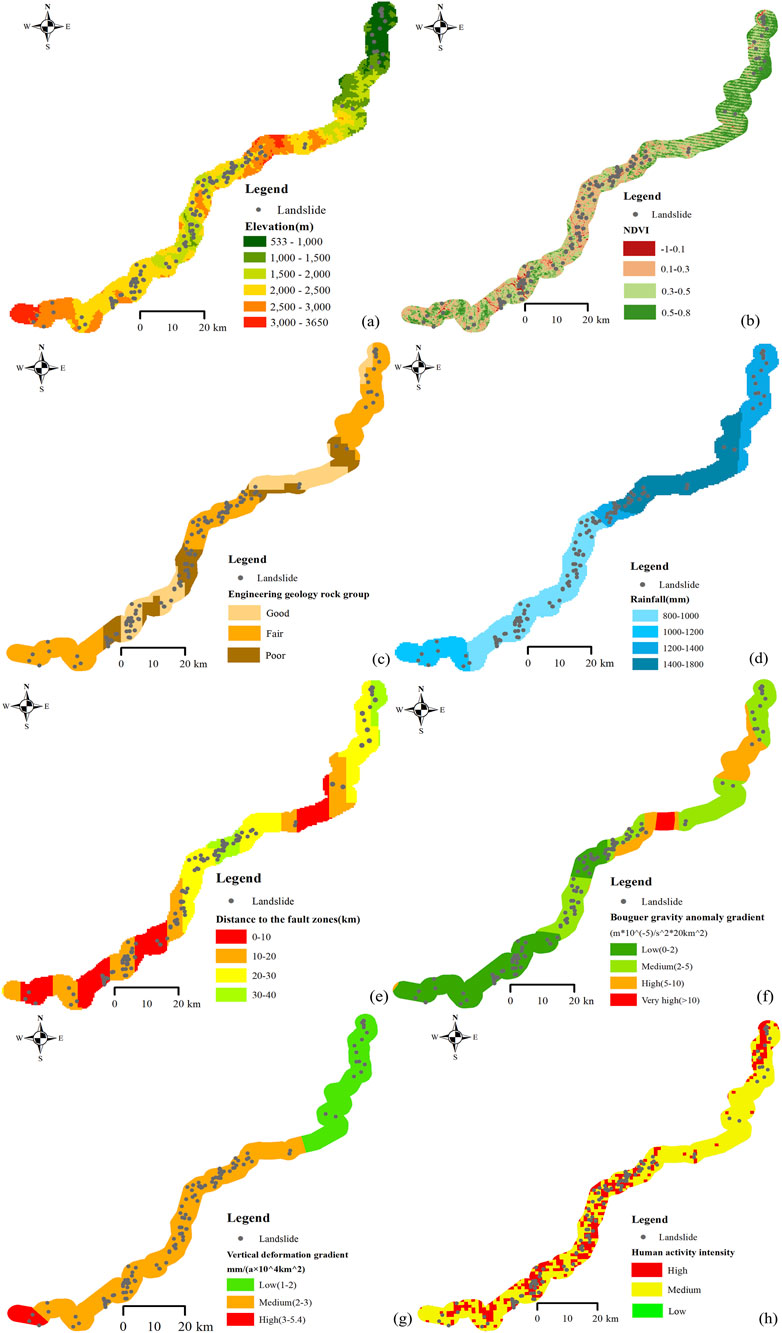
Figure 3. Distribution law of landslides in the study area under different influencing factors (a) elevation; (b) NDVI; (c) engineering geology rock group; (d) rainfall; (e) distance to the fault zones; (f) Bouguer gravity anomaly gradient; (g) vertical deformation gradient; (h) human activity intensity.
4.2.2 NDVI
Based on NDVI values, the study area is classified into four levels: −1–0.1, 0.1–0.3, 0.3–0.5, and 0.5–0.8. The resulting zoning map is shown in Figure 3b. It can be observed that the NDVI values in the central region of the Lexi highway are relatively low (approximately -1–0.3), while those in the northeast region are relatively high (approximately 0.3–0.8). Landslides are mainly distributed in areas with relatively low NDVI values.
4.2.3 Engineering geology rock group
Based on rock genesis, integrity, and hardness, the engineering geological rock groups are classified into three levels: good, fair, and poor (Yao et al., 2015). The resulting classification is shown in Figure 3c. It can be observed that the majority of the study area comprises fair engineering geological rock groups, followed by good rock groups. Poor rock groups are sparsely distributed within the region, mainly in the middle and rear sections of the highway. These sections, characterized by relatively poorer engineering geological rock groups, are the primary zones for landslide distribution.
4.2.4 Rainfall
Rainfall is a main factor inducing landslides, as evidenced by cases such as the Darenyan landslide on the Yakang highway (Song and Tan, 2021; Liu et al., 2023). Based on the average annual rainfall, the study area is classified into four levels: 800–1,000 mm, 1,000–1,200 mm, 1,200–1,400 mm, and 1,400–1800 mm. The resulting zoning is shown in Figure 3d. It can be observed that areas with average annual rainfall of 800–1,000 mm, 1,200–1,400 mm, and 1,400–1800 mm account for the largest proportion of the study area, and landslides are mainly distributed within these zones.
4.2.5 Distance to the fault zones
Fault zones are geological structures that are particularly susceptible to triggering geohazards. They can lead to the discontinuity of rock and soil on slopes, thereby weakening the structural integrity of slopes and creating favorable conditions for the sliding of rock and soil masses (Qi et al., 2021). Based on the distance to the fault zones, the study area is classified into four levels: 0–10 km, 10–20 km, 20–30 km, and 30–40 km. The resulting zoning is shown in Figure 3e. The study area is predominantly within 0–30 km of a fault zone, and landslides are mainly distributed in the 0–10 km and 10–20 km zones.
4.2.6 Bouguer gravity anomaly gradient
Deep tectonics significantly influence the stability of the Earth’s crust, and variations in the deep geophysical field serve as key indicators of underlying tectonic activity. The Bouguer gravity anomaly was selected as an indicator of regional crustal stability. Its gradient was calculated by measuring the change in the anomaly value per unit area of 20 km2 (Fu et al., 2014). The gradient values are classified into four levels: low (0–2), medium (2–5), high (5–10), and very high (>10). The resulting zoning is shown in Figure 3f. It can be observed that the low and medium gradient levels account for the largest proportion of the study area, and landslides are also mainly concentrated within these two zones.
4.2.7 Vertical deformation gradient
Regional crustal deformation includes both horizontal and vertical components (Hu, 2001). Regions with a large vertical deformation gradient are often unstable or seismic zones, while regions with a large horizontal deformation gradient are often zones of tectonic stress concentration. The vertical deformation gradient is defined as the average annual vertical deformation per 1 × 10⁴ km2. Based on the magnitude of the gradient, the area is classified into three levels: low (0–1), medium (1–2), and high (2–3). The resulting zoning is shown in Figure 3g. The low and medium gradient levels account for the largest proportion of the study area, and landslides are mainly concentrated within these two zones.
4.2.8 Human activity intensity
Land use is influenced by human activities, which in turn affect slope stability. Similar patterns of disturbance-induced response have been observed in thermally loaded soils under cyclic and static conditions (Ahmad et al., 2021). Building upon previous research, land use types are categorized by human activity intensity as follows: farmland and impervious surfaces as high-intensity zones; woodland, grassland, and shrubland as medium-intensity zones; and wetland, water bodies, bare ground, and glaciers/permanent snow cover as low-intensity zones (Xu et al., 2016). The resulting zoning is shown in Figure 3h. The study area is dominated by medium-intensity areas. In contrast, the middle and rear sections exhibit significantly higher human activity intensity, reaching the high level, while low-intensity areas are sparsely distributed. Most importantly, landslides are predominantly located within zones of high human activity intensity.
4.3 Analysis of collinearity and importance of evaluation factors
The variance inflation factor (VIF) quantifies the degree of multicollinearity between independent variables (Zeng et al., 2023). SPSS software was used to analyze the collinearity of the eight evaluation factors mentioned above; the results are shown in Figure 4a. The factors are as follows: X1 (elevation), X2 (NDVI), X3 (engineering geological rock group), X4 (rainfall), X5 (distance to the fault zones), X6 (Bouguer gravity anomaly gradient), X7 (vertical deformation gradient), and X8 (human activity intensity). Using a threshold VIF value of five to diagnose collinearity, a VIF ≥5 indicates significant multicollinearity between factors (Cemiloglu et al., 2023). Among all the factors, elevation has the highest VIF value of 4.595, while most other factors have VIF values ranging from 1–3. This indicates that there is no significant multicollinearity among the evaluation factors. Consequently, all eight factors were selected for the susceptibility evaluation.
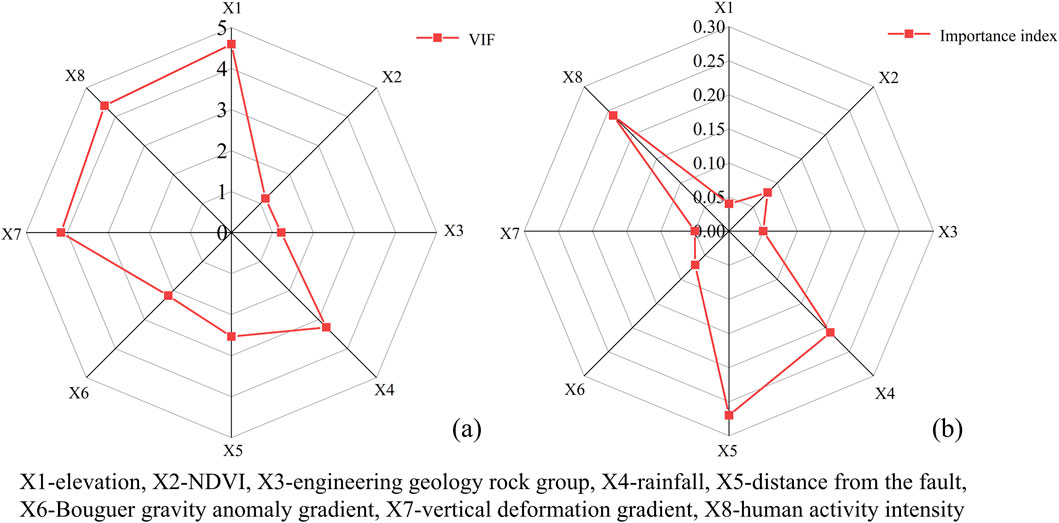
Figure 4. Collinearity analysis of different evaluation factors (a) and the importance of their influence on landslides distribution (b).
To determine the contribution of each evaluation factor to landslide occurrence in the study area, the geographical detector model was employed to analyze the importance of the eight evaluation factors mentioned above. The resulting importance distribution is shown in Figure 4b.
The analysis reveals that among all the evaluation factors, the most significant influences on the distribution of landslides along the Lexi highway are distance to the fault zones, human activity intensity, and rainfall, with importance indices of 0.27, 0.24, and 0.21, respectively. In contrast, the impacts of the Bouguer gravity anomaly gradient, NDVI, and engineering geology rock groups are comparatively secondary.
4.4 Evaluation of highway landslide susceptibility
4.4.1 Sample datasets
Based on an inventory of 135 landslide sites within a 3 km buffer zone along the Lexi Highway, this study employed a methodology that integrated stable area screening with spatial random sampling to select an equivalent number of non-landslide samples. This process was designed to ensure the stability and representativeness of the non-landslide data. The stable area screening was conducted by synthesizing multiple landslide susceptibility factors and SBAS-InSAR deformation rate results. Samples were restricted to areas demonstrating geological stability and minimal dynamic deformation, specifically prioritizing zones with deformation rates of 0 mm/a ≤ |V| < 12 mm/a, good to excellent engineering geological rock mass quality, and a distance greater than 10 km from fault zones. Regions of high human activity intensity were excluded to avoid potential instability. Following the delineation of stable areas, stratified random sampling was performed using ArcGIS 10.8 to generate 135 non-landslide samples. This approach ensured a uniform spatial distribution of these samples across the study area, consistent with the spatial pattern of the landslide inventory. The resulting balanced dataset, comprising an equal number of landslide and non-landslide samples, effectively mitigated class bias during model training, thereby enhancing the reliability of the susceptibility assessment results. This dataset was divided, with 70% allocated for training the machine learning model and 30% reserved for testing.
4.4.2 Results and validation of models
The Stacking ensemble learning fusion model was applied to evaluate landslide susceptibility along the Lexi highway, and its performance was compared with that of the information value model, the RF model, and the XGBoost model. According to the equal interval classification method, the susceptibility index was classified into five levels from lowest to highest: very low (0–0.2), low (0.2–0.4), moderate (0.4–0.6), high (0.6–0.8), and very high (0.8–1.0) (Sahana and Sajjad, 2017; Wang et al., 2017). The evaluation results are shown in Figure 5.
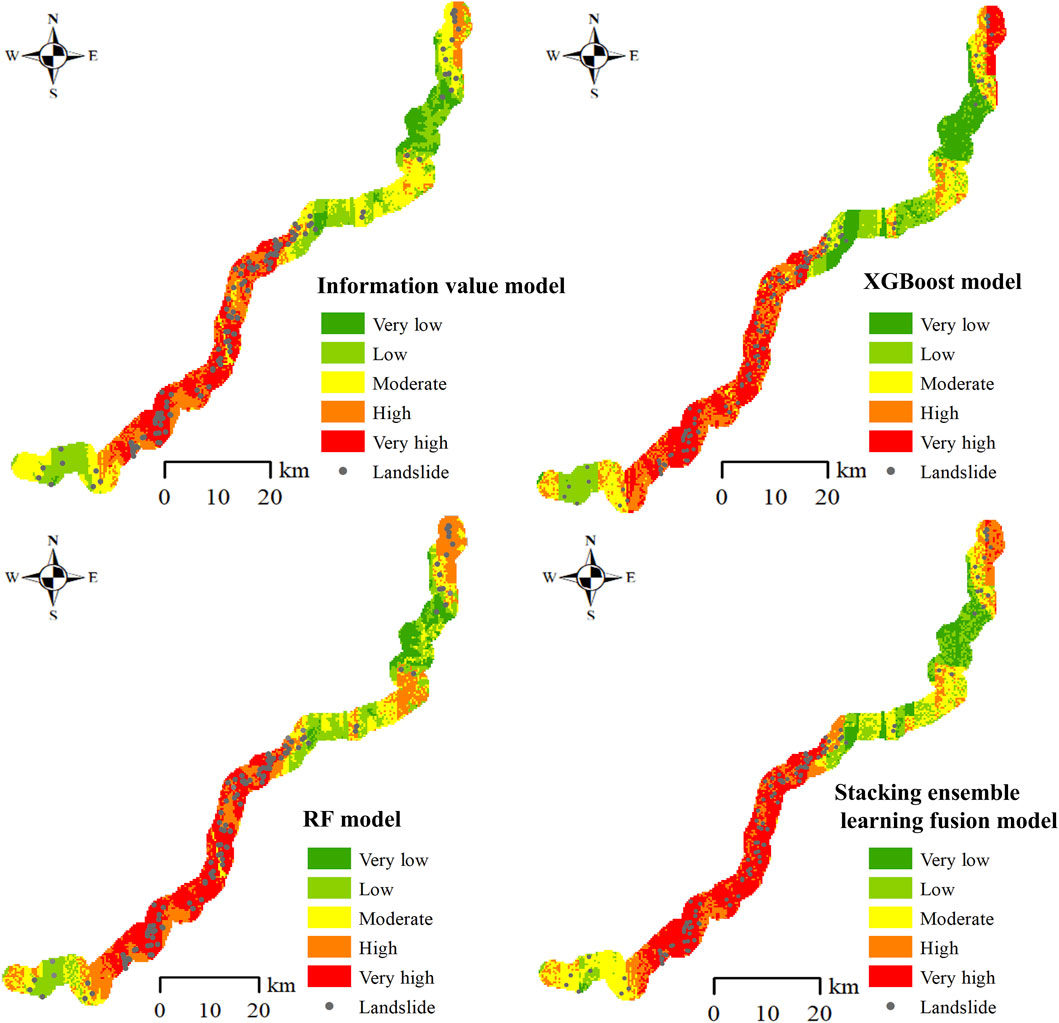
Figure 5. Evaluation results of landslide susceptibility on the Lexi highway.
To evaluate the predictive accuracy of each model, the receiver operating characteristic (ROC) curves were used for validation (Reichenbach et al., 2018; Hosmer and Lemeshow, 2000). The logic behind the ROC curve is that a test with no diagnostic ability has an equal probability of producing a true positive or a false positive. The curve graphically represents the relationship between the true positive rate (sensitivity) and the false positive rate (1-specificity) (Yesilnacar and Topal, 2005; Anis et al., 2019). The area under the curve (AUC) represents the accuracy of the evaluation model. A value closer to 1 indicates better prediction performance, while a value of 0.5 indicates no predictive value. The ROC curves and AUC values of the four models are shown in Figure 6. The RF model achieved an AUC of 0.885, the Information value model had an AUC of 0.835, the XGBoost model reached an AUC of 0.959, and the Stacking ensemble learning fusion model recorded an AUC of 0.977. All four models demonstrate strong prediction accuracy.
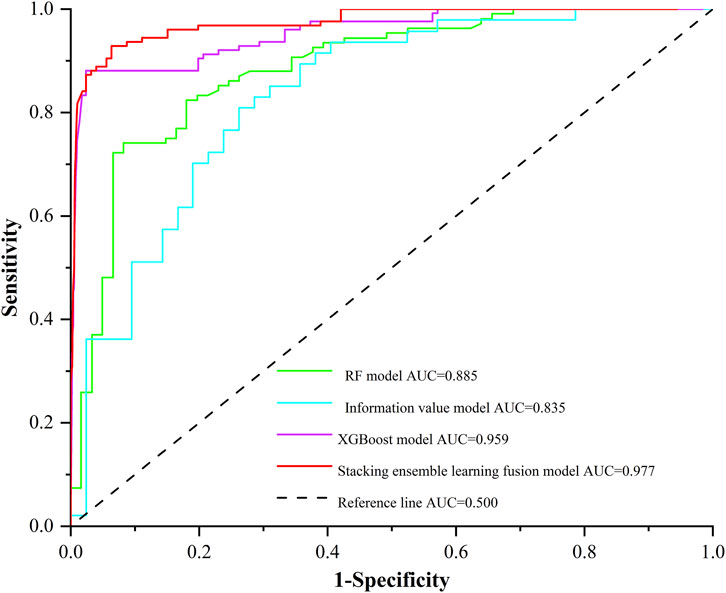
Figure 6. ROC curves and AUC values of 4 landslide susceptibility evaluation models.
In the landslide susceptibility evaluation along the Lexi highway, the Stacking ensemble learning fusion model achieved an AUC of 0.977, which is higher than that of the other models. This indicates that the Stacking model is superior to the other three models for landslide susceptibility evaluation of the Lexi highway, as it incorporates multiple internal and external geodynamic factors. Compared to basic classifiers and commonly used susceptibility evaluation algorithms, the Stacking ensemble learning fusion model demonstrates significant improvement in prediction accuracy, thereby enhancing the overall reliability and precision of the evaluation.
4.5 Landslide comprehensive susceptibility evaluation integrating SBAS-InSAR
4.5.1 Ascending and descending orbits SBAS-InSAR deformation analysis
The SBAS-InSAR technology can be used to obtain the surface deformation rate and analyze the historical deformation characteristics of landslides. Based on previous studies and the actual deformation observed in the study area, the surface deformation rate (V) was classified into five levels: very low (0 mm/a≤|V|<5 mm/a), low (5 mm/a≤|V|<12 mm/a), moderate (12 mm/a≤|V|<18 mm/a), high (18 mm/a≤|V|<24 mm/a), and very high (|V|≥24mm/a) (Zeng et al., 2023; Shan et al., 2024).
The study area’s deformation velocity derived from ascending and descending orbits SBAS-InSAR measurements was categorized into five levels, as presented in Figures 7, 8. The results indicate that the majority of the Lexi highway falls within the very low and low deformation velocity levels. Areas exhibiting high and very high deformation velocities are predominantly concentrated within the highway’s middle sections.
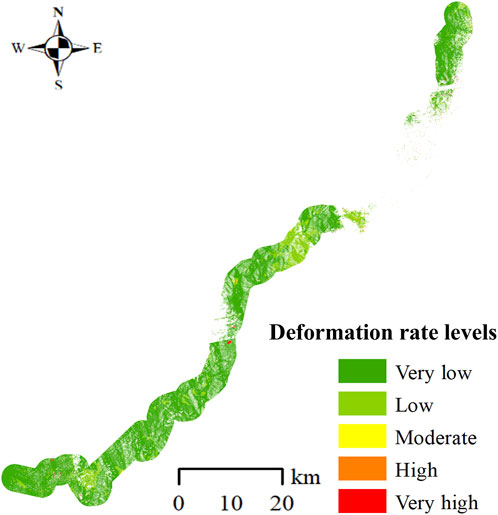
Figure 7. Deformation classification results from ascending orbit SBAS-InSAR in the study area.
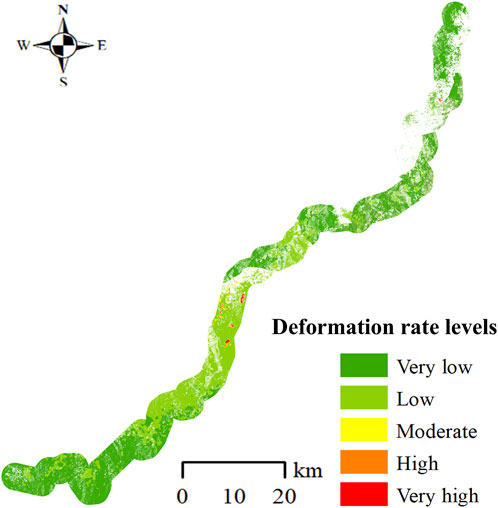
Figure 8. Deformation classification results from descending orbit SBAS-InSAR in the study area.
4.5.2 Landslide comprehensive susceptibility evaluation
Convert the ascending and descending orbits SBAS-InSAR deformation rate maps of the study area into 30 m × 30 m grid units. Then, integrate these maps with the landslide susceptibility evaluation results for the Lexi highway, which were calculated using the Stacking ensemble learning fusion model, based on the landslide comprehensive susceptibility evaluation matrix presented in Table 2. Finally, a landslide comprehensive susceptibility evaluation map combining ascending and descending orbits SBAS-InSAR data is obtained, as shown in Figure 9.
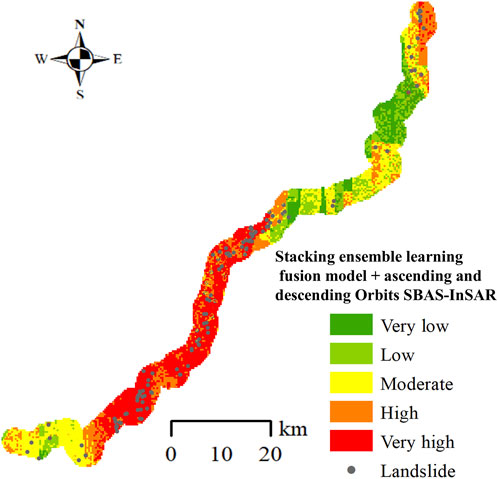
Figure 9. Landslide comprehensive susceptibility map for Stacking ensemble learning fusion model combined with ascending and descending orbits SBAS-InSAR.
5 Discussion
5.1 Factors influencing the law of landslide distribution
It is widely recognized that landslide development is controlled by multiple interacting factors (Peng et al., 2023). The dense distribution of landslides along the Lexi highway results from the combined effects of internal geological processes, surface external forcings, and human activities. Key factors influencing the spatial distribution of landslides along the highway mainly include distance to the fault zones, human activity intensity, and rainfall. Among them, intense tectonic activity leads to rock mass fragmentation and stress concentration, forming the macro-geological background for landslide development. Engineering activities during highway construction (such as excavation and loading) directly alter the stress state of slopes and exacerbate shallow unloading, serving as important triggering factors for landslide occurrence. Furthermore, abundant rainfall acts as a direct trigger; its infiltration softens the soil and rock in the slip zone and increases pore water pressure, significantly elevating the risk of slope instability.
5.2 Differences in landslide susceptibility results
Based on ROC curve validation and landslide susceptibility mapping results, this study demonstrates that the Stacking ensemble learning fusion model, which combines RF and XGBoost as base learners, significantly improves the accuracy and robustness of landslide susceptibility prediction. Compared to single models, the Stacking ensemble approach more effectively handles the complex geographical and geological data along the Lexi Highway, highlighting its distinct advantage in integrating multi-source influencing factors. However, the model also exhibits high computational complexity and relies heavily on extensive training data and computational resources, which may limit its practical application in areas with scarce data or limited computing power. Therefore, model selection requires a trade-off between accuracy and efficiency, with decisions tailored to the specific characteristics of the area and evaluation objectives. For instance, in engineering applications with complex geological conditions and high precision requirements, such as the Lexi highway project, the performance improvement offered by the Stacking ensemble learning fusion model holds significant value. In contrast, for regional-scale rapid preliminary assessments, models like SVM and logistic regression may offer greater efficiency advantages (Nanehkaran et al., 2021; Cemiloglu et al., 2023).
Statistical analyses were conducted on the area proportions for each risk level in both the landslide comprehensive susceptibility evaluation and the landslide susceptibility evaluation predicted by the Stacking ensemble learning fusion model. The results are shown in Figure 10. The landslide susceptibility evaluation map predicted by the Stacking ensemble learning fusion model shows the following area proportions: very low susceptibility at 10.2%, low susceptibility at 14.1%, moderate susceptibility at 23.4%, high susceptibility at 20.2%, and very high susceptibility at 32.1%. After incorporating ascending and descending orbits SBAS-InSAR deformation data, the area proportions of very low and low susceptibility in the landslide comprehensive susceptibility evaluation map decreased by 1.6%. The overall proportions of moderate, high, and very high susceptibility increased. The most significant rise was observed in the very high susceptibility level, which increased by 1.1%. The main reason is that for the entire study area, InSAR detected deformation points in landslide zones that mostly exhibited moderate to high deformation rates. This increased the susceptibility level in some regions while reducing the area proportions of very low and low susceptibility zones.
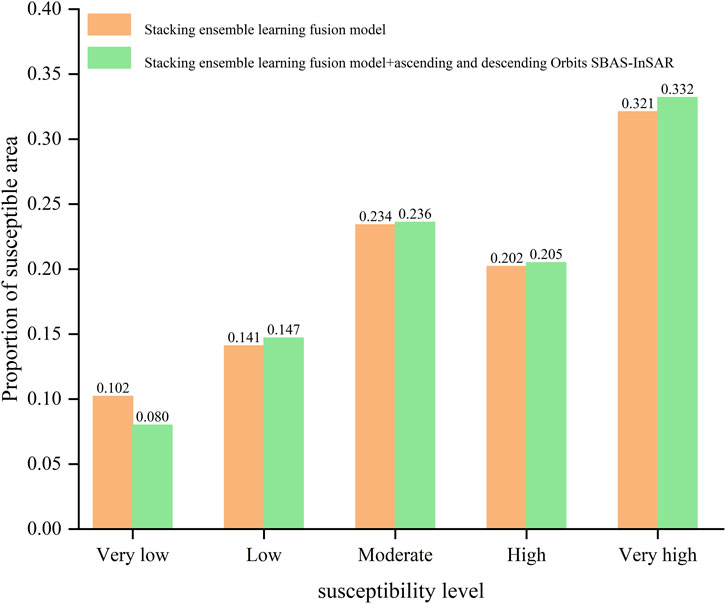
Figure 10. Changes in the proportion of different susceptibility levels in the study area before and after overlaying SBAS InSAR data.
5.3 Applicability of landslide comprehensive susceptibility evaluation
The applicability of the comprehensive landslide susceptibility map was analyzed using specific typical landslides as examples. Figure 11 shows four landslide sites identified through field surveys, all of which are located in the high and very high susceptibility zones on the comprehensive susceptibility map. The study area is influenced by human engineering activities, such as loading and excavation. Analogous to underground power infrastructure studies where localized heat transfer modifies soil structure and stability (Ahmad et al., 2019; Ahmad et al., 2025b), intensive engineering activities along the Lexi highway can alter near-surface mechanical properties and influence landslide triggering thresholds. As a result, the deformation state can change easily. Furthermore, the comprehensive susceptibility map provides a practical framework for slope risk management. This framework supports a risk-based zoning strategy, in which areas classified as high and very high susceptibility, especially those also exhibiting significant SBAS-InSAR deformation rates, are prioritized for enhanced inspections and targeted instrumentation. To maintain its effectiveness under changing environmental conditions, the framework can incorporate periodic SBAS-InSAR updates following, for instance, significant seasonal rainfall to refresh deformation data and reassess susceptibility. This dynamic capability enables the establishment of threshold-based alert mechanisms, where detected acceleration of deformation in critical zones prompts immediate field verification and preventive measures. Implementing this integrated analysis within a centralized platform transforms the static map into a functional component of an adaptive highway safety system.
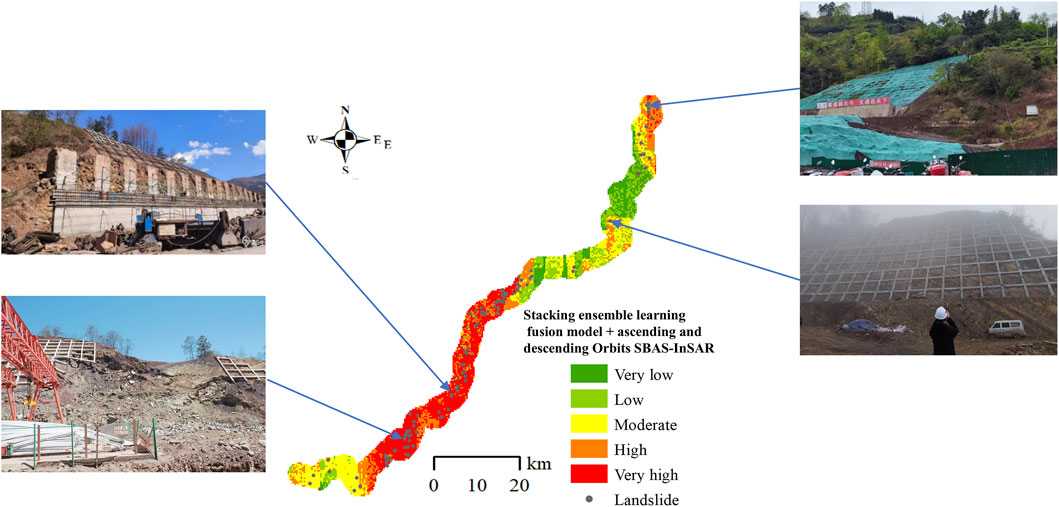
Figure 11. Typical landslide sites in high and very high susceptibility zones for landslide comprehensive susceptibility evaluation.
6 Conclusion
1. Landslide sites are densely distributed along the Lexi highway, with an areal density of 15 landslides per 100 km2 and a linear density of 0.89 landslides per kilometer.
2. The dense distribution of landslides along the Lexi Highway results from the combined effects of internal geological processes, external forcing factors, and human activities. The factors with the most significant influence on landslide distribution are distance to the fault zones, human activity intensity, and rainfall, with importance indices of 0.27, 0.24, and 0.21, respectively. In contrast, the Bouguer gravity anomaly gradient, NDVI, and engineering geology rock groups are of secondary importance.
3. The comparative analysis demonstrated the superior performance of the Stacking ensemble learning fusion model. Compared with the RF model, Information value model and XGBoost model, it achieved an AUC of 0.977 in evaluating the susceptibility of landslides along the Lexi highway, showing better predictive performance and generalization ability.
4. The integration of SBAS-InSAR deformation data successfully introduces dynamic information into the static susceptibility model. Compared to the landslide susceptibility map, the landslide comprehensive susceptibility map more effectively identifies areas with intense deformation. It shows a 1.6% decrease in the area proportions of very low and low susceptibility zones along with an approximate 1.1% increase in very high susceptibility zones.
5. The integration of SBAS-InSAR data significantly enhanced the practical value of the comprehensive landslide susceptibility assessment. Field investigations confirmed that the method improves susceptibility classification in areas experiencing intense engineering activities and high deformation rates, thereby reducing false alarms and enhancing the effectiveness of landslide prevention and mitigation measures.
Data availability statement
The original contributions presented in the study are included in the article/supplementary material, further inquiries can be directed to the corresponding author.
Author contributions
CL: Data curation, Investigation, Writing – original draft. TL: Data curation, Methodology, Writing – original draft. FL: Funding acquisition, Project administration, Writing – review and editing. YR: Data curation, Writing – original draft. YW: Data curation, Writing – review and editing. WC: Supervision, Writing – review and editing.
Funding
The authors declare that financial support was received for the research and/or publication of this article. This research is supported by the Sichuan Transportation technology project (Grant: No. 2021-ZL-15).
Conflict of interest
Authors FL, YW, and WC were employed by Sichuan Lexi Expressway Co., Ltd.
The remaining authors declare that the research was conducted in the absence of any commercial or financial relationships that could be construed as a potential conflict of interest.
Generative AI statement
The authors declare that no Generative AI was used in the creation of this manuscript.
Any alternative text (alt text) provided alongside figures in this article has been generated by Frontiers with the support of artificial intelligence and reasonable efforts have been made to ensure accuracy, including review by the authors wherever possible. If you identify any issues, please contact us.
Publisher’s note
All claims expressed in this article are solely those of the authors and do not necessarily represent those of their affiliated organizations, or those of the publisher, the editors and the reviewers. Any product that may be evaluated in this article, or claim that may be made by its manufacturer, is not guaranteed or endorsed by the publisher.
References
Ahmad, S., Rizvi, Z. H., Khan, M. A., Ahmad, J., and Wuttke, F. (2019). Experimental study of thermal performance of the backfill material around underground power cable under steady and cyclic thermal loading. Mater. Today Proc. 17, 85–95. doi:10.1016/j.matpr.2019.06.404
Ahmad, S., Rizvi, Z. H., Arp, J. C. C., Wuttke, F., Tirth, V., and Islam, S. (2021). Evolution of temperature field around underground power cable for static and cyclic heating. Energies 14 (23), 8191. doi:10.3390/en14238191
Ahmad, S., Ahmad, S., Akhtar, S., Ahmad, F., and Ansari, M. A. (2025a). Data-driven assessment of corrosion in reinforced concrete structures embedded in clay dominated soils. Sci. Rep. 15 (1), 22744. doi:10.1038/s41598-025-08526-w
Ahmad, S., Rizvi, Z. H., and Wuttke, F. (2025b). Unveiling soil thermal behavior under ultra-high voltage power cable operations. Sci. Rep. 15 (1), 7315. doi:10.1038/s41598-025-91831-1
Anis, Z., Wissem, G., Vali, V., Smida, H., and Essghaier, G. M. (2019). GIS-Based landslide susceptibility mapping using bivariate statistical methods in North-western Tunisia. Open Geosci. 11, 708–726. doi:10.1515/geo-2019-0056
Berardino, P., Fornaro, G., Lanari, R., and Sansosti, E. (2002). A new algorithm for surface deformation monitoring based on small baseline differential SAR interferograms. IEEE Trans. Geoscience Remote Sens. 40 (11), 2375–2383. doi:10.1109/TGRS.2002.803792
Calvello, M., Peduto, D., and Arena, L. (2017). Combined use of statistical and D-InSAR data analyses to define the state of activity of slow-moving landslides. Landslides 14 (2), 473–489. doi:10.1007/s10346-016-0722-6
Cao, J., Zhang, Z., Du, J., Zhang, L. L., Song, Y., and Sun, G. (2020). Multi-geohazards susceptibility mapping based on machine learning-a case study in Jiuzhaigou, China. Nat. Hazards 102 (3), 851–871. doi:10.1007/s11069-020-03927-8
Cemiloglu, A., Zhu, L. C., Mohammednour, A. B., Azarafza, M., and Nanehkaran, Y. A. (2023). Landslide susceptibility assessment for Maragheh County, Iran, using the logistic regression Algorithm. Land 12 (7), 1397. doi:10.3390/land12071397
Chen, T., and Guestrin, C. (2016). “XGBoost: a scalable tree boosting system,” in Proceedings of the 22nd ACM SIGKDD international conference on knowledge discovery and data mining. New York: Association for Computing Machinery, 785–794. doi:10.1145/2939672.2939785
Ciampalini, A., Raspini, F., Lagomarsino, D., Catani, F., and Casagli, N. (2016). Landslide susceptibility map refinement using PS-InSAR data. Remote Sens. Environ. 184, 302–315. doi:10.1016/j.rse.2016.07.018
Convertino, M., Troccoli, A., and Catani, F. (2013). Detecting fingerprints of landslide drivers: a MaxEnt model. J. Geophys. Research-earth Surf. 118 (3), 1367–1386. doi:10.1002/jgrf.20099
Dandridge, C., Stanley, T. A., Kirschbaum, D. B., and Lakshmi, V. (2023). Spatial and temporal analysis of global landslide reporting using a decade of the global landslide catalog. Sustainability 15 (4), 3323. doi:10.3390/su15043323
Fan, X. M., Scaringi, G., Xu, Q., Zhan, W. W., Dai, L. X., Li, Y. S., et al. (2018). Coseismic landslides triggered by the 8th August 2017 Ms 7.0 Jiuzhaigou earthquake (Sichuan,China):factors controlling their spatial distribution and implications for the seismogenic blind fault identification. Landslides 15 (5), 967–983. doi:10.1007/s10346-018-0960-x
Fiorucci, F., Ardizzone, F., Mondini, A. C., Viero, A., and Guzzetti, F. (2019). Visual interpretation of stereoscopic NDVI satellite images to map rainfall-induced landslides. Landslides 16 (1), 165–174. doi:10.1007/s10346-018-1069-y
Freund, Y., and Schapire, R. E. (1997). A desicion-theoretic generalization of on-line learning and an application to boosting. J. Comput. Syst. Sci. 55, 23–37. doi:10.1007/3-540-59119-2_166
Fu, G. Y., Gao, S. H., Freymueller, J. T., Zhang, G. Q., Zhu, Y. Q., and Yang, G. L. (2014). Bouguer gravity anomaly and isostasy at western Sichuan Basin revealed by new gravity surveys. J. Geophys. Research-Solid Earth 119, 3925–3938. doi:10.1002/2014JB011033
Goetz, J. N., Brenning, A., Petschko, H., and Leopold, P. (2015). Evaluating machine learning and statistical prediction techniques for landslide susceptibility modeling. Comput. & Geosciences 81, 1–11. doi:10.1016/j.cageo.2015.04.007
Gong, Y. F., Yao, A. J., Li, Y. L., Li, Y. Y., and Tian, T. (2022). Classification and distribution of large-scale high-position landslides in southeastern edge of the Qinghai-Tibet Plateau, China. Environ. Earth Sci. 81, 311. doi:10.1007/s12665-022-10433-6
Gu, Z. K., Yao, X., Li, G. G., and Zhu, X. C. (2023). Driving effects of dynamic geomorphologic environments on gravitational erosion hazards: a case of the Baihetan drainage area of the Jinsha River, China. Bull. Eng. Geol. Environ. 82, 49. doi:10.1007/s10064-022-03051-w
Hayes, T. J., Tiampo, K. F., Fernández, J., and Rundle, J. B. (2008). A gravity gradient method for characterizing the post-seismic deformation field for a finite fault. Geophys. J. Int. 173 (3), 802–805. doi:10.1111/j.1365-246X.2008.03795.x
Hosmer, D. W., and Lemeshow, S. (2000). Applied logistic regression. New York: Wiley, 160–164. doi:10.1002/0471722146.ch4
Hu, H. T. (2001). The theory and method of evaluation of regional crustal stability based on concept of “safe island”. J. Geomechanics (02), 97–103.
Huang, R. Q., and Li, W. L. (2008). Research on development and distribution rules of geohazards induced by Wenchuan earthquake on 12th may,2008. Chin. J. Rock Mech. Eng. 27 (12), 2585–2592. doi:10.3321/j.issn:1000-6915.2008.12.028
Huang, F. M., Yin, K. L., Jiang, S. H., Huang, J. S., and Cao, Z. S. (2018). Landslide susceptibility assessment based on clustering analysis and support vector machine. Chin. J. Rock Mech. Eng. 37 (1), 156–167. doi:10.13722/j.cnki.jrme.2017.0824
Huang, F. M., Cao, Z. S., Guo, J. F., Jiang, S. H., Li, S., and Guo, Z. Z. (2020). Comparisons of heuristic, general statistical and machine learning models for landslide susceptibility prediction and mapping. Catena 191, 104580–4580. doi:10.1016/j.catena.2020.104580
Kohno, M., and Higuchi, Y. (2023). Landslide susceptibility assessment in the Japanese archipelago based on a landslide distribution map. ISPRS Int. J. Geo-information 12 (2), 37. doi:10.3390/ijgi12020037
Liu, X., Wang, Y., and Leung, A. K. (2023). Numerical investigation of rainfall intensity and duration control of rainfall-induced landslide at a specific slope using slope case histories and actual rainfall records. Bull. Eng. Geol. Environ. 82, 333. doi:10.1007/s10064-023-03359-1
Lu, C., and Cai, C. (2019). Challenges and countermeasures for construction safety during the Sichuan –Tibet railway project. Engineering 5 (5), 833–838. doi:10.1016/j.eng.2019.06.007
Mao, Y. M., Li, Y. C., Teng, F., Sabonchi, A. K. S., Azarafza, M., and Zhang, M. S. (2024). Utilizing hybrid machine learning and soft computing techniques for landslide susceptibility mapping in a drainage Basin. Water 16 (3), 380. doi:10.3390/w16030380
Nanehkaran, Y. A., Mao, Y. M., Azarafza, M., Koçkar, M. K., and Zhu, H. H. (2021). Fuzzy-based multiple decision method for landslide susceptibility and hazard assessment: a case study of Tabriz, Iran. Geomechanics Eng. 24 (5), 407–418. doi:10.12989/gae.2021.24.5.407
Peng, J. B., Cui, P., and Zhuang, J. Q. (2020). Challenges to engineering geology of Sichuan-Tibet railway. Chin. J. Rock Mech. Eng. 39 (12), 2377–2389. doi:10.13722/j.cnki.jrme.2020.0446
Peng, J. B., Zhang, Y. S., Huang, D., Wang, F. Y., and Wang, Z. P. (2023). Interaction disaster effects of the tectonic deformation sphere, rock mass loosening sphere, surface freeze-thaw sphere and engineering Disturbance Sphere on the Tibetan Plateau. Earth Sci. 48 (8), 3099–3114. doi:10.3799/dqkx.2023.137
Piacentini, D., Devoto, S., Mantovani, M., Pasuto, A., Prampolini, M., and Soldati, M. (2015). Landslide susceptibility modeling assisted by Persistent scatterers interferometry (PSI): an example from the northwestern Coast of Malta. Nat. Hazards 78 (1), 681–697. doi:10.1007/s11069-015-1740-8
Qi, T. J., Meng, X. M., Qing, F., Zhao, Y., Shi, W., Chen, G., et al. (2021). Distribution and characteristics of large landslides in a fault zone: a case study of the NE Qinghai-Tibet Plateau. Geomorphology 379, 107592. doi:10.1016/j.geomorph.2021.107592
Reichenbach, P., Rossi, M., Malamud, B. D., Mihir, M., and Guzzetti, F. (2018). A review of statistically-based landslide susceptibility models. Earth-Science Rev. 180, 60–91. doi:10.1016/j.earscirev.2018.03.001
Rizvi, Z. H., Mustafa, S. H., Sattari, A. S., Ahmad, S., Furtner, P., and Wuttke, F. (2020). “Dynamic lattice element modelling of cemented geomaterials,” in Advances in computer methods and geomechanics. Lecture notes in civil engineering. Editors A. Prashant, A. Sachan, and C. Desai (Singapore: Springer), 55, 655–665. doi:10.1007/978-981-15-0886-8_53
Sahana, M., and Sajjad, H. (2017). Evaluating effectiveness of frequency ratio, fuzzy logic and logistic regression models in assessing landslide susceptibility: a case from rudraprayag district, India. J. Mt. Sci. 14 (11), 2150–2167. doi:10.1007/s11629-017-4404-1
Samia, J., Temme, A. J. A. M., Bregt, A., Wallinga, J., Guzzetti, F., and Ardizzone, F. (2020). Dynamic path-dependent landslide susceptibility modelling. Nat. Hazard Earth Syst. Sci. 20 (1), 271–285. doi:10.5194/nhess-20-271-2020
Shan, Y. F., Xu, Z., Zhou, S. S., Lu, H. Y., Yu, W. L., Li, Z. G., et al. (2024). Landslide hazard assessment combined with InSAR deformation: a case study in the zagunao river basin, Sichuan Province, Southwestern China. Remote Sens. 16 (1), 99. doi:10.3390/rs16010099
Shu, B., Chen, Y., Amani-Beni, M., and Zhang, R. Z. (2022). Spatial distribution and influencing factors of mountainous geological disasters in southwest China: a fine-scale multi-type assessment. Front. Environ. Sci. 10, 1049333. doi:10.3389/fenvs.2022.1049333
Song, X. H., and Tan, Y. (2021). Experimental investigation on the influences of rainfall patterns on instability of sandy slopes. Environ. Earth Sci. 80, 803. doi:10.1007/s12665-021-10118-6
Wang, Q., Wang, Y., Niu, R. Q., and Peng, L. (2017). Integration of information theory, K-means cluster analysis and the logistic regression model for landslide susceptibility mapping in the three gorges Area,China. Remote Sens. 9 (9), 938. doi:10.3390/rs9090938
Wang, S. B., Zhuang, J. Q., Mu, J. Q., Zheng, J., Zhan, J. W., Wang, J., et al. (2022). Evaluation of landslide susceptibility of the Ya'an-Linzhi section of the sichuan-tibet railway based on deep learning. Environ. Earth Sci. 81, 250. doi:10.1007/s12665-022-10375-z
Wolpert, D. (1992). Stacked generalization. Neural Netw. 5 (2), 241–259. doi:10.1016/S0893-6080(05)80023-1
Xu, Y., Xu, X. R., and Tang, Q. (2016). Human activity intensity of land surface: concept, methods and application in China. J. Geogr. Sci. 26 (09), 1349–1361. doi:10.1007/s11442-016-1331-y
Xu, L. L., Chen, C. L. P., Qing, F., Meng, X. M., Zhao, Y., Qi, T. J., et al. (2022). Graph-represented broad learning system for landslide susceptibility mapping in alpine-canyon region. Remote Sens. 14 (12), 2773. doi:10.3390/rs14122773
Yang, R., Fellin, M. G., Herman, F., Willett, S. D., Wang, W., and Maden, C. (2016). Spatial and temporal pattern of erosion in the three Rivers region, southeastern Tibet. Earth Planet. Sci. Lett. 433, 10–20. doi:10.1016/j.epsl.2015.10.032
Yang, Z. H., Zhang, Y. S., Guo, C. B., and Yao, X. (2018). Sensitivity analysis on causative factors of geohazards in eastern margin of Tibetan Plateau. J. Eng. Geol. 26 (3), 673–683. doi:10.13544/j.cnki.jeg.2017-165
Yao, X., Li, L. J., Zhang, Y. S., Guo, C. B., and Zhou, N. J. (2015). Regional crustal stability assessment of the eastern margin of Tibetan Plateau. Geol. Bull. China 34 (1), 32–44. doi:10.3969/j.issn.1671-2552.2015.01.003
Yesilnacar, E., and Topal, T. (2005). Landslide susceptibility mapping: a comparison of logistic regression and neural networks methods in amedium scale study, hendek region (turkey). Eng. Geol. 79, 251–266. doi:10.1016/j.enggeo.2005.02.002
Yi, Y. N., Zhang, Z. J., Zhang, W. C., Jia, H. H., and Zhang, J. Q. (2020). Landslide susceptibility mapping using multiscale sampling strategy and convolutional neural network:a case study in jiuzhaigou region. Catena 195, 104851. doi:10.1016/j.catena.2020.104851
Yi, Y. N., Xu, X. W., Xu, G. Y., and Gao, H. R. (2023). Landslide detection using time-series InSAR method along the kangding-Batang section of shanghai-Nyalam road. Remote Sens. 15 (5), 1452. doi:10.3390/rs15051452
Zeng, T. R., Wu, L. Y., Jin, B. J., Yin, K. L., Chen, Y. T., and Chen, H. (2023). Landslide dynamic susceptibility mapping based on stacking ensemble strategy and SBAS-InSAR. Chin. J. Rock Mech. Eng. 42 (9), 2266–2282. doi:10.13722/j.cnki.jrme.2022.1089
Zhang, H. P., Oskin, M. E., Liu, Z. J., Zhang, P. Z., Reiners, P. W., and Xiao, P. (2016). Pulsed exhumation of interior eastern tibet:implications for relief generation mechanisms and the origin of high-elevation planation surfaces. Earth Planet. Sci. Lett. 449, 176–185. doi:10.1016/j.epsl.2016.05.048
Zhao, H. L., Yao, L. H., Mei, G., Liu, T. Y., and Ning, Y. S. (2017). A fuzzy comprehensive evaluation method based on AHP and Entropy for a landslide susceptibility map. Entropy 19 (8), 396. doi:10.3390/e19080396
Zhao, J. Q., Zhang, Q., Wang, D. Z., Wu, W. H., and Yuan, R. Y. (2022). Machine learning-based evaluation of susceptibility to geological hazards in the hengduan Mountains region, China. Int. J. Disaster Risk Sci. 13, 305–316. doi:10.1007/s13753-022-00401-w
Zhao, S. F., Zeng, R. Q., Zhang, Z. L., Meng, X. M., Qi, T. J., Zhao, L., et al. (2024). Landslide mapping and causes of landslides in the China-Nepal transportation corridor based on remote sensing technology. Remote Sens. 16 (2), 356. doi:10.3390/rs16020356
Keywords: lexi highway, SBAS-InSAR, ensemble learning, landslide, susceptibility
Citation: Li C, Li T, Lan F, Ren Y, Wen Y and Cai W (2025) The evaluation of landslide comprehensive susceptibility based on stacking ensemble learning fusion model and SBAS-InSAR: a case study in lexi highway. Front. Earth Sci. 13:1675848. doi: 10.3389/feart.2025.1675848
Received: 29 July 2025; Accepted: 12 November 2025;
Published: 24 November 2025.
Edited by:
Wen Nie, Jiangxi University of Science and Technology, ChinaReviewed by:
Zarghaam Rizvi, Geo Analysis Engineering GmbH, GermanyMohammad Azarafza, University of Tabriz, Iran
Copyright © 2025 Li, Li, Lan, Ren, Wen and Cai. This is an open-access article distributed under the terms of the Creative Commons Attribution License (CC BY). The use, distribution or reproduction in other forums is permitted, provided the original author(s) and the copyright owner(s) are credited and that the original publication in this journal is cited, in accordance with accepted academic practice. No use, distribution or reproduction is permitted which does not comply with these terms.
*Correspondence: Tianbin Li, bHRiQGNkdXQuZWR1LmNu