 A. Bonaccorso
 L. Carleo
 A. Cappello
 M. Aloisi
 G. Bilotta
 F. Cannavò
 G. Currenti
 A. Sicali
 G. Ganci
- Istituto Nazionale di Geofisica e Vulcanologia, Osservatorio Etneo, Catania, Italy
Over the past 20 years, Etna’s South-East Crater (SEC) has been the most active of the summit craters, producing more than 100 lava fountains and several effusive eruptions. The latter, lasting from days (effusive pulses) to tens of days (more prolonged effusive phases), occur frequently and thus require accurate volume estimation. Such eruptions usually produce small deformations (≤1 microstrain) that can be detected by the high-precision borehole dilatometers installed at Etna. Recently, a linear correlation has been found between strain changes and eruption volumes derived from satellite imagery for lava fountains. This study extends the previous findings by incorporating data from the SEVIRI satellite sensor, showing a proportionality between strain and volume also for the effusive pulses. Our study confirms that combining satellite and ground-based data enables real-time volcanic monitoring and volume estimation. This enhances the understanding of eruption dynamics and mass balance efficiency, therefore also contributing to the correct and effective communication of volcanic hazards.
1 Introduction
Mount Etna is a notably active basaltic volcano formed in the area of convergence between the African and the European plates. It is located in the eastern coast of Sicily (Central Mediterranean Sea, Figure 1) at the front of the Appennine Maghrebian fold in a complex geodynamic setting (Branca et al., 2011; Doglioni et al., 2001). The Etna volcano exhibits different eruptive styles, encompassing both explosive and effusive phenomena. Explosive activity ranges from moderate Strombolian eruptions to powerful lava fountains. Effusive activity is primarily manifested as lava flows. Flank eruptions, producing extensive lava fields, pose the most significant hazard, threatening the densely populated areas and infrastructure surrounding the volcano. Historically, prolonged flank eruptions, driven by feeder dike emplacement and propagation, have caused substantial damage (Branca and Del Carlo, 2004). However, recent decades have also seen numerous summit effusive events, with smaller lava flows originating from the main craters, occasionally resulting in damage and elevated volcanic risk. A compelling example is the first stage of the 1971 eruption, where initial summit flows from fissures at 3.000 m a.s.l., destroyed the upper cableway and the historic volcanological observatory, both iconic landmarks, and threatened the southern tourist center (Branca et al., 2021). In general, Etna, in addition to being densely urbanized around its flanks, is also crowded with tourism that reaches the summit areas, and therefore effective and rapid communication of volcanic hazards is fundamental for both explosive and effusive phenomena for the correct management of the associated risk.
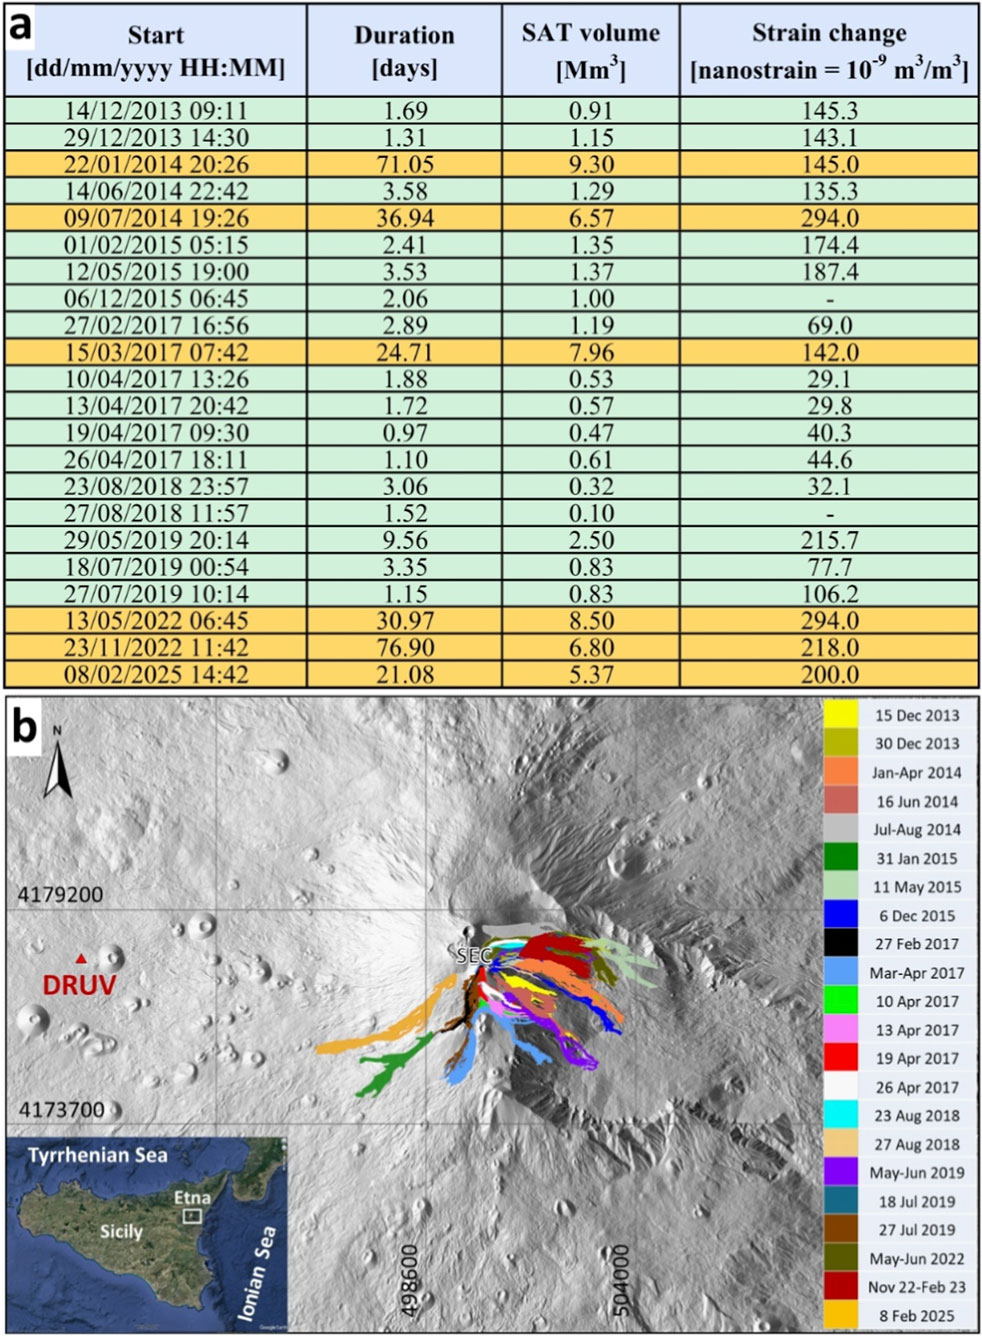
Figure 1. (a) Details on the period, duration, lava volumes, and recorded strain changes for the SEC’s Effusive Pulses (EP, in green) and Prolonged Effusive Phases (PEP, in orange) from 2013 to 2025. (b) Mapping of the related lava flows extracted from high-resolution satellite imagery. The map also reports the position of the summit SE crater (SEC) and of the borehole strainmeter used in this study (DRUV).
Since 2011, the eruptive activity has been dominated by lava fountains, particularly from the South-East Crater (SEC), which are characterized by intense explosions lasting several hours (Calvari et al., 2018; Cappello et al., 2019; Calvari and Nunnari, 2022). These events typically exhibit minor deformations (≤1 microstrain), often eluding detection by conventional geodetic methods like GNSS or satellite interferometry, that are detectable by high-precision borehole dilatometers (Bonaccorso et al., 2016; 2020; 2021; Carleo et al., 2023; 2025). A recent research has also established a linear relationship between volumetric strain changes and erupted volumes derived from optical satellite imagery (Bonaccorso et al., 2023), allowing us to estimate the erupted volumes both over time and in real-time. Therefore, from this result it appears clear that the joint monitoring of the thermal effects associated with the eruptive phases and the strain response of the edifice during magma emission represent a strategic combination to contribute to the characterization of the typology of the eruption in progress.
In addition to lava fountains, Etna has also experienced numerous summit effusive phases, primarily from the SEC, characterized by lava flows of different durations: effusive pulses lasting days, and more prolonged effusive phases lasting tens of days. From December 2013 to February 2025, 22 such events produced over 60 million cubic meters of lava, comparable to the average volume of a flank eruption, highlighting their significant role in the volcano’s dynamics. However, these events remain less studied and understood, particularly regarding their magma sources, volume estimation, and hazard assessment. Our study aims to contribute to the understanding of these summit effusive eruptions by investigating these episodes for the first time through the correlation of satellite-derived erupted volumes with high-precision strain responses. Specifically, we analyze more than 10 years of Etna activity, comparing the effusive volumes obtained from the SEVIRI multispectral satellite sensor, and high-precision strain data recorded by borehole strainmeters, focusing on both effusive pulses (EP) and prolonged effusive phases (PEP) from the SEC. This correlation is crucial for the real-time estimation of emitted volumes, which is essential for a rapid assessment of associated hazards.
In Section 1.1, we introduce the summit eruptive events that occurred in 2011–2025, in which are included also the effusive ones that are the subject of this study. In Section 2, we describe the two methodologies used to investigate these events. In Section 3, we present the main results obtained for EPs and PEPs in terms of the ratio between emitted volumes and recorded strain. In Section 4, these results are discussed in comparison with other types of eruptive activity at Etna and in relation to sources already constrained for other eruptions in previous studies.
1.1 Effusive summit events in 2011–2025
From 2011 to 2015, the SEC was the source of 53 eruptive events, causing important changes in the morphology of the southern flank of the volcano (Ganci et al., 2018). After the end of the 2011–2013 lava fountain sequence (Andronico et al., 2021), the eruptive activity tended to be less violent, mainly characterized by long-lasting summit effusive events, with durations from weeks to months, alternating with effusive pulses with a duration of a few days (Currenti and Bonaccorso, 2019). From December 2020 to February 2022, a new sequence of lava fountains, with more than 60 eruptions, started again. This sequence was again followed by long-lasting effusive eruptions, in May - June 2022 November 2022 – February 2023, and February 2025 (Zuccarello et al., 2023; Ganci et al., 2025).
In this work, we focus on the 6 PEP and the 16 EP events occurring between 2013 and 2025 (Figure 1a), whose lava flows are mapped in Figure 1b. PEP events lasted between ∼20 days and 2.5 months and produced lava flows with volumes greater than ∼5.5 millions of cubic meters (Mm3). Conversely, EP events lasted less than 4 days and emitted lava volumes below 1.4 Mm3. The only exception was May 29, 2019, which lasted ∼10 days and erupted 2.5 Mm3 of lava.
2 Methods
2.1 SEVIRI multispectral measurements
The Spinning Enhanced Visible Infra-Red Imager (SEVIRI) on Meteosat Second Generation (MSG) satellites, operational since August 2002, supports meteorological and environmental monitoring. It uses twelve spectral wavebands, with three infrared bands—IR3.9 (mid-infrared), IR10.8, and IR12.0 (thermal infrared)—crucial for volcanic monitoring. IR3.9 detects high-temperature anomalies, while IR10.8 and IR12.0 capture lower temperatures and compensate for atmospheric interference, enhancing thermal detection for lava flow monitoring. SEVIRI provides 15-min temporal resolution and a 3 km spatial resolution at nadir, making it valuable for real-time volcanic surveillance and research (e.g., Spina et al., 2025).
Here, SEVIRI data are processed by CL-HOTSAT (Ganci et al., 2023) to locate thermal anomalies and quantify them (Figure 2a). In particular, we compute the radiant heat flux associated with the hot-spot pixels, and convert the flux into time-averaged discharge rate (TADR) which is an estimate of the effusion rate. Finally, by integrating the TADR over time, the cumulative volume is computed (Figure 2b).
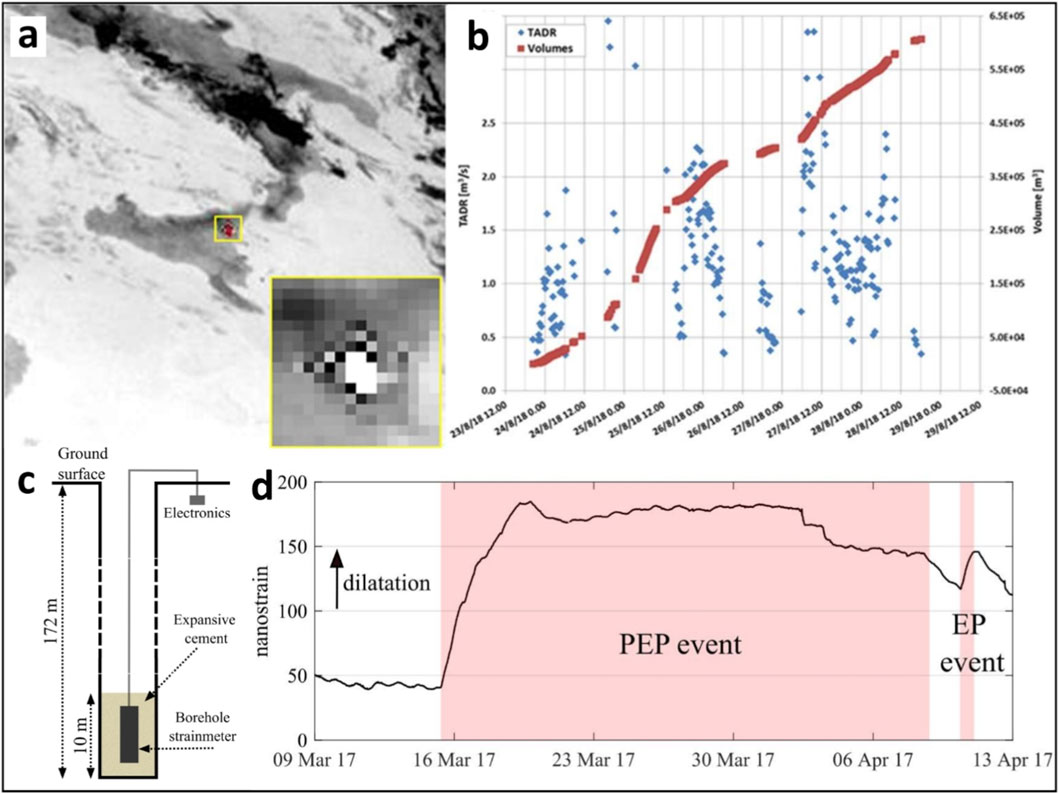
Figure 2. (a) SEVIRI image over Sicily, South Italy, during an eruption of Etna. The bright pixels in the inset represent the hot spots associated with the eruptive activity of SEC. (b) Example of the SEVIRI-derived effusion rates and cumulative lava volume from 24 to 29 August 2018. (c) Sketch of the DRUV installation. (d) Examples of filtered signal from the DRUV strainmeter showing strain changes during summit effusive EP and PEP events in 2017.
2.2 High-precision borehole strain recording
Sacks-Evertson strainmeters (Sacks et al., 1971) are borehole sensors which record the volumetric deformation of the surrounding rock in a wide frequency band (10–7 to more than 20 Hz) and with the highest resolution (10–12) achievable among the geodetic techniques (Roeloffs and Linde, 2007). These instruments are usually installed in deep holes (>100 m) and coupled to rock with expansive cement. The final in situ response of the sensor depends both on the quality of the rock-sensor coupling and on the capacity of the surrounding rock to transfer deformation. In the last decade, four borehole strainmeters were installed at Etna, each characterized by a different response (Bonaccorso et al., 2016; 2020). In this work, we focus on the DRUV strainmeter (Figure 2c), located ∼11 km away from the summit craters (Figure 1b), which is the device with the best rock-sensor coupling among the other strainmeters (Currenti et al., 2017). The DRUV signal is affected by disturbing strain sources mainly due to the curing of the cement and the relaxing of the hole (long-term drift), the Earth tides and the barometric pressure variations. To improve the sensitivity of the strainmeter signal to volcano-induced strain variations, the long-term drift is filtered out by considering exponential and linear functions (Hsu et al., 2015). The effects of the Earth tides and the barometric pressure are reduced using the procedure of Carleo et al. (2022) which allows detecting volcano-related strain variations in the order of 10–10 and 10–9 at time scales of a few hours to months, respectively. An example of DRUV filtered signal during PEP and EP events is presented in Figure 2d. Typically, the DRUV strainmeter records dilatation of the rock surrounding the sensor concurrently with the eruptions, according to a decompression of a shallow magmatic source (Bonaccorso et al., 2013). In this work, we use the terms dilatation/contraction and decompression/compression to indicate deformation at the DRUV and stress action of the source, respectively.
3 Results
3.1 Effusive pulses (EP)
From thermal satellite data, we found an average duration of the events of 2.6 days with the shortest event recorded on 19 April 2017 and the longest on 29 May 2019. The inferred volumes are around one million cubic meters, with the maximum value of 2.5 Mm3 for the 29 May 2019 event and the minimum of 0.1 Mm3 for the 27 August 2018 event.
All the EPs produce positive strain variations indicating dilation at the DRUV station. Such variations are in the order of 10–8 to 10–7 (Figure 1a), with the maximum value of 215.7 nanostrain for the 29 May 2019 event and the minimum of 29.1 nanostrain for the 10 April 2017 event.
Typically, both the beginning and end of the strain variation can be identified concurrently or slightly before the beginning and end of the effusive activity, respectively, as detected by satellite. In particular, after the end of the strain variations, the satellite measurements may record a decrease in the effusive rate representing the gradual waning of the activity.
Figure 3 includes the filtered strain and effusive volumes time series for the two EP events of 19 April 2017 (Figure 3a) and 18 July 2019 (Figure 3b), and the effusive volumes plotted against the strain variations related to all the EP events (Figure 3e). A linear relationship among these two quantities can be observed with a slope coefficient of 0.0074 Mm3/nanostrain. This coefficient is slightly lower than 0.014 Mm3/nanostrain (Bonaccorso et al., 2025) found for the Etna lava fountain events, obtained by comparing cumulated DRUV variations and cumulated erupted volumes estimated through topographic differencing (Bonaccorso et al., 2023).
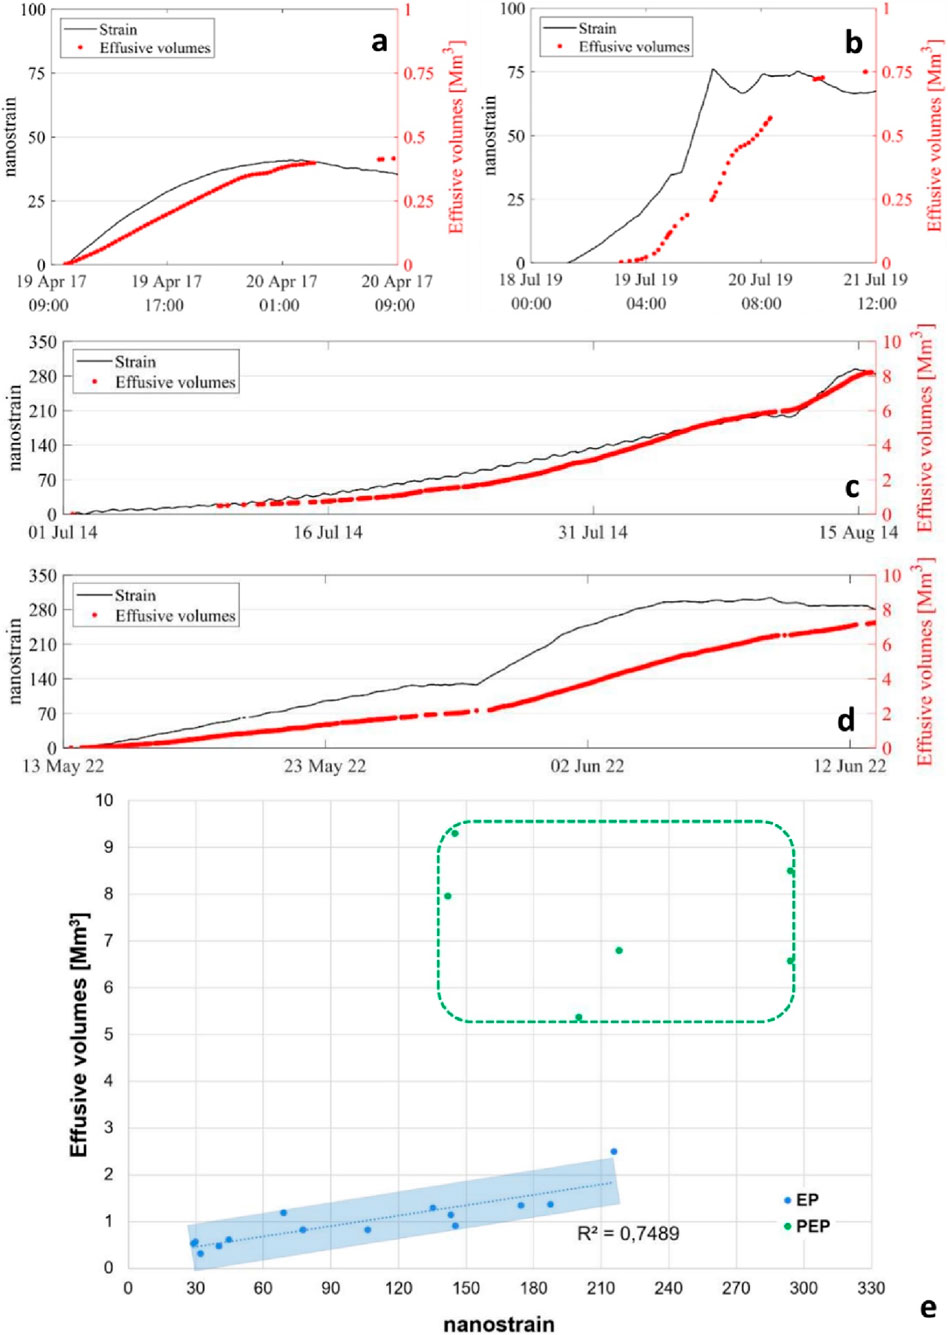
Figure 3. Erupted volumes from SEVIRI (red points) and strain signal at DRUV (black line) during the two EP events of (a) 19 July 2017 and (b) 18 July 2019, and the two PEP events of (c) July-August 2014 and (d) May 2022. (e) Linear relation between the SEVIRI-derived erupted volumes and the strain variations measured by DRUV station for all the EP events (blue line). The light blue stripes are the 95% confidence bands. The regression slope is 0.0074 Mm3/nanostrain, while the R2 is ∼0.75. In green the point cloud of all the PEP events.
3.2 Prolonged effusive phases (PEP)
From SEVIRI data, we obtained an average duration of the events of ∼44 days with the shortest event recorded on 8 February 2025 (∼21 days) and the longest occurring on November 2022 - February 2023 (∼77 days). The computed volumes have a mean of 7.42 Mm3 with the maximum value of 13.5 Mm3 for the January - April 2014 event and the minimum of 5.37 Mm3 estimated for the February 2025 event.
The DRUV strainmeter records dilatation of the surrounding rock concurrently with all the events, with strain changes in the order of 10–7, ranging from 142 to 294 nanostrain. The beginning of the strain variation is usually detected concurrently with the beginning of the effusive activity.
The strain and the effusive volumes time series for the two events of July-August 2014 and May 2022 are reported in Figures 3c,d. Figure 3e also includes the effusive volumes plotted against the strain variations related to all the PEP events. For these events, it is not possible to estimate a law as for the EPs. In fact, they are distributed according to a point cloud, with a centroid having an effusive volume of 7.42 Mm3 and a strain change of 215.5 nanostrain. However, even in the absence of a precise law, for PEPs the values of the estimated volumes and of the recorded strain certainly indicate a greater emptying of the source with a higher average ratio between erupted volume and DRUV strain response.
For the January - April 2014 event, the strain signal recorded by DRUV shows a particular pattern (Figure 4a). At the beginning of 2014, after a few weeks of discontinuous Strombolian activity, a more sustained activity began on 21 January, with the opening of two effusive vents, increasing in intensity the following days (Andronico et al., 2018). Despite the presence of effusive activity, during the month of January the strain did not show dilatation, as in the other EP and PEP events, which can be associated to the depressuring of a shallow reservoir, but, on the contrary, a clear contraction (phase 1F1 in Figure 4a). Similarly, the GNSS network (phase F1 in Figure 4b and displacement vectors in Figure 4c), in accordance with a pressurization od the volcano edifice, indicated a positive areal expansion, in agreement with the opposite trend observed on the DRUV measurements. After this pressurization phase, DRUV and GNSS time series recorded a trend inversion (phase F2 in Figures 4a,b, displacement vectors in Figure 4d), associated with a depressurization of the volcano edifice. On 11 February, the lower eastern flank of the SEC collapsed producing a pyroclastic density current (Andronico et al., 2018). After this sudden event, the effusive flow continued in the following weeks until early April and DRUV (phase F2 in Figure 4a) and GNSS (phase F2 in Figure 4b and displacement vectors in Figure 4d) time series continued to show a reversed trend with a gradual dilatation of the rock surrounding the DRUV station and a slight negative expansion of the volcano edifice, respectively.
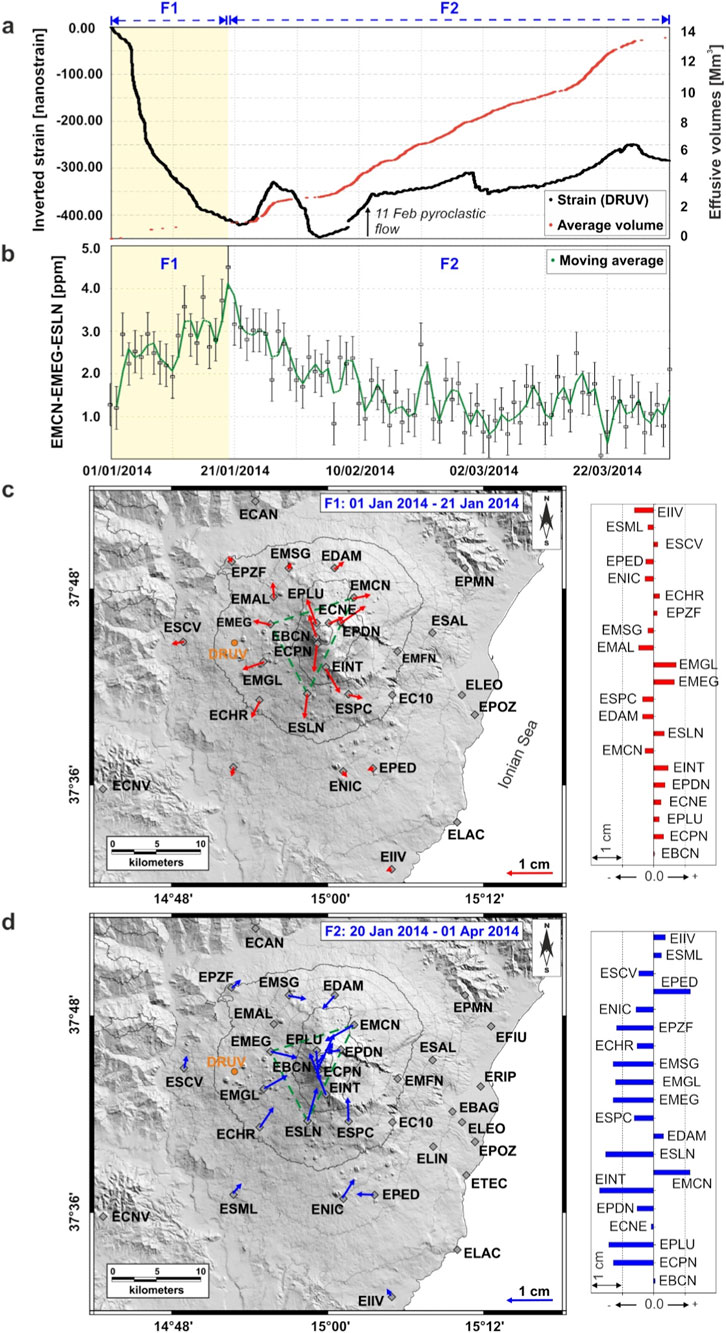
Figure 4. (a) Cumulative volume from SEVIRI (red) and strain signal at DRUV (black). The yellow box indicates the time period (01–21 January 2014, phase F1) during which contraction at DRUV (strain) and areal expansion (GNSS) were recorded, despite the effusive activity in progress. The following period (20 January – 01 April 2014), during which dilatation at DRUV (strain) and areal deflation (GNSS) were recorded, is indicated as phase F2. (b) Areal dilatation of the GNSS triangle EMCN-EMEG-ESLN during January-April 2014 (green). The raw data from the GNSS permanent stations were processed on a daily basis in PPP mode using the Gipsy-X 1.5 software with JPL final products (Bertiger et al., 2020). From the daily solutions of 3-dimensional positions, we calculated the areal strain for the considered triangle. The associated uncertainties are calculated by using the error propagation formula. (c) Horizontal displacements (red arrows) recorded at the GNSS benchmarks during phase F1 (raw data processed using Gipsy-X 1.5). (d) Horizontal displacements recorded at the GNSS benchmarks (blue arrows) recorded for phase F2 (for the processing, see Aloisi et al., 2018). The bar charts report the recorded vertical dislocations for each phase. The vertical variations are sorted by the GNSS station elevations. The location of strainmeter DRUV (red circle) and the GNSS triangle EMCN-EMEG-ESLN (green dotted line) are also indicated.
4 Discussion
Mount Etna exhibits a dual nature in its eruptive behavior, characterized by both effusive and explosive activity. Effusive eruptions, typically of longer duration and marked by bigger emitted volumes, pose the most significant territorial risk when originating from the volcano’s flanks. Explosive events, generally erupted from the summit craters, have shorter durations and range in intensity from Strombolian activity to brief episodes of violent lava fountaining.
Since the 1980s, geodetic measurements on Etna have documented phases of inflation preceding major flank eruptions lasting from months to years, during which deflationary periods have occurred and associated with the effusion of large volumes of lava (Bonaccorso and Aloisi, 2021 and references therein). Analysis of these measurements has indicated the presence of an intermediate magma storage zone situated at a depth of 4–6 km below sea level (e.g., Bonforte et al., 2008; Bonaccorso and Aloisi, 2021).
Since 2011, numerous explosive eruptions, featuring over 100 lava fountains from the South-East Crater, have been observed. The recorded strain variations have enabled constraining a smaller and shallower source, located approximately at sea level (Bonaccorso et al., 2013; 2021). This position agrees with recent seismic tomography findings (De Gori et al., 2021), which reveal a small magma reservoir centered at 0–1 km b.s.l. This shallower reservoir represents a smaller storage where gas-rich magma accumulates, subsequently undergoing forceful eruption as lava fountains. Therefore, there are two levels of accumulation and stationing of magma between 10 and 0 km b.s.l.: an intermediate one capable of then releasing larger quantities of magma and a shallower one in which the source that feeds the SEC lava fountains is located. A summary of Etna’s plumbing system inferred by the deformation sources is provided in Aloisi et al. (2018).
Since 1971, Etna has exhibited steady-state eruptive behavior, i.e., a constant eruptive rate of 0.8 m3/s (Bonaccorso and Calvari, 2013). These allow us to consider curves of expected cumulative erupted volumes which, by comparing them to the real erupted volumes, are able to quantify the expected maximum volume to be erupted (Bonaccorso and Calvari, 2013; Calvari and Nunnari, 2022), therefore providing a useful tool to control the state of the volcano.
In addition to the lava fountain episodes and the major flank eruptions, several short-lasting summit effusive eruptions have also occurred. Despite their ephemeral nature, these events have cumulatively erupted over 60 Mm3 of lava in slightly more than 10 years. Consequently, alongside the more dramatic lava fountain episodes, these short-lived effusive phases play a significant role in the system’s re-equilibration. In this context, the role of EPs and PEPs becomes fundamental, given that their correct volume quantification also allows us to have an updated picture of the balance between erupted volumes and volumes to be erupted. By contrast to flank eruptions and lava fountain activity, which are extensively documented, this category of eruptive phenomena has received considerably less attention.
For the lava fountain events, the linear relationship between total erupted volume estimated from satellite sensors for topographic monitoring and cumulated strain variations measured by DRUV has a slope of 0.0147 Mm3/nanostrain (Bonaccorso et al., 2023; 2025). We now find that the regression coefficient for EP events is ∼0.008 Mm3/nanostrain is lower than the lava fountains case (Figure 3e). We interpret this aspect as due to a less efficient emptying of the same shallow source located at ∼0 km b.s.l. (Bonaccorso et al., 2013) that feeds the lava fountains. The lower efficiency is attributable to lower accumulation/release of the gaseous phase that determines a less intense explosive nature, causing a lesser emptying of the source, characterized by a less violent dynamic and more prolonged in time. The volumes emitted, in quantity and proportionally to the concurrently recorded strain variation, during the PEP phases are greater than those of the EP phases. In general, during the lava emission a gradual deflation of the volcano edifice can be cumulatively detected by GNSS. These measurements provide valuable information on the centroid of the source that causes the deflation recorded during the entire period of the PEP phases (Aloisi et al., 2018; Palano et al., 2024). For all the PEP events, the common relevant aspect is that the inferred position of the deflating source is nearly coincident with the position of the intermediate storage modelled during the previous main flank eruptions. Therefore, these kinds of events are characterized by a partial emptying of the intermediate source without stationing and accumulation of gaseous phase in the shallower source. However, PEP events produce lava flows lasting several weeks and capable of reaching altitudes (i.e., ∼2000 m a.s.l.), where tourist centers and numerous high-mountain trails, often crowded with tourists, are located. Therefore, the proper assessment of these phenomena and the consequent communication of volcanic hazards is necessary from their initial stages.
An intriguing additional aspect concerns the signals observed at the beginning of the January-April 2014 phase. During this period, despite magma emission, the strain, instead of showing dilation, recorded a continuous contraction until 11 February (Figure 4), when a collapse of the eastern flank of the SEC cone occurred with a subsequent release of a pyroclastic flow (Andronico et al., 2018). This trend of the strain is consistent with the trend of the GNSS signals showing a positive areal dilation instead of the areal deflation that is usually observed during the effusive phases and associated with the magma outflow. This specific critical aspect, which deserves further targeted investigations, takes on the value of a potential ‘pre-warning' element that could provide useful information on the phases preceding the summit collapse and the hot avalanche.
5 Conclusion
Our research underscores the importance of continuous, high-resolution monitoring of volcanic strain and effusive output to effectively characterize the summit effusive activity differentiating between shallow-fed, short-lasting events and deeper-fed, long-lasting more voluminous eruptions, ultimately leading to improved hazard mitigation efforts at Etna and other similar volcanic systems worldwide. We have analyzed more than 10 years of the Etna activity (2013–2025), revealing two types of summit effusive event with distinct volume-to-strain relationships and feeding depths. Short-lived effusive pulses show a linear volume-to-strain relationship, fed from a shallow reservoir (0 km asl) with a less explosive style than lava fountains. Prolonged effusive phases exhibit a higher volume-to-strain ratio, indicating a deeper intermediate reservoir (5–6 km bsl) with a more voluminous magma supply. Recognizing these differences early, based on volume-to-strain, is crucial for accurate hazard assessment, forecasting eruption style, and improving preparedness and response strategies at Etna and similar volcanoes.
Data availability statement
Satellite-derived products are available as supplementary data of Ganci et al. (2018) and Zuccarello et al. (2023), and at https://doi.org/10.6084/m9.figshare.28759586.v2. Strain data for EP and PEP events are available at https://doi.org/10.6084/m9.figshare.29544410.v1.
Author contributions
AB: Writing – review and editing, Writing – original draft, Methodology, Supervision, Conceptualization, Investigation, Funding acquisition, Validation. LC: Writing – original draft, Methodology, Visualization, Formal Analysis. AC: Visualization, Investigation, Methodology, Formal Analysis, Writing – review and editing, Writing – original draft. MA: Formal Analysis, Writing – original draft. GB: Writing – original draft, Formal Analysis, Methodology. FC: Formal Analysis, Writing – original draft. GC: Methodology, Writing – original draft, Formal Analysis. AS: Writing – original draft, Data curation. GG: Methodology, Funding acquisition, Writing – original draft.
Funding
The authors declare that financial support was received for the research and/or publication of this article. This research benefited from funding provided by the EC H2020- FET OPEN project “SiC nano for picoGeo,” grant agreement No. 863220, by the project “SiciliAn MicronanOTecH Research And innovation Center” funded by NextGenerationEU under the National Recovery and Resilience Plan (NRRP) ECS_00000022, and by the INGV project Pianeta Dinamico VT SAFARI (CUP D53J19000170001) funded by MUR.
Conflict of interest
The authors declare that the research was conducted in the absence of any commercial or financial relationships that could be construed as a potential conflict of interest.
Generative AI statement
The authors declare that no Generative AI was used in the creation of this manuscript.
Any alternative text (alt text) provided alongside figures in this article has been generated by Frontiers with the support of artificial intelligence and reasonable efforts have been made to ensure accuracy, including review by the authors wherever possible. If you identify any issues, please contact us.
Publisher’s note
All claims expressed in this article are solely those of the authors and do not necessarily represent those of their affiliated organizations, or those of the publisher, the editors and the reviewers. Any product that may be evaluated in this article, or claim that may be made by its manufacturer, is not guaranteed or endorsed by the publisher.
References
Aloisi, M., Bonaccorso, A., Cannavò, F., and Currenti, G. M. (2018). Coupled Short- and medium-term geophysical signals at etna volcano: using deformation and strain to infer magmatic processes from 2009 to 2017. Front. Earth Sci. 6, 109. doi:10.3389/feart.2018.00109
Andronico, D., Di Roberto, A., De Beni, E., Behncke, B., Bertagnini, A., Del Carlo, P., et al. (2018). Pyroclastic density currents at Etna volcano, Italy: the 11 February 2014 case study. J. Volcanol. Geotherm. Res. 357, 92–105. doi:10.1016/j.jvolgeores.2018.04.012
Andronico, D., Cannata, A., Di Grazia, G., and Ferrari, F. (2021). The 1986–2021 paroxysmal episodes at the summit craters of mt. Etna: insights into volcano dynamics and hazard. Earth-Science Rev. 220, 103686. doi:10.1016/j.earscirev.2021.103686
Bertiger, W., Bar-Sever, Y., Dorsey, A., Haines, B., Harvey, N., Hemberger, D., et al. (2020). GipsyX/RTGx, a new tool set for space geodetic operations and research. Adv. Space Res. 66 (3), 469–489. doi:10.1016/j.asr.2020.04.015
Bonaccorso, A., and Aloisi, M. (2021). Tracking magma storage: new perspectives from 40 years (1980–2020) of ground deformation source modeling on Etna Volcano. Front. Earth Sci. 9, 638742. doi:10.3389/feart.2021.638742
Bonaccorso, A., and Calvari, S. (2013). Major effusive eruptions and recent lava fountains: balance between expected and erupted magma volumes at Etna volcano. Geophys. Res. Lett. 40, 6069–6073. doi:10.1002/2013GL058291
Bonaccorso, A., Currenti, G., Linde, A. T., and Sacks, S. I. (2013). New data from borehole strainmeters to infer lava fountain sources (Etna 2011–2012). Geophys. Res. Lett. 40 (14), 3579–3584. doi:10.1002/grl.50692
Bonaccorso, A., Linde, A., Currenti, G., Sacks, S., and Sicali, A. (2016). The borehole dilatometer network of Mount Etna: a powerful tool to detect and infer volcano dynamics. J. Geophys. Res. Solid Earth 121, 4655–4669. doi:10.1002/2016JB012914
Bonaccorso, A., Currenti, G., Linde, A., Sacks, S., and Sicali, A. (2020). Advances in understanding intrusive, explosive and effusive processes as revealed by the borehole dilatometer network on Mt. Etna volcano. Front. Earth Sci. 7, 357. doi:10.3389/feart.2019.00357
Bonaccorso, A., Carleo, L., Currenti, G., and Sicali, A. (2021). Magma migration at shallower levels and lava fountains sequence as revealed by borehole dilatometers on etna volcano. Front. Earth Sci. 9, 740505. doi:10.3389/feart.2021.740505
Bonaccorso, A., Carleo, L., Currenti, G., Bilotta, G., Cappello, A., and Ganci, G. (2023). A new approach for real-time erupted volume estimation from high-precision strain detection validated by satellite topographic monitoring. Geophys. Res. Lett. 50, e2023GL105424. doi:10.1029/2023GL105424
Bonaccorso, A., Carleo, L., Currenti, G., and Sicali, A. (2025). An unobserved lava fountain deciphered in real-time by high precision borehole strainmeter and contribution to hazard evaluation: the Etna 21 May 2023 eruption. Bull. Volcanol. 87, 7. doi:10.1007/s00445-024-01790-0
Bonforte, A., Bonaccorso, A., Guglielmino, F., Palano, M., and Puglisi, G. (2008). Feeding system and magma storage beneath mt. Etna as revealed by recent inflation/deflation cycles. J. Geophys. Res. 113, B05406. doi:10.1029/2007JB005334
Branca, S., and Del Carlo, P. (2004). “Eruptions of Mt etna during the past 3,200 years: a revised compilation integrating the historical and stratigraphic records,” in Geophysical monograph 143. Editors Mt. Etna, V. Laboratory, A. Bonaccorso, S. Calvari, M. Coltelli, and C. Del Negro (Washington, DC: American Geophysical Union).
Branca, S., Coltelli, M., and Groppelli, G. (2011). Geological evolution of a complex basaltic stratovolcano: mount Etna, Italy. Italian J. Geosciences 130 (3), 306–317. doi:10.3301/IJG.2011.13
Branca, S., Musumeci, D., and Ingaliso, L. (2021). The significance of the 1971 flank eruption of Etna from volcanological and historic viewpoints. Ann. Geophys. 64 (5). doi:10.4401/ag-8669
Calvari, S., and Nunnari, G. (2022). Etna output rate during the last decade (2011–2022): insights for hazard assessment. Remote Sens. 14, 6183. doi:10.3390/rs14236183
Calvari, S., Cannavò, F., Bonaccorso, A., Spampinato, L., and Pellegrino, A. G. (2018). Paroxysmal explosions, lava fountains and ash plumes at Etna Volcano: eruptive processes and hazard implications. Front. Earth Sci. 6, 107. doi:10.3389/feart.2018.00107
Cappello, A., Ganci, G., Bilotta, G., Corradino, C., Hérault, A., and Del Negro, C. (2019). Changing eruptive styles at the south-east crater of Mount Etna: implications for assessing lava flow hazards. Front. Earth Sci. 7, 213. doi:10.3389/feart.2019.00213
Carleo, L., Bonaccorso, A., Currenti, G., and Sicali, A. (2022). Near real-time filtering of high precision borehole strainmeter signals for volcano surveillance. Ann. Geophys. 65 (4), VO428. doi:10.4401/ag-8787
Carleo, L., Currenti, G., and Bonaccorso, A. (2023). Clustering of eruptive events from high-precision strain signals recorded during the 2020–2022 lava fountains at the Etna volcano (Italy). Nat. Hazards Earth Syst. Sci. 23 (5), 1743–1754. doi:10.5194/nhess-23-1743-2023
Carleo, L., Currenti, G., Bonaccorso, A., and Sicali, A. (2025). Relation between volcanic tremor and geodetic strain signals during basaltic explosive eruptions at etna. J. Geophys. Res. Solid Earth 130 (8), e2025JB031564. doi:10.1029/2025JB031564
Currenti, G., and Bonaccorso, A. (2019). Cyclic magma recharge pulses detected by high-precision strainmeter data: the case of 2017 inter-eruptive activity at Etna volcano. Sci. Rep. 9 (1), 7553–7557. doi:10.1038/s41598-019-44066-w
Currenti, G., Zuccarello, L., Bonaccorso, A., and Sicali, A. (2017). Borehole volumetric strainmeter calibration from a nearby seismic broadband array at Etna volcano. J. Geophys. Res. Solid Earth 112 (10), 7729–7738. doi:10.1002/2017JB014663
De Gori, P., Giampiccolo, E., Cocina, O., Branca, S., Doglioni, C., and Chiarabba, C. (2021). Re-pressurized magma at mt. Etna, Italy, may feed eruptions for years. Earth Environ. 2 (1), 216. doi:10.1038/s43247-021-00282-9
Doglioni, C., Innocenti, F., and Mariotti, G. (2001). Why Mt etna? Terra Nova. 13 (1), 25–31. doi:10.1046/j.1365-3121.2001.00301.x
Ganci, G., Cappello, A., Bilotta, G., Herault, A., Zago, V., and Del Negro, C. (2018). Mapping volcanic deposits of the 2011–2015 etna eruptive events using satellite remote sensing. Front. Earth Sci. 6, 83. doi:10.3389/feart.2018.00083
Ganci, G., Bilotta, G., Zuccarello, F., Calvari, S., and Cappello, A. (2023). A multi-sensor satellite approach to characterize the volcanic deposits emitted during Etna’s lava fountaining: the 2020–2022 study case. Remote Sens. 15, 916. doi:10.3390/rs15040916
Ganci, G., Bilotta, G., Dozzo, M., Spina, F., Zuccarello, F., Cristofaro, R., et al. (2025). Multi-platform satellite-derived products during the 2025 etna eruption. Sci. Data 12, 1353. doi:10.1038/s41597-025-05545-0
Hsu, Y.-J., Chang, Y.-S., Liu, C.-C., Lee, H.-M., Linde, A. T., Sacks, S. I., et al. (2015). Revisiting borehole strain, typhoons, and slow earthquakes using quantitative estimates of precipitation-induced strain changes. J. Geophys. Res. Solid Earth 120 (6), 4556–4571. doi:10.1002/2014JB011807
Palano, M., Pezzo, G., and Chiarabba, C. (2024). Magma budget, plutonic growth and lateral spreading at Mt. Etna. Commun. Earth and Environ. 5, 95. doi:10.1038/s43247-024-01267-0
Roeloffs, E. A., and Linde, A. T. (2007). “Borehole observations of continuous strain and fluid pressure,” in Volcano deformation (Berlin: Springer), 305–322. doi:10.1007/978-3-540-49302-0_9
Sacks, S. I., Suyehiro, S., Evertson, D. W., and Yamagishi, Y. (1971). Sacks-evertson strainmeter, its installation in Japan and some preliminary results concerning strain steps. Pap. Meteorology Geophys. 22 (3–4), 195–208. doi:10.2467/mripapers1950.22.3-4_195
Spina, F., Bilotta, G., Cappello, A., Spina, M., Zuccarello, F., and Ganci, G. (2025). Volcanic activity classification through semi-supervised learning applied to satellite radiance time series. Remote Sens. 17, 1679. doi:10.3390/rs17101679
Keywords: Etna volcano, borehole strainmeters, satellite thermal data, effusive eruptions, volcanic hazard
Citation: Bonaccorso A, Carleo L, Cappello A, Aloisi M, Bilotta G, Cannavò F, Currenti G, Sicali A and Ganci G (2025) Investigation into Etna’s summit effusive activity by correlating satellite-derived erupted volumes and strain response. Front. Earth Sci. 13:1709184. doi: 10.3389/feart.2025.1709184
Received: 19 September 2025; Accepted: 12 November 2025;
Published: 20 November 2025.
Edited by:
Abani Kumar Patra, Tufts University, United StatesReviewed by:
Maurizio Mulas, ESPOL Polytechnic University, EcuadorJoaquin Alberto Cortes, Edge Hill University, United Kingdom
Copyright © 2025 Bonaccorso, Carleo, Cappello, Aloisi, Bilotta, Cannavò, Currenti, Sicali and Ganci. This is an open-access article distributed under the terms of the Creative Commons Attribution License (CC BY). The use, distribution or reproduction in other forums is permitted, provided the original author(s) and the copyright owner(s) are credited and that the original publication in this journal is cited, in accordance with accepted academic practice. No use, distribution or reproduction is permitted which does not comply with these terms.
*Correspondence: L. Carleo, bHVpZ2kuY2FybGVvQGluZ3YuaXQ=