Abstract
In this study we explore the use of recommender systems as a means of providing automated and personalized feedback to students following summative assessment. The intended feedback is a personalized set of test questions (items) for each student that they could benefit from practicing with. Recommended items can be beneficial for students as they can support their learning process by targeting specific gaps in their knowledge, especially when there is little time to get feedback from instructors. The items are recommended using several commonly used recommender system algorithms, and are based on the students' scores in a summative assessment. The results show that in the context of the Dutch secondary education final examinations, item recommendations can be made to students with an acceptable level of model performance. Furthermore, it does not take a computationally complex model to do so: a simple baseline model which takes into account global, student-specific, and item-specific averages obtained similar performance to more complex models. Overall, we conclude that recommender systems are a promising tool for helping students in their learning process by combining multiple data sources and new methodologies, without putting additional strain on their instructors.
1. Introduction
Feedback is an important and widely researched factor in improving educational outcomes of students due to its potential to indicate what is needed to bridge the gap between where students are and where they are going (e.g., Kluger and DeNisi, 1996; Hattie and Timperley, 2007; Shute, 2008). It can be defined as “. information provided by an agent regarding aspects of one's performance or understanding” (see Hattie and Timperley, 2007). The concept of feedback is central to the field of formative educational assessment. Formative assessment aims to improve student attainment of the learning material through participation in the assessment (e.g., Heritage, 2007; Shute, 2008; Black and Wiliam, 2009). Formative assessment takes place during the learning process, unlike its counterpart summative assessment, which usually takes place at the end of a learning process and aims to make a decision or judgment about the student's skill or knowledge level (Dixson and Worrell, 2016). Feedback on the basis of summative assessment is much less common for several reasons, including the aforementioned timing of the assessment at the end of a learning process. Other important reasons include the fast and standardized nature of summative assessment: the assessment usually needs to be followed quickly by a judgment call or decision, and the assessment design is optimized for quantitative decision making (e.g., grading, or a pass/fail judgment), as opposed to for providing a basis for helpful feedback. However, feedback can be useful to students in the context of summative assessment as well, and its data provides a wealth of information about their knowledge or skill level. This paper explores a method of providing personalized and automated feedback to students on the basis of summative assessment data.
Students who are preparing for educational assessment can benefit from practice material that is attuned to their individual needs. This can be considered topic contingent feedback, defined by Shute (2008) as “feedback providing the learner with information relating to the target topic currently being studied.” Students tend to study by rereading (Karpicke et al., 2009), and most students are poor at judging their mastery of the material (Dunlosky and Lipko, 2007). Furthermore, an extensive meta-analysis on practice testing by Adesope et al. (2017) found that practice tests are more beneficial for learning than all other comparison conditions (e.g., Roediger and Karpicke, 2006; Callender and McDaniel, 2009), especially when the practice and final test formats are identical. This is true regardless of whether the students are supplied with corrective feedback (information on the correctness of their answers) afterwards. Practicing with personalized practice material, such as a set of test questions (items), can therefore be a valuable addition to the learning process.
Providing a personalized set of test items can be seen as a recommendation problem. Recommender systems (e.g., Ricci et al., 2015) are often used these days by commercial parties such as Netflix, Amazon, and Spotify to recommend items (movies, products, songs, etc.) to users (customers). There have been many applications of recommender systems in the field of education, particularly within the context of e-learning systems. Manouselis et al. (2011) provide an introduction to recommender systems for Technology Enhanced Learning settings and Rivera et al. (2018) give a more recent overview of applications in education. The most common application is to recommend learning materials and resources, such as books, papers, and courses to students (e.g., Zaíane, 2002; Tang and McCalla, 2005; Liang et al., 2006; O'Mahony and Smyth, 2007; Khribi et al., 2008; Bobadilla et al., 2009; Vialardi et al., 2009; Ghauth and Abdullah, 2010; Luo et al., 2010; Aher and Lobo, 2013; Bokde et al., 2015).
Recommender systems are not yet widely used in educational assessment contexts. One example of an application of recommender systems within the framework of formative assessment is a recent paper by Bulut et al. (2020), who developed an intelligent recommender system (IRS) that can be used to produce individualized test administration schedules for students. It is easy to draw parallels between educational assessment data and the more commercial contexts in which recommender systems are most often applied: users can be likened to students and products or items to test questions. Assessment data can look rather similar to the rating matrices that stem from the more commercial applications, especially when using an incomplete test design (where different students are subjected to different test items). Recommender systems could be used for presenting students with a personalized set of practice items, giving feedback such as “Students like you struggled with these exam questions” or “In the past, you have struggled with exam questions such as these”. Essentially, this entails using an algorithm with which items are selected on the criterion that similar students did not have affinity with them. Practicing with the recommended questions and focusing on the learning material covered in them could help students study effectively by closing gaps in their knowledge in a targeted way.
Presumably one reason for the lack of applications of recommender systems within educational assessment is that the established field of computerized adaptive testing (CAT) is concerned with the similar task of providing test-takers with subsequent test questions (e.g., Van der Linden et al., 2000). One difference between these methods lies in their purpose: in a CAT, the primary goal for item selection is related to test optimization (to accurately estimate the student's ability), whereas the aim of item selection in this paper is related to optimization of the learning process (to maximize the student's grasp of the material). Recommender systems are more suited to this purpose than the dominant modeling paradigm in the field of CAT (item response theory, or IRT). IRT assumes that the performance of a student on a test is dependent on the latent ability of the student and characteristics of the test items (e.g., Hambleton et al., 1991; Embretson and Reise, 2013). When using IRT to generate new test items for students in a CAT, students who have the same estimated latent ability will be given the same test item. Different recommender algorithms take different additional information into account (such as the similarities between the score patterns of different students) and therefore have increased potential for personalization.
This paper explores an application of recommender systems for summative assessment. Specifically, we consider recommender systems as a means of providing automated and personalized feedback to students based on their scores in a summative assessment. The current study differs from the existing literature on recommender systems in education in two ways. First, this study applies recommender systems in a high-stakes summative assessment context. Unlike in a pervasive digital learning environment or in a formative assessment context, the available information per student is limited to a single summative assessment. Second, the information that is used to generate recommendations differs between this study and most related literature, and with it the items that are recommended. The majority of the aforementioned studies use explicit evaluation ratings by students or teachers on the quality or usefulness of the items that are to be recommended. In this study, we use the students' scores on an exam as input for the recommendation algorithms. Thai-Nghe et al. (2010) used similar input (students' scores on their first attempt on a task) in their application of recommender systems but focused on the task of predicting student achievement rather than providing recommendations to students.
The objectives of this study are to determine whether recommender systems can successfully be used to recommend practice questions to students following a high-stakes summative assessment, and if so, which algorithms are most suited to this purpose. To this end, we compare the performance of several types of such recommender algorithms. The remainder of the text is structured as follows: in the methods section, we introduce recommender systems and describe the algorithms with which we will recommend items to students, as well as the data that we use. The results section evaluates the performances of these algorithms. In the conclusion, the performances of the algorithms are compared. We then go on to discuss the practical relevance and potential of the results in the discussion.
2. Methods
2.1. Data
The data used in the current study come from the final examinations for secondary school students in the Netherlands. These examinations are obligatory and provide the students with access to higher education such as university when completed with a sufficient result. After taking their secondary school exams, students in the Netherlands get the opportunity to take one resit exam. Reasons for a student to take this opportunity are to (a) improve their overall grade (e.g., in order to improve the odds of getting accepted into the higher education of their choice) or (b) obtain a passing grade for a course for which that is a diploma prerequisite. The resit exam takes place two to four weeks after the grading of the initial exam, during which the student must prepare. Due to these time constraints, it is necessary that any feedback to the student is delivered within this time frame.
We focus on digital exam data for mathematics in the year 2019 from students in grade 10 of a vocational track in Dutch secondary education. The subject of mathematics was chosen because these exams feature a relatively large amount of items with a maximum score of higher than one. Items such as these, for which partial scores can be obtained, give us more finely grained information about the student's ability. There are nine test versions (booklets), each with 22–26 test questions (items), taken by between 2,453 and 2,945 students (24,167 in total). There are 72 unique items in total, and all booklets have at least a third of their items in common with at least one other booklet, ensuring that all booklets are (indirectly) linked to each other through items that they have in common. All students are subjected to only one of the booklets, which means that they face only a subset of all available items during their exam. This means that, for all students, there is a set of items that they have not yet been faced with due to the nature of the test design. These are items that could be recommended to students to practice with.
The responses that students gave during their first exam have been scored, either automatically (multiple choice questions) or by their teachers. The items have a maximum score of between one and five, and no decimal scores are given. The score of a student on an item is rescaled to a measure we will call potential gain. First, the score is divided by the maximum obtainable score on the item. This gives us the proportion of the possible score that is obtained on the item. This proportion is then subtracted from one. This rescaled score can be interpreted as the percentage of the maximum item score that was not obtained by the student. We use this as a measure of how much can still be learned by the student concerning the course material that was covered by the item. This is also the measure that we will try to predict using recommender algorithms, and upon which recommendations will be based.
The left side of Figure 1 displays the distribution of the potential gain scores in the data. It is more common to score either full credit or no credit than it is to score partial credit on the exam items. There is a noticeable lack of scores in the range 0.1-0.2, and very few scores in the ranges 0.4–0.5 and 0.8–0.9. This is due to the possible scores than can be acquired on the items. There is no item in the data that would enable a student to receive 90% of the points, thus the range of 0.1–0.2 to gain is empty. A similar situation is true for the ranges 0.4–0.5 and 0.8–0.9. These can only be attained on an item with a maximum score of 5, and there is only one such item in the data.
Figure 1
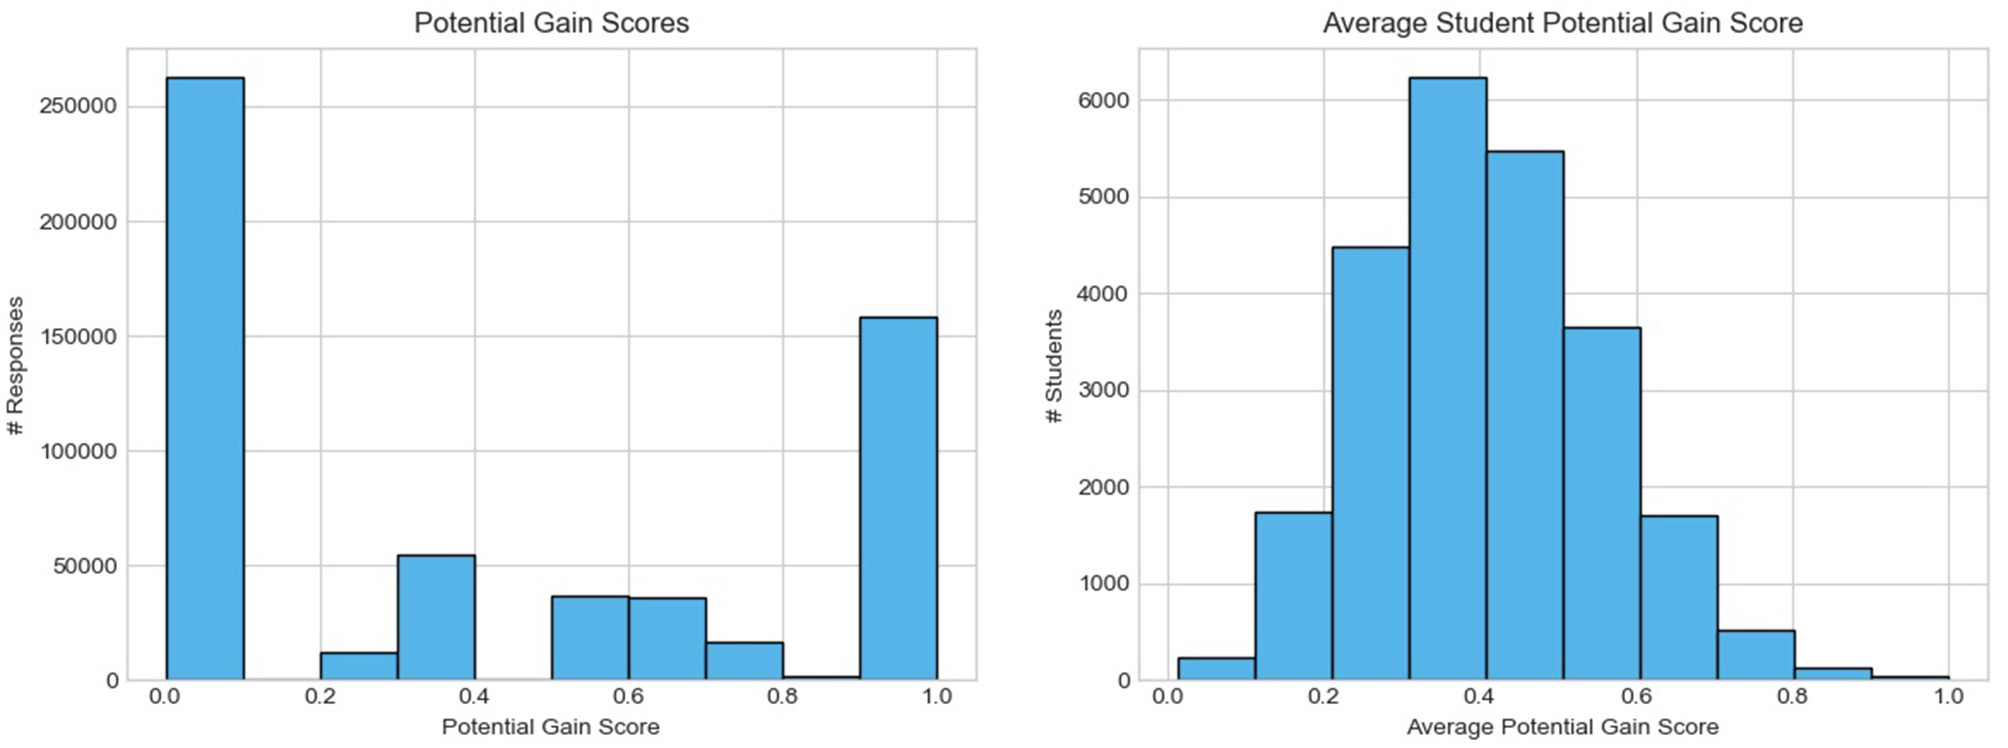
Distribution of potential gain scores in the data.
As illustrated in the right side of Figure 1, the average potential gain scores of the students is normally distributed with a mean of 0.41. It is more common for students to have a low average potential gain score, and there are very few students with an average potential gain score above 0.8. These observations make sense in the light of the context of final examinations: most students will get a decent average score and pass the exam (and therefore have a low average potential gain score).
2.2. Software
All analyses are performed in the programming language Python 3 (Van Rossum and Drake, 2009), using the Surprise library (Hug, 2020). Graphical representations of the data and the results are made using the R programming language (R Core Team, 2020). The scripts (written in the Python 3 language) that detail how the recommendations are produced and evaluated are included as Appendices.
2.3. Recommender Systems
Recommender systems can roughly be divided into content-based filtering methods, collaborative filtering (CF) methods, and hybrid approaches which combine both these designs (Melville and Sindhwani, 2017). CF methods use matrix factorization techniques to characterize users and content and make statements about which content and which users are similar (Koren et al., 2009). They can be further subdivided into neighborhood-based or memory-based and model-based approaches. In neighborhood-based techniques, a subset of users or items are chosen based on their similarity to the active user or item, and a weighted combination of their ratings is used to produce predictions for the active user's rating on the active item (e.g., Breese et al., 1998; Melville and Sindhwani, 2017). Model-based techniques provide recommendations by estimating parameters of statistical models for user ratings (e.g., Billsus and Pazzani, 1998; Koren et al., 2009). Content-based filtering methods (e.g., Lang, 1995; Balabanović and Shoham, 1997; Mooney and Roy, 2000) provide recommendations by comparing representations of content describing an item to representations of content that interests the user (e.g., Melville and Sindhwani, 2017).
In this study, we compare the performance of several types of such recommendation methods. The input for the recommender algorithms is the set of potential gain scores, accompanied by their student identifier and the label of the item. The output will be a set of recommended items for each student. Firstly, two baselines are included with which the performance of more advanced algorithms can be compared. The first baseline is an algorithm that predicts a random score for students on the items by drawing from a normal distribution. The mean and standard deviation for this distribution are estimated using the observations in the training data. The performance achieved by this baseline will be considered the absolute minimum that must be achieved by the other algorithms. The other baseline algorithm predicts scores by taking into account the overall average score, the average score on the item and the average score of the student. We include this baseline algorithm to be able to assess the added benefit of more complicated and more computationally heavy methods. For the score of student u on item i, the baseline estimate is:
Where μ is the overall average score, and the parameters bu and bi denote the deviations from μ of student u and item i, respectively. bu and bi are estimated by solving the least squares problem detailed by Koren (2010). We alternatingly use the following equations 10 times for all items and all students, using 0 as the starting value for both bu and bi.
Where rui is the score of student u on item i, and K is the set of student-item pairs for which the score is known. The regularization parameters λi and λu are used to avoid overfitting (Koren, 2010) and are set to 10 and 15, respectively.
Next, we include two neighborhood-based CF methods: user-based and item-based. When user-based CF (UBCF) predicts a score for a student on an item, it relies more heavily on information from students with a similar score pattern. Item-based CF (IBCF) is similar, but is based on the similarities between items, not between students. To compute the similarities between students or between items, we use the cosine similarity measure, which is the cosine of the angle between two vectors. Values range between −1 and 1, where −1 is perfectly dissimilar and 1 is perfectly similar.
For students u and u′, the cosine similarity is:
The UBCF algorithm will predict a score for a student on an item by taking the average of the scores that the 40 most similar students obtained on that item. The IBCF algorithm predicts the score by taking the average of the scores that the student in question received on the 10 items that are most similar to the item in question.
Neighborhood-based CF methods are simple and therefore transparent, and they are known to perform well (Desrosiers and Karypis, 2011). IBCF is much faster and more scalable than UBCF and can result in similar or better performance (Sarwar et al., 2001; Deshpande and Karypis, 2004). For both these methods, we apply a type of centering in which we reduce all scores by their baseline estimates. In a more commercial context, centering is applied, for instance, to correct for the general tendencies of users to give higher or lower scores. In this context we use centering to control for the students' general ability levels and the items' general difficulty levels. Using UBCF, the rating r^ for student u on item i is estimated as
where bui is the baseline estimate for student u on item i, and k is the number of similar students (v) taken into account (40). Using IBCF, the rating r^ for student u on item i is estimated as
where k is the number of similar items taken into account (10). For more detail, please refer to section 2.2 by Koren (2010).
Finally, we include the more complex Singular Value Decomposition (SVD) approximation method. SVD approximation is a model-based algorithm matrix factorization algorithm (Golub and Reinsch, 1971; Koren et al., 2009), built upon much older ideas (Eckart and Young, 1936). The idea behind such models is that attitudes or preferences of a user can be determined by a small number of hidden factors. To this end, it reduces the rating matrix into two smaller matrices through extracting a smaller number of features. SVD approximation is more scalable (as are other model-based approaches) (Sarwar et al., 2002; Cacheda et al., 2011) and therefore may perform better than UBCF, depending on the scale and sparsity of the data.
More details on this application of the SVD algorithm can be found in the Surprise library documentation (Hug, 2020), which builds upon work by Funk (2006), Koren et al. (2009), and Ricci et al. (2011).
2.4. Evaluation
For the evaluation of the recommender algorithms, we use k-fold cross validation. This means that the data is randomly split into k parts and in each run k−1 parts are used for training and the remaining part is used for testing. After all k runs, each part was used as the test set exactly once. We have chosen k = 3. This leaves us with an average number of 7.99 items in the test sets per student.
The training data is simply a random subset (66.6% percent) of the complete data. The rest of the data is used as test data. For each student, the information that is available about them in the training data is used for predicting their scores on items in the test set. The predicted score on an item determines whether the item is recommended to the student. It is by comparing observed scores in the test set with the predicted scores on those items that we can evaluate the recommender algorithm (Breese et al., 1998).
When testing the performance of an algorithm on the test set, we use the eight highest predicted potential gain scores for each student. This value is chosen so that we use as many items as we can while still ensuring that most students have enough observations available in the test set. For each user, we determine which observed scores (in the top eight items with the highest predicted scores in the test set) are above a specified threshold. These items are considered relevant to the student, and should be recommended by the algorithm. We also identify which predicted scores are above the threshold. These are items that the algorithm would recommended to the student. We vary the value of the threshold from 0 to 1 in increments of 0.01. A threshold of 0.50, for example, indicates that a good item is an item on which a student's predicted score is less than half of the maximum achievable score.
We make use of a confusion matrix that contains four important pieces of information: the number of recommendations that ought to have been recommended (true positives), the number of items that have correctly not been recommended (true negatives), the number of items that have been recommended that ought not to have been (false positives), and the number of items that have not been recommended but ought to have been (false negatives).
Several evaluation metrics can be derived from this confusion matrix. Precision tells us how often items recommended by the classifier are correct recommendations. This is the most important metric for our current context, as the idea is to help a student spend their time wisely and not lead them to spend time on learning materials that they have already mastered. Recall (also known as the true positive rate) informs us on the proportion of useful recommendations that have actually been recommended. High performance in terms of recall would be preferable, because we would be able to offer the students more recommendations, potentially uncovering more of the topics that a student has issues with. We consider recall to be less important than the correctness of the recommended items (precision).
The false positive rate (FPR) tells us how many of the items that should not be recommended (due to a low score) are recommended nonetheless. By combining the FPR with the recall (also known as the true positive rate, or TPR), receiver operating characteristic (ROC) curves can be made, which are used in many fields to assess the performance of a classifier.
The prevalence tells us the proportion of scores in the data above the predefined threshold. It depends on the chosen threshold and influences the number of items that can be recommended to students in practice. Figure 2 shows the prevalence belonging to different threshold values between 0 and 1 (in increments of 0.01). For example, 27% of the potential gain scores (158, 270 out of 579, 622 observations) exceed a threshold of 0.90.
Figure 2
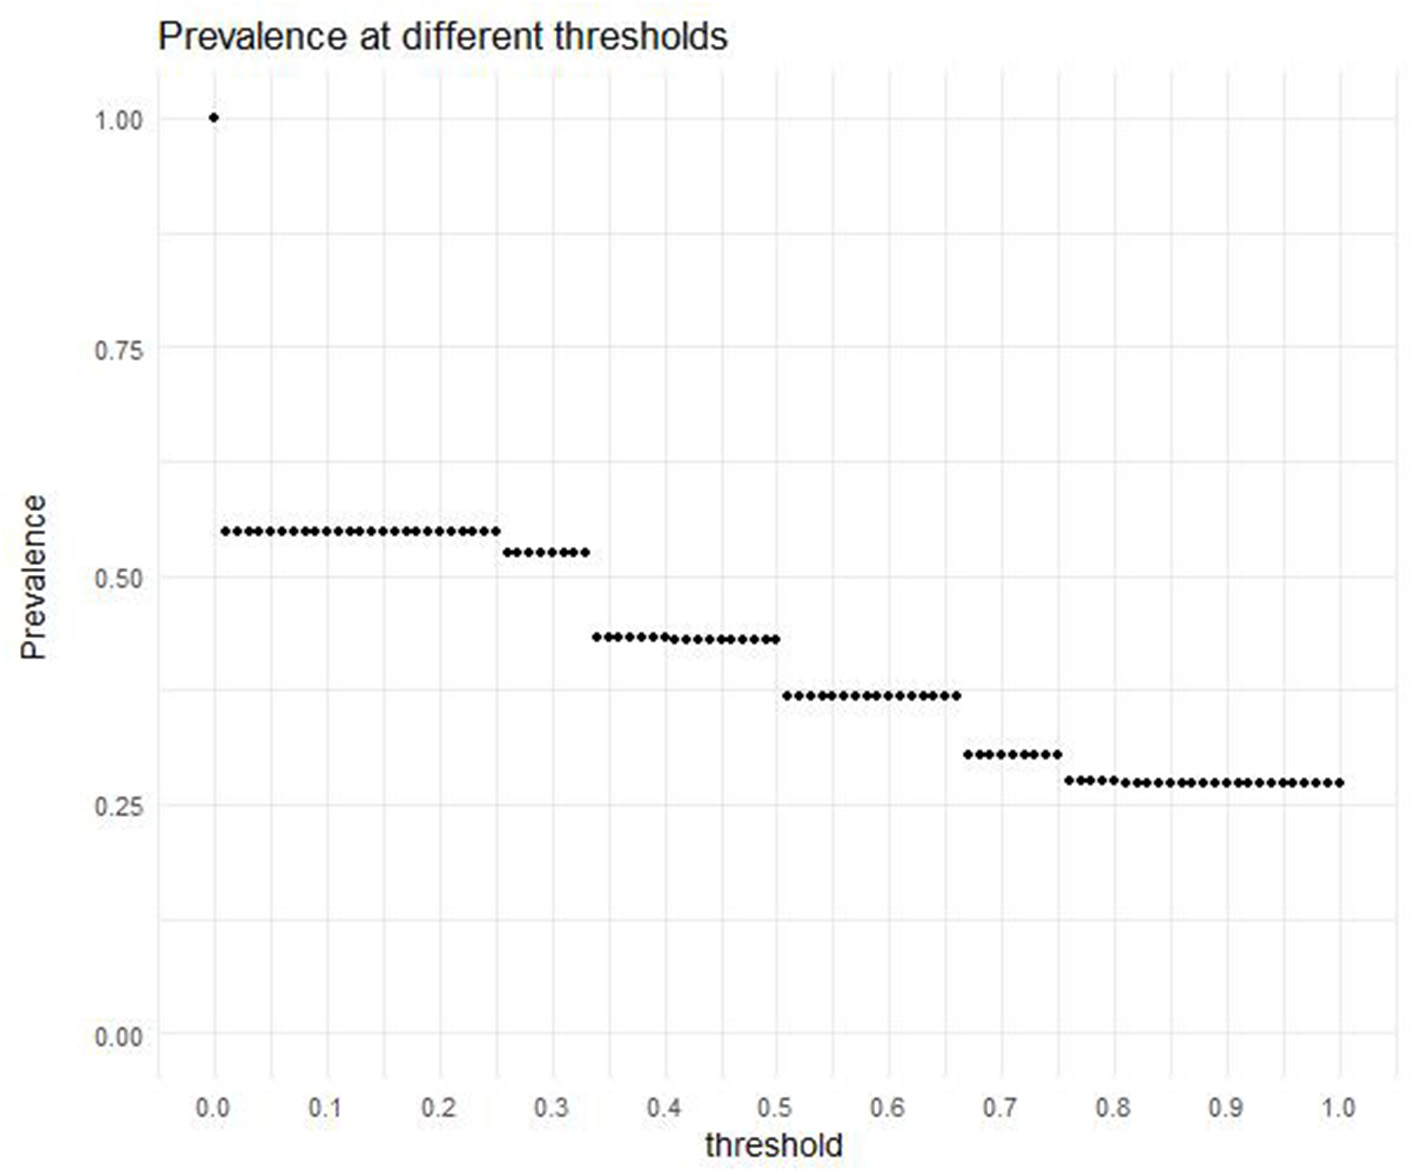
The prevalence, or the proportion of potential gain scores higher than or equal to the different threshold values.
3. Results
Three-fold cross-validation was applied to verify the comparability of the results for different segments of the data. There was no substantial difference between folds in terms of precision and recall. The largest difference between two folds in terms of precision was 0.0128, which occurred using the UBCF model with a threshold of 0.73. The largest difference in recall between two folds was 0.0153, using the UBCF model with a threshold of 0.68. These differences in precision and recall are negligible.
Figure 3 compares the average performance in terms of precision of the five different models, evaluated for threshold values ranging from 0 to 1 in increments of 0.01. Several things can be observed upon inspecting the graphs. Firstly, it should be noted that the performance of the models does not increase continuously with the thresholds, but instead acts in a stepwise fashion. This can be attributed to the stepwise nature of the proportion of potential gain scores equal to or higher than the threshold in the data (the prevalence, see Figure 2). This stepwise pattern can also be observed in the performance of the models in terms of all other evaluation metrics that are still to come. Next, it is clear that the random model has a lower precision for all threshold values, and that all other models follow a similar trend in precision. The differences between the four other models are rather small, though they increase slightly for higher threshold values. For threshold values lower than 0.62, IBCF performs the best, whereas for threshold values from 0.62 up to and including 0.73, SVD approximation outperforms the other models. For threshold values higher than or equal to 0.72 the baseline model has the highest precision.
Figure 3
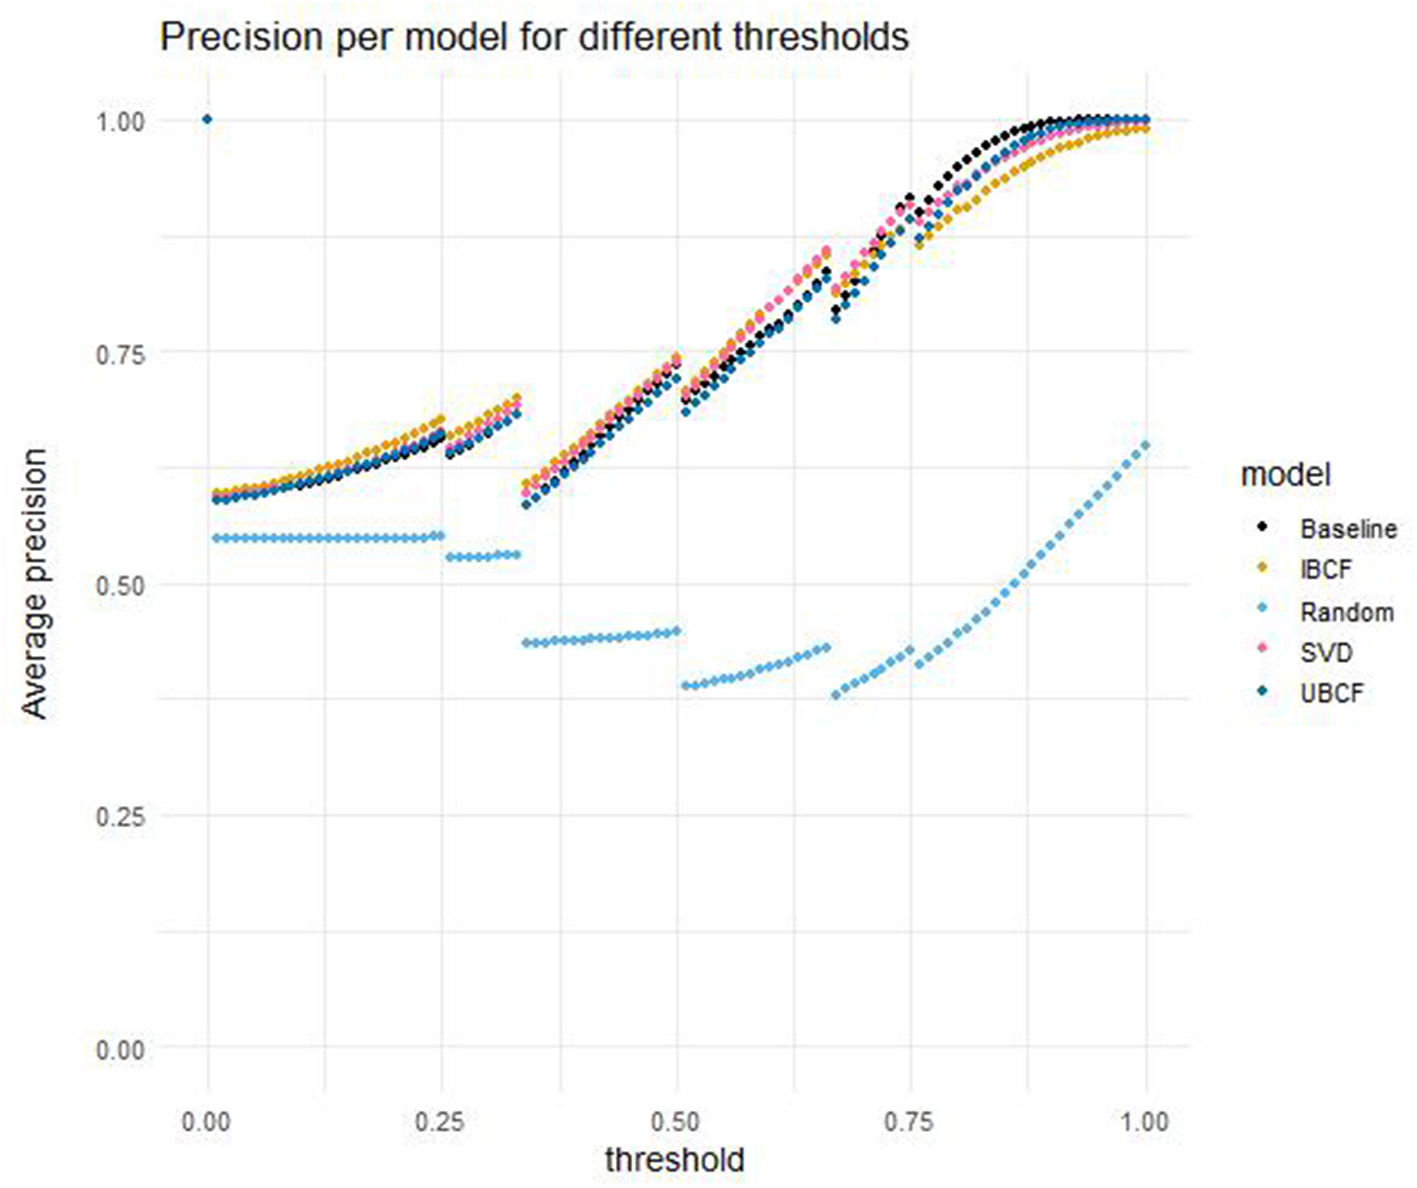
Precision per model for different thresholds, averaged over students and cross-validation folds.
Figure 4 compares the average recall for the five different models, evaluated for the different threshold values. In general, a higher threshold leads to lower performance in terms of recall for all models. The random model outperforms the other models when the threshold exceeds 0.72. Similarly to their performance in terms of precision, the performance in terms of recall for the four other models is very similar for most threshold values. It differs more for threshold values at both ends of the scale. For threshold values equal to or below 0.39, the baseline model has the best performance in terms of recall. For threshold values between 0.40 and 0.71, UBCF usually outperforms the other models, although the differences are very small.
Figure 4
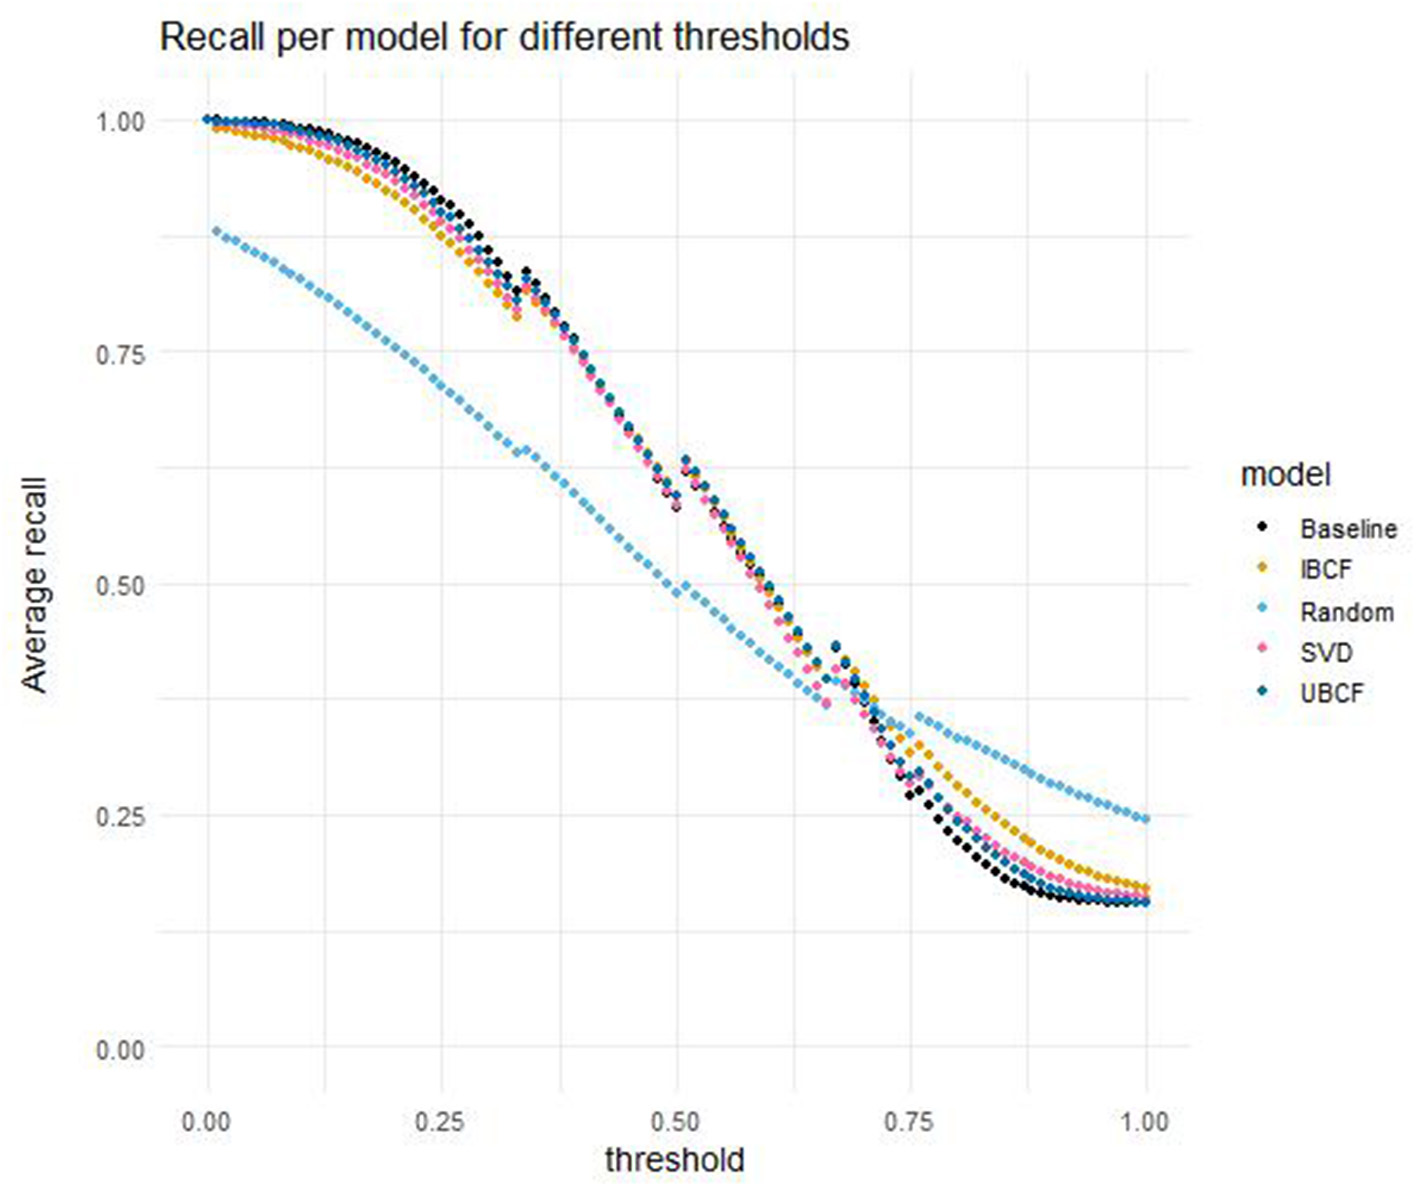
Recall per model for different thresholds, averaged over students and cross-validation folds.
The ROC curves for the five models are displayed in Figure 5. ROC curves evaluate the false positive rate and the true positive rate (or recall) for different threshold values. A larger area under the curve (AUC) indicates better classification performance, where 1 is the best possible AUC value and 0 the worst. A random model is expected to have an AUC of 0.5, which means that it is not able to distinguish classes from each other. The random model included in this study has an AUC of 0.530. The four other models' AUCs differ only marginally: the baseline model performs best with an AUC of 0.762, after which comes UBCF (AUC = 0.758), SVD approximation (AUC = 0.747), and finally IBCF (AUC = 0.741).
Figure 5
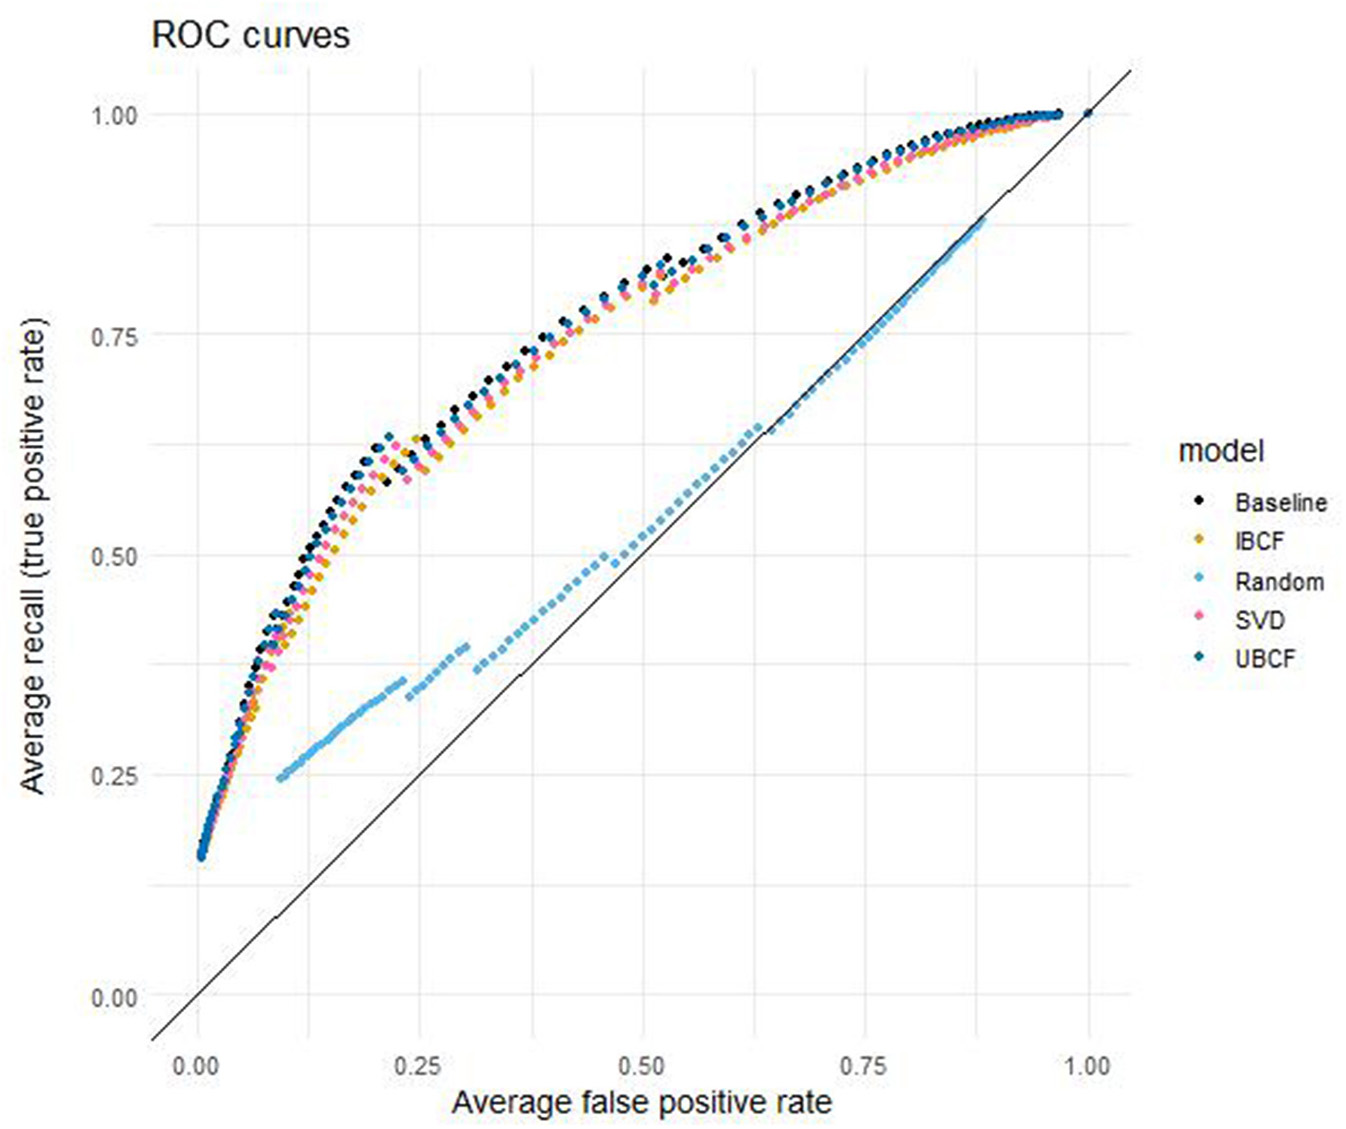
False positive rate vs. recall (ROC curve) per model for different thresholds, averaged over students and cross-validation folds.
Although the average number of recommended items is not necessarily used for evaluating the models, it is nevertheless informative for assessing their practical purpose. Therefore, Figure 6 displays the average number of items recommended to students in the test sets. The maximum possible number of recommended items is 8, because the models were evaluated for the top 8 items with the highest predicted scores in the test set. In Figure 6, it can be seen that higher threshold values lead to a lower number of recommended items (on average). This is to be expected, because a higher threshold means a lower prevalence, and therefore a smaller number of items that qualify to be recommended to students. The random model recommends more items to students (on average) when the threshold is more than or equal to 0.37. The other four models are fairly similar, although they differ a little bit more on each end of the threshold scale. For low thresholds ( ≤ 0.36), the baseline model recommends the most items, whereas for high thresholds (≥0.40), the IBCF model recommends the most.
Figure 6
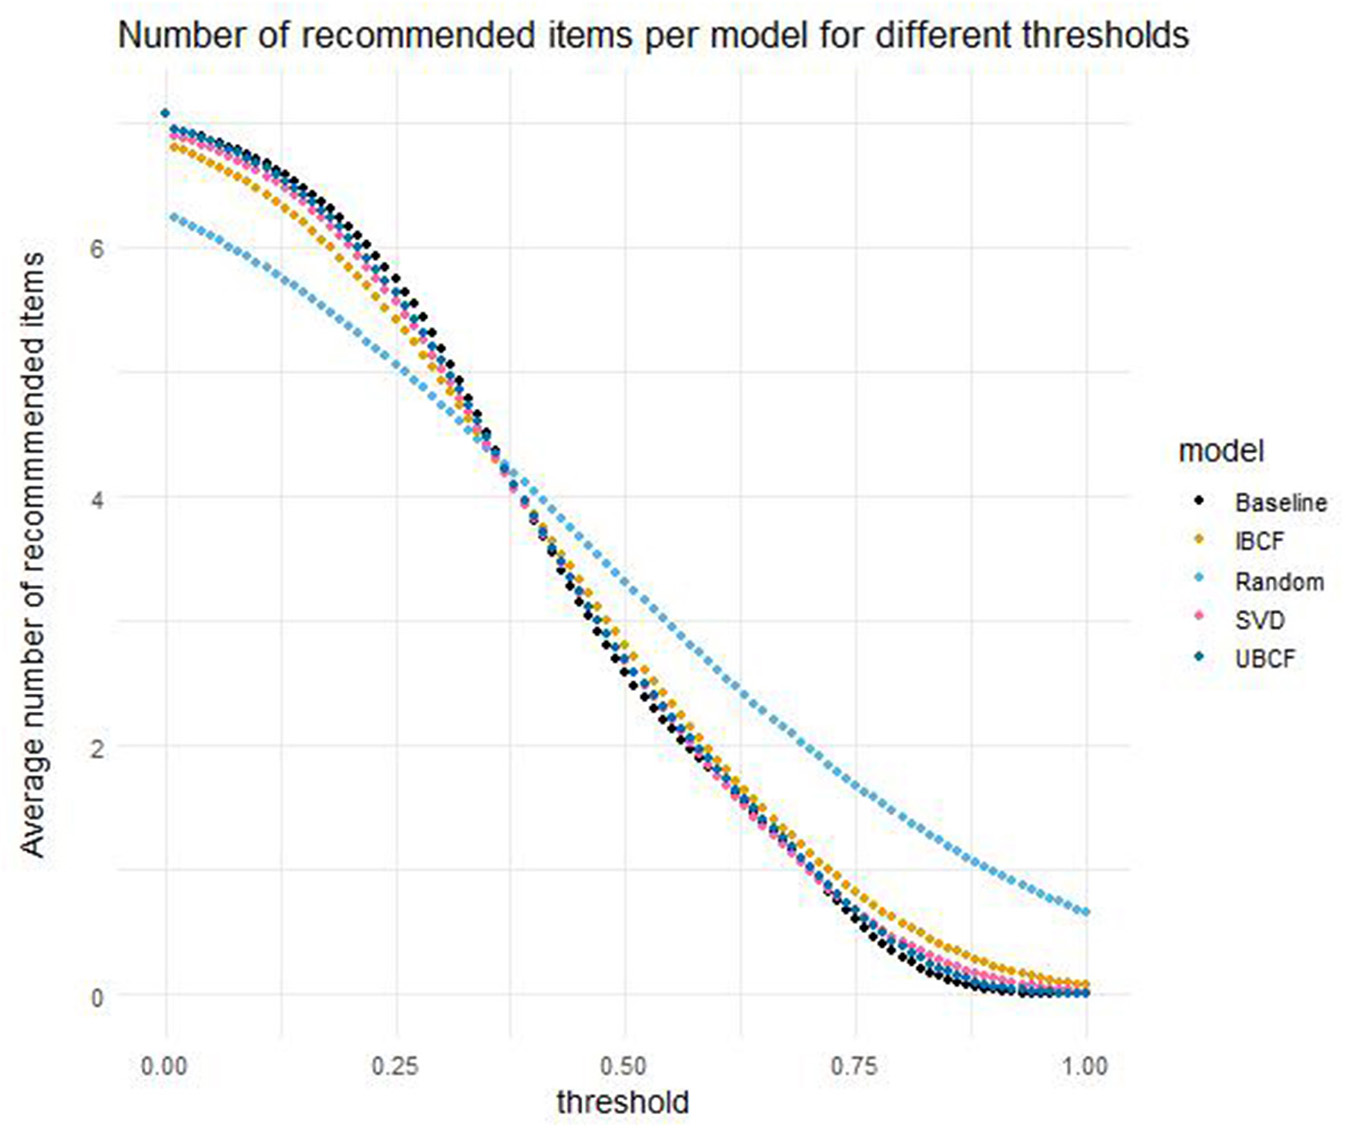
Number of recommended items per model and threshold, averaged over students and cross-validation folds.
4. Conclusion
In this study, we recommended sets of items to students using several commonly used recommender system algorithms. Findings indicate that there are no substantial differences between the tested models, except for the random model which was used as a baseline and generally performs a lot worse. A surprising result is that the other baseline model, which predicts scores by taking into account the global, student-specific, and item-specific averages, performs similarly to the more complex models that were included. This suggests that (a) the relationships between items and those between users do not add valuable information toward predicting scores that is not already captured in aforementioned baseline and (b) that the prediction is not substantially improved by using matrix factorization techniques. Given similar performance, a simpler model is preferable for reasons of transparency (it is easier to explain to the target audience) and computational cost. The benefit of a lower computational cost is especially pronounced when comparing the baseline model to user-based collaborative filtering: the computational complexity of the user-user similarity matrix increases near quadratically with the number of users.
A second conclusion that can be drawn is that a trade-off has to be made between performance in terms of precision and performance in terms of recall, when choosing a threshold for what constitutes a good potential gain score. In this particular context precision is of higher importance and thus an acceptable level of precision will be considered as a primary prerequisite condition. As the precision increased along with an increase in threshold, we would for this reason not prefer the lower thresholds that were included in the study. Besides the fact that lower thresholds result in lower precision, choosing a low threshold also means that a student may be recommended more items that are already well within their capabilities. This renders the recommendations of less practical use to the students.
Choosing a high threshold leads to a lower model performance in terms of recall. When the threshold exceeds 0.72, the four more informed models even perform worse in terms of recall than the random model. This is undesirable. Using a high threshold also introduces a more practical problem: the prevalence of items above the threshold decreases substantially. A reduced performance in terms of recall adds to this issue. For example: the prevalence of observations above a threshold of 0.90 is 0.27, and the recall for the baseline model is 0.16. This means that of the 27% of items that can (on average) be recommended to students, only 16% is recovered by the model. This decreases the amount of useful recommendations per student substantially. In situations where more material is available, prevalence becomes less important because there is still enough to recommend, but performance in terms of recall remains important because it impacts the coverage of the feedback over the content domain.
All in all, it seems reasonable to choose a threshold somewhere in the middle of the scale. Intuitively, a threshold of 0.5 makes sense: an item would be recommended to the student when the student is expected to score fewer than half of the points on the item (missing more than half of the possible points). The average precision in the test sets for the baseline model is 0.73, and the average recall 0.58. A reason for using a threshold of 0.50 as opposed to a threshold of 0.51 is a 6% drop in prevalence, which has an influence on the number of items that are relevant to recommend. In practice, the number of items that are available to recommend can also be informative for choosing a threshold.
5. Discussion
The aim of the present study was to explore the use of recommender systems as a means of providing automated and personalized feedback to students based on their scores in a summative assessment, in the form of a set of test items that a student could benefit from practicing with. The results showed that in the context of the final examinations in Dutch secondary education, item recommendations can be made to students with an acceptable level of performance in terms of precision and recall. Furthermore, it does not take a complicated model to provide useful recommendations: a simple baseline model which takes into account global, student-specific and item-specific averages obtained similar performance to the more complex models (IBCF, UBCF, and SVD approximation).
Recommended practice questions can be beneficial for students as they can support their learning process by targeting specific gaps in their knowledge, especially when there is little time to get feedback from instructors. More generally, recommender systems may be useful in any educational context where (1) direct teacher intervention is infeasible (e.g., due to scale or time constraints), (2) appropriate input data is available, and (3) it is plausible that the recommendation of practice material is useful to the student. They can be a powerful tool in guiding students in the direction of better understanding without putting additional strain on their teachers, by making use of data that is already available.
This study has taken a first step toward practical implementation by assessing the theoretical feasibility of applying recommender systems in a summative assessment context. An important step to take before implementation is to perform a validation study, in which the impact of recommending practice items on learning outcomes (e.g., increase in score during a resit exam, learning satisfaction, amount of studying) is assessed. Ghauth and Abdullah (2010) performed such a practical validation, by testing experimentally whether learning gain had improved more for the group that received recommendations. Theoretical evaluation can give us information about the quality of the predictions (an important condition), but it cannot give us information about the (perceived) usefulness of the provided feedback to the target group.
When preparing to use a recommender system in practice, one should evaluate the model performance in terms of evaluation metrics that are important for the specific context. Naturally, the level of performance on those metrics that is acceptable for practical use is debatable. Certainly, we would not wish for students to spend valuable time studying topics that they have already mastered. At the same time it is true that in summative assessment, the students often do not get any systematic feedback at all. To many students, especially to those that do not know where to begin, feedback may be helpful even if it is not perfect. In the context of preparing for a resit for secondary education final examinations, we expect students would be helped with any reliable personalized feedback, especially considering that the time pressure makes it difficult for their instructors to offer feedback on the performance of the student on their first exam.
A key aspect of recommender system algorithms is the measure that is optimized in order to provide recommendations. In this study, the measure that was optimized was the potential gain score, which is the estimated proportion of the maximum obtainable score the student is expected not to obtain. In other words: the items that are recommended to the students are the ones that are expected to be the most difficult for them. In this particular context, the students need to master all of the material, as they will be faced with a high-stakes summative assessment. Therefore, it is appropriate that they should practice the things they are not yet adapt with, regardless of the difficulty of those items. In other situations, being faced with the items that are predicted to be the most challenging for them may be an unnecessarily demotivating experience for students. The choice to optimize for different measures may lead to many other interesting applications of recommender systems in an educational context. Other potentially rich directions for future studies and applications include using meta-data of the learning materials in hybrid recommender algorithms, and including student non-response in the input data as potentially relevant information by using e.g., the SVD++ algorithm (Koren, 2008).
In this study, the performance of several recommender algorithms for recommending practice test questions to students was assessed. The results suggest that recommender systems can provide useful feedback to students, especially in contexts where teacher intervention is infeasible (i.e., due to time constraints). Many other directions for future research and applications are possible concerning the use of recommender systems in an educational context. Overall, we conclude that recommender systems are a promising tool for helping students in their learning process by combining multiple data sources and new methodologies.
Statements
Data availability statement
The data analyzed in this study is subject to the following licenses/restrictions: The data concerns National central examinations data that cannot be shared. The scripts used for the analysis can be shared upon request. Requests to access these scripts should be directed to: Eva de Schipper, eva.deschipper@cito.nl.
Author contributions
ES has first authorship on the submitted manuscript. RF and JK have equal contribution to the manuscript, and share last authorship. All authors contributed to the article and approved the submitted version.
Conflict of interest
The authors declare that the research was conducted in the absence of any commercial or financial relationships that could be construed as a potential conflict of interest.
Supplementary material
The Supplementary Material for this article can be found online at: https://www.frontiersin.org/articles/10.3389/feduc.2021.652070/full#supplementary-material
References
1
AdesopeO. O.TrevisanD. A.SundararajanN. (2017). Rethinking the use of tests: a meta-analysis of practice testing. Rev. Educ. Res. 87, 659–701. 10.3102/0034654316689306
2
AherS. B.LoboL. (2013). Combination of machine learning algorithms for recommendation of courses in e-learning system based on historical data. Knowl. Based Syst. 51, 1–14. 10.1016/j.knosys.2013.04.015
3
BalabanovićM.ShohamY. (1997). Fab: content-based, collaborative recommendation. Commun. ACM40, 66–72. 10.1145/245108.245124
4
BillsusD.PazzaniM. J. (1998). “Learning collaborative information filters,” in ICML, Vol. 98 (Palo Alto, CA: AAAI), 46–54.
5
BlackP.WiliamD. (2009). Developing the theory of formative assessment. Educ. Assess. Eval. Account. 21:5. 10.1007/s11092-008-9068-5
6
BobadillaJ.SerradillaF.HernandoA.LensM. (2009). Collaborative filtering adapted to recommender systems of e-learning. Knowl. Based Syst. 22, 261–265. 10.1016/j.knosys.2009.01.008
7
BokdeD. K.GiraseS.MukhopadhyayD. (2015). “An approach to a university recommendation by multi-criteria collaborative filtering and dimensionality reduction techniques,” in 2015 IEEE International Symposium on Nanoelectronic and Information Systems (Indore), 231–236. 10.1109/iNIS.2015.36
8
BreeseJ. S.HeckermanD.KadieC. (1998). “Empirical analysis of predictive algorithms for collaborative filtering,” in Proceedings of the Fourteenth Conference on Uncertainty in Artificial Intelligence (New York, NY: Morgan Kaufmann Publishers Inc.; ACM), 43–52.
9
BulutO.CormierD. C.ShinJ. (2020). An intelligent recommender system for personalized test administration scheduling with computerized formative assessments. Front. Educ. 5:182. 10.3389/feduc.2020.572612
10
CachedaF.CarneiroV.FernándezD.FormosoV. (2011). Comparison of collaborative filtering algorithms: limitations of current techniques and proposals for scalable, high-performance recommender systems. ACM Trans. Web5, 1–33. 10.1145/1921591.1921593
11
CallenderA. A.McDanielM. A. (2009). The limited benefits of rereading educational texts. Contemp. Educ. Psychol. 34, 30–41. 10.1016/j.cedpsych.2008.07.001
12
DeshpandeM.KarypisG. (2004). Item-based top-n recommendation algorithms. ACM Trans. Inform. Syst. 22, 143–177. 10.1145/963770.963776
13
DesrosiersC.KarypisG. (2011). “A comprehensive survey of neighborhood-based recommendation methods,” in Recommender Systems Handbook, eds F. Ricci, L. Rokach, B. Shapira, and P. Kantor (Boston, MA: Springer), 107–144. 10.1007/978-0-387-85820-3_4
14
DixsonD. D.WorrellF. C. (2016). Formative and summative assessment in the classroom. Theory Pract. 55, 153–159. 10.1080/00405841.2016.1148989
15
DunloskyJ.LipkoA. R. (2007). Metacomprehension: a brief history and how to improve its accuracy. Curr. Direct. Psychol. Sci. 16, 228–232. 10.1111/j.1467-8721.2007.00509.x
16
EckartC.YoungG. (1936). The approximation of one matrix by another of lower rank. Psychometrika1, 211–218. 10.1007/BF02288367
17
EmbretsonS. E.ReiseS. P. (2013). Item Response Theory. New York, NY: Psychology Press. 10.4324/9781410605269
18
FunkS. (2006). Netflix Update: Try This at Home. Retrieved from: https://sifter.org/~simon/journal/20061211.html
19
GhauthK. I.AbdullahN. A. (2010). Learning materials recommendation using good learners' ratings and content-based filtering. Educ. Technol. Res. Dev. 58, 711–727. 10.1007/s11423-010-9155-4
20
GolubG. H.ReinschC. (1971). “Singular value decomposition and least squares solutions,” in Linear Algebra (Handbook for Automatic Computation, Vol. 2, ed F. L. Bauer (Berlin; Heidelberg: Springer), 134–151. 10.1007/978-3-662-39778-7_10
21
HambletonR. K.SwaminathanH.RogersH. J. (1991). Fundamentals of Item Response Theory. Thousand Oaks, CA: Sage.
22
HattieJ.TimperleyH. (2007). The power of feedback. Rev. Educ. Res. 77, 81–112. 10.3102/003465430298487
23
HeritageM. (2007). Formative assessment: what do teachers need to know and do?Phi Delta Kappan89, 140–145. 10.1177/003172170708900210
24
HugN. (2020). Surprise: a python library for recommender systems. J. Open Source Softw. 5:2174. 10.21105/joss.02174
25
KarpickeJ. D.ButlerA. C.Roediger IIIH. L. (2009). Metacognitive strategies in student learning: do students practise retrieval when they study on their own?Memory17, 471–479. 10.1080/09658210802647009
26
KhribiM. K.JemniM.NasraouiO. (2008). “Automatic recommendations for e-learning personalization based on web usage mining techniques and information retrieval,” in 2008 Eighth IEEE International Conference on Advanced Learning Technologies (Santander), 241–245. 10.1109/ICALT.2008.198
27
KlugerA. N.DeNisiA. (1996). The effects of feedback interventions on performance: a historical review, a meta-analysis, and a preliminary feedback intervention theory. Psychol. Bull. 119:254. 10.1037/0033-2909.119.2.254
28
KorenY. (2008). “Factorization meets the neighborhood: a multifaceted collaborative filtering model,” in Proceedings of the 14th ACM SIGKDD International Conference on Knowledge Discovery and Data Mining (Las Vegas, NV), 426–434. 10.1145/1401890.1401944
29
KorenY. (2010). Factor in the neighbors: Scalable and accurate collaborative filtering. ACM Trans. Knowl. Discov. Data4, 1–24. 10.1145/1644873.1644874
30
KorenY.BellR.VolinskyC. (2009). Matrix factorization techniques for recommender systems. Computer42, 30–37. 10.1109/MC.2009.263
31
LangK. (1995). “Newsweeder: learning to filter netnews,” in Machine Learning Proceedings 1995 (Cambridge, MA: Elsevier), 331–339. 10.1016/B978-1-55860-377-6.50048-7
32
LiangG.WeiningK.JunzhouL. (2006). “Courseware recommendation in e-learning system,” in International Conference on Web-based Learning (Berlin; Heidelberg: Springer), 10–24. 10.1007/11925293_2
33
LuoJ.DongF.CaoJ.SongA. (2010). A context-aware personalized resource recommendation for pervasive learning. Cluster Comput. 13, 213–239. 10.1007/s10586-009-0113-z
34
ManouselisN.DrachslerH.VuorikariR.HummelH.KoperR. (2011). “Recommender systems in technology enhanced learning,” in Recommender Systems Handbook, eds F. Ricci, L. Rokach, B. Shapira, and P. B. Kantor (Boston, MA: Springer), 387–415. 10.1007/978-0-387-85820-3_12
35
MelvilleP.SindhwaniV. (2017). “Recommender systems,” in Encyclopedia of Machine Learning and Data Mining, eds C. Sammut, and G. I. Webb (Boston, MA: Springer), 1056–1066. 10.1007/978-1-4899-7687-1_964
36
MooneyR. J.RoyL. (2000). “Content-based book recommending using learning for text categorization,” in Proceedings of the Fifth ACM Conference on Digital Libraries (New York, NY: ACM), 195–204. 10.1145/336597.336662
37
O'MahonyM. P.SmythB. (2007). “A recommender system for on-line course enrolment: an initial study,” in Proceedings of the 2007 ACM Conference on Recommender Systems (Minneapolis, MN), 133–136. 10.1145/1297231.1297254
38
R Core Team (2020). R: A Language and Environment for Statistical Computing. Vienna: R Foundation for Statistical Computing.
39
RicciF.RokachL.ShapiraB. (2011). “Introduction to recommender systems handbook,” in Recommender Systems Handbook, eds F. Ricci, L. Rokach, B. Shapira, and P. B. Kantor (Boston, MA: Springer), 1–35. 10.1007/978-0-387-85820-3_1
40
RicciF.RokachL.ShapiraB. editors (2015). Recommender Systems Handbook, 2nd Edn. Springer. 10.1007/978-1-4899-7637-6
41
RiveraA. C.Tapia-LeonM.Lujan-MoraS. (2018). “Recommendation systems in education: a systematic mapping study,” in International Conference on Information Theoretic Security (New York, NY: Springer Publishing Company), 937–947. 10.1007/978-3-319-73450-7_89
42
RoedigerH. L.IIIKarpickeJ. D. (2006). Test-enhanced learning: taking memory tests improves long-term retention. Psychol. Sci. 17, 249–255. 10.1111/j.1467-9280.2006.01693.x
43
SarwarB.KarypisG.KonstanJ.RiedlJ. (2002). “Incremental singular value decomposition algorithms for highly scalable recommender systems,” in Fifth International Conference on Computer and Information Science, Vol. 1 (Shenyang: Citeseer). Available online at: http://files.grouplens.org/papers/sarwar_SVD.pdf
44
SarwarB. M.KarypisG.KonstanJ. A.RiedlJ. (2001). “Item-based collaborative filtering recommendation algorithms,” in WWW '01: Proceedings of the 10th International Conference on World Wide Web (Hong Kong), 285–295. 10.1145/371920.372071
45
ShuteV. J. (2008). Focus on formative feedback. Rev. Educ. Res. 78, 153–189. 10.3102/0034654307313795
46
TangT.McCallaG. (2005). Smart recommendation for an evolving e-learning system: architecture and experiment. Int. J. E-Learn. 4, 105–129. Retrieved from: https://www.learntechlib.org/j/IJEL/
47
Thai-NgheN.DrumondL.Krohn-GrimbergheA.Schmidt-ThiemeL. (2010). Recommender system for predicting student performance. Proc. Comput. Sci. 1, 2811–2819. 10.1016/j.procs.2010.08.006
48
Van der LindenW. J.GlasC. A. (2000). Computerized Adaptive Testing: Theory and Practice. Dordrecht: Springer. 10.1007/0-306-47531-6
49
Van RossumG.DrakeF. L. (2009). Python 3 Reference Manual. Scotts Valley, CA: CreateSpace.
50
VialardiC.BravoJ.ShaftiL.OrtigosaA. (2009). “Recommendation in higher education using data mining techniques,” in International Working Group on Educational Data Mining (Córdoba).
51
ZaíaneO. R. (2002). “Building a recommender agent for e-learning systems,” in International Conference on Computers in Education, 2002 (New York, NY: IEEE), 55–59.
Summary
Keywords
educational assessment, summative assessment, feedback, recommender systems, collaborative filtering
Citation
de Schipper E, Feskens R and Keuning J (2021) Personalized and Automated Feedback in Summative Assessment Using Recommender Systems. Front. Educ. 6:652070. doi: 10.3389/feduc.2021.652070
Received
11 January 2021
Accepted
26 February 2021
Published
22 March 2021
Volume
6 - 2021
Edited by
Okan Bulut, University of Alberta, Canada
Reviewed by
Jinnie Shin, University of Florida, United States; Ren Liu, University of California, Merced, United States
Updates
Copyright
© 2021 de Schipper, Feskens and Keuning.
This is an open-access article distributed under the terms of the Creative Commons Attribution License (CC BY). The use, distribution or reproduction in other forums is permitted, provided the original author(s) and the copyright owner(s) are credited and that the original publication in this journal is cited, in accordance with accepted academic practice. No use, distribution or reproduction is permitted which does not comply with these terms.
*Correspondence: Eva de Schipper eva.deschipper@cito.nl
This article was submitted to Assessment, Testing and Applied Measurement, a section of the journal Frontiers in Education
†These authors have contributed equally to this work
Disclaimer
All claims expressed in this article are solely those of the authors and do not necessarily represent those of their affiliated organizations, or those of the publisher, the editors and the reviewers. Any product that may be evaluated in this article or claim that may be made by its manufacturer is not guaranteed or endorsed by the publisher.