 Stephan E. Vogel
 Thomas J. Faulkenberry
 Roland H. Grabner
- 1Educational Neuroscience, Institute of Psychology, University of Graz, Graz, Austria
- 2Department of Psychological Sciences, Tarleton State University, Stephenville, TX, United States
Understanding the relationship between symbolic numerical abilities and individual differences in mathematical competencies has become a central research endeavor in the last years. Evidence on this foundational relationship is often based on two behavioral signatures of numerical magnitude and numerical order processing: the canonical and the reverse distance effect. The former indicates faster reaction times for the comparison of numerals that are far in distance (e.g., 2 8) compared to numerals that are close in distance (e.g., 2 3). The latter indicates faster reaction times for the ordinal judgment of numerals (i.e., are numerals in ascending/descending order) that are close in distance (e.g., 2 3 4) compared to numerals that are far in distance (e.g., 2 4 6). While a substantial body of literature has reported consistent associations between the canonical distance effect and arithmetic abilities, rather inconsistent findings have been found for the reverse distance effect. Here, we tested the hypothesis that estimates of the reverse distance effect show qualitative differences (i.e., not all participants show a reverse distance effect in the expected direction) rather than quantitative differences (i.e., all individuals show a reverse distance effect, but to a different degree), and that inconsistent findings might be a consequence of this variation. We analyzed data from 397 adults who performed a computerized numerical comparison task, a computerized numerical order verification task (i.e., are three numerals presented in order or not), a paper pencil test of arithmetic fluency, as well as a standardized test to assess more complex forms of mathematical competencies. We found discriminatory evidence for the two distance effects. While estimates of the canonical distance effect showed quantitative differences, estimates of the reverse distance effect showed qualitative differences. Comparisons between individuals who demonstrated an effect and individuals who demonstrated no reverse distance effect confirmed a significant moderation on the correlation with mathematical abilities. Significantly larger effects were found in the group who showed an effect. These findings confirm that estimates of the reverse distance effect are subject to qualitative differences and that we need to better characterize the underlying mechanisms/strategies that might lead to these qualitative differences.
Introduction
In the past years, there has been an increase in interest to better understand the cognitive foundation of symbolic numerical abilities and its relationship to arithmetic and mathematical competencies. This upsurge has emerged from the observation that arithmetic abilities are equally important for life success as literacy (Parsons and Bynner, 2005) and that deficits in this domain can have detrimental effects on individuals wellbeing as well as on nation’s economy (Gross et al., 2009). Results of this research have provided evidence that measures of two symbolic concepts are associated with arithmetic abilities: numerical magnitude (i.e., knowledge about which numeral is larger or smaller) and numerical order (i.e., knowledge about the relative rank or position of a numeral with a sequence).
The existing evidence on the relationship of these basic numerical abilities with arithmetic abilities is largely based on two behavioral signatures: The canonical distance effect and the reverse distance effect. The canonical distance effect emerges when participants decide as fast as possible, without making mistakes, which of two numerals is larger/smaller (e.g., 2 6). Reaction time measures of this comparison task have been shown to be inversely related to the numerical distance of the numerals (Moyer and Landauer, 1967). In other words, participants are faster when the distance between the numerals is larger (e.g., 8 2) compared to when it is smaller (e.g., 2 3). The canonical distance effect is a well replicated finding (e.g., De Smedt et al., 2009; Holloway and Ansari, 2009; Lonnemann et al., 2011; Sasanguie et al., 2012; Vogel et al., 2015; Goffin and Ansari, 2016) and, although still debated, it is assumed to reflect the internal representation of numerical quantities (Moyer and Landauer, 1967; for alternative explanations see; Van Opstal et al., 2008; Zorzi and Butterworth, 1999).
Individual differences of the canonical distance effect show a consistent negative correlation with arithmetic performance (i.e., the smaller the canonical distance effect, the better arithmetic performance) in children (e.g., De Smedt et al., 2009; Holloway and Ansari, 2009; Lonnemann et al., 2011; Sasanguie et al., 2012; Vogel et al., 2015) as well as in adults (e.g., Goffin and Ansari, 2016; Maloney et al., 2010). In other words, individuals who perform better in arithmetic demonstrate a smaller canonical distance effect compared to individuals who perform worse, possibly due to a more precise representation of symbolic numerical quantities (Holloway and Ansari, 2009). Significant differences in the size of the canonical distance effect have also been reported for individuals with learning difficulties (i.e., developmental dyscalculia; e.g., Ashkenazi et al., 2008; Delazer et al., 2006; Price et al., 2007; Rousselle and Noël, 2007). Together, these findings indicate a significant correlative association with arithmetic and mathematical abilities, which a meta-analysis quantified with a small effect size of r = 0.1351 (Schneider et al., 2017; for a review see; De Smedt et al., 2013).
The reverse distance effect relates to the numerical order verification task (Franklin et al., 2009; Lyons and Beilock, 2011). In this task participants verify as fast as possible, without making mistakes, whether the order of three numerals is correct (e.g., 2 3 4) or incorrect (e.g., 3 4 2). Several studies have shown that ordinal judgment tends to be faster for adjacent numbers (e.g., 2 3 4) compared to distant numbers (e.g., 2 4 6) in the correct order condition (i.e., numbers that are in correct ascending or descending order). Because of its opposite direction, i.e., faster reaction times for small distances, the effect has been labeled as the reversal of the canonical distance effect (Turconi et al., 2006; Franklin et al., 2009; Lyons and Beilock, 2011; Lyons and Beilock, 2013). Several studies have confirmed the existence of a reverse distance effect in children (Lyons and Ansari, 2015; Vogel et al., 2015) as well as in adults (Franklin et al., 2009; Lyons and Beilock, 2011; Lyons and Beilock, 2013; Vogel et al., 2017; Vogel et al., 2019; Vos et al., 2017; Sella et al., 2020). And although the nature of the reverse distance effect is not well understood, some research indicates that it is associated with an effective retrieval mechanism of learned ordinal sequences from long-term memory (Lyons et al., 2016; Sasanguie and Vos, 2018; Vogel et al., 2019; Sella et al., 2020; Sommerauer et al., 2020). While items with larger distances might be solved via a sequential and procedural comparison process (e.g., 2 4 6 = 2 > 4 and 4 > 6), small distances (especially consecutive items) might be retrieved as sequence-lists (e.g., chunks, Dehaene et al., 2015) from long-term memory.
In contrast to the canonical distance effect, inconsistent findings have been reported in the few studies that have investigated the correlative association between the reverse distance effect and arithmetic abilities. Some studies have found a negative (i.e., the smaller the reverse distance effect, the better arithmetic performance; Goffin and Ansari, 2016), while other studies have found a positive (i.e., the larger the reverse distance effect, the better arithmetic performance; Vogel et al., 2019) or no relationship at all (Orrantia et al., 2019; Vogel et al., 2015; Vogel et al., 2017; Vos et al., 2017). These findings are in contrast to the consistently positive correlations reported for the canonical distance effect.
One possible explanation for the inconsistent findings is that the reverse distance effect is not a quantitative (i.e., all individuals show a reverse distance effect, but to a different degree), but rather a qualitative measure of individual differences (i.e., not all participants show a reverse distance effect in the expected direction; see also Faulkenberry and Bowman, 2020; Haaf and Rouder, 2019). More specifically, the involvement of two (or even more) strategies in the numerical order verification task could introduce combinatorial variations that lead to qualitative differences in how the task is performed. As discussed above, the processing of ordinal information has been associated with at least two different strategies: an effective retrieval of learned and automatized sequences (mainly used with small distances; e.g., 1 2 3) and a less effective sequential magnitude comparison process (mainly used with larger distances; e.g., 2 4 6). Individual variations of these strategies could result in qualitative differences (e.g., some might use magnitude comparison mechanisms more often than others) that might have obscured the correlation of the reverse distance effect with arithmetic and mathematical abilities in previous studies.
Evidence to answer this question is extremely sparse, since existing studies have assumed a quantitative structure for the reverse distance effect (e.g., Goffin and Ansari, 2016; Vogel et al., 2017; Vogel et al., 2019). The possibility of a qualitative structure has, to the best of our knowledge, not been systematically investigated or described. Nevertheless, important information can be gained from studies that have investigated both distance effects within the same individuals. For instance, (Goffin and Ansari, 2016) collected data from a sample of 68 adults. The participants performed a computerized numerical comparison task to measure the canonical distance effect, a numerical ordinal verification task to measure the reverse distance effect and a test of arithmetic performance (i.e., Woodcock Johnson III Tests of Achievement; Woodcock et al., 2001). The results of the reaction time analyses showed that the distance effect measures were uncorrelated with one another (r = 0.17, p = n.s.) and that both effects explained unique variance in their relationship with arithmetic performance (canonical distance effect: r = −0.310, p < 0.05; reverse distance effect: r = −0.422, p < 0.01). However, the authors did not assess the structure of individual differences for the reverse and the canonical distance effect in detail. Figure 2 of that study (p.73; Goffin and Ansari, 2016) indicates that some individuals did not show the expected reverse distance effect in the ordinal verification task but the opposite: a canonical distance effect. This finding contrasts the numerical comparison task in which almost all individuals showed the expected canonical distance effect. Thus, the result pattern indicates that estimates of the reverse distance effect might be subject to qualitative differences, while estimates of the canonical distance effect might be of quantitative nature.
In the present work we tested this hypothesis and explored whether a qualitative individual differences structure for the estimates of the reverse distance effect moderate the association with arithmetic and more complex forms of mathematical abilities. We used the approach of Haaf and Rouder (2017) and Haaf and Rouder (2019) to investigate the structure of individual differences for the estimates of the reverse and the canonical distance effects. Their Bayesian approach instantiates different models which place varying levels of constraint on individual differences. Key among these are two models which reflect qualitative and quantitative individual differences: an unconstrained model and a positive-effects model. The unconstrained model allows individual differences to vary among all possible values (positive or negative), and thus reflects qualitative differences. The positive-effects model assumes that all effects are positive. This model reflects quantitative differences—since all individuals show an effect in the expected direction (positive values) the only variation is in the magnitude of the effect. The common-effect model places even more constraint on individual variation by assuming that everyone’s distance effect is the same value (i.e., there is an effect in the expected direction, and the size of the effect is equal across individuals). The null model is the most constrained and it specifies that the effect is zero (i.e., there is no effect across all individuals). The best model fit is then tested using a Bayes factor model comparison. This novel approach has been successfully implemented to test the structure of individual differences in numerical priming effects (Haaf and Rouder, 2019), location and color Stroop effects (Haaf and Rouder, 2019), numerical size congruity effects (Faulkenberry and Bowman, 2020), and the truth effect (Schnuerch et al., 2020).
As an alternative, clustering methods (e.g., latent profile analysis) could be used to model individual differences in the various distance effects. Such methods work by collapsing the high dimensional space of response variables into configural profiles (or clusters), allowing the analyst to classify individuals based on cluster membership. One limitation of such methods is that they do not clearly account for the qualitative distinctions between positive and negative effects. As Haaf and Rouder (2019) point out, a cluster analysis would likely place two individuals with true distance effects of −20 and 20 ms into the same cluster, whereas two individuals with true effects of 20 and 200 ms would not be placed together. We believe that the distinction between positive and negative distance effects is important, as each points to a different theoretical mechanisms of number processing. Thus, instead of using a single model (e.g., a clustering model), we compared several different models, each of which specified a different level of constraint on the true distance effects that could be present among individuals.
Using data from a group of adults who performed a computerized numerical comparison task, a numerical order verification task, a paper-pencil test of arithmetic fluency, as well as a standardized measure assessing mathematical abilities, we tested the following hypotheses: 1) Is there a canonical and a reverse distance effect on the group level? Based on a large body of evidence we expected to replicate a) significant faster reaction times for large distances compared to small distances in the numerical comparison task, and b) significant faster reaction times for small distances compared to large distances in the correct order condition of the numerical order verification task. 2) Are individual differences in the distance effects quantitative or qualitative? Based on our hypothesis described above, we expected that the best Bayesian model fit for the estimates of the reversed distance effect would be an unconstrained model (i.e., not all participants show a distance effect in the expected direction), while the best fit for the estimates of the canonical distance effect would be a positive-effect model (i.e., all individuals show a canonical distance effect, but to a different degree). 3) Do the model estimates of the reverse distance effect moderate the association with arithmetic and mathematical abilities? Based on our hypothesis, we expected that if the estimates of the reverse distance effect are subject to qualitative differences, the correlative association with arithmetic and mathematical abilities should be significantly larger in a selected group of individuals who truly show a reverse distance effect, in comparison to a group of individuals who show no evidence for a reverse distance effect.
Methods
Participants
We collected behavioral data from 450 adult participants (273 females; Mage = 22.32; SD = 4.66, range = 17–50). From this data set, we removed individuals with missing data (n = 18) and individuals who reported neurological disorders and/or learning disabilities (n = 35). Thus, the final sample comprised 397 healthy participants (258 females; 354 right-handed, 29 left-handed, 14 ambidextrous) with a Mage of 22.32 (SD = 4.74; range = 17–50) years. All subsequent analyses are based on this final sample. Approximately 43% of the participants were students and reported to be enrolled in psychology, 19% in science, 18% in humanities, 11% in engineering, 5% in law or economics, and 3% without categorization. All participants gave written informed consent prior to participation and received feedback regarding their intellectual abilities after testing as incentive for taking part in the study. The local ethics board of the University of Graz approved the study.
Materials
Raw Data, analyses scripts and supplemental materials can be accessed via the open science framework (OSF) using the following link: https://osf.io/jvmc2/?view_only=64abdcbd0cac4ca0b8154ebbcc4437a2.
Numerical Comparison Task
Two single-digit numerals were horizontally presented on a computer screen (e.g., 2 8), and participants had to indicate as accurately and as fast as possible which of the two numbers is numerically larger (see Figure 1A; see also supplemental materials for a detailed list of the stimuli). The reason for including only single-digit numbers is that the comparison (or the ordinal verification) of two-digit numbers introduces additional reaction time effects that are not the focus of the present work (e.g., compatibility effect, decade crossing; Franklin et al., 2009; Nuerk et al., 2001). Therefore, the stimuli consisted of the Hindu-Arabic numerals 1 to 9. In half of the trials, the larger numeral was presented on the left side. In the other half, the larger numeral was presented on the right side. The numerical distance between the numerals (i.e., inter-item distance) was systematically manipulated to measure the canonical distance effect. We categorized trials (80 in total) into small (40 trials with a numerical distance of one and two: e.g., 2 3; 5 3) and large inter-item distance trials (40 trials with a numerical distance of five and six: e.g., 2 7; 8 2).
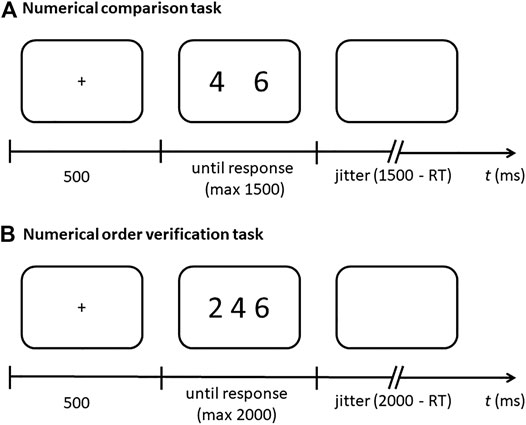
FIGURE 1. Timing of a trial in (A) the numerical comparison and (B) the numerical order verification task. After showing a fixation cross, the numbers were presented on the screen. Participants responded via a button press.
The presentation of the stimuli started with a fixation (500 ms), then the two numerals were simultaneously presented until a key response was given (maximum presentation time of the two numerals 1500 ms), followed by a blank screen with a variable jitter (calculated as the difference between 1500 ms and the response time of the trial). Reaction time data were recorded to estimate individual’s canonical distance effect for correct trials.
Numerical Order Verification Task
This task was adapted from Vogel et al. (2017) and Vogel et al. (2019). Three single-digit Arabic numerals were horizontally presented on a computer screen (see Figure 1B; see also Supplementary Material for a detailed list of the stimuli) and participants had to evaluate, as accurately and as fast as possible, whether the three numbers represent a correct (e.g., 2 3 4) or incorrect numerical order (e.g., 2 4 3). Again, only single-digit numbers were used to avoid additional reaction time effects. The stimuli consisted of the Hindu-Arabic numerals 1 to 9. In half of the trials, the numerals were arranged in a correct ascending/descending order (e.g., 2 3 4; 6 5 4). In the other half, the numerals were arranged in an incorrect mixed order (e.g., 2 4 3; 4 2 3). Again, the inter-item distance was manipulated in order to measure the reverse distance effect. We categorized items into small (30 trials with a numerical distance of one: e.g., 2 3 4) and large distance trials (30 trials with a numerical distance of two or three: e.g., 2 4 6, 2 5 8).
Stimuli presentation started with a fixation cross (500 ms), then the three numerals were simultaneously presented on the screen until a key response was given (maximum presentation time of 2000 ms). A blank screen with a variable jitter (calculated as the difference between 2000 ms–response time) was presented at the end of each trial. We recorded reaction time data to estimate the reverse distance effect for the correct order condition.
Arithmetic Fluency
We assessed arithmetic performance with a paper-pencil task designed in our laboratory (Schillinger et al., 2018; Vogel et al., 2017; Vogel et al., 2019; the assessment with all items can be found on OSF) based on the French kit test (French et al., 1963). The task measures the ease with which individuals can solve small and large multiplications, additions, and subtractions problems.
Small problems include 64 single-digit multiplications (e.g., 5 × 7), 128 single-digit additions (e.g., 4 + 7), and 128 subtractions with a minuend between 4 and 20 and a single-digit subtrahend (e.g., 16–8). Research has shown that adults solve such simple arithmetic problems, especially multiplications and additions, by retrieving the respective solution from long-term memory (Ashcraft, 1992; Campbell and Xue, 2001; Grabner and De Smedt, 2011).
Large problems included 60 problems for each operation. Multiplications were composed of a double-digit number (smaller than 100) and a single-digit number (e.g., 39 × 5), additions required to sum up three double-digit numbers (e.g., 30 + 98 + 59), and subtractions consisted of two double-digit numbers (e.g., 82–31). Research has shown that such complex arithmetic problems usually require the application of an arithmetic procedure to be solved (Ashcraft, 1992; Campbell and Xue, 2001; Grabner and De Smedt, 2011).
In the test session, participants solved as many problems as possible on each sheet (the operations were printed on separate sheets) within a limited time (90 s for small and 120 s for large problems). Instead of a composite score, we calculated scores (number of correctly solved items) for each operation and problem sizes (i.e., small subtraction, large subtraction, small additions, large additions, small multiplications, and large multiplications).
Mathematics Test (M-PA)
We used the short version of the German mathematics test for selection of personnel (Mathematiktest für die Personalauswahl, M-PA; Jasper and Wagener, 2011) to asses individual differences in higher-order mathematics. The M-PA was developed to assess mathematical competencies of individuals with at least lower secondary education between the ages of 16 and 40. The short version consists of 31 mathematical problems with a multiple-choice (MC) or open answer (OA) format. Problems cover a wide range of mathematical topics including fractions (3 OA), conversion of units (3 OA), exponentiation (7 OA), division with decimals (2 OA), algebra (1 MC), geometry (1 MC), roots (7 OA), and logarithms (7 OA). Following instructions, participants had a total of 15 min to solve the problems. The short version of the M-PA has been reported to have good internal consistency (Cronbach alpha = 0.89) and to be highly correlated with the long version of the M-PA (r = 0.93), which contains a total of 77 items (Jasper and Wagener, 2011). We calculated the total number of correctly solved items for our statistical analysis.
Procedure
Data collection took place between 2015 and 2019 in a group testing room at the Institute of Psychology, University of Graz, as part of a larger and ongoing investigation. We tested participants in small groups (the size of each group varied from four to twelve individuals). Upon arriving, participants were seated in front of a computer screen and a test booklet. Participants worked through the test booklet and took a pause whenever they reached a page with a red stop sign. For all speeded tests (e.g., M-PA: 15 min and arithmetic fluency test: 10.5 min), our experimenters took the time and informed participants when they had to stop working on the respective test. Please note that in addition to the above-described tasks, the test booklet contained several additional assessments (e.g., tests assessing creativity and personality as well as questionnaires on math anxiety and general anxiety) that are not within the scope of the present study. At the end, participants were asked to answer demographic questions regarding sex, age, field of study, and final high school grade in mathematics.
Next, we collected the data from the computerized tasks. The computerized tasks (i.e., numerical comparison task and the numerical order verification task) were presented on a Dell computer (Windows 10 64-bit operating, Intel i5-4590 processor @ 3,3 gigahertz and 8 gigabyte ram) with the stimuli presentation software Psychopy (version 1.85.3; Peirce, 2008). Stimuli were visualized with a Samsung S24C450 monitor (24 inch) using a sampling rate of 60 Hz. Before each task, participants solved 6 practice trials in which they received a feedback on whether their response was correct or incorrect. The entire testing took about 2h and 30 min.
Modeling and Analysis
We used frequentist and Bayesian analyses to answer the questions of this project. All statistical analyses, including Bayesian modeling of individual differences, were calculated in R (R Core Team, 2020). Descriptive statistics provide cumulative information about all variables and their distributional properties, whereas inferential statistics are based on reaction time data (see also Goffin and Ansari, 2016).
Testing Distance Effects on the Group Level
First, we calculated two analysis of variance (ANOVA) for repeated measurements, including inter-item distance (distances 1, 2, 5, 6 in the numerical comparison task, and distances 1, 2, 3 in the numerical ordinal verification task) as the main factor. Greenhouse Geisser corrected estimates (Greenhouse and Geisser, 1959) are reported as the data violated the assumption of equal variance differences across the conditions (Mauchly’s test of sphericity are all p < 0.05; Field et al., 2012). We used pairwise t-tests, corrected for multiple comparisons (false discovery rate (FDR) method; Benjamini and Hochberg, 1995), to test for significant differences between the single inter-item distance conditions. Partial-eta (ƞp2) and Cohen’s d are reported as effect sizes for the ANOVA and t-tests.
Testing the Model Fit of the Distributional Properties of the Distance Effects
In a second step, we tested the hypothesis of a qualitative model of the estimates of the reverse distance effect (i.e., not all participants show the expected reverse distance effect) and the hypothesis of a quantitative model of the estimates of the canonical distance effect (i.e., all individuals show the expected canonical distance effect, but to a different degree). To investigate the structure of individual differences, we used the approach of Haaf and Rouder (2017) see also Faulkenberry and Bowman (2020) to develop and to test a set of four hierarchical Bayesian models. Thus, each of these models reflects a different underlying distributional structure of the distance effects
1) The unconstrained model places no constraints on the individual distance effects. In this model, we allow subjects’ distance effects to vary among all possible values (positive or negative), so we use this model to capture qualitative individual differences.
Here
2) The positive-effects model places constraints on the distribution of the distance effects by assuming that all distance effects are positive. Thus, we use this model to capture quantitative differences.
3) The common-effect model places even more constraint on the distribution of the distance effects by assuming that everyone’s distance effect is the same value.
We note that if the common-effect model is the best predictor of our observed data, then such results would call into question the efficiency of our experimental design as a test to elicit individual differences.
4) The null model is the most constrained of the four, and it specifies that each participant’s distance effect is zero:
In this model, any observed variation in response times would be due to sampling noise.
We then used Bayes factors (Jeffreys, 1968; Kass and Raftery, 1995) to test which of the four competing models is the best predictor of our observed data. Bayes factors index the relative predictive adequacy of two models by comparing the marginal likelihood of observed data under one model compared to another (Faulkenberry et al., 2020). For example, a Bayes factor of 5 indicates that the observed data are five times more likely under one model compared to another (see also Supplementary Material for a more detailed description of the procedure). To find out how much these results depended on our choice of prior specification, we also conducted a sensitivity analysis (see also Supplementary Material for prior specification). For this we adjusted the prior scales on the size of our expected reverse and canonical distance effects, relative to overall variability as well as on the by-subject variability of the effect, relative to overall variability.
In the case that the model comparisons reveal evidence for an unconstrained model (i.e., qualitative individual differences), we further classified individuals according to the type of distance effect individuals exhibited; that is, either positive, negative, or undecided. If at least 75% of the posterior samples for a specific
Testing the Associations of the Reverse Distance Effect With Arithmetic and Mathematical Performance
Based on the above model specification, we estimated individual distance effects
We then used these individual estimates to explore the impact of a possible qualitative distribution on the association with arithmetic and mathematical performance measures. More specifically, we analyzed whether the size of the correlation coefficients differs as a factor of whether we include all individuals (as has been done in previous research) or a selection of individuals (individuals with evidence for a reverse distance effect) into the analysis. In the first analysis, we used the entire sample (regardless of whether individuals showed a distance effect or not) to calculate zero-order and partial correlations (controlling for age and the other distance effect) between the distance effects and our measures of arithmetic fluency (i.e., small and large subtractions, additions and multiplications) and mathematical competencies (M-PA).
We then repeated the above described correlation analyses with two selected groups: one group in which all individuals showed a “positive” reverse distance effect, and another group in which individuals showed “no-positive effect”.
Finally, we tested whether the size of the observed correlation coefficients differed across these groups. In other words, we tested whether correlation coefficients (e.g., the correlation between reverse distance effect and small subtraction problems) in the “positive effect” group are significant larger compared to the “no-positive effect” group. We used r.test from the psych package (Revelle, 2020) to test for the significance of correlation differences between two different sample sizes. For this a z-score is calculated that finds the difference between the z transformed correlations divided by the standard error of the difference of two z-scores (Cohen et al., 2013).
Obtained p-values from all analyses were FDR corrected for multiple comparisons. This procedure enabled us to test whether the association between the reverse distance effect and arithmetic/mathematical abilities is moderated by group composition.
Results
Descriptive Statistics
Tables 1, 2 depict descriptive statistics of the computerized tasks (i.e., numerical comparison and numerical order verification), the arithmetic fluency measures and the M-PA.
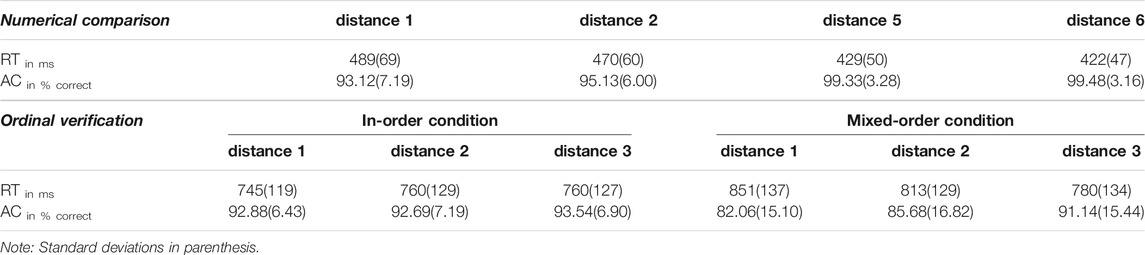
TABLE 1. Descriptive statistics of mean reaction time and accuracy measures of the computerized tasks.
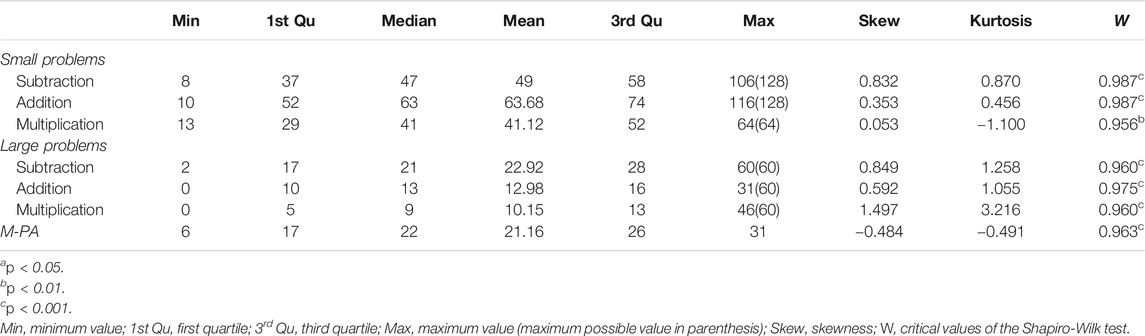
TABLE 2. Descriptive statistics of the arithmetic measures and the M-PA.
Shapiro-Wilk tests indicated that all measures of the arithmetic fluency test and the scores from the M-PA differed significantly from a normal distribution. The distributions of the small problems showed the following characteristics: The subtraction scale was right-skewed with a leptokurtic distribution, the addition scale was right-skewed with a leptokurtic distribution, the multiplication scale was not skewed but showed a platykurtic distribution. The distributions of the large problems showed the following characteristics: The subtraction scale was right-skewed with a leptokurtic distribution, the addition scale was right-skewed with a leptokurtic distribution, and the multiplication scale was right-skewed with a leptokurtic distribution. The M-PA scale was left-skewed with a platykurtic distribution.
Inferential Statistics
Distance Effects on the Group Level
We calculated two ANOVAs to test the presence of distance effects on the group-level. As expected, the results of these analyses showed significant distance effects for both conditions. The ANOVA performed on the data in the numerical comparison task showed a significant effect of inter-item distance, F(2.02, 801.39) = 967.235, p < 0.001, ƞp2 = 0.71. T-test comparisons revealed significant differences across all distances (all comparisons pFDR-adjusted < 0.001; effect sizes ranged from small, distance 5 ∼ distance 6, d = 0.420, to large, distance 1 ∼ distance 6, d = 1.819). This pattern is consistent with the canonical distance effect typically observed in the numerical comparison task (Moyer and Landauer, 1967).
The ANOVA performed on the in-order condition of the numerical order verification task showed a significant effect of inter-item distance, F(1.86, 738.46) = 22.381, p < 0.001, ƞp2 = 0.053. T-tests revealed that distance 1 trials were significantly faster than distance 2 trials, t(396) = −5.67, pFDR-adj < 0.001, d = −0.285 and significantly faster than distance 3 trials, t(396) = -5.28, pFDR-adj < 0.001, d = −0.265. No significant difference was found between distance 2 and distance 3 trials, t(396) = -0.04, n.s., d = 0.002 (see also Table 1). This pattern is consistent with the reverse distance effect, i.e., fast reaction times for distance 1 trials compared to distance 2 and 3 trials (Goffin and Ansari, 2016; Vogel et al., 2017). The effect sizes of the reverse distance effect are, however, small.
Individual Difference Structure for the Reverse and Canonical Distance Effects
To investigate the structure of individual differences associated with the distance effects, we assessed whether the two effects are best described by the unconstrained or the positive effects model. Figure 2 shows the results of the modeling for both distance effects, Table 3 depicts the results of the Bayes factor comparisons between the four models.
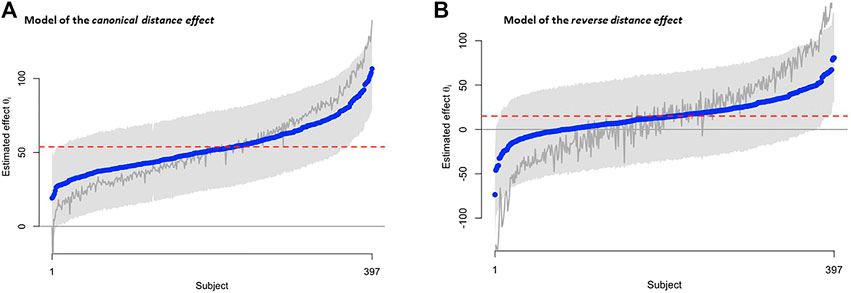
FIGURE 2. Observed and estimated individual differences in (A) the canonical and (B) the reverse distance effect (in ms), ordered by observed effect size. Model-estimated effects (in blue) are derived from the positive-effect model (positive values) for the canonical distance effect and from the unconstrained model (positive and negative values) for the reverse distance effect. The red dashed line represents the point estimate for the canonical and reverse distance effect respectively. The gray line represents observed canonical and reverse distance effects. The gray shaded area denotes the 95% credible interval for the model-estimated effects.
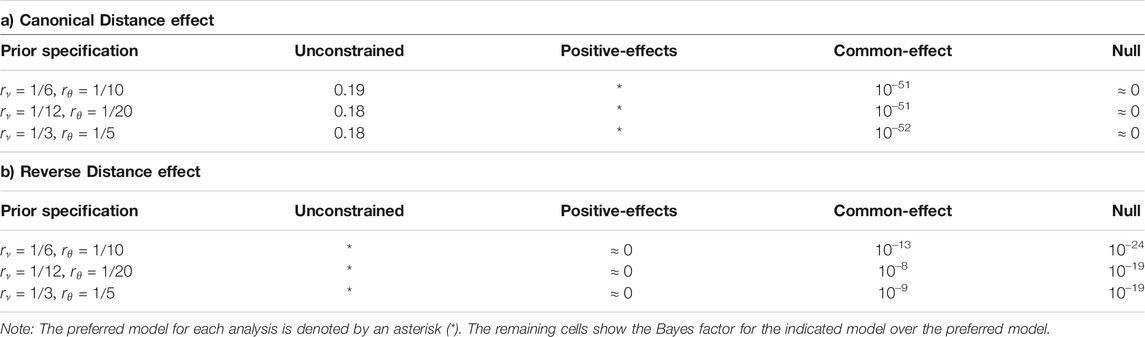
TABLE 3. Bayes Factor Model Comparisons for (A) the canonical distance effect and (B) the reverse distance effect.
For the estimates of the canonical distance effect, the unconstrained model and null model received almost no support from the data (see Table 3A). Different prior specifications did not change the overall picture. The positive-effects model remained the preferred model across all prior settings (by a factor of approximately 5.6 over the unconstrained model each time), with little support for either the common-effect or null model. Thus, our observed data are evidential for the positive-effects model, indicating quantitative differences in the canonical distance effect.
The picture for the estimates of the reverse distance effect is quite different, as the unconstrained model was the preferred model. The Bayes factor model comparison (see Table 3B) showed that across the three different sets of prior specifications, the unconstrained model was the preferred model by a large factor. The data lend virtually no support for the positive-effects model, common-effect model, nor the null model.
These analyses confirmed that whereas individual differences in the estimates of the canonical distance effect appear to be quantitative (i.e., everyone exhibits a positive canonical distance effect of some varying magnitude), individual differences in the estimates of the reverse distance effect are qualitative (i.e., some exhibit a positive effect, but others show a negative effect). As such we further classified the type of the qualitative distribution of this distance effect. This analysis revealed that 172 (43%) participants exhibited a “positive” expected reverse distance effect, 18 (5%) individuals showed evidence for a “negative” reverse distance effect (i.e., a canonical distance effect), and the remaining 207 (52%) were classified as “undecided”.
Associations of the Distance Effects With Arithmetic and Mathematical Performance
Our next step was to elucidate the impact of qualitative individual differences of the estimates of the reverse distance effect on the association with arithmetic and math performance. We first calculated zero-order and partial correlations for the entire sample (see Supplementary Material for the full correlations matrix). While the results revealed significant associations between the estimates of the canonical distance effect and all measures of mathematical competence (correlation coefficients range from −0.14 to −0.33; see Table 4A), only two significant correlations were found for the estimates of the reverse distance effect with small subtractions, r = −0.11, pFDR-adj < 0.05, and small additions, r = −12, pFDR-adj < 0.05. Correlation coefficients ranged from −0.2 to −0.12. These two associations were non-significant when the estimates of the canonical distance effect and age were included as control variables. In contrast, all correlations of the estimates of the canonical distance effects remained significant when considering the estimates of the reversed distance effect and age (see also Table 4A).
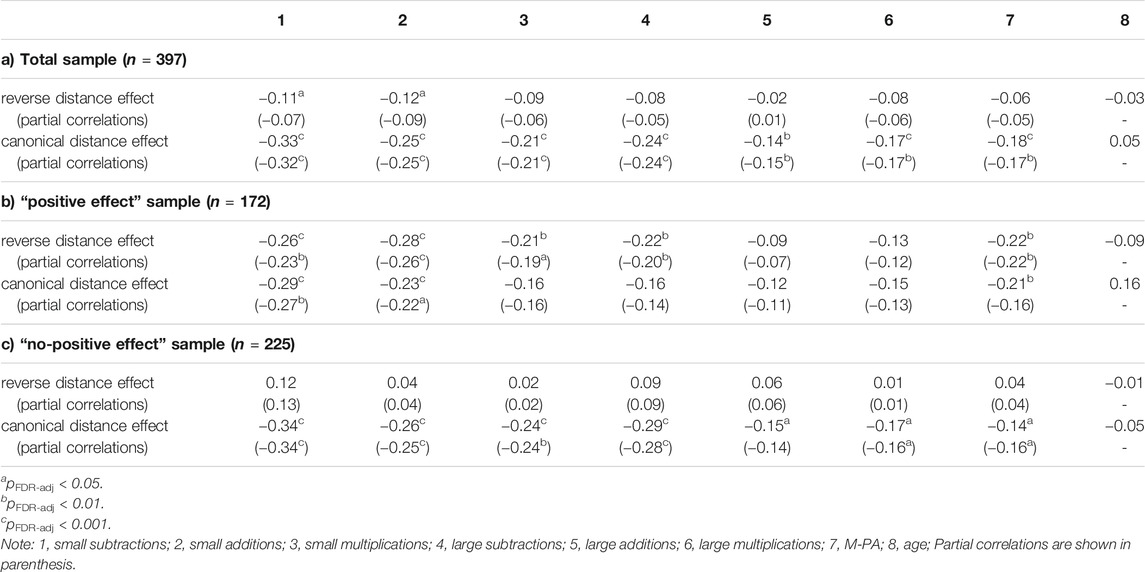
TABLE 4. Bivariate and partial correlations among the distance effects and measures of mathematical competence across (A) the entire sample, (B) the “positive effect” sample and (C) the “no-effect” sample.
We now investigated these associations in the group of individuals (n = 172) who showed evidence for a “positive” reverse distance effect (i.e., individuals who showed a reverse distance effect) and those who showed no positive effect (“no-positive effect” group; i.e., undecided and “negative” distance effect; n = 225). Results of the correlation analysis (see Table 4B) revealed significant associations between the reverse distance effect and small subtractions, small additions, large subtraction, small multiplication, and the M-PA in the “positive” group. Correlation coefficients ranged from −0.09 to −0.28. The above reported correlations remained significant when considering the estimates of the canonical distance effect and age in the partial correlation (r values ranged from −0.07 to −0.26). In contrast, the zero order and partial correlation analyses (see Table 4C) in the “no-positive effect” group revealed no significant associations with arithmetic operations and the M-PA. Correlation coefficients ranged from 0.01 to 0.12 in the zero-order and from 0.01 to 0.13 in the partial correlation analysis. The performed z-test showed that correlation coefficients in the “positive effect” group compared to the “no-positive effect” group were significantly larger for small subtractions, z = 3.788, p FDR-adj < 0.05, small additions, z = 3.210, p FDR-adj < 0.05, small multiplications, z = 2.186, p FDR-adj < 0.01, large subtraction, z = 3.075, p FDR-adj < 0.01, and the M-PA, z = 2.779, p FDR-adj < 0.01. No differences were found for large additions, z = 1.472, p FDR-adj < n.s., and large multiplications, z = 1.379, p FDR-adj < n.s.
Discussion
Numerical order processing has been proposed as a significant predictor of arithmetic abilities (for a review see Lyons et al., 2016). However, research on the relationship between the reverse distance effect (i.e., as an index of numerical order processing) and arithmetic abilities has demonstrated mixed findings: some studies have found negative (Goffin and Ansari, 2016), positive (Vogel et al., 2019) or no relationship (Vogel et al., 2015; Vogel et al., 2017; Vos et al., 2017; Orrantia et al., 2019). In the present work, we provided evidence that the estimates of the reverse distance effect are subject to qualitative individual differences (i.e., not all participants show a reverse distance effect) and that these individual differences can obscure the relationship with arithmetic abilities.
We first demonstrated the presence of the reverse and the canonical distance effect in an ordinal verification and a numerical comparison task. While overall reaction times of the ordinal verification task were faster for small distances (e.g., 2 3 4) compared to large distances (e.g., 2 4 6), reaction times of the numerical comparison task were slower for small distances (e.g., 2 3) compared to large distances (e.g., 8 2). This finding replicates the well-documented behavioral signatures of the reverse and canonical distance effects in a group of 397 adults. The observed reaction time differences—i.e., fast reaction times for small distances in the ordinal verification task, and slower reaction times for small distances in the numerical comparison task—have been interpreted as evidence for the involvement of different cognitive processing mechanisms (Turconi et al., 2006; Vogel et al., 2015; Lyons et al., 2016). While the reverse distance effect has been related to multiple strategies such as long-term memory retrieval and sequential-procedural comparisons (Lyons et al., 2016; Sasanguie and Vos, 2018; Vogel et al., 2019; Sella et al., 2020; Sommerauer et al., 2020), the canonical distance effect has been associated to the mental representation of numerical quantities (Moyer and Landauer, 1967). Independent of the cognitive mechanisms that generate the reverse and the canonical distance effects, the present data support the view that both distance effects are unrelated with one another as we only found a small positive effect size correlation (see full correlation table in Supplementary Material) between the two indices (rpositive-effect sample = 0.11).
The comparison of four hierarchical Bayesian models further showed that individual differences of the estimates of the reverse distance effect were best explained by an unconstrained model. Since the unconstrained model allows variation among all possible values (positive or negative), the above results indicate a qualitative structure of the estimates of the reverse distance effect: not all individuals show the expected reverse distance effect (Haaf and Rouder, 2017; Haaf and Rouder, 2019). Our estimations revealed that 42% of the individuals demonstrated a reverse distance effect, 5% of the individuals showed evidence for an opposite effect (i.e., a canonical distance effect), and 52% of the individuals showed no evidence for either direction (i.e., no distance effect). This finding is consistent with the notion that individuals may employ different qualitative processing strategies during the ordinal verification task. Some individuals might use strategies that lead to the reverse distance effect (e.g., memory retrieval for small distances in combination with sequential-procedural comparisons for larger distances), while others might use strategies that lead to an opposite effect (e.g., a canonical distance effect that arises because sequential-procedural comparisons are used across all distances). An interesting finding is that a large proportion of individuals (52%) showed no evidence for a positive or negative distance effect in the ordinal verification task. In other words, the model was not able to capture whether a distance effect existed in these individuals (i.e., reverse or a canonical distance effect). We think that there are several possible explanations for this finding. First, it could be the case that our experimental design was not able to detect existing, albeit subtle effects due to a lack of power. However, this is unlikely, as we explicitly tested this possibility with the common-effect and null models. If either of these models had admitted better predictive adequacy, it would call into question our ability to detect individual variations (or any effect at all). Neither model received any support from the data, so we are confident that the issue does not lie within the experimental design. Second, it could be that those individuals showed no distance effect because there is no distance effect to be detected: that is, they have a true effect of zero. Such a scenario could be tested by implementing a mixture modeling approach (e.g., a spike-and-slab model, see also Haaf and Rouder, 2019). Uncovering the reasons of such an absence would be of great interest, since it indicates that these individuals might use a combination of strategies that level each other out (e.g., memory retrieval and sequential comparison that produce opposite effects and zero each other out) or strategies that do not fit with the current models of numerical order processing. For instance, individuals might recognize that the ordinal verification of those triplets, which contain one odd/even and two even/odd numbers (e.g., 2 3 4; 3 6 9), is determined by the position of these numbers in the triplet (e.g., if the odd number is in the middle, it is correct: 2 3 4, 3 6 9; if it is at the beginning or at end, it is incorrect; 4 2 3, 3 4 2, 3 9 6, 6 3 9). Such strategies would be based on non-semantic evaluations and, therefore, shortcut distance related measures. However, the present data are agnostic as to which processing strategies might have been employed. It also leaves unanswered to which extent the observed patterns generalize to other ordinal verification tasks (e.g., with two-digit numbers). These open questions need to be addressed in the future.
In contrast to the ordinal verification task, individual differences of the estimates of canonical distance effect were best explained by a positive-effects model. Since the positive-effects model limits individual variations to positive values, the above results indicate quantitative individual differences: all individuals show the expected canonical distance effect, but to a different degree. This finding is consistent with neurocognitive models that suggest a continuous/approximate representation of numerical quantities (Moyer and Landauer, 1967). Individual differences may arise as a factor of how much the mental representations of numerical quantities overlap (for a review see Brannon, 2006)—individuals with small representational overlap show less susceptibility and, therefore, a small individual canonical distance effect.
We then demonstrated that the association of the reverse distance effect with arithmetic abilities is moderated by the observed qualitative individual differences. While neglectable to small correlation coefficients were observed in the no-positive effect sample (i.e., individuals who showed no evidence for a reverse distance effect), significant and larger correlations were observed in the positive-effect group (i.e., individuals who showed the expected reversed distance effect). This pattern is line with our hypothesis that qualitative differences obscure the relationship between the reverse distance effect and arithmetic abilities. Different sample compositions across different studies could, therefore, explain the mixed results that have been reported in previous studies (Goffin and Ansari, 2016; Vogel et al., 2017; Vogel et al., 2019; Vos et al., 2017; Orrantia et al., 2019). This finding highlights the need to pay close attention to the sample composition and to ensure that the dimension of interest (e.g., the reverse distance effect) is not confounded by qualitative processing differences. When controlling for this confound, we observed significant negative associations between both the reverse distance effects and arithmetic abilities as well as between the canonical distance effect and arithmetic abilities. Thus, the results of this analysis are in line with the findings reported by Goffin and Ansari (2016) who reported negative correlations with arithmetic fluency measures of the Woodcock-Johnson III Test of Achievement (Woodcock et al., 2001) for both distance effects (r = −0.422 for the reverse distance effect and r = −0.310 for the canonical distance effect). Together, these findings indicate that individuals with smaller distance effects (individuals who are less susceptible to the influence of numerical distances) show better arithmetic performances. The question of which cognitive mechanisms give rise to these associations needs to be further explored in future studies.
Previous studies that have investigated the association between the reverse distance effect and arithmetic have predominantly used composite scores (i.e., a combination of different arithmetic performance measures) to index arithmetic abilities. This approach neglects that arithmetic consists of different operations (e.g., subtractions, additions, multiplications, divisions) and that different strategies are used to solve them (see Ashcraft, 1992; Campbell and Xue, 2001). For instance, there is good neurocognitive evidence that individuals use different strategies and procedures (such as fact-retrieval or calculation) to find the correct answer to arithmetic problems (e.g., Grabner et al., 2009). The results of our study indicated significant associations of the reverse distance effect with all small problems (i.e., subtraction, addition and multiplication) and large subtraction problems. No significant associations were found for large additions and large multiplications. For the canonical distance effect, significant associations with small subtraction and additions were found. All other arithmetic operations did not significantly correlate with the canonical distance effect.
From a theoretical standpoint, one might have expected stronger relationships for the canonical distance effect with arithmetic operations that require the manipulation of numerical quantities, i.e., large problems instead of small problems, which are often solved via fact retrieval (LeFevre et al., 1996; Campbell and Xue, 2001). The present results contradict this in as much only small subtraction and small additions were found to correlate with the canonical distance effect. However, some findings suggest that small additions and small subtractions can be solved via fast and automatic procedures of numerical processing (for a discussion on small addition see Baroody, 2018). This is in contrast to small multiplications, which have been argued to be the prime example of fact-retrieval (Ashcraft, 1992; Campbell and Epp, 2005). As such it is possible that the present results capture that difference within the small problem range. It is also possible that the larger problems in our paper-pencil task, which were quite complex and in which individuals might have used different strategies and other cognitive processing mechanisms to find the solution (e.g., in the large problem task individuals had to carry over the results), did not capture the manipulation of numerical quantities. For the reverse distance effect, one might have expected less specific and rather broad association as the reverse distance effect is argued to arise from a combination of different strategies. One could, however, argue that the fast-retrieval of ordinal relationships drives the reverse distance effect (Vogel et al., 2019; Sella et al., 2020), and that associations with arithmetic problems that afford the fast access to stored knowledge (i.e., small problems) are to be expected. To some extent that could explain the stronger relationship of the reverse distance effect to all small problems. Taken together, although these explanations are speculative, the data suggest distinctive associations of the two distance effects with different facets of arithmetic operations.
We also found a significant relationship between the reverse distance effect and more complex forms of mathematics (i.e., the M-PA). The association between numerical order processing and complex forms of mathematics has, to the best of our knowledge, only been investigated in two other studies. Morsanyi et al. (2018) collected data from 87 undergraduate students who performed a numerical order task, a number-line task, a test of arithmetic abilities (i.e., the math fluency subset of the Woodcock-Johnson III Test of Achievement, Woodcock et al., 2001) and a questionnaire that assesses individual differences in cognitive thinking styles (i.e., preference for object-spatial imagery or verbal cognitive style). The authors found a significant association of numerical order processing with the number line task as well as the self-reported object-spatial thinking style. However, the findings of this study were not based on the reverse distance effect as a measure of numerical order processing. The authors rather used less specific composite scores of overall reaction time measures and accuracy rates. Orrantia et al. (2019) investigated the relationship between numerical order processing, arithmetic abilities, and general mathematical achievement (i.e., the Spanish adaption of the SRA Test of Educational Ability) in a group of 27 male university students. The results of this study did not find a significant association between these measures. Despite the small sample size for a correlational investigation, the authors did also not use the reverse distance effect to investigate a possible association of these measures. Thus, the findings of the present work extend these studies by suggesting a specific association between the reverse distance effect and more complex forms of mathematical reasoning.
We conclude that the present work provided evidence for qualitative individual differences of the reverse distance effect (i.e., not all participants show this expected effect) and that this individual variation can obscure the relationship with arithmetic abilities and other mathematical competencies (e.g., depending on the sample composition and the individuals that show an effect). When controlling for these individual differences, we found a significant relationship between variations of the reverse distance effect and different measures of arithmetic and mathematical performance. The reasons for the observed qualitative differences in the numerical order verification task remain, however, unclear and need to be further investigated. To achieve this, future work needs to ensure that dimensions of interest (i.e., here the reverse distance effect) are not confounded by qualitative differences.
Data Availability Statement
The dataset presented in this study can be accessed via the open science framework (OSF) using the following link: https://osf.io/jvmc2/?view_only=64abdcbd0cac4ca0b8154ebbcc4437a2.
Ethics Statement
The studies involving human participants were reviewed and approved by Ethics board of the University of Graz, Austria. The patients/participants provided their written informed consent to participate in this study.
Author Contributions
SV contributed to conceptualizing the idea, analyzing the data, writing the first complete draft, and editing the paper. TF contributed to conceptualizing the idea, analyzing the data, and editing the paper. RG contributed to the editing of the paper.
Conflict of Interest
The authors declare that the research was conducted in the absence of any commercial or financial relationships that could be construed as a potential conflict of interest.
Publisher’s Note
All claims expressed in this article are solely those of the authors and do not necessarily represent those of their affiliated organizations, or those of the publisher, the editors and the reviewers. Any product that may be evaluated in this article, or claim that may be made by its manufacturer, is not guaranteed or endorsed by the publisher.
Acknowledgments
We like to thank Dennis Wambacher for the implementation of the task and our research assistants for collecting this data set. The authors acknowledge the financial support by the University of Graz.
Supplementary Material
The Supplementary Material for this article can be found online at: https://www.frontiersin.org/articles/10.3389/feduc.2021.655747/full#supplementary-material
Footnotes
1Please note that the calculated effect size did not differentiate between the canonical distance effect derived from symbolic (i.e., using Arabic numerals) and non-symbolic (i.e., dot arrays) comparison tasks. Since larger correlations with mathematical abilities are typically observed with symbolic measurements (De Smedt et al., 2013; Schneider et al., 2017), a larger effect size might be expected for the symbolic canonical distance effect.
References
Ashcraft, M. H. (1992). Cognitive Arithmetic: A Review of Data and Theory. Cognition 44 (1), 75–106. doi:10.1016/0010-0277(92)90051-I
Ashkenazi, S., Henik, A., Ifergane, G., and Shelef, I. (2008). Basic Numerical Processing in Left Intraparietal Sulcus (IPS) Acalculia. Cortex 44 (4), 439–448. doi:10.1016/j.cortex.2007.08.008
Baroody, A. J. (2018). A Commentary on Chen and Campbell (2017): Is There a clear Case for Addition Fact Recall? Psychon. Bull. Rev. 25 (6), 2398–2405. doi:10.3758/s13423-018-1440-y
Benjamini, Y., and Hochberg, Y. (1995). Controlling the False Discovery Rate: A Practical and Powerful Approach to Multiple Testing. J. R. Stat. Soc. Ser. B (Methodological) 57 (1), 289–300. doi:10.1111/j.2517-6161.1995.tb02031.x
Brannon, E. M. (2006). The Representation of Numerical Magnitude. Curr. Opin. Neurobiol. 16 (2), 222–229. doi:10.1016/j.conb.2006.03.002
Campbell, J. I. D., and Epp, L. J. (2005). “Architectures for Arithmetic,” in Handbook of Mathematical Cognition. Editors J. I. D. Campbell, (Psychology Press), New York: NY 347–360. doi:10.4324/9780203998045
Campbell, J. I. D., and Xue, Q. (2001). Cognitive Arithmetic across Cultures. J. Exp. Psychol. GeneralGeneral 130 (2), 299–315. doi:10.1037/0096-3445.130.2.299
Cohen, J., Cohen, P., West, S. G., et al. Cohen, P., West, S. G., and Aiken, L. S. (2013). Applied Multiple Regression/Correlation Analysis for the Behavioral Sciences. New York: Routledge, 536. doi:10.4324/9780203774441
De Smedt, B., Noël, M.-P., Gilmore, C., and Ansari, D. (2013). How Do Symbolic and Non-symbolic Numerical Magnitude Processing Skills Relate to Individual Differences in Children's Mathematical Skills? A Review of Evidence from Brain and Behavior. Trends Neurosci. Edu. 2 (2), 48–55. doi:10.1016/j.tine.2013.06.001
De Smedt, B., Verschaffel, L., and Ghesquière, P. (2009). The Predictive Value of Numerical Magnitude Comparison for Individual Differences in Mathematics Achievement. J. Exp. child Psychol. 103 (4), 469–479. doi:10.1016/j.jecp.2009.01.010
Dehaene, S., Meyniel, F., Wacongne, C., Wang, L., and Pallier, C. (2015). The Neural Representation of Sequences: From Transition Probabilities to Algebraic Patterns and Linguistic Trees. Neuron 88 (1), 2–19. doi:10.1016/j.neuron.2015.09.019
Delazer, M., Karner, E., Zamarian, L., Donnemiller, E., and Benke, T. (2006). Number Processing in Posterior Cortical Atrophy-A Neuropsycholgical Case Study. Neuropsychologia 44 (1), 36–51. doi:10.1016/j.neuropsychologia.2005.04.013
Faulkenberry, T. J., and Bowman, K. (2020). Modeling the Latent Structure of Individual Differences in the Numerical Size-Congruity Effect New York, NY: PsyArXiv. doi:10.31234/osf.io/4b9rs
Faulkenberry, T. J., Ly, A., and Wagenmakers, E.-J. (2020). Bayesian Inference in Numerical Cognition: A Tutorial Using JASP. J. Numer. Cogn. 6 (2), 231–259. doi:10.5964/jnc.v6i2.288
Field, A., Miles, J., and Field, Zoe. (2012). Discovering Statistics Using R London, England: SAGE Publication Ltd. https://uk.sagepub.com/en-gb/eur/discovering-statistics-using-r/book236067.
Franklin, M. S., Jonides, J., and Smith, E. E. (2009). Processing of Order Information for Numbers and Months. Mem. Cogn. 37 (5), 644–654. doi:10.3758/MC.37.5.644
French, J. W., Ekstrom, R. B., and Price, I. A. (1963). Kit for Reference Tests for Cognitive Factors Princeton, NJ: Educational Testing Service. doi:10.21236/ad0410915
Goffin, C., and Ansari, D. (2016). Beyond Magnitude: Judging Ordinality of Symbolic Number Is Unrelated to Magnitude Comparison and Independently Relates to Individual Differences in Arithmetic. Cognition 150, 68–76. doi:10.1016/j.cognition.2016.01.018
Grabner, R. H., Ansari, D., Koschutnig, K., Reishofer, G., Ebner, F., and Neuper, C. (2009). To Retrieve or to Calculate? Left Angular Gyrus Mediates the Retrieval of Arithmetic Facts during Problem Solving. Neuropsychologia 47 (2), 604–608. doi:10.1016/j.neuropsychologia.2008.10.013
Grabner, R. H., and De Smedt, B. (2011). Neurophysiological Evidence for the Validity of Verbal Strategy Reports in Mental Arithmetic. Biol. Psychol. 87 (1), 128–136. doi:10.1016/j.biopsycho.2011.02.019
Greenhouse, S. W., and Geisser, S. (1959). On Methods in the Analysis of Profile Data. Psychometrika 24 (2), 95–112. doi:10.1007/BF02289823
Gross, J., Hudson, C., and Price, D. (2009). The Longterm Costs of Numeracy Difficulties London, England: Every Child a Chance Trust and KPMG.
Haaf, J. M., and Rouder, J. N. (2017). Developing Constraint in Bayesian Mixed Models. Psychol. Methods 22 (4), 779–798. doi:10.1037/met0000156
Haaf, J. M., and Rouder, J. N. (2019). Some Do and Some Don't? Accounting for Variability of Individual Difference Structures. Psychon. Bull. Rev. 26 (3), 772–789. doi:10.3758/s13423-018-1522-x
Holloway, I. D., and Ansari, D. (2009). Mapping Numerical Magnitudes onto Symbols: The Numerical Distance Effect and Individual Differences in Children's Mathematics Achievement. J. Exp. Child Psychol. 103 (1), 17–29. doi:10.1016/j.jecp.2008.04.001
Jasper, F., and Wagener, D. (2011). Mathematiktest für die Personalauswahl [Mathematics test for selection of personnel]. Göttingen: Hogrefe.
Jeffreys, S. H. (1968). The Theory of Probability. Third Edition New York, NY: Oxford University Press.
Kass, R. E., and Raftery, A. E. (1995). Bayes Factors. J. Am. Stat. Assoc. 90 (430), 773–795. doi:10.1080/01621459.1995.10476572
LeFevre, J.-A., Bisanz, J., Daley, K. E., Buffone, L., Greenham, S. L., and Sadesky, G. S. (1996). Multiple Routes to Solution of Single-Digit Multiplication Problems. J. Exp. Psychol. Gen. 125 (3), 284–306. doi:10.1037/0096-3445.125.3.284
Lonnemann, J., Linkersdörfer, J., Hasselhorn, M., and Lindberg, S. (2011). Symbolic and Non-symbolic Distance Effects in Children and Their Connection with Arithmetic Skills. J. Neurolinguist. 24 (5), 583–591. doi:10.1016/j.jneuroling.2011.02.004
Lyons, I. M., and Ansari, D. (2015). Numerical Order Processing in Children: From Reversing the Distance-Effect to Predicting Arithmetic. Mind, Brain Edu. 9 (4), 207–221. doi:10.1111/mbe.12094
Lyons, I. M., and Beilock, S. L. (2011). Numerical Ordering Ability Mediates the Relation between Number-Sense and Arithmetic Competence. Cognition 121 (2), 256–261. doi:10.1016/j.cognition.2011.07.009
Lyons, I. M., and Beilock, S. L. (2013). Ordinality and the Nature of Symbolic Numbers. J. Neurosci. 33 (43), 17052–17061. doi:10.1523/JNEUROSCI.1775-13.2013
Lyons, I. M., Vogel, S. E., and Ansari, D. (2016). On the Ordinality of Numbers. Prog. Brain Res. 227, 187–221. doi:10.1016/S1099-4831(10)06803-310.1016/bs.pbr.2016.04.010
Maloney, E. A., Risko, E. F., Preston, F., Ansari, D., and Fugelsang, J. (2010). Challenging the Reliability and Validity of Cognitive Measures: The Case of the Numerical Distance Effect. Acta Psychologica 134 (2), 154–161. doi:10.1016/j.actpsy.2010.01.006
Moyer, R. S., and Landauer, T. K. (1967). Time Required for Judgements of Numerical Inequality. Nature 215 (2), 1519–1520. doi:10.1038/2151519a0
Nuerk, H.-C., Weger, U., and Willmes, K. (2001). Decade Breaks in the Mental Number Line? Putting the Tens and Units Back in Different Bins. Cognition 82 (1), B25–B33. doi:10.1016/S0010-0277(01)00142-1
Orrantia, J., Muñez, D., Matilla, L., Sanchez, R., San Romualdo, S., and Verschaffel, L. (2019). Disentangling the Mechanisms of Symbolic Number Processing in Adults' Mathematics and Arithmetic Achievement. Cogn. Sci. 43 (1). doi:10.1111/cogs.12711
Parsons, S., and Bynner, J. (2005). Does Numeracy Matter More. London: NRDC (National Research and Development Centre for adult literacy and numeracy). [aRCK].
Peirce, J. W. (2008). Generating Stimuli for Neuroscience Using PsychoPy. Front. Neuroinform. 2, 10. doi:10.3389/neuro.11.010.2008
Price, G. R., Holloway, I., Räsänen, P., Vesterinen, M., and Ansari, D. (2007). Impaired Parietal Magnitude Processing in Developmental Dyscalculia. Curr. Biol. 17 (24), R1042–R1043. doi:10.1016/j.cub.2007.10.013
R Core Team (2020). R: A Language and Environment for Statistical Computing. R Foundation for Statistical Computing. Available at: https://www.R-project.org/.
Revelle, W. (2020). Psych: Procedures for Personality and Psychological Research. Version 2.0.12. [Computer software]. Available at: https://cran.r-project.org/web/packages/psych/psych.pdf.
Rousselle, L., and Noël, M.-P. (2007). Basic Numerical Skills in Children with Mathematics Learning Disabilities: A Comparison of Symbolic vs Non-symbolic Number Magnitude Processing. Cognition 102 (3), 361–395. doi:10.1016/j.cognition.2006.01.005
Sasanguie, D., De Smedt, B., Defever, E., and Reynvoet, B. (2012). Association between Basic Numerical Abilities and Mathematics Achievement. Br. J. Dev. Psychol. 30 (2), 344–357. doi:10.1111/j.2044-835X.2011.02048.x
Sasanguie, D., and Vos, H. (2018). About Why There Is a Shift from Cardinal to Ordinal Processing in the Association with Arithmetic between First and Second Grade. Dev. Sci. 21 (5), e12653. doi:10.1111/desc.12653
Schillinger, F. L., Vogel, S. E., Diedrich, J., and Grabner, R. H. (2018). Math Anxiety, Intelligence, and Performance in Mathematics: Insights from the German Adaptation of the Abbreviated Math Anxiety Scale (AMAS-G). Learn. Individual Differences 61, 109–119. doi:10.1016/j.lindif.2017.11.014
Schneider, M., Beeres, K., Coban, L., Merz, S., Susan Schmidt, S., Stricker, J., et al. (2017). Associations of Non-symbolic and Symbolic Numerical Magnitude Processing with Mathematical Competence: A Meta-Analysis. Dev. Sci. 20 (3), e12372. doi:10.1111/desc.12372
Schnuerch, M., Nadarevic, L., and Rouder, J. N. (2020). The Truth Revisited: Bayesian Analysis of Individual Differences in the Truth Effect. Psychon. Bull. Rev. 28, 750–765. doi:10.3758/s13423-020-01814-8
Sella, F., Sasanguie, D., and Reynvoet, B. (2020). Judging the Order of Numbers Relies on Familiarity rather Than Activating the Mental Number Line. Acta Psychologica 204, 103014. doi:10.1016/j.actpsy.2020.103014
Sommerauer, G., Graß, K.-H., Grabner, R. H., and Vogel, S. E. (2020). The Semantic Control Network Mediates the Relationship between Symbolic Numerical Order Processing and Arithmetic Performance in Children. Neuropsychologia 141, 107405. doi:10.1016/j.neuropsychologia.2020.107405
Turconi, E., Campbell, J. I. D., and Seron, X. (2006). Numerical Order and Quantity Processing in Number Comparison. Cognition 98, 273–285. doi:10.1016/j.cognition.2004.12.002
Van Opstal, F., Gevers, W., De Moor, W., and Verguts, T. (2008). Dissecting the Symbolic Distance Effect: Comparison and Priming Effects in Numerical and Nonnumerical Orders. Psychon. Bull. Rev. 15 (2), 419–425. doi:10.3758/PBR.15.2.419
Vogel, S. E., Haigh, T., Sommerauer, G., Spindler, M., Brunner, C., Lyons, I. M., et al. (2017). Processing the Order of Symbolic Numbers: A Reliable and Unique Predictor of Arithmetic Fluency. J. Numer. Cogn. 3 (2), 288–308. doi:10.5964/jnc.v3i2.55
Vogel, S. E., Koren, N., Falb, S., Haselwander, M., Spradley, A., Schadenbauer, P., et al. (2019). Automatic and Intentional Processing of Numerical Order and its Relationship to Arithmetic Performance. Acta Psychologica 193, 30–41. doi:10.1016/j.actpsy.2018.12.001
Vogel, S. E., Remark, A., and Ansari, D. (2015). Differential Processing of Symbolic Numerical Magnitude and Order in First-Grade Children. J. Exp. Child Psychol. 129, 26–39. doi:10.1016/j.jecp.2014.07.010
Vos, H., Sasanguie, D., Gevers, W., and Reynvoet, B. (2017). The Role of General and Number-specific Order Processing in Adults' Arithmetic Performance. J. Cogn. Psychol. 29 (4), 469–482. doi:10.1080/20445911.2017.1282490
Woodcock, R. W., McGrew, K. S., and Mather, N. (2001). Woodcock-Johnson III Test of Achievement Itasaca, IL: Riverside.
Keywords: individual differences, canonical distance effect, reverse distance effect, arithmetic abilities, mathematical competencies
Citation: Vogel SE, Faulkenberry TJ and Grabner RH (2021) Quantitative and Qualitative Differences in the Canonical and the Reverse Distance Effect and Their Selective Association With Arithmetic and Mathematical Competencies. Front. Educ. 6:655747. doi: 10.3389/feduc.2021.655747
Received: 19 January 2021; Accepted: 07 July 2021;
Published: 27 July 2021.
Edited by:
Júlia Beatriz Lopes-Silva, Federal University of Minas Gerais, BrazilReviewed by:
Frank Reinhold, University of Education Freiburg, GermanyDorian Gorgan, Technical University of Cluj-Napoca, Romania
Copyright © 2021 Vogel, Faulkenberry and Grabner. This is an open-access article distributed under the terms of the Creative Commons Attribution License (CC BY). The use, distribution or reproduction in other forums is permitted, provided the original author(s) and the copyright owner(s) are credited and that the original publication in this journal is cited, in accordance with accepted academic practice. No use, distribution or reproduction is permitted which does not comply with these terms.
*Correspondence: Stephan E. Vogel, c3RlcGhhbi52b2dlbEB1bmktZ3Jhei5hdA==