 Laura A. Helbling
 Stéphanie Berger
 Angela Verschoor
- 1Institute for Educational Evaluation, University of Zurich, Zurich, Switzerland
- 2Cito, Institute for Educational Measurement, Arnhem, Netherlands
Multistage test (MST) designs promise efficient student ability estimates, an indispensable asset for individual diagnostics in high-stakes educational assessments. In high-stakes testing, annually changing test forms are required because publicly known test items impair accurate student ability estimation, and items of bad model fit must be continually replaced to guarantee test quality. This requires a large and continually refreshed item pool as the basis for high-stakes MST. In practice, the calibration of newly developed items to feed annually changing tests is highly resource intensive. Piloting based on a representative sample of students is often not feasible, given that, for schools, participation in actual high-stakes assessments already requires considerable organizational effort. Hence, under practical constraints, the calibration of newly developed items may take place on the go in the form of a concurrent calibration in MST designs. Based on a simulation approach this paper focuses on the performance of Rasch vs. 2PL modeling in retrieving item parameters when items are for practical reasons non-optimally placed in multistage tests. Overall, the results suggest that the 2PL model performs worse in retrieving item parameters compared to the Rasch model when there is non-optimal item assembly in the MST; especially in retrieving parameters at the margins. The higher flexibility of 2PL modeling, where item discrimination is allowed to vary, seems to come at the cost of increased volatility in parameter estimation. Although the overall bias may be modest, single items can be affected by severe biases when using a 2PL model for item calibration in the context of non-optimal item placement.
Introduction
Multistage test (MST) designs promise efficient student ability estimates by adaptive testing (Hendrickson, 2007; Yan et al., 2014). MST designs consist of several parts (i.e., stages), which, in turn, include multiple item sets—called modules—of varying difficulty (Zenisky et al., 2010; Yan et al., 2014). Students’ performance in the first stage determines whether they receive an easier or more difficult module in the second stage. The decision is based on predefined routing rules. Across test stages, the students are routed based on their performance (i.e., preliminary ability estimates or number of correct items) to item sets of difficulty that match the range of their abilities. Compared to a linear test, this procedure allows for estimating student abilities more precisely (e.g., Yan et al., 2014) and prevents students from becoming discouraged; it assesses their skills based on items which are neither too easy nor too hard (Asseburg and Frey, 2013). Due to the adaptive multistage design, not all items included in the complete test design are solved by all students. The students only encounter item sets that match their ability. Therefore, MST designs are also known as incomplete designs in the literature (Mislevy and Wu, 1996; Eggen and Verhelst, 2011). MST designs have been widely used in practice as they allow for efficient student ability estimates (e.g., Yan et al., 2014), while not requiring the huge item pool a computer adaptive test (CAT; e.g., van der Linden and Glas, 2010) needs, meeting resource constraints in practice (Berger et al., 2019). However, as is with CAT, all item parameters must be known for their optimal test assembly in the MST.
The main goal when designing an MST is to allocate items in such a way that students of differing abilities encounter test modules that encompass items with matching difficulty levels. Hence, setting up an efficient MST requires the optimal placement of items in the test design. Therefore, for optimal item placement within such an MST design, test developers need to know the item difficulties (Glas and Geerlings, 2009). Practical constraints may not yet allow for piloting representative samples prior to actual testing, such as when the parameters of the newly developed items are not known in advance of setting up the MST design (Berger et al., 2019). Thus, the optimal placement of newly developed items may depend mainly on the expertise and experience of the test developers and/or other involved experts. Several studies have investigated the accuracy with which experts, such as test developers, content experts, or item authors, can rate item difficulty, and they have found moderate to high correlations between ratings and empirical item difficulties (e.g., Bejar, 1983; Hambleton and Jirka, 2006; Sydorenko, 2011; Wauters et al., 2012). We conclude from these findings and from our own practical experiences that the distribution of items across modules of different target difficulties can deviate in a practical setting from the optimal distribution observed in a theoretical setting, where the difficulty of all items is known in advance (see also Berger et al., 2019).
The aim of this study was to evaluate how well item parameters of newly developed test items can be recovered within concurrent calibration in incomplete designs (Mislevy and Wu, 1996; Eggen and Verhelst, 2011) using the Rasch and 2PL models (e.g., De Ayala, 2009; Wu et al., 2016). In particular, we investigated how the non-optimal placement of new items impairs the estimation of the item parameters. In a simulation approach embedded in a practical context, we compared Rasch and 2PL modeling in recovering item parameters in a simple two-stage design: i) when the newly developed items for calibration are placed to match the student’s ability range during encounters with respective test modules and ii) when placement is non-optimal. We formulated tentative assumptions on bias issues arising in MST calibration under the practical constraints of unknown item placement.
Linking Periodic High-Stakes Assessments Over Time
In periodic high-stakes testing, test forms need to be regularly updated to prevent item disclosure and thus to guarantee test fairness. However, it is often necessary to link new test forms to the existing reporting scale so that test scores are comparable across years (Kolen and Brennan, 2004). A methodological approach that is often used to link test forms across multiple administrations is item response theory (IRT; e.g., De Ayala, 2009). IRT refers to a family of models, which express the probability of a student solving an item correctly as a function of the student’s ability and item difficulty (Lord, 1980). The Rasch model may be considered as a special case in this regard (Mellenbergh, 1994). IRT is a powerful method for linking test forms because it takes students’ responses to every single item into account for estimating student’s ability, instead of referring to an overall test score. Thereby, student ability can be estimated based on various combinations of different items under the condition that all items belong to the same scale and thus represent the same underlying unidimensional construct (i.e., ability; e.g., Wainer and Mislevy, 2000; Rost, 2004).
Within this framework, it is possible to expand a scale or item pool by aligning new items with the existing scale. Generally, two calibration procedures exist for mapping the parameters of items from different test administrations to a common IRT scale: separate calibration with equating and fixed parameter calibration (Kolen and Brennan, 2004; Kim, 2006). Both procedures require the test forms to be linked through common items—that is, anchor items—which are included in both test forms.
Separate calibration with equating entails estimating parameters for each test form separately and subsequently equating different forms by transforming the parameters into a common scale through linear transformations (see Kolen and Brennan, 2004; for an overview). The anchor items thereby serve as the basis for determining the transformation parameters. Under the fixed parameter calibration procedure (Kim, 2006; Keller and Keller, 2011; Keller and Hambleton, 2013), item calibration starts with a base assessment or scale with known item parameters. All parameters of the anchor items are fixed to their known parameters when calibrating a new related test form.
Practical Constraints in Developing Optimal Multistage Test
MST is a powerful test design that combines the advantages of linear and adaptive testing (Yan et al., 2014). MST offers test developers the possibility of reviewing the test prior to test administration, and students have the option to revise their answers within test modules, which is difficult to accomplish with fully adaptive CAT. Further, several studies have shown that MST are more efficient than linear tests in estimating student ability owing to closer alignment between item difficulty and student ability (e.g., Yan et al., 2014). Such an alignment is also advantageous from the viewpoint of estimating item difficulty more precisely (Glas and Geerlings, 2009; Eggen and Verhelst, 2011; Zwitser and Maris, 2015).
To design an optimal MST, item parameters should be known during the construction of a new test form. However, in some practical situations, pretesting of items, including item
Calibration, is complicated by limited financial or time resources. In particular, item pretesting is tedious for schools because they have packed time schedules, and students and teachers often get only very limited or even no feedback from pretests. Furthermore, item calibration based on pretests can also impair the accuracy of the item calibration, because students are less motivated to show their best performance during pretests than during actual high-stakes tests (Mittelhaëuser et al., 2015).
An alternative approach to pretesting is to include new uncalibrated items directly in the high-stakes test and to calibrate these items at the end of the test administration period prior to reporting. An advantage of this approach is that the item parameters are estimated under realistic conditions. Furthermore, “real” administrations often include larger student samples than pretests, which provide more information for estimating the item parameters accurately. Pretesting new items during a high-stakes test is complicated when using an MST design because test developers have no guarantee that they will find the optimal position for the new items in the MST design. Instead of empirical item parameters, they have to rely on expert judgments, which might be biased (e.g., Bejar, 1983; Hambleton and Jirka, 2006; Sydorenko, 2011; Wauters et al., 2012). As a consequence, the new items might end up in a non-optimal test module, which can, in turn, result in biased parameter estimates (Berger et al., 2019).
Only a few studies have investigated the lack of knowledge about item difficulty prior to calibration and they did so mainly based on a small number of field-test items during the administration of operational CAT (e.g., Ali and Chang, 2014; Kingsbury, 2009). Makransky and Glas (2010) explored different strategies for automatic online calibration including items of unknown parameters. However, the focus of this study was mainly on student ability estimates rather than on the estimation of the item parameters (cf. Ali and Chang, 2014). Most studies that have compared the efficiency of incomplete calibration designs have assumed item parameters to be known (e.g., Berger, 1991; Stocking, 1988). A recent study by Berger et al. (2019) investigated the efficiency of targeted linear and targeted MST calibration designs under the condition of missing empirical item parameters during test construction. They found that misplaced items were generally estimated less accurately under the Rasch model. This paper builds on the study of Berger et al. (2019) in focusing on non-optimal item assembly in MST calibration but goes beyond the former study by comparing the performance of 2PL to Rasch modeling in such settings.
Accuracy in Item Calibration Based on Multistage test Designs
Calibrating new items in MST designs is challenging because the accuracy of the item parameter estimates depends on the items’ position in the calibration design. Furthermore, the optimal calibration design depends on the model or, more specifically, on the item parameters that have to be estimated.
In this study, we focused on the Rasch and the 2PL models. The Rasch model can be expressed as:
where
The 2PL model can be expressed as:
where
Methods
The Present Study
Monte Carlo simulation studies have proven to be a promising methodological approach for evaluating how validly IRT-based methods can be applied to specific test designs when faced with (practical) constraints (e.g., Feinberg and Rubright, 2016; Bulut and Sünbül, 2017). To evaluate potential bias when MST designs include item calibration, we conducted a simulation study.
Practical Context
We embedded our simulation study in the practical context of the high-stakes educational assessments (Checks) in the northwestern area of Switzerland, where a population of approximately 10,000 students were tested annually via computer-based MST in several school subjects (e.g., Berger et al., 2019). The MST design consisted of four stages and five difficulty levels. To prevent item disclosure and secure item quality, the item pool for each MST was updated every year1. As practical constraints make piloting for item calibration impossible, new items were directly included in the running MST. By means of anchor items, the new items were linked to the existing 2PL scale, which ensured the comparability of test results across years. In practice, a complex MST was used.
Calibration Sample and Multistage test Calibration Design
Following the practical context, the student ability parameters (θ) were assumed to be normally distributed and sampled from N∼(0,1) for a population of N = 10,000 students. However, to ease the interpretation of our results, we chose to simulate a simpler two-stage design instead of the four-stage design used in practice2. In total, the simulated two-stage test included 225 items, of which each simulee solved 45 items. Of the 225 items, 100 were assumed to be newly developed items, which were calibrated alongside of 125 anchor items.
In the first stage, the simulees were randomly assigned to one out of five starting modules, which included items randomly spread across the complete range of student abilities3. Hence, each random starting module was completed by N ≈ 2,000 randomly assigned simulees. Based on the simulated student responses to these starting module items, initial abilities were estimated as weighted likelihood estimates (WLE) (Warm, 1989) and used to route the simulees to the modules in the second stage. There were five test modules with different difficulty levels in the second stage. The routing cut scores were defined such that the simulees were divided into ability quintiles and assigned to the second-stage test module, with items of difficulty matching the range of student abilities in the respective student ability quintile. Hence, each item in the test was solved by an equal number of approximately 2,000 students. This avoided differences in bias in parameter estimates due to unequal numbers of simulees encountering the items (see, e.g., van der Linden and Glas, 2000). The difficulties of the items in these second-stage modules were randomly drawn from the related target ability range of the underlying student ability distribution. Hence, whereas items in the starting modules were solved by simulees distributed randomly across all student abilities, the items in the second-stage modules were encountered only by simulees from separate ability quintiles.
We assumed that for the starting modules, all item parameters were known in advance. Thus, the starting modules, which were the basis for the initial ability estimates and the routing of the simulees to the second-stage modules, were assumed to consist of well-proven items only. In the second stage, however, we simulated the inclusion of items with unknown item parameters. These newly developed items were calibrated alongside a share of previously calibrated anchor items.
As the second stage was adaptive and not all simulees concluded all modules but were routed to the best-matching module based on their initial ability estimates, there were missings by design in the complete MST. Missings in MST designs can be assumed to be missing at random (MAR) (see, e.g., Craig, 2010: 6–7). Hence, the item parameters can be recovered without bias using marginal maximum likelihood estimation (MML) in concurrent calibration in such incomplete calibration designs (see Eggen and Verhelst, 2011). In our simulations, we recovered the parameter estimates for the unknown (newly developed) items by applying a fixed parameter calibration (Kim, 2006), where we calibrated the new items alongside some anchor items, which we fixed at their “true” parameters.
Simulation Conditions
In our simulations, we distinguished between two main scenarios: optimal vs. non-optimal placement of new items in the MST design. Within these two scenarios, we further varied the length of the starting module (5 vs. 20 items), the distribution of the item difficulty parameters (normal vs. uniform), and the IRT model (Rasch as a baseline vs. 2PL). In total, 16 different simulation conditions were constructed. We fully crossed the simulation conditions.
Variation in the Placement of New Items (Optimal vs. Non-optimal)
In Rasch modeling item calibration has been found to be most efficient if the difficulty of the items requiring calibration matched the student abilities (Stocking, 1988; Berger, 1991; Berger et al., 2019). In the optimal condition (Optimal Placement of Items for Concurrent Calibration in Incomplete Designs), the item difficulty parameters for the new items assembled in the second-stage modules were allocated to the second-stage module, matching the student ability quintile that encountered the respective module. In other words, the item difficulties in the second-stage modules were all within the range of the students’ abilities on the encountered items.
In the non-optimal condition (Non-Optimal Placement of Items for Concurrent Calibration in Incomplete Designs), we assumed some misplacement of the new items in the test modules in the second stage, so that not all of the items matched the simulees’ abilities routed to the respective test modules. Using the same item pool as for Optimal Placement of Items for Concurrent Calibration in Incomplete Designs, in Non-Optimal Placement of Items for Concurrent Calibration in Incomplete Designs, the item allocation in the second stage differed for the non-optimal condition. About half of the newly developed items were allocated to adjacent modules. This resulted in an overlap in item difficulty parameters across adjacent test modules in the second stage and mirrors the practical situation of some mistakes in expert ratings of item assembly when the parameters are not known. In comparison with the optimal placement of the items in Optimal Placement of Items for Concurrent Calibration in Incomplete Designs, this allows us to evaluate how the non-optimal placement of items in test modules affects the recovery of their item parameters.
Variation in the Length of the Starting Module (Short vs. Long)
There are five starting modules for student routing and five second-stage modules. Within the two main scenarios, we varied the length of the starting modules between 5 and 20 items. When there were short starting modules of five items the second-stage modules consisted of 40 items each (5*5–5*40). When there were long starting modules of 20 items the second-stage modules consisted of 25 items each (5*20–5*25). Thus, when simulating short and long starting modules test length of 45 items is the same. Also the total number of items included in the MST, which is 225 items, is the same. Simulating the short starting modules of five items mirrors a scenario in which initial student ability estimates were less reliable compared to the estimates based on the longer starting modules of 20 items. Thus, when the initial starting modules were very short, the classification of simulees into ability quintiles was more error prone, and there was more heterogeneity in the student abilities in the respective groups routed to the second stage modules. Thus, the items placed in the second-stage modules were encountered by students of broader ability distribution, such as when initial routing modules were long, and divided the students more concisely into their respective ability quintile.
The locations of these anchor items differed according to the length of the starting modules. With short starting modules, 25 of the anchor items were placed in the starting modules (five modules and five items in each module); the rest of the 100 anchor items were equally spread across the second-stage modules (20 anchor items in each module). Each second-stage module included 20 newly developed items (5 modules and 20 new items). The sub-scenario including the long starting modules, resulted in 100 anchor items being placed in the starting modules (5 modules and 20 items); the rest of the 25 anchor items were equally spread across the second-stage modules (five anchor items in each module). Each second-stage module again included 20 newly developed items (5 modules and 20 new items).
Variation of Distribution of Difficulty Parameters (Normal vs. Uniform)
Simulating different distributions of difficulty parameters of the items assembled in the modules in the second stage allows for insight into the recovery of item parameters that more or less perfectly mirror the student ability distribution in the test modules. When the item parameters assembled were drawn from quintiles of the underlying normal distribution of student abilities, the item difficulty distribution in the second-stage modules matched the student ability distribution in the respective ability quintiles routed to these modules. The simulees routed to the second-stage modules encountered only a few items measured at the margin. When the items were drawn uniformly within the range of the student ability quintiles and allocated to the second-stage modules, the simulees encountered items that were equally spread over the complete range of the ability distribution in their respective quintiles. Therefore, more often, there were items that measured at the margins and thus can be solved by the majority or only a minority of the simulees routed to the second stage modules. In a practical MST setting, particularly when there are multiple stages, item difficulties may explicitly overlap between modules to allow students to be upward or downward mobile throughout test routing.
Variation of Item Response Theory Model (Rasch vs. 2PL)
Depending on the IRT model, different datasets of student responses were generated. For the Rasch model, item discrimination parameters (a) were set to 1. For the 2PL model as a data-generating mechanism, the item discrimination parameters (a) were sampled from
The module-level test information for the baseline scenarios of optimally placed items using Rasch modeling is shown in the Supplementary Figures S1–S8.
Evaluation Criteria
For the evaluation of the recovery of item parameters, we used bias and root-mean square error (RMSE) (see Bulut and Sünbül, 2017)4. These can be denoted as follows:
where K is the total number of items in the test and
Results
Scenario 1. Optimal Placement of Items for Concurrent Calibration in Incomplete Designs
In Table 1, we report the bias statistics across 1,000 simulation runs applying Rasch or 2PL modeling for the concurrent calibration in Optimal Placement of Items for Concurrent Calibration in Incomplete Designs, where, upon random starting modules of differing lengths (short vs. long), simulees were (within their ability quintiles) routed to second-stage modules encompassing randomly drawn items matching optimally in difficulties to the range of the simulees’ abilities. The items in the second-stage modules were either drawn from a normal or a uniform distribution. Hence, in Table 1, we assumed that the difficulty of the newly developed items in the second stage were successfully rated by experts, resulting in an optimal allocation to the second-stage modules. The items used as anchor items for linking (see Methods section) were not included in calculating the bias statistics.

TABLE 1. Optimal item allocation in second-stage modules.
Focusing first on the results of the Rasch model, we found the bias for item difficulty (b) to be rather small. Generally, as demonstrated by the bias (b) statistic, the bias did not have a clear direction for either of the sub-scenarios (see Table 1). It was consistently close to zero. The RMSE statistic showed that, overall, the absolute deviations of the estimated parameters from the true parameters (in both negative and positive directions) were also similarly small (around 0.05) for the different sub-scenarios. Hence, using Rasch modeling in the context of the optimal item allocation of the newly developed items in the second-stage modules allowed for a good recovery of item parameters. The length of the starting modules did not matter, and the estimates seemed unaffected by a somewhat larger share of items measuring at the margins (when item parameters are uniformly distributed within modules). Focusing on the 2PL bias statistics for the recovery of item difficulty parameters (b) in comparison with those for Rasch modeling, we similarly found no clear direction in bias. Deviations occurred in both negative and positive directions, as shown in the small values of the bias (b) statistic compared to the larger values in the RMSE (b) statistic. Regarding the RMSE statistic for the difficulty parameters (b), we observed that bias in b was somewhat larger when we recovered uniformly distributed difficulty parameters compared to when item difficulties mirrored the underlying normal distribution of student abilities. Thus, it seems that when there was a larger share of items measuring at the margins of the simulees’ abilities that encountered the items, the 2PL model was somewhat more prone to error in the recovery of the item difficulties compared to the Rasch model. Focusing on the recovery of the discrimination parameter (a), we again found that bias has no clear direction. Thus, there seems to be no consistent over- or underestimation of the slope parameter (a). As shown by the RMSE (a) statistic, there was, however, some variation in the recovery of the discrimination parameters of the items, depending on the length of the starting modules. It seems that when there was a longer starting module, which led to more accurate and thus more homogeneous ability groups in the second-stage modules, the bias in discrimination tended to be larger. Thus, it seems that discrimination (a) is less well recovered when there is less spread in abilities.
Overall, when the placement of newly developed items was close to optimal, both Rasch and 2PL modeling seemed, on average, to recover the item difficulty parameters quite well in concurrent calibration in incomplete designs. The bias emerging in the 2PL modeling was slightly larger compared to the bias encountered by Rasch modeling for the item difficulty estimates, as can be seen by the somewhat larger RMSE (b) statistics. In 2PL modeling, decreased variation in student ability seems to correlate with increased bias in the recovery of the discrimination parameter (Berger, 1991; Stocking, 1988). As these statistics only provide insight into the average bias, we evaluated how many of the individual items were affected by severe bias in the recovery of difficulty parameter b. For Rasch modeling, less than 0.01% of the items calibrated were found to deviate by more than 0.2 (one-fifth of a standard deviation of the student ability distribution) from their “true” population difficulty parameter values. Applying a 2PL model, it was about 3% of the newly developed items when there was a longer starting module in conjunction with items measuring at the margins (uniform distribution within modules). Hence, in 2PL modeling, there seem to be a few more severely biased items. A further evaluation of the affected items suggested that more severe bias mainly affected items that measured at the lower and upper margins of the ability distribution. Although the percentage of correct scores on these items tended to be somewhat at the lower or upper ends, it is noteworthy that they were not extraordinarily low or high. On average, the more severely biased items were still correctly or incorrectly answered by around 18% of the simulees who encountered them.
Scenario 2. Non-Optimal Placement of Items for Concurrent Calibration in Incomplete Designs
In Table 2, we report the bias statistics across 1,000 simulation runs applying Rasch or 2PL modeling for the concurrent calibration in Non-Optimal Placement of Items for Concurrent Calibration in Incomplete Designs, where, upon random starting modules of differing lengths (short vs. long), the simulees were (within their ability quintiles) routed to second-stage modules encompassing randomly drawn items matching non-optimally in difficulties to the range of simulees’ abilities. The items in the second-stage modules were either normally or uniformly distributed, and half of the new items5 were misplaced across adjacent modules. The same item pool was used as in Optimal Placement of Items for Concurrent Calibration in Incomplete Designs. The only difference is that, in Non-Optimal Placement of Items for Concurrent Calibration in Incomplete Designs, we assumed that there was some misplacement of the newly developed items in the second stage across adjacent modules, resulting in an overlap of item difficulties between adjacent modules. The items used as anchor items were not included in calculating the bias statistics. Table 3 is based on the same simulation results of Non-Optimal Placement of Items for Concurrent Calibration in Incomplete Designs but displays in some more detail the discrepancy in bias statistics across items that were placed optimally in the second-stage modules and those that were misplaced.
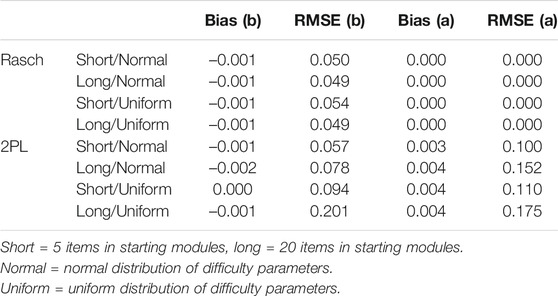
TABLE 2. Non-optimal item allocation in second-stage modules.
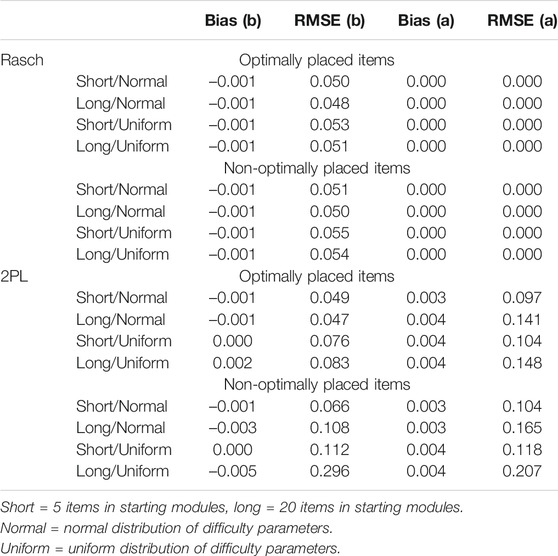
TABLE 3. Optimally vs. non-optimally placed items compared.
Focusing on Table 2 and the results for the Rasch model, we found that bias for item difficulty (b) using Rasch modeling remained rather small even in the context of non-optimally placed items. Again, as shown in the bias (b) statistic, the bias was consistently close to zero and showed no clear direction. The RMSE (b) statistic showed that, overall, the absolute deviations of the estimated parameters from the true parameters (in both negative and positive directions) were, again, similarly small (around 0.05) for the different sub-scenarios. Results for Optimal Placement of Items for Concurrent Calibration in Incomplete Designs (optimal placement, Table 1) and Non-Optimal Placement of Items for Concurrent Calibration in Incomplete Designs (non-optimal placement, Table 2) were very similar when using a Rasch model. As shown in Table 3 for Rasch modeling, we observed that for both optimally placed and non-optimally placed items, the bias and RMSE remained small. Hence, Rasch modeling seems rather robust toward the non-optimal placement of items; it also remained robust toward the non-optimal placement of items when starting modules differed in length and when measuring at the margins of the student distribution encountering the items.
In contrast, this unconstrained robustness did not seem to hold unequivocally for 2PL modeling. As Table 2 shows, when the same item difficulty parameters were recovered using 2PL modeling, the absolute bias measured by the RMSE (b) tended to be larger, though there was no clear direction for the bias (bias b). 2PL still performed ok in the case of non-optimally allocated items when (i) the routing was not very precise (short starting modules), such that there were rather heterogeneous groups in terms of their underlying abilities routed to the second-stage modules, and when (ii) the vast majority of the items did not measure at the margins (item difficulties drawn from normal distribution). Here, the RMSE (b) statistic of 0.057 was still small, even though there were some non-optimally allocated items. However, when routing was more precise (long starting modules) and, especially, in combination with items measuring at the margins of the ability distribution (outside the range of the ability distribution due to the non-optimal placement of items), more severe bias in the parameter recovery occurred in using 2PL modeling. In the case of a long starting module in conjunction with non-optimally placed items, of which some were too easy while others were too hard for the respective simulees encountering the items, the RMSE (b) statistic was 0.201, showing that, on average, the recovered parameter estimates clearly deviated from their true difficulty parameters. Increased bias in difficulty parameters (b) in long compared to short starting modules may be interpreted in relation with bias in the retrieval of the slope parameter (a). For the recovery of the discrimination parameter (a) in 2PL modeling, the simulations again showed increased bias in terms of absolute deviations in both negative and positive directions (RMSE) when the routing to the second-stage test modules was more concise due to longer starting modules. This suggests that the decreased variation in student abilities encountering the items needing calibration leads to a bias in the slope parameter (a), which also relates to bias in the recovery of the difficulty parameter (b) (see, e.g., Thissen and Wainer, 1982; Stocking, 1988; Berger, 1991). Hence, bias in the discrimination parameter (a) seems to depend on the variance in student abilities and to further correlate with bias in the difficulty parameter (b). In scenarios of long routing modules (concise routing) and when there is non-optimal item allocation, the Rasch model clearly outperforms the 2PL model in the recovery of item difficulty parameters.
The more detailed comparison of the recovery of item parameters across optimally and non-optimally placed items in 2PL modeling (Table 3) clearly revealed that the non-optimally placed items were badly recovered. The recovered parameters were clearly error prone when there were longer starting modules and more items measuring at the margin of or even outside the abilities of the simulees encountering the items (uniform distribution). Thus, it seems that the non-optimal placement of items and their recovery via a 2PL model did not fit well in the context of an MST, where student ability grouping is “optimized” across stages. Rasch is seemingly more robust in this regard.
How many item difficulty parameters were rather badly recovered? Again, less than 0.01% of the items calibrated using the Rasch model were found to deviate by more than 0.2 (one-fifth of a standard deviation of the student ability distribution) from their “true” parameter values. Using 2PL modeling in the context of non-optimal item allocation, we found 1–8% of all calibrated items deviated by more than 0.2 from their “true” difficulty parameter values, depending on the sub-scenario. Clearly, a worst case was when there was concise routing simulated by longer starting modules in conjunction with non-optimally placed items measuring at the margins across adjacent modules. In this scenario, 8% of the items were very badly recovered in terms of the difficulty parameter (b). Most of the items that were more severely affected measured at the lower and upper margins of the student ability distribution and included items that were non-optimally placed in the second-stage modules, which were items that should have been placed in an adjacent module had we known their parameters. Yet, calibration bias did not solely affect items with very high or very low percentage correct scores. On average, the more severely biased items in terms of difficulty were correctly or incorrectly answered by 20% of the simulees who encountered these items. This seems to be a fair share. Further, we found a positive correlation (r = 0.6) between the absolute bias in discrimination and the absolute bias in the difficulty parameters, suggesting that biases in the recovery of these parameters are related. Overall, these results seem indicative of the greater volatility of the 2PL model compared to the Rasch model in retrieving unbiased item parameters when item calibration is conducted in an MST design, where there is reduced variation in student abilities encountering the items in conjunction with potential non-optimal placement of newly developed items in terms of their difficulty. When there is item misallocation in an MST the results of our simulations suggest that the 2PL model generally performs worse compared to Rasch modeling.
Discussion
Allowing for efficient student ability estimates (e.g., Yan, von Davier and Lewis, 2014), MST designs have been widely used in practice (Berger, Verschoor, Eggen, and Moser, 2019). Across test stages, the students are routed based on their performance (i.e., preliminary ability estimates) to item sets with difficulty ranges that match their abilities. Compared to a linear test, this procedure allows for estimating student abilities more precisely (e.g., Yan et al., 2014) and prevents students from becoming discouraged (Asseburg and Frey, 2013). To ensure test quality in practice, changing MST forms is required because publicly known test items impair accurate student ability estimation, and items of bad model fit need to be continually replaced by newly developed items. The optimal placement of items in MST designs requires knowledge of all item parameters. Efficiency is increased in that items are optimally placed within the MST design such that students (within specific ability ranges) across different test stages are routed to modules encompassing (discriminant) items of similar difficulties. For schools, participation in the actual educational assessments alone, however, may be an organizational burden, such that they are not willing to participate in any piloting studies for the calibration of the newly developed items. Thus, under practical constraints, the calibration of these new items may take place on the go during the actual test, which is within the framework of the actual MST. The difficulty of the new items may therefore only be guessed by experts for the setup of the MST. This makes it challenging to assemble new items into the test modules and to assign these modules to students with corresponding abilities within MST designs. If the placement of new items needing calibration in the multistage structure depends on expert rating, this can, in practice, result in the non-optimal placement of items that is far from their optimal location had the parameters been known. This study investigated the extent to which such a practical constraint on pretesting in conjunction with the non-optimal placement of items in an MST design may result in a posteriori parameter calibration error. Using a simulation approach we focused on the performance of Rasch vs. 2PL modeling in retrieving item parameters when items are for practical reasons non-optimally placed in the MST.
Incomplete designs, such as the MST, meet assumptions of MAR. Hence, theoretically, item parameters can be retrieved without bias using marginal maximum likelihood in concurrent calibration in incomplete designs (see Eggen and Verhelst, 2011; Mislevy and Wu, 1996). In the context of non-optimal item assembly, however, our practical experiences fueled doubts regarding the volatility of parameter estimates retrieved by 2PL modeling. In an intuitive and applied fashion, this study sought to shed light on bias issues arising when, due to practical constraints, piloting is not an option, and item calibration has to take place within the MST design. In a simulation approach, we showed that parameters recovered by Rasch modeling were less affected by bias in the context of non-optimal item placement in a two-stage test compared to 2PL modeling. Generally, the 2PL model performed worse when items were non-optimally assembled in the MST compared to the Rasch model; particularly in measuring at the margins of the student distribution. Although 2PL modeling allowed for weaker assumptions on (unequal) item discrimination, which in practice are more easily met, this increased flexibility seems to come at the price of increased volatility in the recovery of accurate parameters in imperfect settings. Notably, items that measured at the margins of the simulee’s ability distribution in test modules were severely affected by bias when they were recovered using a 2PL model. In general, items measuring at the lower or upper ends of the ability distribution did not seem to be recovered with high accuracy using a 2PL model. In parallel to previous recommendations for the Rasch model in the context of small calibration samples (see Lord, 1983), calibration in incomplete designs in the practical context of non-optimal item placement also seems more robust with the Rasch model. Hence, from a practitioner’s perspective, there remains a trade-off between the strict assumption of discrimination in the Rasch model and the flexibility at the price of higher volatility offered by the 2PL model in this regard.
Overall, the items that were more severely biased when retrieved using a 2PL model tended to have percentage correct scores at the lower and upper ends. Yet, on average, 19% of simulees answered these items correctly or incorrectly, which does not seem exceedingly high. Hence, severe bias did not occur only in items that were correctly or incorrectly solved by a very small minority only. The results also indicate that the more precise the routing, the worse the recovery of the discrimination parameter. For a 2PL model to recover item parameters correctly, a reduced variation in student ability may pose a problem. As the main target in MST is the precise routing of students into increasingly homogeneous student groups across test modules, this seems to conflict with an accurate recovery of the discrimination parameter when there are items needing calibration. When homogeneity in student ability groups increased, the misplacement of items in terms of their difficulty also became more severe. Overall, using 2PL modeling, the calibration of items of unknown item parameters in the framework of an MST seems prone to errors.
When a 2PL model is the model of choice and item calibration has to be undertaken in the MST, a tentative idea warranting future research may be the placement of items needing calibration in modules where there is some heterogeneity in student abilities, for example, with introducing some randomness in student routing. Yet, less adaptivity in MST designs may result in the trade-off of less accurate student ability estimates. When the aim is individual diagnostics and the new items are the basis for the evaluation, test fairness for all students is of concern, such that “mis-routing” of only a share of students is not an option. Future research should elucidate whether some bias in item parameter estimates due to the misplacement of items in the MST instead of reduced adaptivity in the test may be better or worse for the recovery of student abilities. Non-optimal item assembly in routing modules also interferes with concise routing of students, which prevents efficient ability estimates. Whether newly developed items should be placed in initial or later modules, where the former affects routing and the latter encompasses increased homogeneity in student samples encountering these items is an area of further concern. In addition, we have not used automated test assembly (ATA) for the assembly of items of known parameters in conjunction with the items of unknown parameters. This may also be an interesting line to follow for future research; of how to best use ATA in MST, when there is uncertainty of some of the item parameters to counteract bias, when, for example, using a 2PL model for parameter estimation. All in all this study highlighted in a very applied fashion the volatility of 2PL calibration in MST when items are non-optimally placed and in retrieving item parameters at the margins. Future research should focus more in-depth and in more detail on the severity of individual item bias by degree of item misplacement; and may do so taking into account routing precision, which leads to reduced variance of student abilities across test modules and seems to interfere with the retrieval of the discrimination parameter in the 2PL model.
Data Availability Statement
The original contributions presented in the study are included in the article/Supplementary Material, further inquiries can be directed to the corresponding author.
Author Contributions
SB and LH set up the simulations and wrote the article in close collaboration. LH ran the simulations. AV reviewed the article and discussed the setup of the simulations and the results.
Funding
The work was supported by The University of Zurich funded some of the publication costs.
Conflict of Interest
Author AV was employed by the company Cito.
The remaining authors declare that the research was conducted in the absence of any commercial or financial relationships that could be construed as a potential conflict of interest.
Supplementary Material
The Supplementary Material for this article can be found online at: https://www.frontiersin.org/articles/10.3389/feduc.2021.679864/full#supplementary-material
Footnotes
1In the CHECKS no module reaches exposure. To ensure disclosure items across all stages have to be replaced by newer ones from time to time.
2The main findings remained the same when simulating a more complex four-stage test design.
3We applied stratified random sampling, where the items were evenly drawn from each student ability quintile in the underlying student ability distribution to cover the complete range of student abilities in each starting module.
4The bias and RMSE statistics were calculated only on the basis of the newly developed items (excluding all items used as anchors).
5in the top and bottom margin modules a quarter of the items (see Supplementary Figures S1,S2).
References
Ali, U. S., and Chang, H.-H. (2014). An Item-Driven Adaptive Design for Calibrating Pretest Items. Princeton, NJ: Educational Testing Service. (ETS Research Reports Series, RR-14-38).
Asseburg, R., and Frey, A. (2013). Too Hard, Too Easy, or Just Right? the Relationship between Effort or Boredom and Ability-Difficulty Fit. Psychol. Test Assess. Model. 55, 92–104.
Bejar, I. I. (1983). Subject Matter Experts' Assessment of Item Statistics. Appl. Psychol. Meas. 7 (3), 303–310. doi:10.1177/014662168300700306
Berger, M. P. F. (1991). On the Efficiency of IRT Models When Applied to Different Sampling Designs. Appl. Psychol. Meas. 15 (3), 293–306. doi:10.1177/014662169101500310
Berger, S., Helbling, L., König, N., Tomasik, M. J., and Moser, U. (2019a). Technischer Bericht Zum Check S2 2019. Zürich: Institut für Bildungsevaluation.[Technical report on the Check S2 2019].
Berger, S., Verschoor, A. J., Eggen, T. J. H. M., and Moser, U. (2019). Efficiency of Targeted Multistage Calibration Designs under Practical Constraints: A Simulation Study. J. Educ. Meas. 56 (1), 121–146. doi:10.1111/jedm.12203
Bulut, O., and Sünbül, Ö. (2017). R Programlama Dili Ile Madde Tepki Kuramında Monte Carlo Simülasyon Çalışmaları. J. Meas. Eval. Edu. Psychol. 8 (3), 266–287. doi:10.21031/epod.305821
Chalmers, R. P. (2012). Mirt: A Multidimensional Item Response Theory Package for the R Environment. J. Stat. Softw. 48 (6), 1–29. doi:10.18637/jss.v048.i06
De Ayala, R. J. (2009). The Theory and Practice of Item Response Theory. New York, NY: Guildford Press.
Doebler, A. (2012). The Problem of Bias in Person Parameter Estimation in Adaptive Testing. Appl. Psychol. Meas. 36 (4), 255–270. doi:10.1177/0146621612443304
Eggen, T. J. H. M., and Verhelst, N. D. (2011). Item Calibration in Incomplete Testing Designs. Psicológica 32 (1), 107–132.
Glas, C. A. W., and Geerlings, H. (2009). Psychometric Aspects of Pupil Monitoring Systems. Stud. Educ. Eval. 35 (2), 83–88. doi:10.1016/j.stueduc.2009.10.006
Hambleton, R. K., and Jirka, S. J. (2006). “Anchor-Based Methods for Judgmentally Estimating Item Statistics,” in Handbook of Test Development. Editors. Downing, S. M., and Haladyna, T. M. (Mahwah, NJ: Lawrence Erlbaum Associates), 399–420.
Hendrickson, A. (2007). An NCME Instructional Module on Multistage Testing. Educ. Meas. Issues Pract. 26 (2), 44–52. doi:10.1111/j.1745-3992.2007.00093.x
Keller, L. A., and Hambleton, R. K. (2013). The Long-Term Sustainability of IRT Scaling Methods in Mixed-Format Tests. J. Educ. Meas. 50 (4), 390–407. doi:10.1111/jedm.1202510.1111/jedm.12025
Keller, L. A., and Keller, R. R. (2011). The Long-Term Sustainability of Different Item Response Theory Scaling Methods. Educ. Psychol. Meas. 71 (2), 362–379. doi:10.1177/0013164410375111
Kim, S. (2006). A Comparative Study of IRT Fixed Parameter Calibration Methods. J. Educ. Meas. 43 (4), 355–381. doi:10.1111/j.1745-3984.2006.00021.x
Kingsbury, G., and Gage, (2009). “Adaptive Item Calibration. A Process for Estimating Item Parameters Within a Computerized Adaptive Test,” in Proceedings of the 2009 GMAC Conference on Computerized Adaptive Testing. Editor. Weiss, D. J. Available at: http://www.iacat.org/sites/default/files/biblio/cat09kingsbury.pdf. Accessed September 11, 2017.
Kolen, M. J., and Brennan, R. L. (2004). Test Equating, Scaling, and Linking: Methods and Practices. New York: Springer. doi:10.1007/978-1-4757-4310-4
Lord, F. M. (1980). Applications of Item Response Theory to Practical Testing Problems. New York, NY: Routledge.
Lord, F. M. (1983). “Small N Justifies Rasch Model,” in New Horizons in Testing: Latenttrait Theory and Computerized Adaptive Testing. Editor D. J. Weiss (New York: Academic).
Makransky, G., and Glas, C. A. W. (2010). An Automatic Online Calibration Design in Adaptive Testing. J. Appl. Test. Technol. 11 (1), 1–20.
Mellenbergh, G. J. (1994). Generalized Linear Item Response Theory. Psychol. Bull. 115, 300–307. doi:10.1037/0033-2909.115.2.300
Mislevy, R.J., and Wu, P. (1996). Missing Responses and IRT ability estimation: Omits, choice, time limits, and adaptive testing (ETS Research Reports Series No. RR-96-30-ONR). Princeton, NJ: Educational Testing Service.
Mittelhaëuser, M.-A., Béguin, A. A., and Sijtsma, K. (2015). The Effect of Differential Motivation on IRT Linking. J. Educ. Meas. 52, 339–358. doi:10.1111/jedm.12080
Rasch, G. (1960). “Probabilistic Models for Some Intelligence and Attainment Tests,” in Kopenhagen. Dänemark: Danmarks Paedagogiske Institut.
Rost, J. (2004). Lehrbuch Testtheorie – Testkonstruktion. 2. Aufl. Bern, Switzerland: Verlag Hans Huber (Psychologie Lehrbuch).
Stocking, M. L. (1988). Specifying Optimum Examinees for Item Parameter Estimation in Item Response Theory. Princeton, NJ: Educational Testing Service.
Sydorenko, T. (2011). Item Writer Judgments of Item Difficulty Versus Actual Item Difficulty: A Case Study. Lang. Assess. Q. 8 (1), 34–52. doi:10.1080/15434303.2010.536924
Thissen, D., and Wainer, H. (1982). Some Standard Errors in Item Response Theory. Psychometrika 47 (4), 397–412. doi:10.1007/bf02293705
van der Linden, W. J., and Glas, C. A. W. (2000). Capitalization on Item Calibration Error in Adaptive Testing. Appl. Meas. Edu. 13, 35–53. doi:10.1207/s15324818ame1301_2
Veldkamp, B. P., and Verschoor, A. J. (2019). “Robust Computerized Adaptive Testing,” in Theoretical and Practical Advances in Computer-Based Educational Measurement. Editors B.P. Veldkamp,, and C. Sluijter (Cham, Switzerland: Springer), 291–305. doi:10.1007/978-3-030-18480-3_15
Verschoor, A., Berger, S., Moser, U., and Kleintjes, F. (2019). “On-the-Fly Calibration in Computerized Adaptive Testing,” in Theoretical and Practical Advances in Computer-Based Educational Measurement. Editors B.P. Veldkamp,, and C. Sluijter (Cham, Switzerland: Springer), 307–323. doi:10.1007/978-3-030-18480-3_16
Wainer, H., and Mislevy, R. J. (2000). “Item Response Theory, Item Calibration, and Proficiency Estimation,” in (Hg.): Computerized Adaptive Testing. A Primer. 2. Aufl. Editor. Wainer, H. (Mahwah, NJ: Lawrence Erlbaum Associates), 61–100.
Warm, T. A. (1989). Weighted Likelihood Estimation of Ability in Item Response Theory. Psychometrika 54 (3), 427–450. doi:10.1007/bf02294627
Wauters, D., Desmet, P., and van den Noortgate, W. (2012). Item Difficulty Estimation: An Auspicious Collaboration Between Data and Judgment. Comput. Educ. 58 (4), 1183–1193. doi:10.1016/j.compedu.2011.11.020
van der Linden, W. J., and Glas, C. A. W. (2010). Elements of Adaptive Testing (New York, NY: Springer).
Wright, B. D. (1977). Solving Measurement Problems With the Rasch Model. J. Educ. Meas. 14 (2), 97–116. doi:10.1111/j.1745-3984.1977.tb00031.x
Wu, M., Tam, H. P., and Jen, T.-H. (2016). Educational Measurement for Applied Researchers. Theory into Practice. Singapore: Springer. doi:10.1007/978-981-10-3302-5
Yan, D., Lewis, C., and von Davier, A. A. (2014). “Overview of Computerized Multistage Tests,” in Computerized Multistage Testing. Theory and Applications. Editors D. Yan, A.A. von Davier, and C. Lewis (Boca Raton, FL: CRC Press), 3–20.
Yan, D., von Davier, A. A., and Lewis, C. (2014). Computerized Multistage Testing. Theory and Applications. Boca Raton, FL: CRC Press, Taylor & Francis.
Zenisky, A., Hambleton, R. K., and Luecht, R. M. (2010). “Multistage Testing: Issues, Designs, and Research,” in Elements of Adaptive Testing. Editors W.J. van der Linden,, and C.A.W. Glas (New York, NY: Springer), 355–372.
Keywords: multistage test, educational measurement, high-stakes assessments, item calibration, item response theory, Rasch model, 2PL model
Citation: Helbling LA, Berger S and Verschoor A (2021) Flexibility at the Price of Volatility: Concurrent Calibration in Multistage Tests in Practice Using a 2PL Model. Front. Educ. 6:679864. doi: 10.3389/feduc.2021.679864
Received: 12 March 2021; Accepted: 10 May 2021;
Published: 28 May 2021.
Edited by:
Okan Bulut, University of Alberta, CanadaReviewed by:
Halil Ibrahim Sari, Kilis 7 Aralık University, TurkeyRen Liu, University of California, Merced, United States
Copyright © 2021 Helbling, Berger and Verschoor. This is an open-access article distributed under the terms of the Creative Commons Attribution License (CC BY). The use, distribution or reproduction in other forums is permitted, provided the original author(s) and the copyright owner(s) are credited and that the original publication in this journal is cited, in accordance with accepted academic practice. No use, distribution or reproduction is permitted which does not comply with these terms.
*Correspondence: Laura A. Helbling, bGF1cmEuaGVsYmxpbmdAaWJlLnV6aC5jaA==