 Chris C. Martin
 Kenneth D. Locke
- 1Coulter Department of Biomedical Engineering, Georgia Institute of Technology, Atlanta, GA, United States
- 2Department of Psychology, University of Idaho, Moscow, ID, United States
When professors assign group work, they assume that peer ratings are a valid source of information, but few studies have evaluated rater consensus in such ratings. We analyzed peer ratings from project teams in a second-year university course to examine consensus. Our first goal was to examine whether members of a team generally agreed on the competence of each team member. Our second goal was to test if a target’s personality traits predicted how well they were rated. Our third goal was to evaluate whether the self-rating of each student correlated with their peer rating. Data were analyzed from 130 students distributed across 21 teams (mean team size = 6.2). The sample was diverse in gender and ethnicity. Social relations model analyses showed that on average 32% of variance in peer-ratings was due to “consensus,” meaning some targets consistently received higher skill ratings than other targets did. Another 20% of the variance was due to “assimilation,” meaning some raters consistently gave higher ratings than other raters did. Thus, peer ratings reflected consensus (target effects), but also assimilation (rater effects) and noise. Among the six HEXACO traits that we examined, only conscientiousness predicted higher peer ratings, suggesting it may be beneficial to assign one highly conscientious person to every team. Lastly, there was an average correlation of.35 between target effects and self-ratings, indicating moderate self-other agreement, which suggests that students were only weakly biased in their self-ratings.
Introduction
When professors assign group work to students, they must grade students on work that they cannot observe. Many professors use summative peer evaluations to handle this challenge (Ohland et al., 2012; Riebe et al., 2016). If students complete those evaluations honestly and professors follow best practices, the scores should reflect the students’ performance (Donia et al., 2018) and promote accountability (Brooks and Ammons, 2003). Assuming score validity, the professor may then use these scores to assign grades (Beatty et al., 1996) and ask students to use the scores to appraise their strengths and weaknesses (Donia et al., 2018). However, relatively few researchers have evaluated whether these scores reflect consensus within the team about each person’s performance (e.g., Loignon et al., 2017). Our goal is to conceptually replicate earlier findings about consensus in peer ratings and to validate them further by examining—in the context of an undergraduate course emphasizing teamwork—the association between peer ratings and both personality traits and self-ratings.
Analyzing the degree of consensus—the first goal—entails discerning how much of the variance in the scores is attributable to the evaluation target. Ideally, variance should only hinge on the person being evaluated, indicating perfect consensus: each target receives similar ratings from every peer who evaluates them. But in actuality some variance is explained by the idiosyncrasies of each perceiver and other factors (Scullen et al., 2000; Schmidt et al., 2021). A number of studies have explored how much peer or observer ratings reflect consensus about the target rather than rater biases or other influences (Kenny, 2020). However, to our knowledge, few previous peer-reviewed publications have used a social relations model to assess consensus in the peer-ratings made by members of student teams (e.g., Greguras et al., 2001; Mayfield and Tombaugh, 2019; Schmidt et al., 2021). Therefore, our first goal was to add to this limited literature by assessing the consensus in peer-ratings using a different sample, setting, and rating system.
Our second goal was to test if the peer ratings of team members could be predicted by those members’ personality traits. Personality traits are dimensions on which an individual’s actions, behavior, and thoughts can be characterized (John and Srivastava, 1999; Sherman et al., 2015; Quirin et al., 2020). We rely on the HEXACO model of personality (Ashton and Lee, 2007). The acronym stands for these six constituent traits, where capital letters correspond to the acronym: Honesty–humility, Emotionality, eXtraversion, Agreeableness, Conscientiousness, and Openness to experience. Students who are high in conscientiousness are organized, diligent, and dutiful (Dollinger and Orf, 1991), which forestalls problems such as social loafing, inequity, and inequity-based motivation loss (Mulvey and Klein, 1998; Davies, 2009; Wilson et al., 2018). Conscientiousness should therefore be valued by both professors and students; a target’s conscientiousness should stand out as a predictor of peer-evaluation score, relative to other traits. If substantial variance is explained by another trait, say extraversion, that would suggest that peer ratings may hinge more on a person’s charisma than on their dependability as a team member, which would warrant further inquiry.
Our third goal was to test if peer ratings correlate with self-ratings. In other words, do people who are rated by others as more/less competent also rate themselves as more/less competent? Whereas some research shows agreement between self-rated and peer-rated assessments (e.g., Watson and Clark, 1991), other research shows mixed results (e.g., Heintzelman et al., 2020, 13) or no significant agreement (Mayfield and Tombaugh, 2019). In the current data, significant positive correlations would suggest peer ratings and self-ratings both measure the same construct—presumably, teamwork skills; in contrast, weak or non-significant correlations would suggest that these ratings are a poor indicator of teamwork skills, which could be imputed to less competent individuals being particularly prone to overestimate their competence (Pennycook et al., 2017).
If we conceptualize teamwork skills as a latent variable along which each team member has a true score, then peer-ratings are valid to the degree they reflect those true scores. To the degree that members’ true scores determine peer-ratings, peer-ratings will show interrater reliability or consensus (see Goal 1 above). If members’ personalities influence their true scores, then to the degree that members’ true scores determine peer-ratings, peer-ratings will be associated with members’ personality traits (see Goal 2). And if members’ true scores also influence their self-ratings, then to the degree that members’ true scores determine peer-ratings, peer-ratings will converge with self-ratings (see Goal 3). Thus, finding that peer-ratings show consensus across perceivers, agreement with self-ratings, and associations with personality traits should all strengthen our confidence that peer-ratings are valid indicators of students’ teamwork skills. Nonetheless, absent objective indicators of teamwork skills, we should recognize that other explanations remain possible; for example, team members’ with more upbeat personalities (but not necessarily more skills) may give themselves nicer ratings and also receive nicer ratings from their teammates.
Social Relations Model
To achieve our aims, we employ Social Relations Model (SRM) analyses (Kenny, 1994; Locke, 2016). The SRM conceptualizes within-team differences in peer ratings as resulting from three influences: rater or perceiver effects, ratee or target effects, and residual perceiver x target interaction effects. A member’s target effect reflects the ratings that member typically receives. A member’s perceiver effect reflects the ratings that member typically gives. Finally, the residual interaction or relationship effect reflects a perceiver’s distinctive perception of a target that cannot be explained by the perceiver’s perceiver effect or the target’s target effect. To illustrate, imagine a team of four students—A, B, C, and D—rate each other on “collaboration skills”. If B rates C positively, then that may reflect a target effect (the target, C, receives positive ratings from everyone), a perceiver effect (the perceiver, B, gives everyone positive ratings), and a residual rater x ratee or relationship effect (B rates C more positively than would be predicted from C’s target effect and B’s perceiver effect).
Whereas target effects and self-ratings are ratings of the same target (the self) by different perceivers (teammates versus self), perceiver effects and self-ratings reflect ratings of different targets (teammates versus self) by the same perceiver (the self). The current study primarily concerns target effects. Specifically, our second and third goals (see above) concern if individuals’ target effects—the distinctive ratings they typically receive from their teammates—correlate with their HEXACO traits and self-ratings. And our first goal concerns consensus, which is the variation in team members’ target effects or “target variance.”
Significant target variance or consensus means that some members consistently receive higher peer ratings than others do. In other words, raters agree about who is above average and who is below average. For example, if everyone on the team agrees about which members deserve higher ratings and which members deserve lower ratings, consensus is high. In contrast, the more each member receives a mix of higher ratings from some teammates and lower ratings from others, the lower the consensus. Everyone on the team receiving similar ratings (e.g., everyone gets high ratings) would not increase consensus because consensus reflect agreement about how team members differ from each other rather than agreement about how team members are similar to each other.
Variation in team members’ perceiver effects is perceiver variance. Significant perceiver variance indicates that some members consistently give higher ratings than others do. Perceiver variance is also called assimilation because it indicates how much a perceiver is apt to place different people into the same judgment category. For example, if members A and D give everyone positive ratings, member B gives everyone middle ratings, and member D gives everyone negative ratings, then perceiver variance is high. In contrast, the more each member gives a mix of higher ratings to some teammates and lower ratings to others, the lower the perceiver variance. Again, everyone on the team giving similar ratings would not increase assimilation because assimilation reflects consistencies in how perceivers differ from each other.
Finally, variation in team members’ relationship effects is residual (i.e., relationship or error) variance, and indicates the degree to which a specific team member’s peer rating of a specific teammate cannot be predicted from their respective perceiver and target effects.
Materials and Methods
Participants
Participants were recruited from a second-year undergraduate course in biomedical engineering at a large public university in the U.S. Teams in this course are required to work on a semester-long entrepreneurial project (see Supplementary Data Sheet 1). Students who either did not contribute any peer ratings or did not consent to participate were not included in the study. Also, since social relations model analyses require a minimum group size of four, we removed three teams in which fewer than three members made peer ratings that we had permission to use. After these exclusions, the sample consisted of 130 students distributed across 21 teams (M team size = 6.2, SD = 0.9, range = 4 – 8 members). These students made a total of 688 round-robin peer ratings. The sample’s gender composition was 30% male, 67% female, 0% transgender, 1% other, 2% missing; and its racial composition was 41% non-Hispanic White, 10% Hispanic only/Hispanic White, 10% African American/Black, 28% Asian American/Asian, 3% Asian–White biracial, 2% Middle Eastern/Arab/Arab American, 3% other, and 3% missing.
Measures
Self-Ratings and Peer Ratings
Team members rated themselves and each other in four skill domains: inquiry skills, knowledge building skills, problem-solving skills, and collaboration skills (see Supplementary Table 1). Inquiry skills pertain to the acquisition and classification of robust and pertinent secondary research. Knowledge building skills pertain to the identification and remediation of knowledge gaps, the use of probing questions (posed to peers or oneself), the practice of teaching peers, and the practice of learning from peers. Problem-solving skills pertain to the development of a mathematical and physical model, the framing of hypotheses to be tested with those models, and the practice of clearly defining and expressing problems and solutions during meetings. Collaboration skills pertain to personal initiative and assertiveness; warm, honest, and responsive treatment of peers; and the maintenance of psychological safety within the team (Edmondson, 1999). They also pertain to the distribution and coordination of work in a fair manner.
At the beginning of the semester, each student was given a table with three to five rows of behavioral anchors per domain, each ordered from worst (left) to best (right) across four columns (see Supplementary Table 1). For instance, in one row, the worst anchor was “Does little to help produce papers & presentations” and the best was “Assures papers & presentations are well-written, in one voice, & properly structured.” Students were asked to review this table in order to understand their success criteria. In the middle of the semester, an oral evaluation was conducted: each student stated their self-rating and the student’s peers then provided qualitative feedback on the accuracy of that self-rating. At the end of the semester, students were asked to refer to this table, assign numerical ratings to oneself and one’s peers, and write qualitative evaluations to accompany the ratings. For the numerical ratings—analyzed in the current study—students entered a score in the 1-to-5 range for each domain, with non-integer ratings (e.g., 4.5) allowed but discouraged.
Personality Traits
The 100-item HEXACO-PI-R (Lee and Ashton, 2018) was used to measure six traits:
1. honesty–humility (vs. selfish deceitfulness),
2. emotionality (vs. assuredness or stability),
3. extraversion (vs. docility or depression),
4. agreeableness (vs. angry or uncompassionate),
5. conscientiousness (vs. imprudence or irresponsibility), and
6. openness to experience (vs. conventionality).
Each trait corresponds to distinct outcomes (Zettler et al., 2020) and distinctions between these six traits can be found in the lexicons of numerous languages (Lee and Ashton, 2008). For a comparison with the more familiar Big Five framework, see Barford et al. (2015). The 100-item HEXACO-PI-R contains 16 items per trait, each answered on a 5-point Likert scale from 1 (strongly disagree) to 5 (strongly agree). The respective reliabilities (Cronbach’s αs) were 0.85, 0.82, 0.87, 0.94, 0.86, and 0.78. Participants completed the HEXACO-PI-R early in the semester.
Results
Table 1 shows descriptive statistics for the peer ratings and self-ratings in each domain. The ratings had negatively skewed distributions (i.e., there were relatively few low ratings). In the analyses below we did not employ procedures to normalize the distributions such as elimination of outliers or algebraic transformations. Such procedures are rarely used in real-world classroom or organizational settings, nor are they ever used prior to SRM analyses. Nonetheless, to ensure the robustness of our linear regression results, we re-ran those regressions after log transforming self-ratings and target effects, and (as detailed in Supplementary Tables 3, 4) in no case did those transformations alter the key findings.
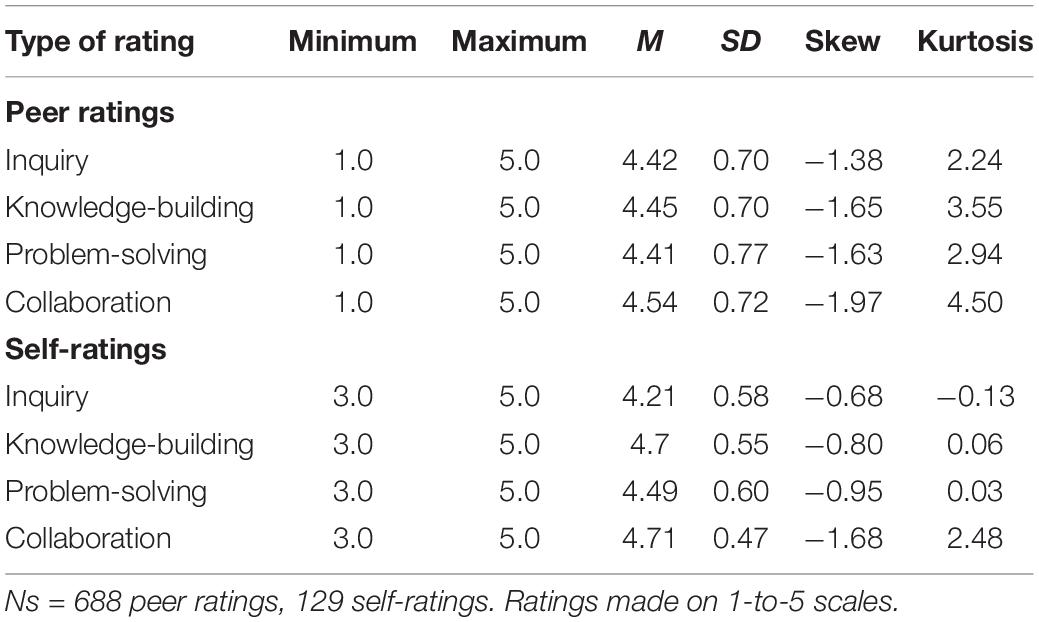
Table 1. Descriptive statistics for peer ratings and self-ratings of each skill.
As noted earlier, 130 members of 21 teams made 688 round-robin peer ratings. To decompose the sources of variation in the peer ratings, we conducted SRM analyses (Kenny, 1994) using the R package TripleR (Schönbrodt et al., 2012).
First, we computed target effects (the average peer rating each member received, controlling for perceiver effects), perceiver effects (the average peer rating each member made, controlling for target effects), and residual effects (the residual peer rating after controlling for target and perceiver effects). Second, within each team we computed the variance in target effects, perceiver effects, and residual effects. Finally, we computed a weighted average of these target, perceiver, and residual variance estimates across teams. Table 2 shows the results.
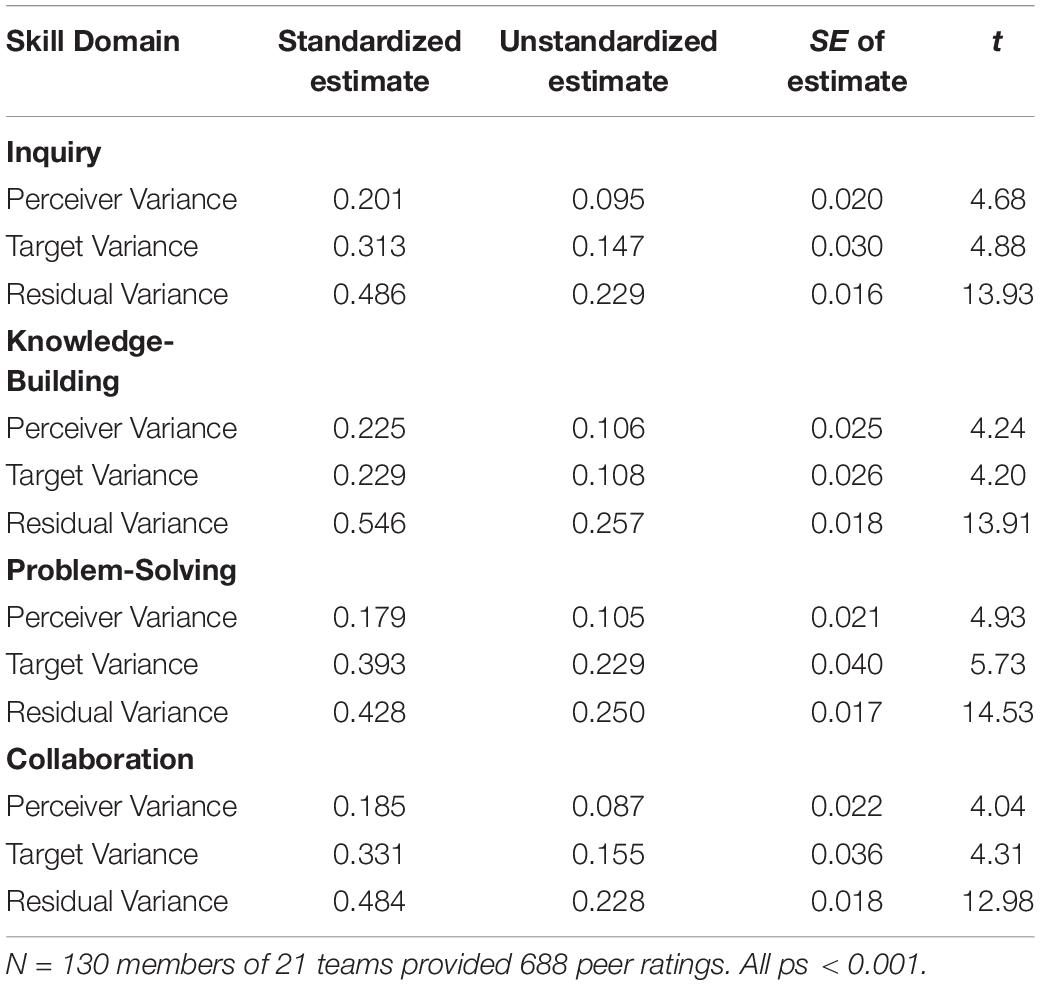
Table 2. SRM estimates of sources of variance in peer ratings.
There was statistically significant (p < 0.05) target variance and perceiver variance in ratings of all four skills (see righthand columns of Table 2). Target variance (consensus) was consistently greater than perceiver variance (assimilation). The significant assimilation indicates that ratings varied partly because some members gave generally higher or lower ratings than other members. But the significant consensus indicates that ratings also varied partly because some team members received generally higher or lower ratings than other members; that is, teammates showed agreement about who deserved higher versus lower skill ratings.
To facilitate interpretation, we computed the proportion of variance attributable to each component by dividing each component by the sum of all three components (see first column of Table 2). These standardized estimates show that on average approximately 32% (i.e., 23–39%) of the variance in peer ratings was attributable to targets, 20% (18–23%) was attributable to perceivers, and the remaining 49% (43–55%) was not attributable to either targets or perceivers.
Second, we asked if team members’ target effects—tendencies to be judged as more or less skillful—were associated with their personality traits. To answer this question, we regressed members’ target effects simultaneously on their six HEXACO traits, the skill being rated (coded using three effect-code variables, and the 18 possible trait x skill interaction terms). Because targets were nested within teams, we allowed target effects intercept to vary across teams; all other parameters were treated as fixed. We standardized the outcome and predictors (except the trait x skill interactions) across the entire sample making the resulting regression coefficients interpretable as standardized coefficients. The complete model and results are detailed in the Supplementary Material (see Supplementary Table 3). There was a robust positive association between self-rated conscientiousness and peer-rated skills, β50 = 0.165, SE = 0.047, 95% CI [.073,.257], t = 3.54, p < 0.001. There was a weak positive association between self-rated honesty-humility and peer-rated skills, β10 0.098, SE = 0.048, 95% CI [0.003, 0.192], t = 2.03, p < 0.05; since this latter effect would be non-significant following any adjustment for Type I error due to model complexity, we will not discuss it further.
Third, we asked whether self-ratings correlate with target effects. To answer this question, we used a similar regression model as above except with self-ratings replacing HEXACO traits as the predictor. The complete model and results are detailed in the Supplementary Material (see Supplementary Table 4). Self-ratings and target effects were strongly positively related: Individuals who received higher (lower) ratings from their peers tended to give themselves higher (lower) ratings, β10 = 0.310, SE = 0.040, 95% CI [0.232, 0.388], t = 7.85, p < 0.001. There was also one weak (p = 0.040) moderating effect of skill type, but since it was no longer significant (p = 0.161) after log transforming the skewed rating variables, we will not discuss it further.
Discussion
Our first aim was to assess agreement in peer-ratings. On average 32% of variance in peer-ratings reflected consensus (target variance) regarding who was higher or lower on each skill. In showing that approximately one third of the variance in peer ratings reflected determinants of peer ratings that were shared across team members, the current results simultaneously showed that approximately two thirds of the variance in peer ratings reflected determinants of peer ratings that varied across team members.
One source of disagreement was assimilation: Across targets the tendency for some raters to make relatively high and others to make relatively low ratings of a particular skill explained approximately 20% of the variance. The other source of disagreement was residual variance that could not be attributed to variance in either target- or perceiver-effects. Residual variance may reflect random unsystematic sources of variance (such as careless responding or misreading the rating criteria) but may also reflect relationship-specific variance (such as team members having distinctive biases towards or against specific teammates). Residual variance was approximately half of the overall variance in peer ratings.
Thus, while peer ratings may be a useful indicator of student performance and skill levels, they are a noisy indicator carrying considerable perceiver variance and other sources of error. On the one hand, averaging multiple peer ratings should decrease noise by averaging out the effects of unsystematic sources of error and the rating biases reflected in perceiver and relationship effects. On the other hand, averaging will not dampen—and instead may amplify—the impact of shared biases, such as some targets tending to receive more lenient evaluations from everyone (e.g., because they tend to evoke more liking or sympathy) independent of their true skill levels.
Three previous studies analyzed target variance in peer-ratings in higher-education courses. Greguras et al. (2001) found on average 26% of the variance in peer ratings was target variance and 29% was perceiver variance. Mayfield and Tombaugh (2019) found on average 22% of the variance in peer ratings was target variance and 36% was perceiver variance. Schmidt et al. (2021) found on average 28% was target variance and 35% was perceiver variance. Thus, perceiver variance tended to be lower (and target variance slightly higher) in the current study than in previous studies, perhaps because the students we studied were explicitly encouraged to “not give everyone the same [rating].”
Future research could assess the specific attitudes and beliefs that might contribute to perceiver variance (e.g., a “4” on the 1-to-5 scale may have seemed like a “good” score to some raters but a “bad” score to other raters; and whereas some raters may have construed giving a mediocre performer a mediocre score as a responsible behavior, others may have construed it as an unkind behavior). Presumably, improving the instructions for making peer ratings (e.g., anchoring scale points to simple observable criteria) reduces perceiver and error variance and increases target variance. Thus, future research could systematically vary instructions and criteria across teams and then measure which teams show more consensus.
For example, in our analysis, consensus was greatest for ratings of problem-solving skills and lowest for knowledge-building skills. Previous research suggests that consensus tends to be greater for qualities that are more observable (Kenny and West, 2010). Accordingly, one possible explanation for the differences in consensus is that the criteria for problem-solving skills (e.g., “actively participating in finding a solution… use white boards…or just sit passively”) referred to more concrete and observable behaviors than did the criteria for knowledge-building skills (e.g., “regularly assess where s/he needed to develop deeper understanding or was satisfied with surface understanding”). If so, then articulating more visible behavioral indicators of knowledge-building skills might improve consensus in ratings of those skills.
Having found significant consensus in peer ratings, our study’s second and third goals involved testing if those peer ratings correlated with personality traits and self-ratings. Conscientiousness was positively associated with peer evaluations, which accords with our expectations and previous research. The other HEXACO traits—which are less directly linked to task behavior—were unrelated to peer ratings.
Finally, we found moderate associations (average r = 0.35) between target effects and self-ratings, which is stronger than that reported in the previous studies of student teams (Loignon et al., 2017; Mayfield and Tombaugh, 2019). As with peer-peer consensus, peer-self agreement can be interpreted as evidence for the accuracy of both self- and peer-ratings (i.e., presumably the ratings of different raters converge because they are all influenced by a target’s true skill level). But as with peer-peer consensus, other interpretations are possible (e.g., the ratings might converge because they are all influenced by the same biases).
Limitations
On one hand, the current findings obtained from student teams may not generalize to teams that are dissimilar in size, professional field, average age, timeline, and goals. On the other hand, the basic structure of these teams resembles that of many teams operating in “real-world” organizational and applied contexts: members were given a meaningful problem to solve and were accountable for their performance. These findings may also not generalize to evaluations conducted early in the semester (Mayfield and Tombaugh, 2019), but those evaluations are formative rather than summative—and thus serve a different purpose. Better rubrics could also potentially pull more target variance and less perceiver variance, which means the ratio of target-to-perceiver variance can change across studies.
Also, as a cautionary tale for future researchers and instructors, we will admit that we originally had a fourth aim which we had to abandon: To check if the peer ratings showed convergent validity with observer ratings made by teaching assistants who attended the students’ team meetings. However, after we found suspiciously high correlations between peer ratings and observer ratings, further inquiries revealed that the teaching assistants had peeked at the peer ratings before making their own ratings of each student, thereby rendering their observer ratings unusable as a validity criterion. Our take-home lesson was that some raters—and not just peer raters but also teaching assistants and perhaps instructors—may need to be reminded that aggregating across raters can reduce or eliminate the impact of each individual’s idiosyncratic mistakes and biases, but only if those individuals make their ratings completely independently of each other.
However, even if peer ratings were validated by evaluations made by independent observers, those observers would be informed by team members’ comments and susceptible to the same biases as the ratings made by peers (such as halo effects for more likable team members). Thus, future research employing objective performance metrics would enhance confidence that the peer ratings measured team skills rather than being confounded with other qualities.
Implications
The current results uphold the robustness of earlier findings about consensus among peers in an engineering education and other settings (Greguras et al., 2001; Loignon et al., 2017). By studies examining different rating systems in different samples and contexts, collectively this expanding literature provides an increasingly generalizable foundation from which to predict how much consensus new rating systems in new contexts might achieve. This study also adds indirect support for the finding that behavioral anchors are useful (Ohland et al., 2005), although there was no control group in our case.
A novel finding is that conscientiousness exclusively predicted how well students were evaluated. When configuring teams, instructors may leverage this knowledge and ensure there’s at least one highly conscientious member in every team. Given that conscientiousness can be measured with freely available scales in multiple languages (e.g., Lee and Ashton, 2004; Soto and John, 2017), this is feasible for most instructors. Prompting peers to appraise each other’s conscientiousness may also be useful as formative feedback. Likewise, structured feedback forms can include items with behavioral anchors to measure conscientiousness. In the peer-ratings literature, scholars have devoted relatively little attention to the content validity of peer ratings, and the current study’s findings about traits point to further avenues for research on content.
Data Availability Statement
The datasets presented in this study can be found in online repositories. The names of the repository/repositories and accession number(s) can be found below: https://osf.io/3rmab/.
Ethics Statement
The studies involving human participants were reviewed and approved by Institutional Review Board, Georgia Institute of Technology. The ethics committee waived the requirement of written informed consent for participation.
Author Contributions
CM recruited the participants, handled data collection, and wrote sections of the manuscript. KL analyzed the data and helped write the manuscript. Both authors contributed to the article and approved the submitted version.
Funding
This work was supported by National Science Foundation (NSF) under Grant No. 1730262.
Conflict of Interest
The authors declare that the research was conducted in the absence of any commercial or financial relationships that could be construed as a potential conflict of interest.
Publisher’s Note
All claims expressed in this article are solely those of the authors and do not necessarily represent those of their affiliated organizations, or those of the publisher, the editors and the reviewers. Any product that may be evaluated in this article, or claim that may be made by its manufacturer, is not guaranteed or endorsed by the publisher.
Supplementary Material
The Supplementary Material for this article can be found online at: https://www.frontiersin.org/articles/10.3389/feduc.2022.746457/full#supplementary-material
References
Ashton, M. C., and Lee, K. (2007). Empirical, theoretical, and practical advantages of the hexaco model of personality structure. Pers. Soc. Psychol. Rev. 11, 150–166. doi: 10.1177/1088868306294907
Barford, K. A., Zhao, K., and Smillie, L. D. (2015). Mapping the interpersonal domain: translating between the big five, hexaco, and Interpersonal Circumplex. Pers. Individ. Dif. 86, 232–237. doi: 10.1016/j.paid.2015.05.038
Beatty, J. R., Haas, R. W., and Sciglimpaglia, D. (1996). Using peer evaluations to assess individual performance in group class projects. J. Mark. Educ. 18, 17–27. doi: 10.1177/027347539601800203
Brooks, C. M., and Ammons, J. L. (2003). Free riding in group projects and the effects of timing, frequency, and specificity of criteria in peer assessments. J. Educ. Bus. 78, 268–272. doi: 10.1080/08832320309598613
Davies, W. M. (2009). Groupwork as a form of assessment: common problems and recommended solutions. High. Educ. 58, 563–584. doi: 10.1007/s10734-009-9216-y
Dollinger, S. J., and Orf, L. A. (1991). Personality and performance in “personality”: conscientiousness and openness. J. Res. Pers. 25, 276–284. doi: 10.1016/0092-6566(91)90020-Q
Donia, M. B. L., O’Neill, T. A., and Brutus, S. (2018). The longitudinal effects of peer feedback in the development and transfer of student teamwork skills. Learn. Individ. Differ. 61, 87–98. doi: 10.1016/j.lindif.2017.11.012
Edmondson, A. (1999). Psychological safety and learning behavior in work teams. Adm. Sci. Q. 44, 350–383. doi: 10.1080/07294360.2018.1471050
Greguras, G. J., Robie, C., and Born, M. P. (2001). Applying the social relations model to self and peer evaluations. J. Manag. Dev. 20, 508–525. doi: 10.1108/02621710110399792
Heintzelman, S. J., Kushlev, K., Lutes, L. D., Wirtz, D., Kanippayoor, J. M., Leitner, D., et al. (2020). ENHANCE: evidence for the efficacy of a comprehensive intervention program to promote subjective well–being. J. Exp. Psychol. Appl. 26, 360–383. doi: 10.1037/xap0000254
John, O. P., and Srivastava, S. (1999). “The big five trait taxonomy: history, measurement, and theoretical perspectives,” in Handbook of Personality: Theory and Research, eds L. A. Pervin and O. P. John (New York, NY: Guilford), 102–138.
Kenny, D. A. (2020). Interpersonal Perception: The Foundation of Social Relationships, 2nd Edn. New York, NY: Guilford.
Kenny, D. A., and West, T. V. (2010). Similarity and agreement in self–and other perception: a meta–analysis. Pers. Soc. Psychol. Rev. 14, 196–213. doi: 10.1177/1088868309353414
Lee, K., and Ashton, M. C. (2004). Psychometric properties of the hexaco personality inventory. Multivariate Behav. Res. 39, 329–358. doi: 10.1207/s15327906mbr3902_8
Lee, K., and Ashton, M. C. (2008). The hexaco personality factors in the indigenous personality lexicons of english and 11 other languages. J. Pers. 76, 1001–1054. doi: 10.1111/j.1467-6494.2008.00512.x
Lee, K., and Ashton, M. C. (2018). Psychometric properties of the HEXACO-100. Assessment 25, 543–556. doi: 10.1177/1073191116659134
Locke, K. D. (2016). “Social relations model,” in Encyclopedia of Personality and Individual Differences, eds V. Zeigler-Hill and T. K. Shackelford (New York, NY: Springer), doi: 10.1007/978-3-319-28099-8_1268-1
Loignon, A. C., Woehr, D. J., Thomas, J. S., Loughry, M. L., Ohland, M. W., and Ferguson, D. M. (2017). Facilitating peer evaluation in team contexts: the impact of frame–of–reference rater training. Acad. Manag. Learn. Educ. 16, 562–578. doi: 10.5465/amle.2016.0163
Mayfield, C. O., and Tombaugh, J. R. (2019). Why peer evaluations in student teams don’t tell us what we think they do. J. Educ. Bus. 94, 125–138. doi: 10.1080/08832323.2018.1503584
Mulvey, P. W., and Klein, H. J. (1998). The impact of perceived loafing and collective efficacy on group goal processes and group performance. Organ. Behav. Hum. Decis. Process. 74, 62–87. doi: 10.1006/obhd.1998.2753
Ohland, M., Layton, R. A., Loughry, M. L., and Yuhasz, A. G. (2005). Effects of behavioral anchors on peer evaluation reliability. J. Eng. Educ. 94, 319–326.
Ohland, M. W., Felder, R. M., and Layton, R. A. (2012). The comprehensive assessment of team member effectiveness: development of a behaviorally anchored rating scale for self– and peer evaluation. Acad. Manag. Learn. Educ. 11, 609–631. doi: 10.5465/amle.2010.0177
Pennycook, G., Ross, R. M., Koehler, D. J., and Fugelsang, J. A. (2017). Dunning–Kruger effects in reasoning: theoretical implications of the failure to recognize incompetence. Psychon. Bull. Rev. 24, 1774–1784. doi: 10.3758/s13423-017-1242-7
Quirin, M., Robinson, M. D., Rauthmann, J. F., Kuhl, J., Read, S. J., Tops, M., et al. (2020). The dynamics of personality approach (DPA): 20 tenets for uncovering the causal mechanisms of personality. Eur. J. Pers. 34, 947–968. doi: 10.1002/per.2295
Riebe, L., Girardi, A., and Whitsed, C. (2016). A systematic literature review of teamwork pedagogy in higher education. Small Group Res. 47, 619–664. doi: 10.1177/1046496416665221
Schmidt, J. A., O’Neill, T. A., and Dunlop, P. D. (2021). The effects of team context on peer ratings of task and citizenship performance. J. Bus. Psychol. 36, 573–588. doi: 10.1007/s10869-020-09701-8
Schönbrodt, F. D., Back, M. D., and Schmukle, S. C. (2012). Tripler: an R package for social relations analyses based on round–robin designs. Behav. Res. Methods 44, 455–470. doi: 10.3758/s13428-011-0150-4
Scullen, S. E., Mount, M. K., and Goff, M. (2000). Understanding the latent structure of job performance ratings. J. Appl. Psychol. 85, 956–970. doi: 10.1037/0021-9010.85.6.956
Sherman, R. A., Rauthmann, J. F., Brown, N. A., Serfass, D. G., and Jones, A. B. (2015). The independent effects of personality and situations on real–time expressions of behavior and emotion. J. Pers. Soc. Psychol. 109, 872–888. doi: 10.1037/pspp0000036
Soto, C. J., and John, O. P. (2017). The next big five inventory (BFI-2): developing and assessing a hierarchical model with 15 facets to enhance bandwidth, fidelity, and predictive power. J. Pers. Soc. Psychol. 113, 117–143. doi: 10.1037/pspp0000096
Watson, D., and Clark, L. A. (1991). Self– versus peer ratings of specific emotional traits: evidence of convergent and discriminant validity. J. Pers. Soc. Psychol. 60, 927–940. doi: 10.1037/0022-3514.60.6.927
Wilson, L., Ho, S., and Brookes, R. H. (2018). Student perceptions of teamwork within assessment tasks in undergraduate science degrees. Assess. Eval. High. Educ. 43, 786–799. doi: 10.1080/02602938.2017.1409334
Keywords: peer ratings, higher education, engineering education, problem-based learning, teams, social relations model (SRM)
Citation: Martin CC and Locke KD (2022) What Do Peer Evaluations Represent? A Study of Rater Consensus and Target Personality. Front. Educ. 7:746457. doi: 10.3389/feduc.2022.746457
Received: 23 July 2021; Accepted: 14 February 2022;
Published: 21 March 2022.
Edited by:
Douglas F. Kauffman, Medical University of the Americas – Nevis, United StatesReviewed by:
Marco Temperini, Sapienza University of Rome, ItalySemiral Öncü, Balıkesir University, Turkey
Copyright © 2022 Martin and Locke. This is an open-access article distributed under the terms of the Creative Commons Attribution License (CC BY). The use, distribution or reproduction in other forums is permitted, provided the original author(s) and the copyright owner(s) are credited and that the original publication in this journal is cited, in accordance with accepted academic practice. No use, distribution or reproduction is permitted which does not comply with these terms.
*Correspondence: Chris C. Martin, Y2hyaXMubWFydGluLmVAZ21haWwuY29t