 Güler Yavuz Temel
 Maya Machunsky
 Christian Rietz
 Dimitry Okropiridze
- Faculty of Educational and Social Sciences, University of Education Heidelberg, Heidelberg, Germany
In this study, the psychometric properties of the listening and reading subtests of the German VERA 3 test were examined using Item Response Theory (IRT) and Multidimensional Item Response Theory (MIRT) models. Listening and reading subscores were estimated using unidimensional Rasch, 1PL, and 2PL models, and total scores on the German test (listening + reading) were estimated using unidimensional and multidimensional IRT models. Various MIRT models were used, and model fit was compared in a cross-validation study. The results of the study showed that unidimensional models of the reading and listening subtests and the German test provided a good overall model-data fit, however, multidimensional models of the subtests provided a better fit. The results demonstrated that, although the subtest scores also fit adequately independently, estimating the scores of the overall test with a model (e.g., bifactor) that includes a general factor (construct) in addition to the subfactors significantly improved the psychometric properties of the test. A general factor was identified that had the highest reliability values; however, the reliabilities of the specific factors were very low. In addition to the fit of the model data, the fit of the persons with IRT/MIRT models was also examined. The results showed that the proportion of person misfit was higher for the subtests than for the overall tests, but the overfit was lower. NA-German students, who did not speak German all-day, had the highest proportion of misfits with all models.
Introduction
Large-scale educational testing, reporting, and interpretation of subscores provide several benefits to users: Subscores can be used to determine how the examinee’s abilities/skills vary in different areas. Compared to overall test scores, subscores can be more informative for teachers, students, parents, or testing programs. Subscores provide detailed information about examinees that total scores cannot; for example, subscores allow students to identify their strengths and weaknesses in each content area and use this information to plan and improve their performance in the future. This paper argues that subscores should be reported for their potential diagnostic value (Haladyna and Kramer, 2004; Sinharay, 2010; Sinharay et al., 2011).
In addition to reporting subscores, improving the information and interpretation of subscores has also been an issue in recent years. This suggests that test scores should not be reported until the validity, comparability, and reliability of such scores have been established (American Educational Research Association et al., 1999, 2014). Before the subscores are reported as a total score, the subscores should also have appropriate psychometric properties. In addition to the reliabilities of subscores, they should be reported in a context in which they add value, and the distinctiveness of each score should be carefully demonstrated. If a subtest measures the targeted construct poorly or provides results that are inconsistent across multiple applications, the information it provides may not be trustworthy. In contrast, if the subscores have high reliability and validity, any interpretation based on those scores will be more correct (Tate, 2004; Monaghan, 2006; Haberman, 2008; Haberman et al., 2009; Sinharay, 2010; Reckase and Xu, 2015; Meijer et al., 2018).
Several methods have been proposed to examine the psychometric quality of subscores (Yen, 1987; Yen et al., 1997; Wainer et al., 2001; Kahraman and Kamata, 2004; Yao and Boughton, 2007; Haberman, 2008; Haberman and Sinharay, 2010). Dai et al. (2017) classified common methods for estimating subscores within psychometric modeling frameworks such as classical test theory (CTT), item response theory (IRT), cognitive diagnostic models (CDM), and factor analysis (FA). According to review and application of subscore estimation methods studies (e.g., Haberman and Sinharay, 2010; Wedman and Lyren, 2015; Dai et al., 2017; Fu and Qu, 2018), Multidimensional Item Response Theory (MIRT) models and the score augmentation method with IRT theta subscore estimates provided comparable subscore estimates and performed best.
One of the primary priorities of the subscore studies is to determine whether subscores provide useful information beyond that which is provided by the overall score (e.g., Haberman, 2008; Sinharay, 2010, 2019; Feinberg and Wainer, 2014; Sinharay et al., 2015). In general, Haberman’s Proportional Reduction of Mean Square Error (PRMSE) method is calculated to determine if subscores have additional value in CTT. In IRT, overall data model fit statistics and/or comparison of multifactor and single factor models are evaluated by examining relative fit indices to understand if subscores have added value (Dai et al., 2017).
The focus of the study is to investigate the added value of the subscores of a low-stake performance test, the Vergleichsarbeiten (VERA), using the IRT/MIRT models. For each subscore and total VERA score, k-fold cross-validation was calculated to identify the model with the best fit. Since the accuracy and stability of subscores can be improved by different approaches, even if subscores have no added value (Fu and Qu, 2018), the reliability of subscores and total values was also evaluated in the study. VERA test results provide important information about school or student improvement and are used to improve teaching and learning conditions and make required changes. Teachers use the information from VERA and its subscores to understand students’ the academic needs of their students.
Vergleichsarbeiten tests are based on a proficiency level model in terms of that students are assigned to a proficiency level based on their test results. For example, VERA 3 German reading test results with different cut-off scores were classified to the five proficiency levels (e.g., below the minimum standard, minimum standard). The reliability and validity of the subscores affect these achievement levels and the decisions made by teachers and parents, which have an impact on the future of the students (Kulturministerkonferenz, 2016; Wagner et al., 2021). VERA assessments consist of various tests and subtests, and an independent unidimensional framework is assumed for each subtest and some overall tests. In 2019, the two subscores for the VERA-3 German test were reported for the “Listening” and “Reading” subtests. The unidimensional Rasch model has been used to estimate scale scores for each grade level in Baden-Württemberg (Kulturministerkonferenz, 2016; Schult and Wagner, 2019a,b). Although the unidimensional Rasch model provides a better estimate than the raw scores of the subtests, it has some limitations. For example, each item can only measure a single trait, which is known as simple structure, and the subtests are calibrated independently (Bulut, 2013). The strong assumptions (e.g., dimensionality and local independence) of the unidimensional Rash model may be violated, which may lead to a poor fit of the model to the data. Subtests may have complex item structures and may be correlated with each other. For example, an independent unidimensional structure does not account for correlation among subscales, unidimensional IRT subscore reliability may not be optimal, or may lead to suboptimal overall ability estimates in practice (Liu et al., 2018). Previous studies on subscores have examined MIRT models and compared them to other methods for estimating subscores.
The superiority of MIRT models has been highlighted with both real data sets and simulation applications (e.g., Yao and Boughton, 2007; Haberman and Sinharay, 2010; Bulut, 2013; Liu et al., 2018; Yao, 2018). MIRT models can use this additional information about the correlation of the subscales to increase the reliability of the subscales, and MIRT models allow us to benefit from additional information about the person’s abilities on all subscales of the test. In a unidimensional model, all items measure a single latent trait. However, multidimensional models contain more than one latent trait, and these latent traits can be managed with different test structures (e.g., multidimensionality between and within items).
The significance of the study lies in its potential ability to support the accuracy and fairness of reporting and interpretation of subtests in VERA by using MIRT models. To evaluate the study’s objectives, two research questions were addressed: 1. Do subtests of the VERA German test based on IRT/MIRT models add value or not? 2. does the use of more general IRT and MIRT models help to improve the accuracy and stability of the subscores?
Item Response Theory and Multidimensional Item Response Theory Models
Item response theory models consist of latent person parameters and item parameters; IRT includes several models (e.g., Rasch, one-parameter, and two-parameter models) that provide item and ability parameter invariance for test items and persons when the IRT model of interest fits the available test data (Zanon et al., 2016).
The characteristics of the models were defined by Hambleton et al. (1991) as follows: (a) an examinee’s performance on a test item can be predicted (or explained) by a set of factors called traits, latent traits, or abilities; and (b) the relationship between examinee item performance and the set of traits underlying item performance can be described by a monotonically increasing function called the item characteristic function or item characteristic curve (ICC). The test characteristic curve summarizes all item characteristics (for details of IRT and models, see, e.g., Hambleton and Swaminathan, 1985; Embretson and Reise, 2000).
The item information function (IIF) is a measure of the contribution of individual items to the total test information (TIF). The greater value of the IIF for a given level of a latent trait indicates that more information is available to examinees at that level of the latent trait. Items are assumed to be locally independent. The TIF function can be calculated from the sum of the IIFs for all items. For item i (i = 1, 2…, N) at the latent trait level θ is denoted as Ii(θ) and I(θ) is the total TIF. TIF provides an estimate of the error of measurement at each ability level, and it is used as a measure of accuracy of estimation conditional standard error of measurement (cSEM) provides information about the precision of the test at a given latent trait level, TIF and cSEM can be computed as follows (Hambleton and Swaminathan, 1985; Desjardins and Bulut, 2018):
Item characteristic function or ICC can be generalized to the MIRT case as item characteristic survey. For a two-dimensional compensatory model, for instance, the item is associated with two latent dimensions as θ1 and θ2, the surface plots show that an examinee with a low proficiency level in dimension 1 and a high proficiency level in dimension 2 would still have a high probability of answering the item correctly because the low proficiency in dimension 1 is compensated for by the high proficiency in dimension 2. Like unidimensional IRT, it is also possible to examine the information provided by the item based on the latent traits. In the z-axis of the plot, instead of the probability of the success in the item, item information level can be seen. For instance, when both latent traits are around zero, item information level is highest and when both latent traits become either low or very high, the item information may be lowest. In addition to the item characteristic survey and information, with MIRT framework is also possible to draw plots at test level to summarize TIF function and cSEM (Hambleton and Swaminathan, 1985; Desjardins and Bulut, 2018).
The item response function (IRF) of the 3PLM model for dichotomous responses is:
Where aip is the ith item slope for the primary dimension, ais is the ith item slope for the specific dimension (s = 1,2,….S), θjp is the jth person latent trait score for primary dimension, θjs is the jth person latent score for the sth specific dimension, di is the ith item intercept parameter, and gi is the ith item pseudo-guessing parameter. When gi = 0, the 2PLM model is obtained, when gi = 0, aip = 1, and ais = 1 on the associated specific dimension (ais = 0ontheotherspesificdimensions) the Rasch style bifactor model is acquired (Paek and Cole, 2019).
Although unidimensional IRT models have been shown to be useful and powerful in the scientific literature, they assume that the test being analyzed measures only one ability dimension. However, many educational and psychological assessments are inherently multidimensional. For example, a mathematics test might be assumed to measure algebra and geometry. In this case, two dimensions could be assumed, where the items with algebra content measure the first dimension and the remaining items with geometry content could be considered a measure of the second dimension (Reckase, 1997, 2009; Ackerman et al., 2003; Chalmers, 2012). When tests measure different constructs or subtests-assuming these subtests have complex item structures and are correlated-MIRT models can be more flexible and efficient. For example, if subtests are assumed to be correlated in terms of item scores, examinees with high ability on one dimension can compensate for lower ability on the other dimensions. This type of MIRT models can be categorized into compensatory and non-compensatory MIRT models (Reckase, 1997, 2009; Sijtsma and Junker, 2006; Yao and Boughton, 2007). Depending on the test structure, MIRT models can be classified as between-item and within-item models (Adams et al., 1997; Wang et al., 2004; Desjardins and Bulut, 2018; Paek and Cole, 2019). Between-item multidimensionality is also referred to as “simple structure,” as in a factor analytic solution where the items load on a single factor and the factors may be correlated. In the case of within-item multidimensionality, each item may be associated with two or more latent features, and within-item multidimensionality is referred to as non-simple structure, cross-loading item structure, or complex structure (Ackerman et al., 2003; Zhang, 2007; Desjardins and Bulut, 2018; Paek and Cole, 2019).
The bifactor test structure is one of the most well-known multidimensional test structures (for details on the bifactor model, see, e.g., Holzinger and Swineford, 1937; Gibbons and Hedeker, 1992; DeMars, 2006; Cai et al., 2011; Jennrich and Bentler, 2011). The bi-factor structure is a specific design of within-item multidimensionality. In bifactor modeling, all items are assumed to have a general or primary factor as well as specific factors. All test items load on the general factor and subsets of items also load on their own specific factor. One of the most important points in bifactor modeling is that all specific factors are orthogonal to each other as well as to the general factor. In other words, the general factor and the specific factors are assumed to be uncorrelated (Cai et al., 2011; Paek and Cole, 2019). Test items are sometimes grouped into sets or testlets that share a common scenario or reading passage. For example, in a reading comprehension test, items may be grouped around a small number of reading passages, where each passage may represent unique content. A testlet model can be considered a special case or a restricted version of a bifactor model (Gibbons and Hedeker, 1992; Li et al., 2006; DeMars, 2012; Paek and Cole, 2019). Cai (2010) extended the previous bifactor models and developed a two-tier model. The two-tier model structure can provide multiple correlated general and specific factors. One of the tiers represents the general factor and the other tier represents the specific factors. The two-tier model can be considered a mixture of traditional MIRT models and more restricted bifactor models (Cai and Thissen, 2015).
Materials and Methods
Sample Size and k-Fold Cross-Validation Procedure
The study was conducted using the VERA 3 German test, which will be used with third grades students in Baden-Württemberg in 2019. VERA tests were developed to assess students’ performance on a variety of tasks (Kulturministerkonferenz, 2016). The overall German test consists of 44 items. VERA 3 German consists of the subtests reading and listening. The test consists of two different reading passages [Dragons (11), Break games (11)] and three different listening passages [Don’t worry Rabbit (6), Who cares about Kalif (8), Telegram (8)]. After excluding students with missing data, the sample size of the data set was 81454. The data consisted of 40,478 girls (%49.69) and 40,976 boys (%50.31), and there were 63,656 students who spoke German all-day (%78.15) and 17,798 students who did not speak German all-day (%21.85).
The study used various goodness-of-fit statistics to assess the fit of the model to the data. Because estimating fit indices can lead to overparameterization when samples are large (e.g., Maydeu-Olivares and Joe, 2005; Xu et al., 2017), we used k-fold cross-validation instead of one sample size to evaluate the best-fitting model. This k-fold cross-validation procedure was also used by LoMartire et al. (2020). The complete data set (N = 81454) was randomly divided into five equal parts (fivefolds), and the models were fitted to four parts (training), while the remaining part (validation set) was used for parameter estimation and model fit evaluation. Each part of the data was used as a validation set, so the procedure was repeated five times. The fit indices were estimated and evaluated based on the differences between the validation and training sets. Once the final model was selected, it was again fitted to the overall data set again to calculate the final parameter estimates. The empirical internal consistency reliability, person misfit was calculated. IRT scores were estimated and correlated with each other. The k-fold cross-validation was performed in R, and the R script is included in the Supplementary File.
Study Design and Procedure
In the study, unidimensional and multidimensional IRT models were used to estimate the subtests and test scores. IRT models consist of latent person and item parameters. Item, person parameters and test scores were computed with Rasch, 1PL, and 2PL models in R using the package “mirt” (Chalmers, 2012). There are several approaches to estimating item parameters: Bock and Aitkin (1981) Maximum Marginal Likelihood with Expectation Maximization (MML–EM), Markov Chain Monte Carlo (MCMC), Quasi-Monte Carlo EM (QMCEM), Monte Carlo EM (MCEM), Stochastic EM (SEM), or Metropolis-Hastings Robbins-Monro (“MHRM”). In the mirt package, the default estimation method is “EM”; “EM” is generally effective for 1–3 factors. In this study, we used MHRM to estimate the item parameters. Like the item parameters, there are different approaches to estimating person abilities: Maximum a Posteriori (MAP), Expected a Posteriori (EAP), Maximum Likelihood (ML), EAP for sum scores or Weighted Likelihood Estimator (WLE; Warm, 1989), factor scores with a multivariate normal distribution using equally spaced quadrature. We used the MAP scores method for estimating the person parameters. In unidimensional IRT models, items measure a single latent trait. MIRT models, by contrast, provide confirmatory models in which items can load on more than one latent trait and these latent traits can manage with different test structures (e.g., multidimensionality between and within items). In this study, we used different confirmatory test structures: correlated, uncorrelated simple, within-item dimensionality and bi-factor models (Figure 1). The general dimension of the test was German, and the specific dimensions were listening and reading tests. The bifactor model was specified with the general factor German, and in addition to the general factor, the items loaded on their specific factors (reading and listening). Since each passage may also represent unique content, a testlet model was also used.
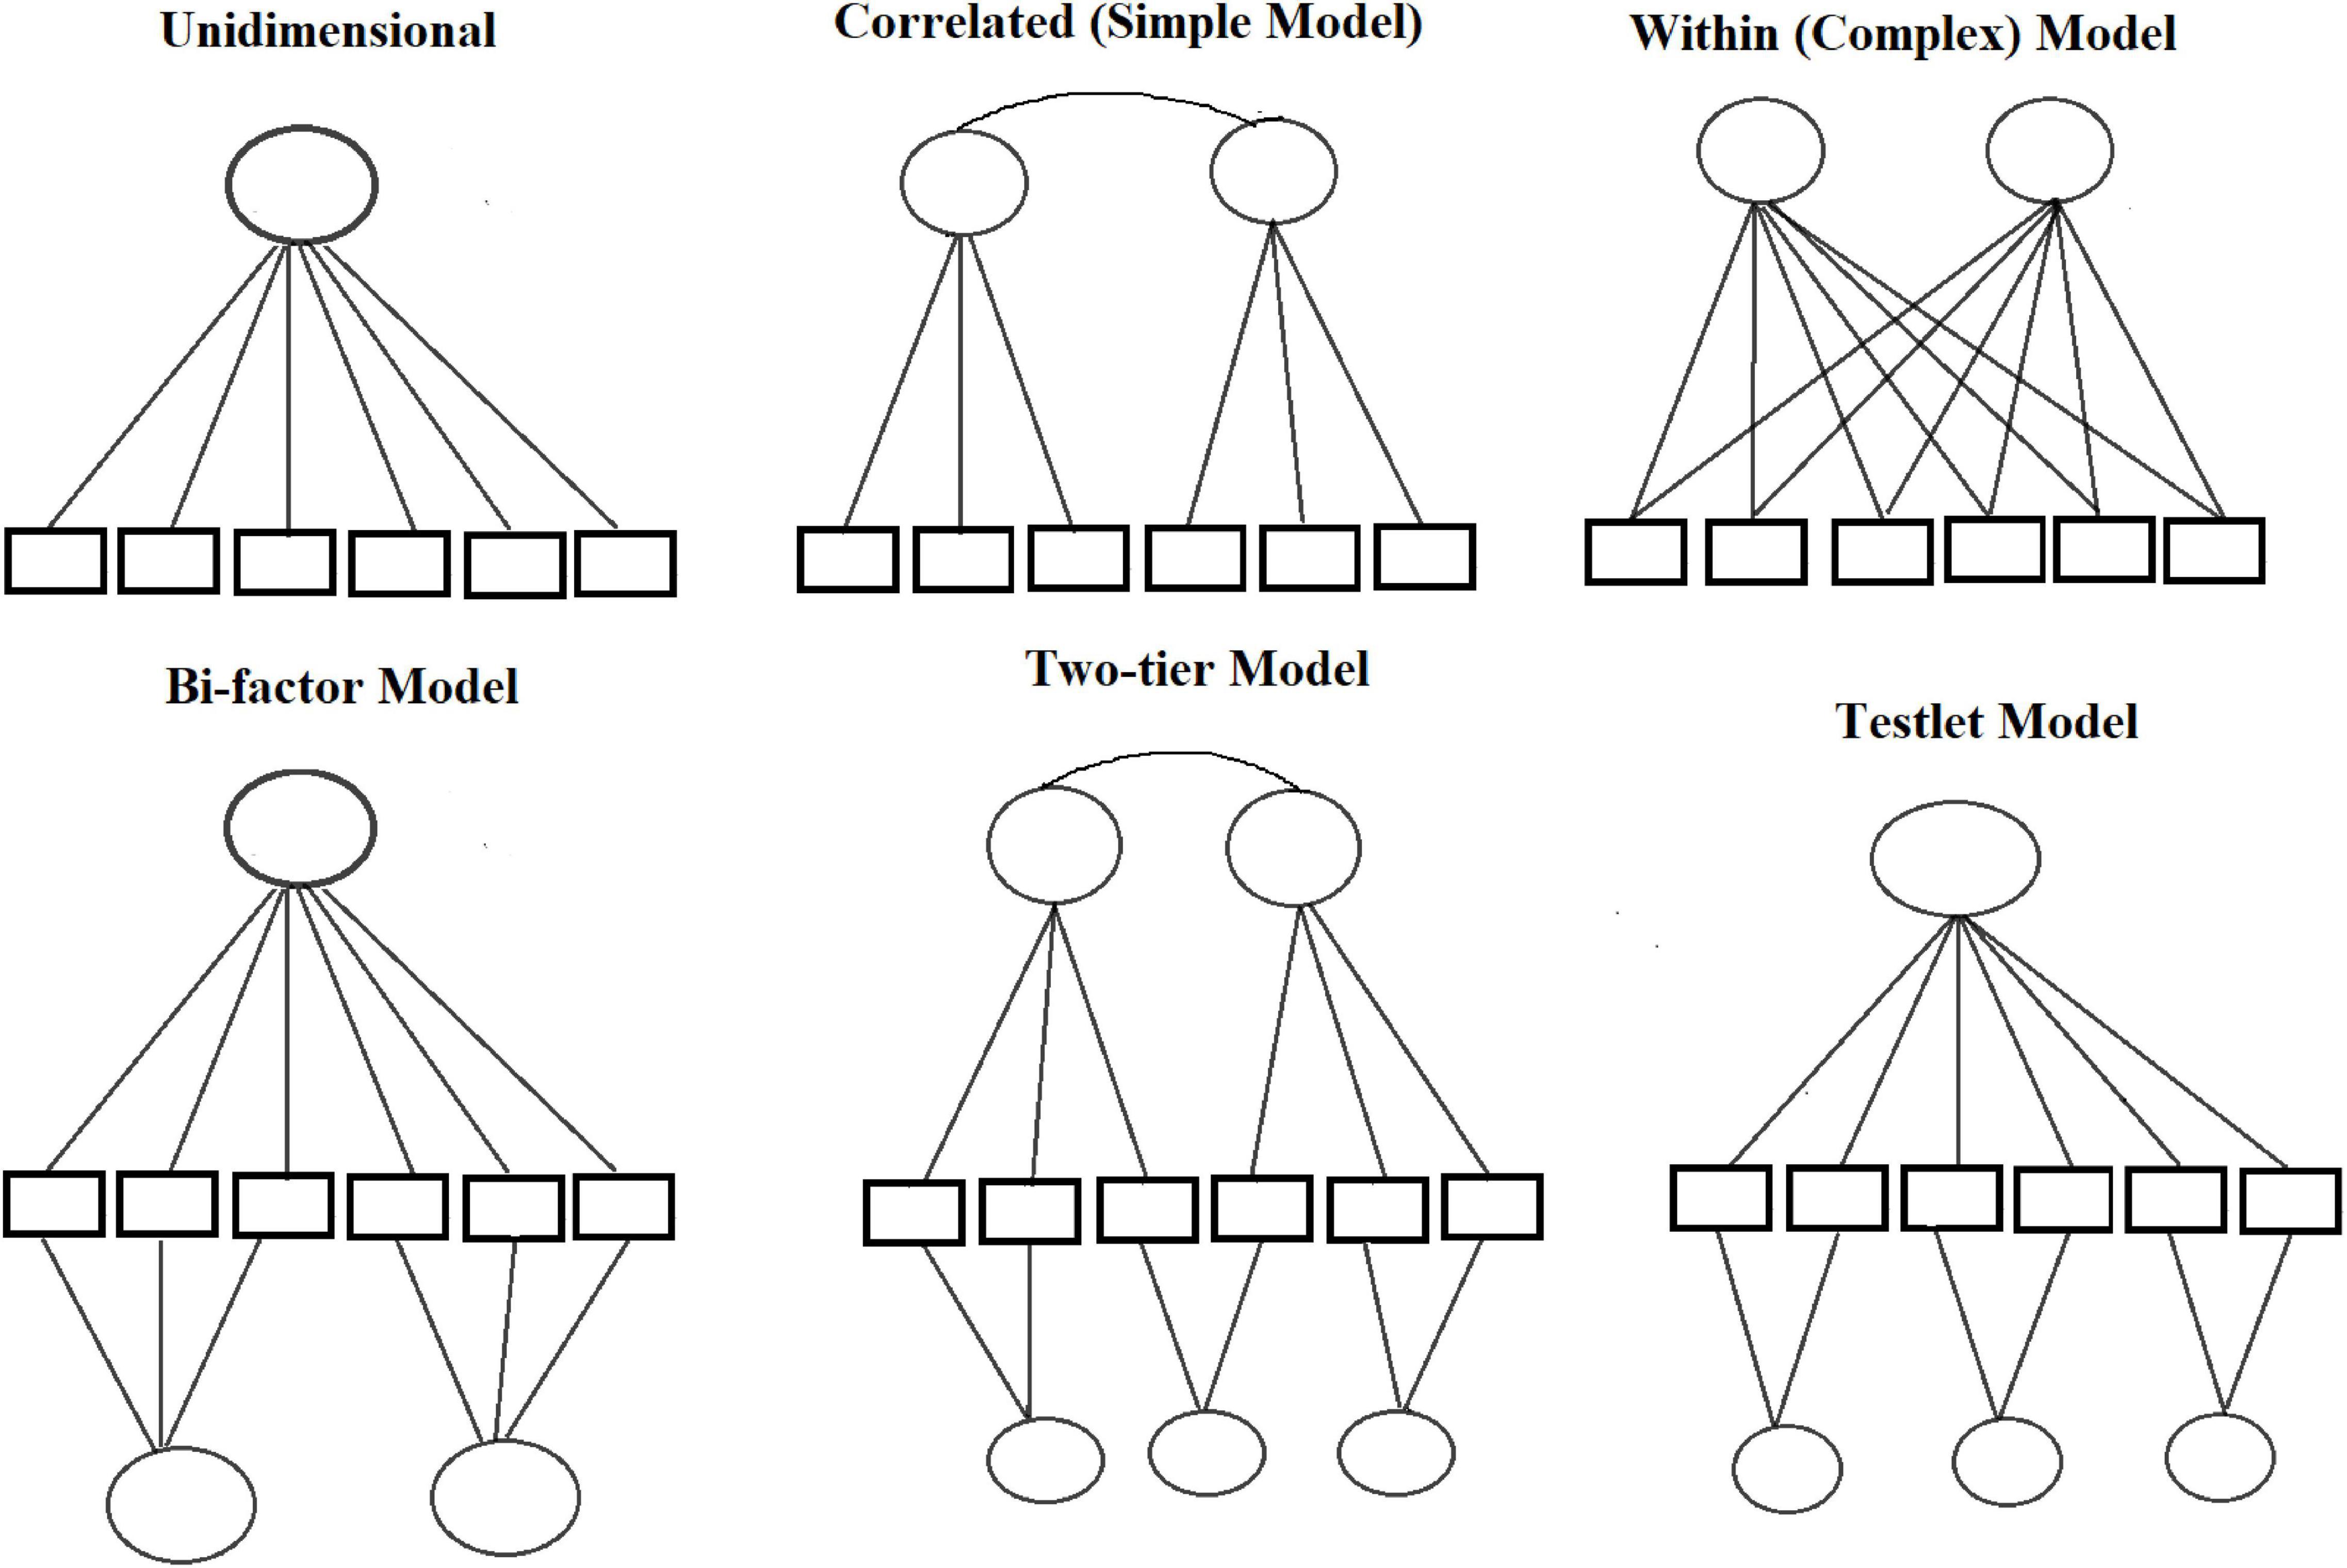
Figure 1. The representing of the structural models which used in the study.
The next step was to evaluate and compare the model fit and person-level model fit of IRT and MIRT models. There are several approaches to assessing model fit to the data: Akaike information criterion (AIC; Akaike, 1974), Bayesian information criterion (BIC; Schwarz, 1978), adjusted Akaike information criterion (AICc; Sugiura, 1978), and sample-adjusted Bayesian information criterion (SABIC; Sclov, 1087). When these criteria are compared between two models, a smaller value corresponds to the better fitting model. M2 (Maydeu-Olivares and Joe, 2005) indicates a good-fitting model when p-values are greater than 0.05. Goodness of fit indices (CFI > 0.90), Tucker-Lewis’s index (TLI > 0.90), and root mean square error of approximation (RMSEA) indicate a good-fitting model when the confidence interval is less than 0.05 (Xu et al., 2017). In the study, we calculated and compared the difference between the values of the fit indices (AIC, BIC) estimated from the training and validation datasets. In addition, the M2* statistics (RMSEA, SRMR, CFI, TLI) were also calculated using the validation data sets and the analyses were performed on training and validation sets for each fold and on each model.
Because person fit indices are important also in a psychometric analysis for detecting examinees with aberrant response patterns that lead to inaccurate measurement (Karabatsos, 2003), they effect the test scores and classification (e.g., Hendrawan et al., 2005) in addition to the model fit indices, person fit statistics were evaluated on overall data set. The person-fit measures lo (Levine and Rubin, 1979) and lz (Drasgow et al., 1985) are provided by the package “mirt.” A small lz value (e.g., less than −2 or −3) may indicate aberrant response patterns, and large negative lz values (Zh) indicate person misfit. Large positive lz (Zh) values indicate that the probability of the examinee’s response pattern is higher than that predicted based on the selected IRT model. Because large negative values indicate misfit and positive values indicate overfit, |Zh| < 2 was used to assess person-level fit (Reise, 1990; Embretson and Reise, 2000; Chalmers, 2012; Desjardins and Bulut, 2018; Paek and Cole, 2019). In the study, we first identified the number of examinees with person-misfit (Zh < −2) and with person-overfit (Zh > +2) on unidimensional and multidimensional models (these values are reported in the Supplementary Table 5). We identified persons-misfit examinees by gender and language group, and then calculated the proportion (%) of these groups and compared them with each other. For example, we estimated the listening subtest using the Rasch model and there were 1231 examinees with person-misfit and 577 of these examinees were girls and 654 examinees were boys, also 823 examinees were all-day German speakers and 408 were non-all-day German speakers [the total sample size of the dataset was 81454 (there were 40,478 girls, 40,976 boys, and 63,656 German and 17,798 NA German students)]. We calculated the proportion of examinees with misfit according to these values (The proportion of persons with misfit in the listening test was 1.425 (%) girls, 1.596 (%) boys, 1.293 (%) German, and 2.292 (%) NA German.
The reliabilities of the test scores were computed on the complete data set with IRT empirical reliability function in mirt package (for details about the estimation reliability in IRT, e.g., Lord, 1977, 1980; Kim and Feldt, 2010; Cheng et al., 2012). However, in IRT the reliability, together with the concept of item and TIF plays an important role for test score accuracy (Andersson and Xin, 2018). Because second aims of the study were to improve the accuracy of the scores, reliabilities, total TIF and cSEM were computed. In the study, TIF functions and standard error of measurement were evaluated with unidimensional and multidimensional model items. Finally, the IRT scores were correlated with each other and the correlation between the scores was calculated. All analyses were performed with “mirt” packages in R, and the codes used in the study were provided in the Supplementary File.
Results
The results of model-data fit, person-level fit, and empirical reliabilities, TIF and standard errors, as well as correlation between scores were reported, respectively.
Model Selection of Item Response Theory, Multidimensional Item Response Theory Models
The results of the model-data fit indices of the unidimensional models of the subtests were shown in Figures 2, 3. In addition to the model-data fit of the listening and reading test, the model-data fit of the German test was evaluated with unidimensional and multidimensional models, and the results of the AIC and BIC fit indices of these models were shown in Figure 3. In addition to the AIC and BIC fit indices, M2* statistics for model fit (RMSEA, SRMR, TLI, and CFI) were computed on the validation data sets, and the results were presented in Figures 4, 5.
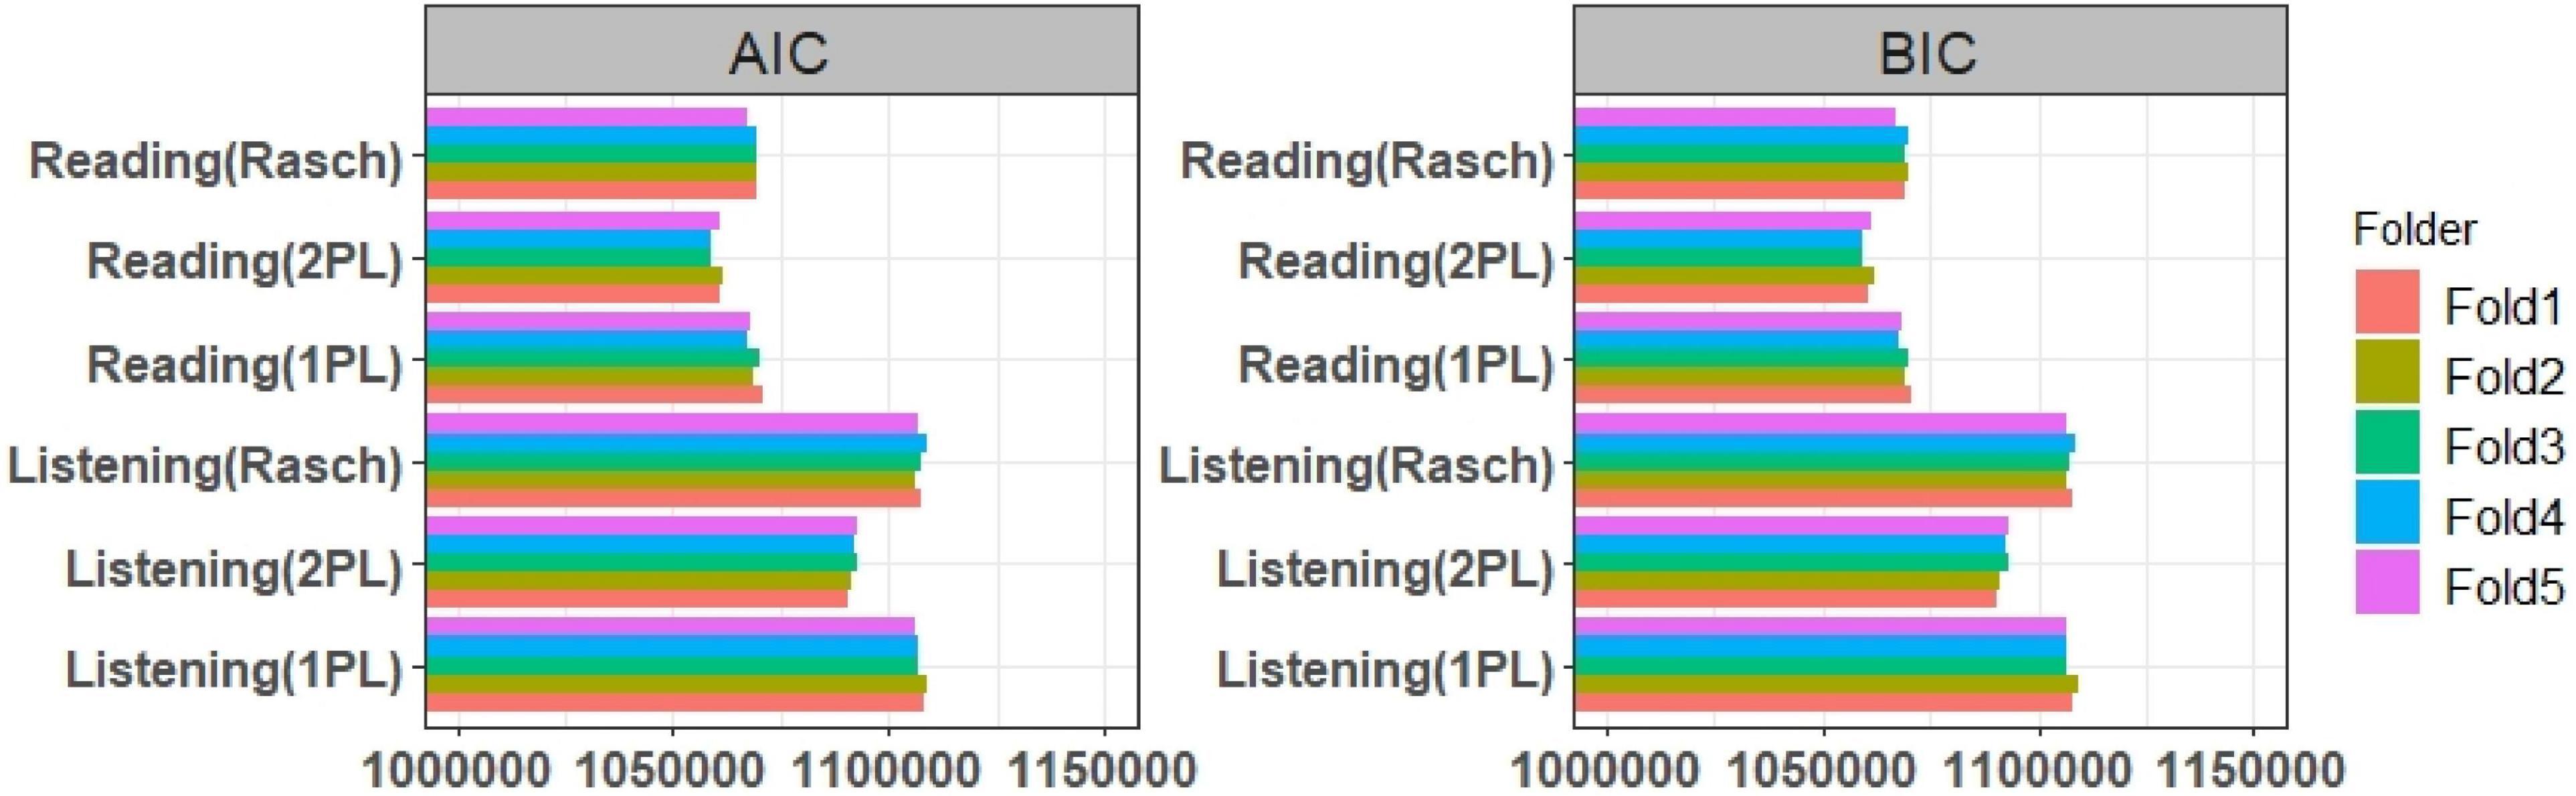
Figure 2. The results of the AIC, BIC values of reading and listening subtests on validation and training sets.
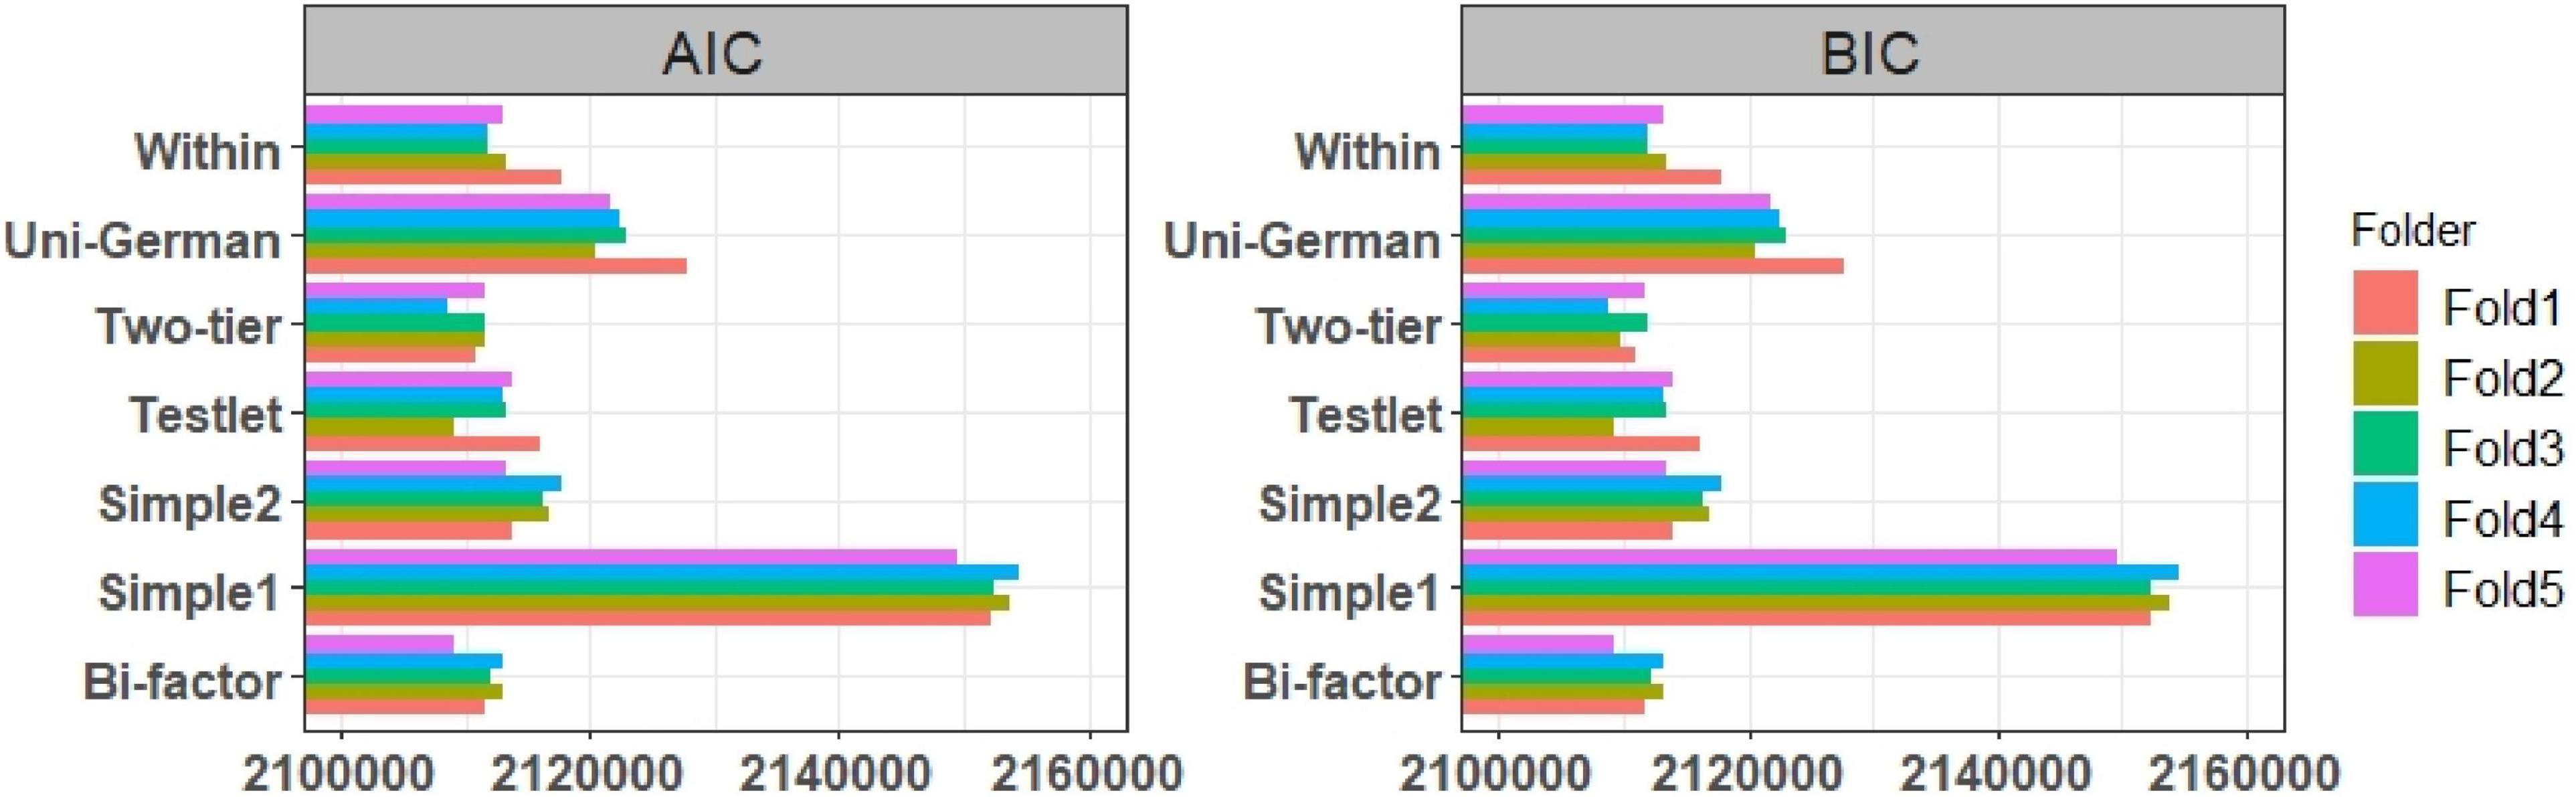
Figure 3. The results of the AIC, BIC values of German test. Simple 1 and Simple 2 show uncorrelated and correlated simple structure, Uni-German shows unidimensional German test, all models were estimated with 2PL model.
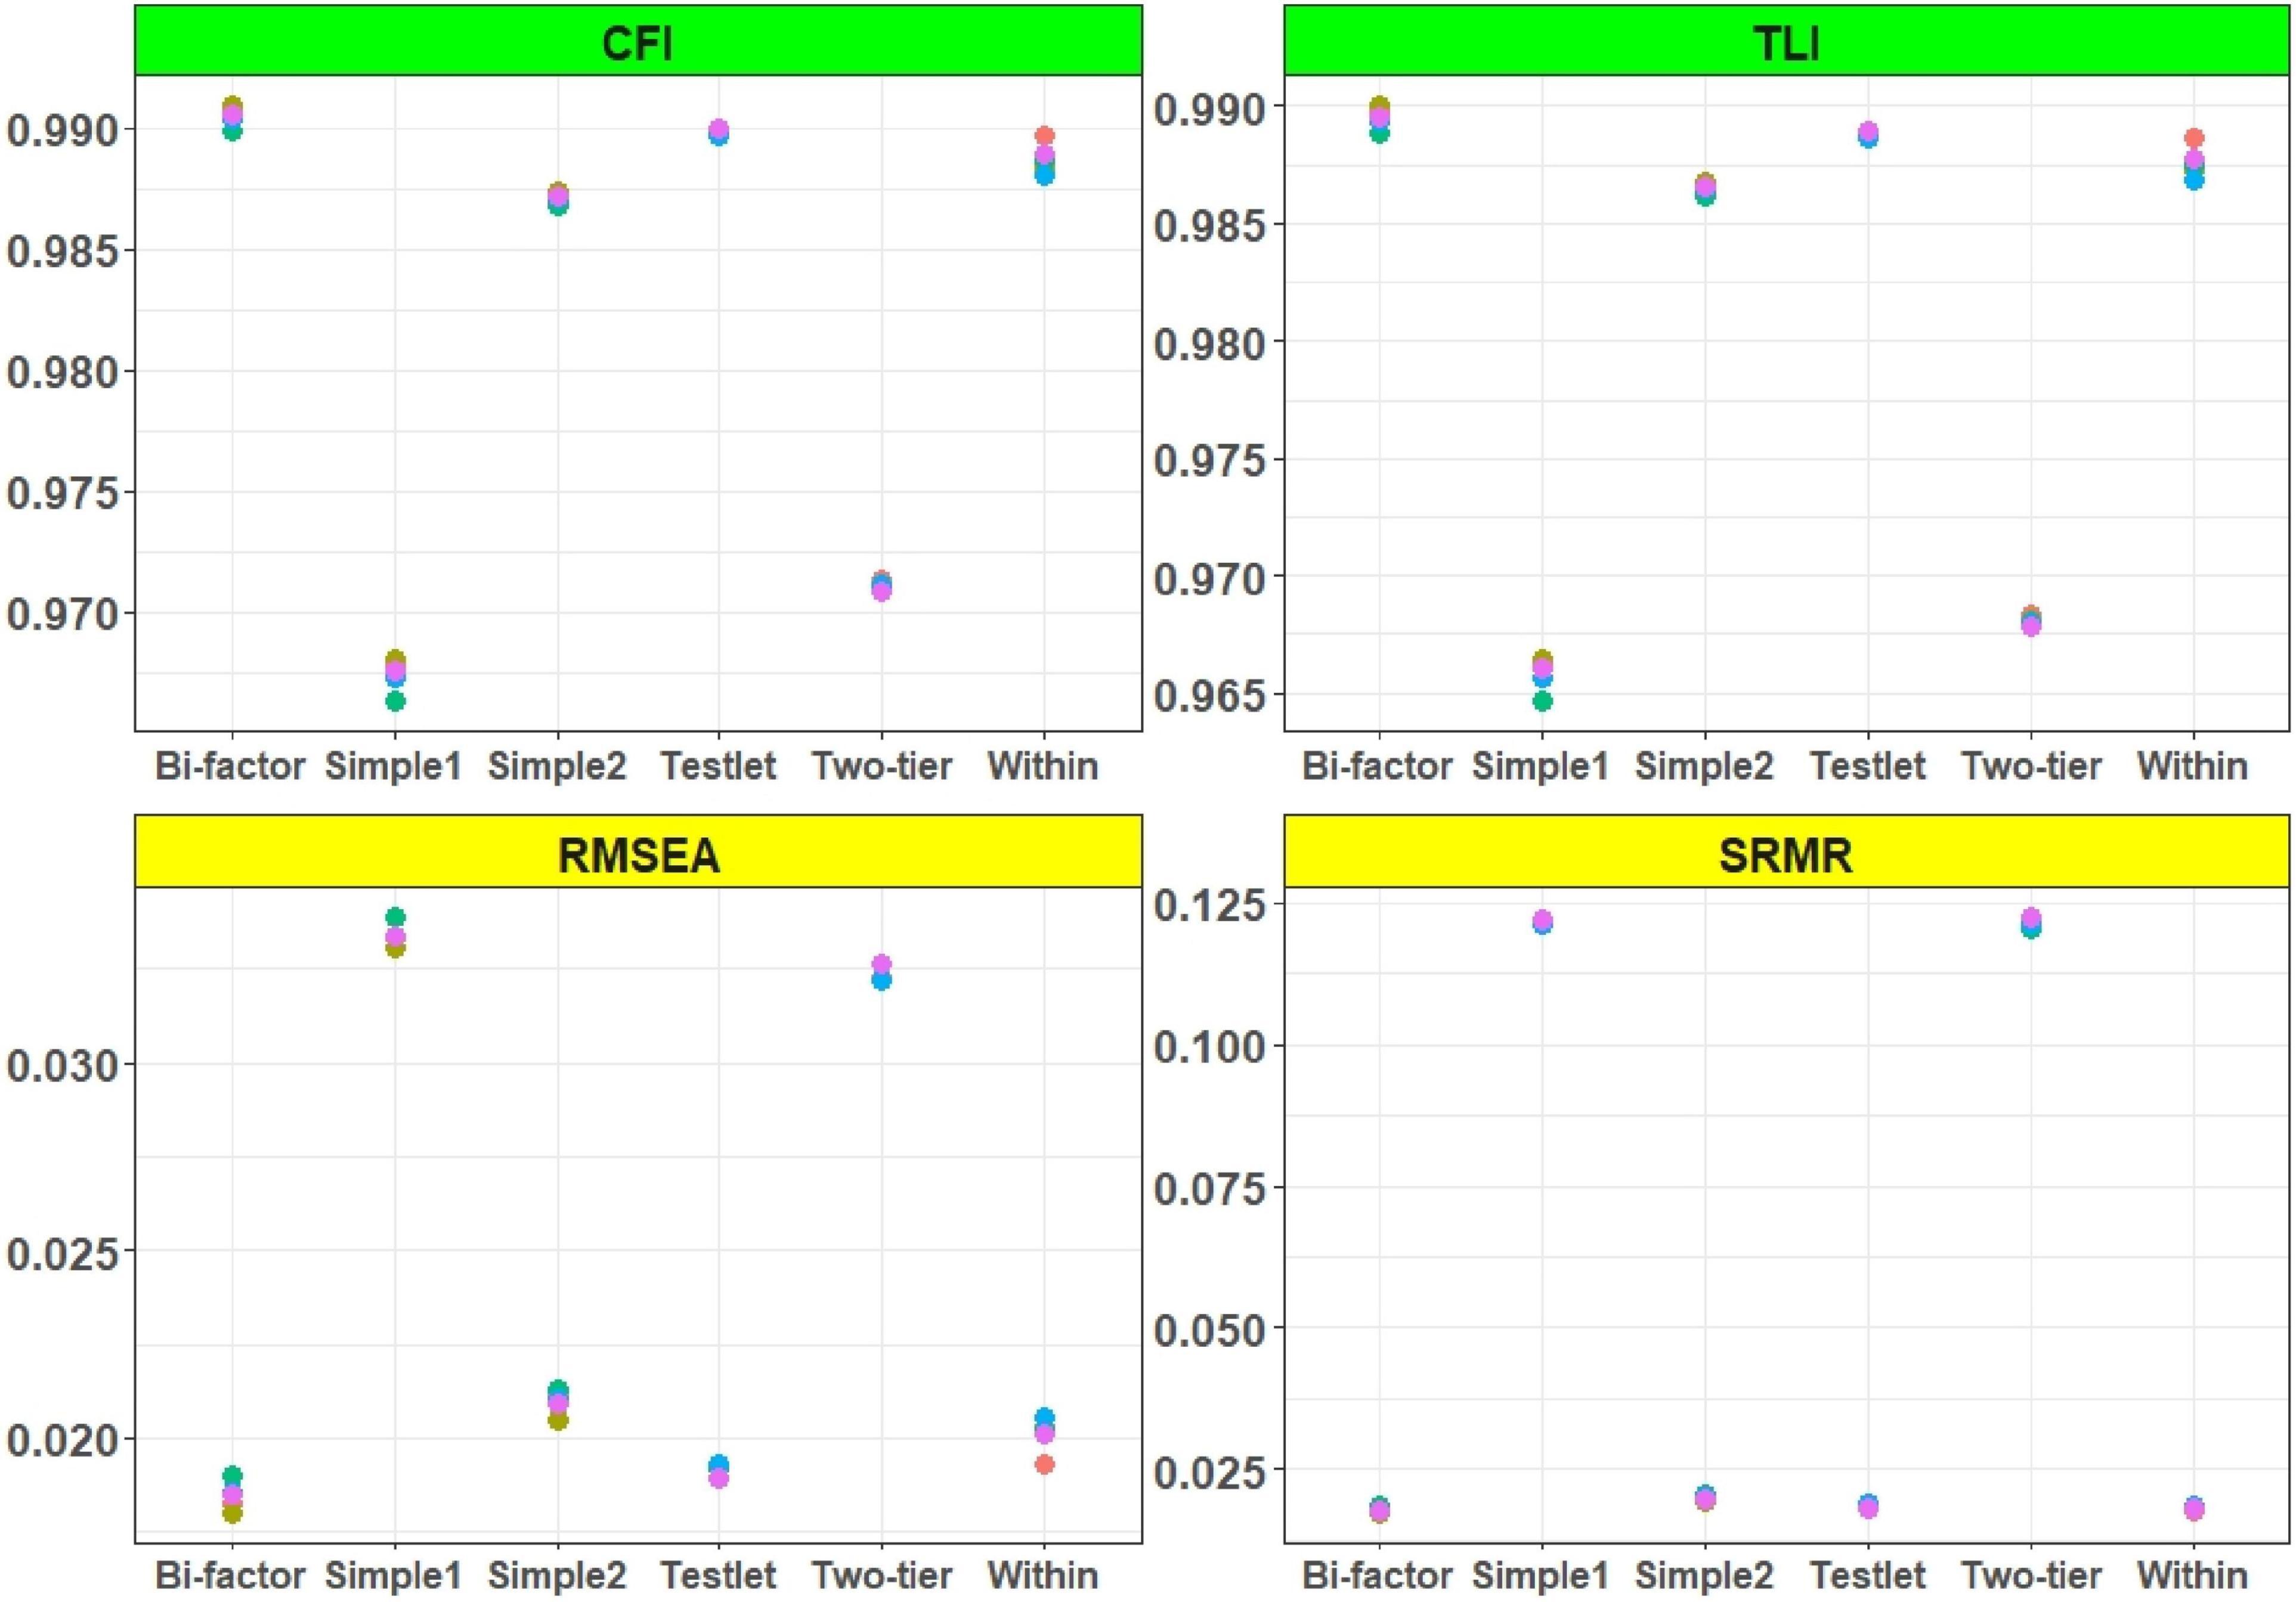
Figure 4. M2* statistics for multidimensional models. Simple 1 and Simple 2 show the uncorrelated and correlated simple structure. All models were estimated with the 2PL model.
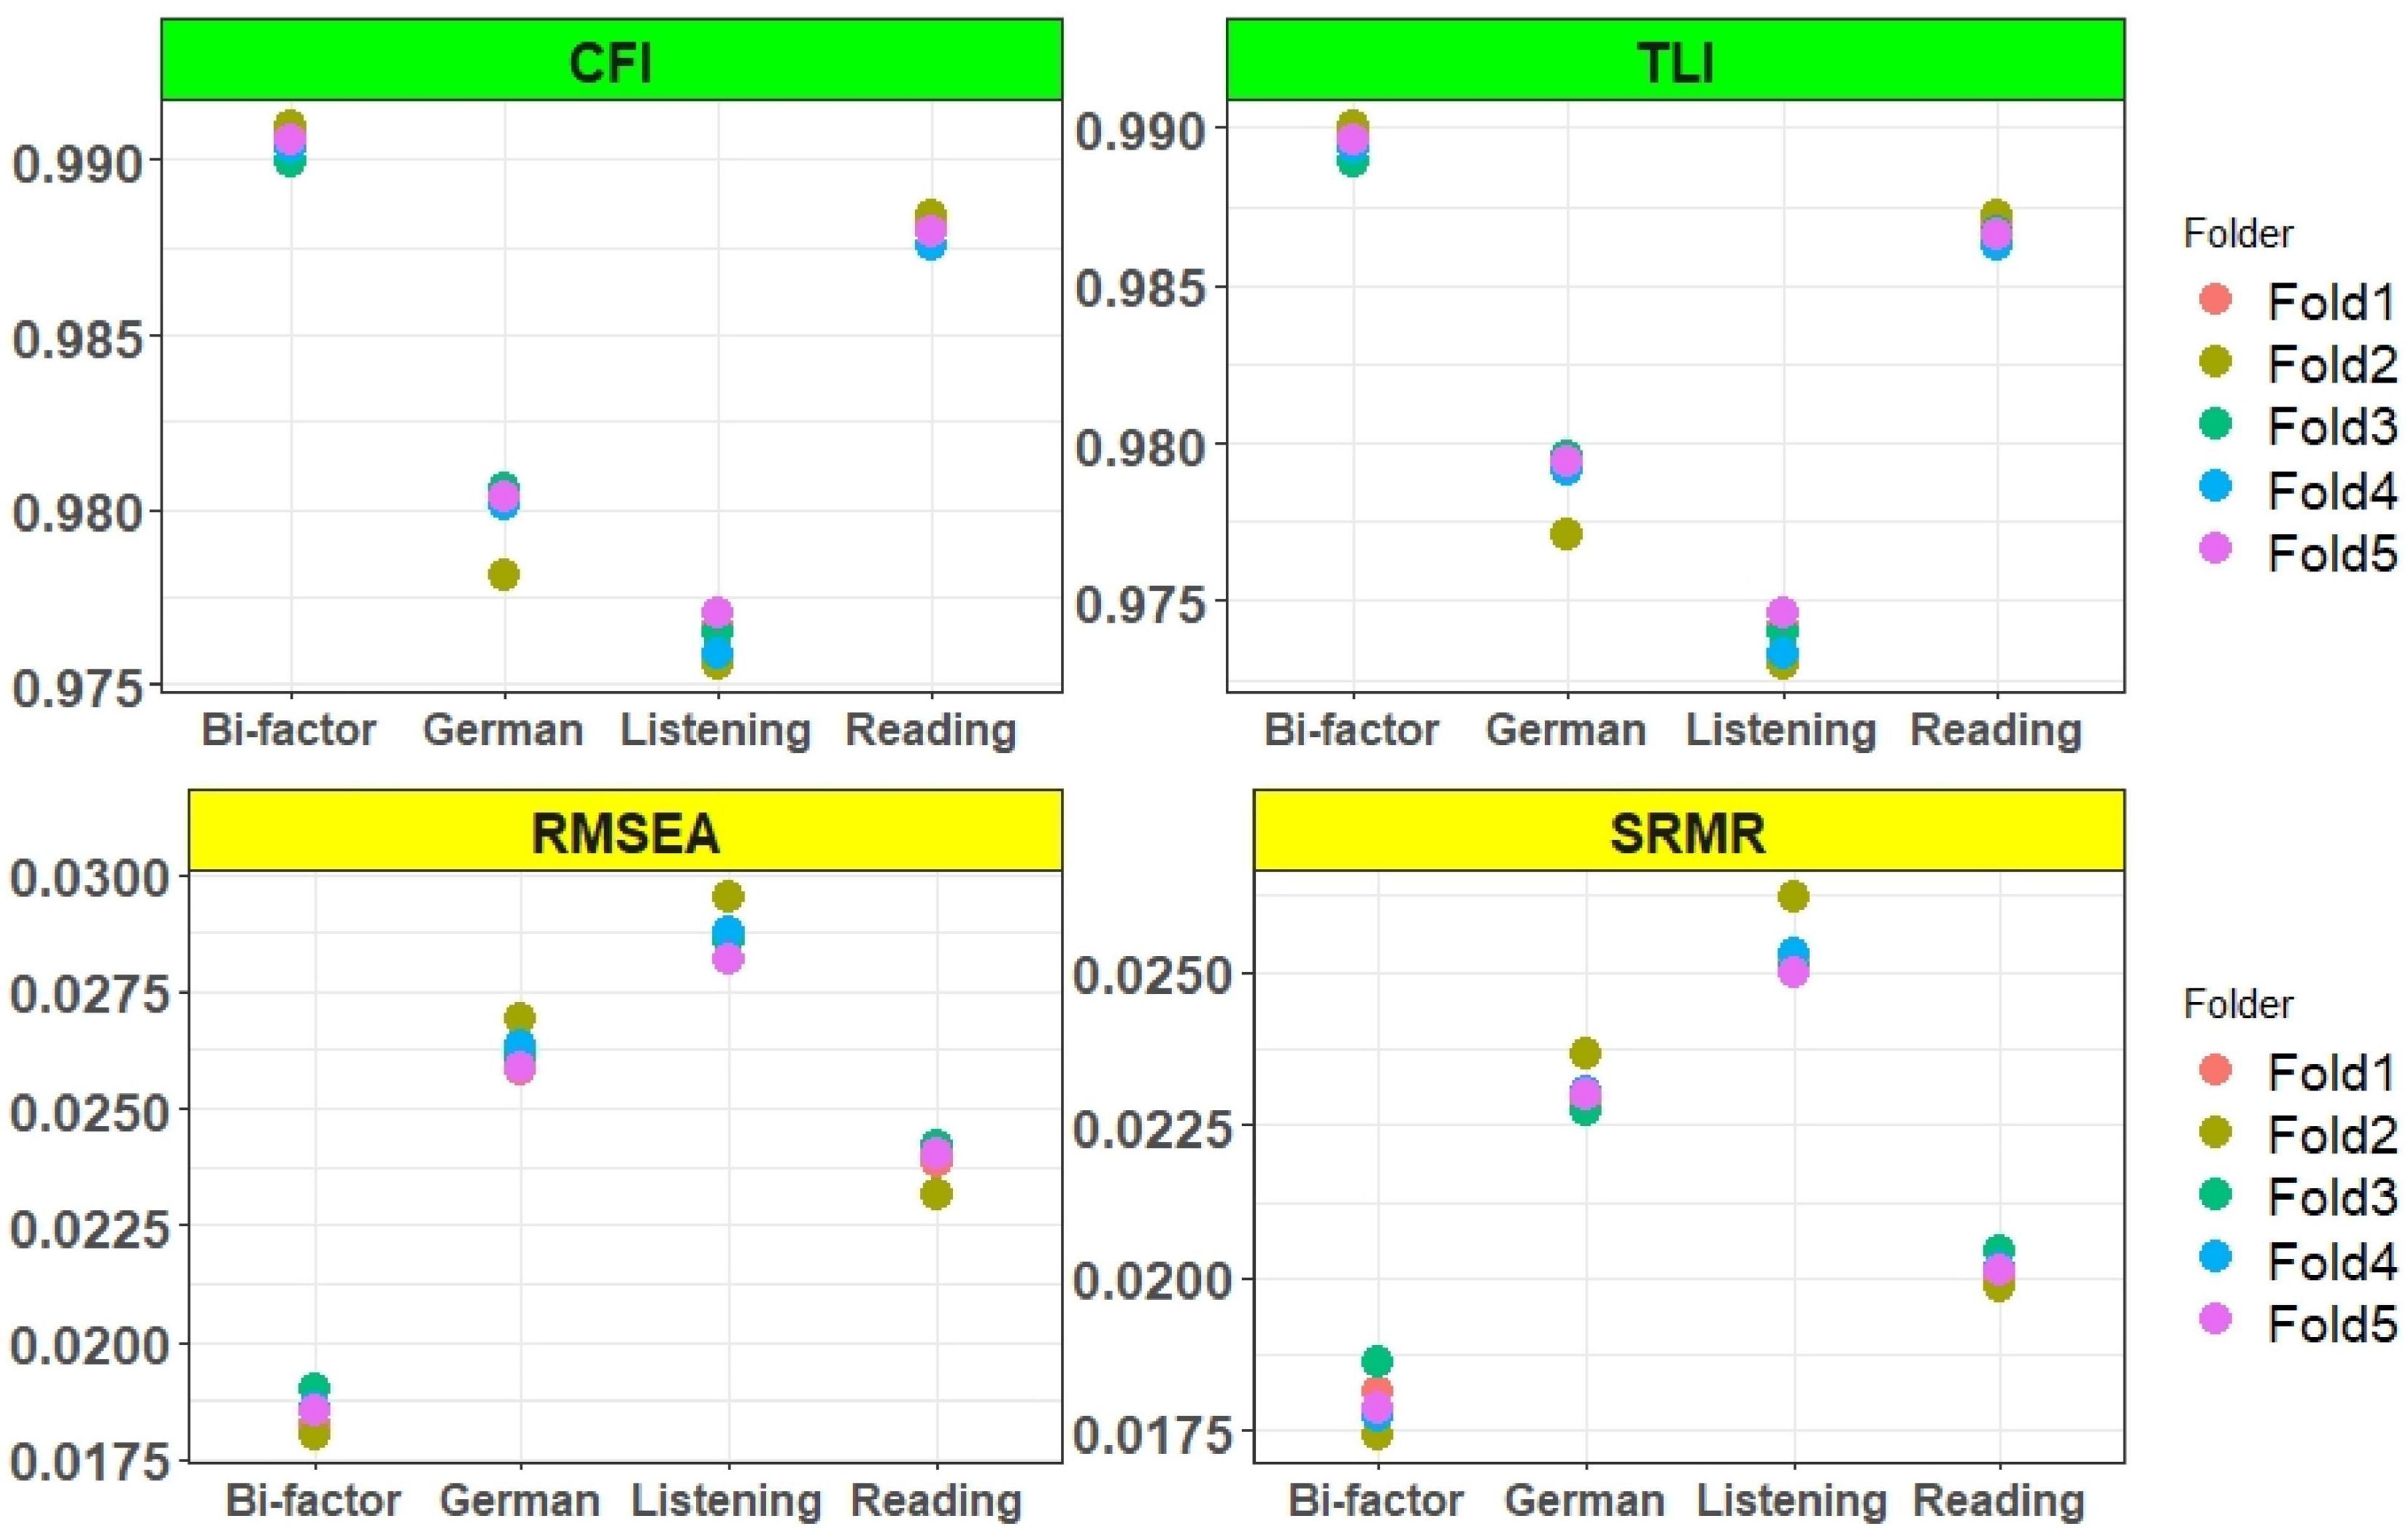
Figure 5. M2* statistic of unidimensional subtests, German test and bifactor models. All models were estimated with 2PL model.
The AIC and BIC values of the listening and reading tests were assessed with unidimensional Rasch, 1PL, and 2PL models. The results showed that the fit indices values of the Rasch and 1PL models (Figure 2) was very similar, and the 2PL model provided the lowest AIC and BIC values for both the reading and listening subtests. The results of the AIC and BIC values for the German test with unidimensional and multidimensional models were shown as below (Figure 3). The results showed that the uncorrelated simple structure had the highest AIC and BIC values. These results indicated that an uncorrelated simple (simple 1) structure may not be the best model for the German test. The unidimensional German model also did not fit as well as the correlated models, while the correlated simple structure (simple 2) and the within model fitted better than both simple 1 and the unidimensional German model. According to the overall results, the bifactor, testlet, and two-tier models provided the lowest AIC and BIC values. As mentioned earlier, the bifactor models assumed that all items loaded on the German test, whereas the listening and reading tests of the items loaded on their own specific factors. In addition to the AIC and BIC values, the fit of the model to the data was evaluated using the M2* statistic. Since the Rasch and 1PL models do not fit as well as the 2PL model, the 2PL model was used for the model comparisons. The results of the RMSEA, SRMR, CFI, and TLI values of the multidimensional models were presented in Figure 4. The CFI and TLI values of each model were higher than 0.90, and according to these values, each of the multidimensional models were fit, but the bifactor model had the highest CFI and TLI values.
The RMSEA values of each model were less than 0.05, and the bifactor model had values less than 0.02. The SRMR values of the two-tier and uncorrelated models were greater than 0.05, indicating that they were not fit. The TLI, CFI, RMSEA, and SRMR values were like the AIC and BIC fit indices, indicating that the bifactor model provided the best fit. The RMSEA (0.019) and SRMR (0.018) values were close to 0 and the goodness-of-fit values (TLI, CFI:0.990) were close to 1. Although the AIC and BIC values were appropriate for the two-tier model, it did not fit as well as the other models, according to the M2* statistics.
The M2* statistical values of the unidimensional subtests and the German test were compared with the bifactor model. The results were shown in Figure 5. We estimated all tests with 2PL models, and the models were fitted on unidimensional and bifactor models. The bifactor model showed the best fit but also the reading test and the total test were very well fitted.
Results of Person Misfits and Reliability of Item Response Theory/Multidimensional Item Response Theory Models
The misfit of the persons was calculated and examined using unidimensional and multidimensional models. The proportion of misfit persons and the overfit person values were calculated for the overall students and separately for each subgroup [girls, boys, all-day German-speaking students, students who are not all-day German-speaking (NA-German)]. The proportions of misfits and overfits were shown in Figure 6. The results indicated that the unidimensional reading test (with Rasch and 2PL model) and the unidimensional German test (Rasch and 2PL) had the highest proportion of misfits. The bifactor model of the German test (2PL) had the lowest proportion of misfit examinees. According to the results of the proportion of overfit examinees, the reading test (with Rasch model) had not overfit examinee, but the bifactor model of German test (2PL) had the highest proportion of overfit person. In addition to the differences between the models, the proportions of the misfit and overfit of subgroups were shown with different colors, and these proportions were also indicated in Figure 6. The results showed that the proportion of NA-German group was higher than the German group in both the misfit and overfit of the persons. The proportion of misfit girls was not very different from that of misfit boys, and the proportions of overfitting were also similar for girls and boys. The results of the proportion of misfits and overfits in the tests with multidimensional models are shown in Figure 7. The testlet and two-tier models had the lowest proportion of person misfit but the highest overfit. Similarly, within and correlated models (simple 2) had the highest proportion of misfit and within models (Rasch) had the lowest proportion of overfit. The proportion of subgroups was also similar for the multidimensional models. The group with the highest misfit and overfit was the NA German group.
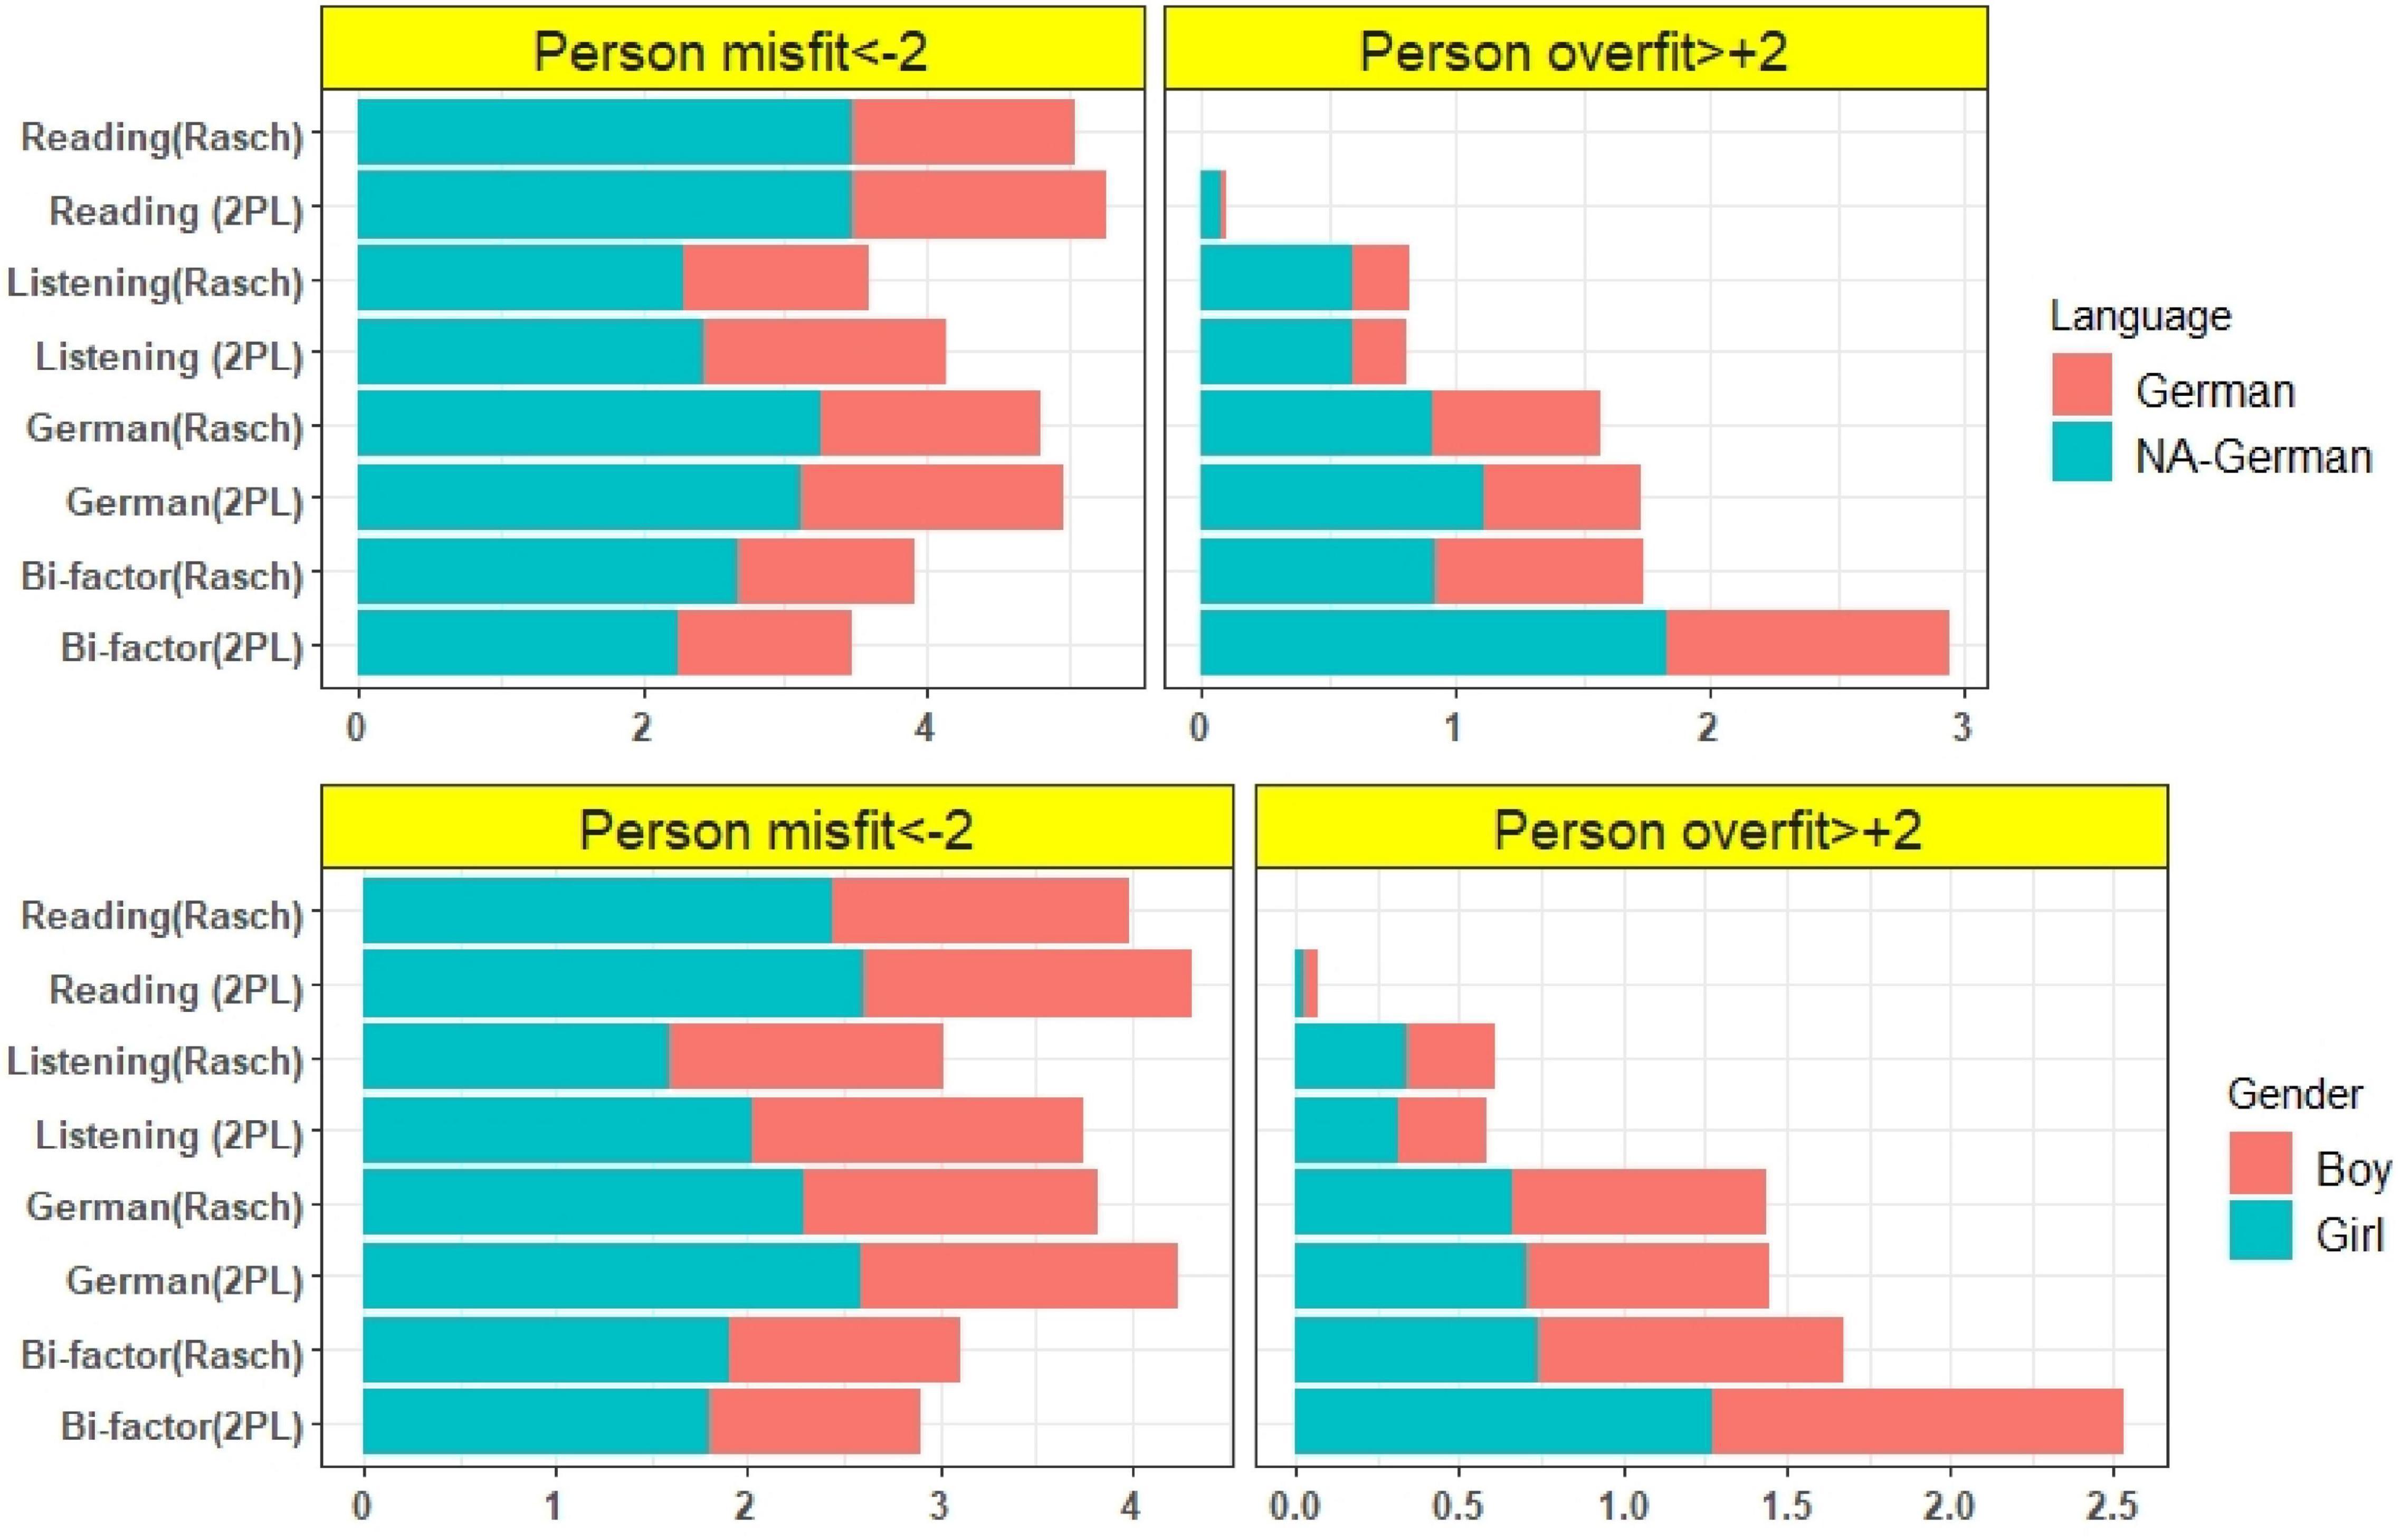
Figure 6. Proportion (%) of the misfit and overfit person of unidimensional reading, listening, German test and bifactor model of German test.
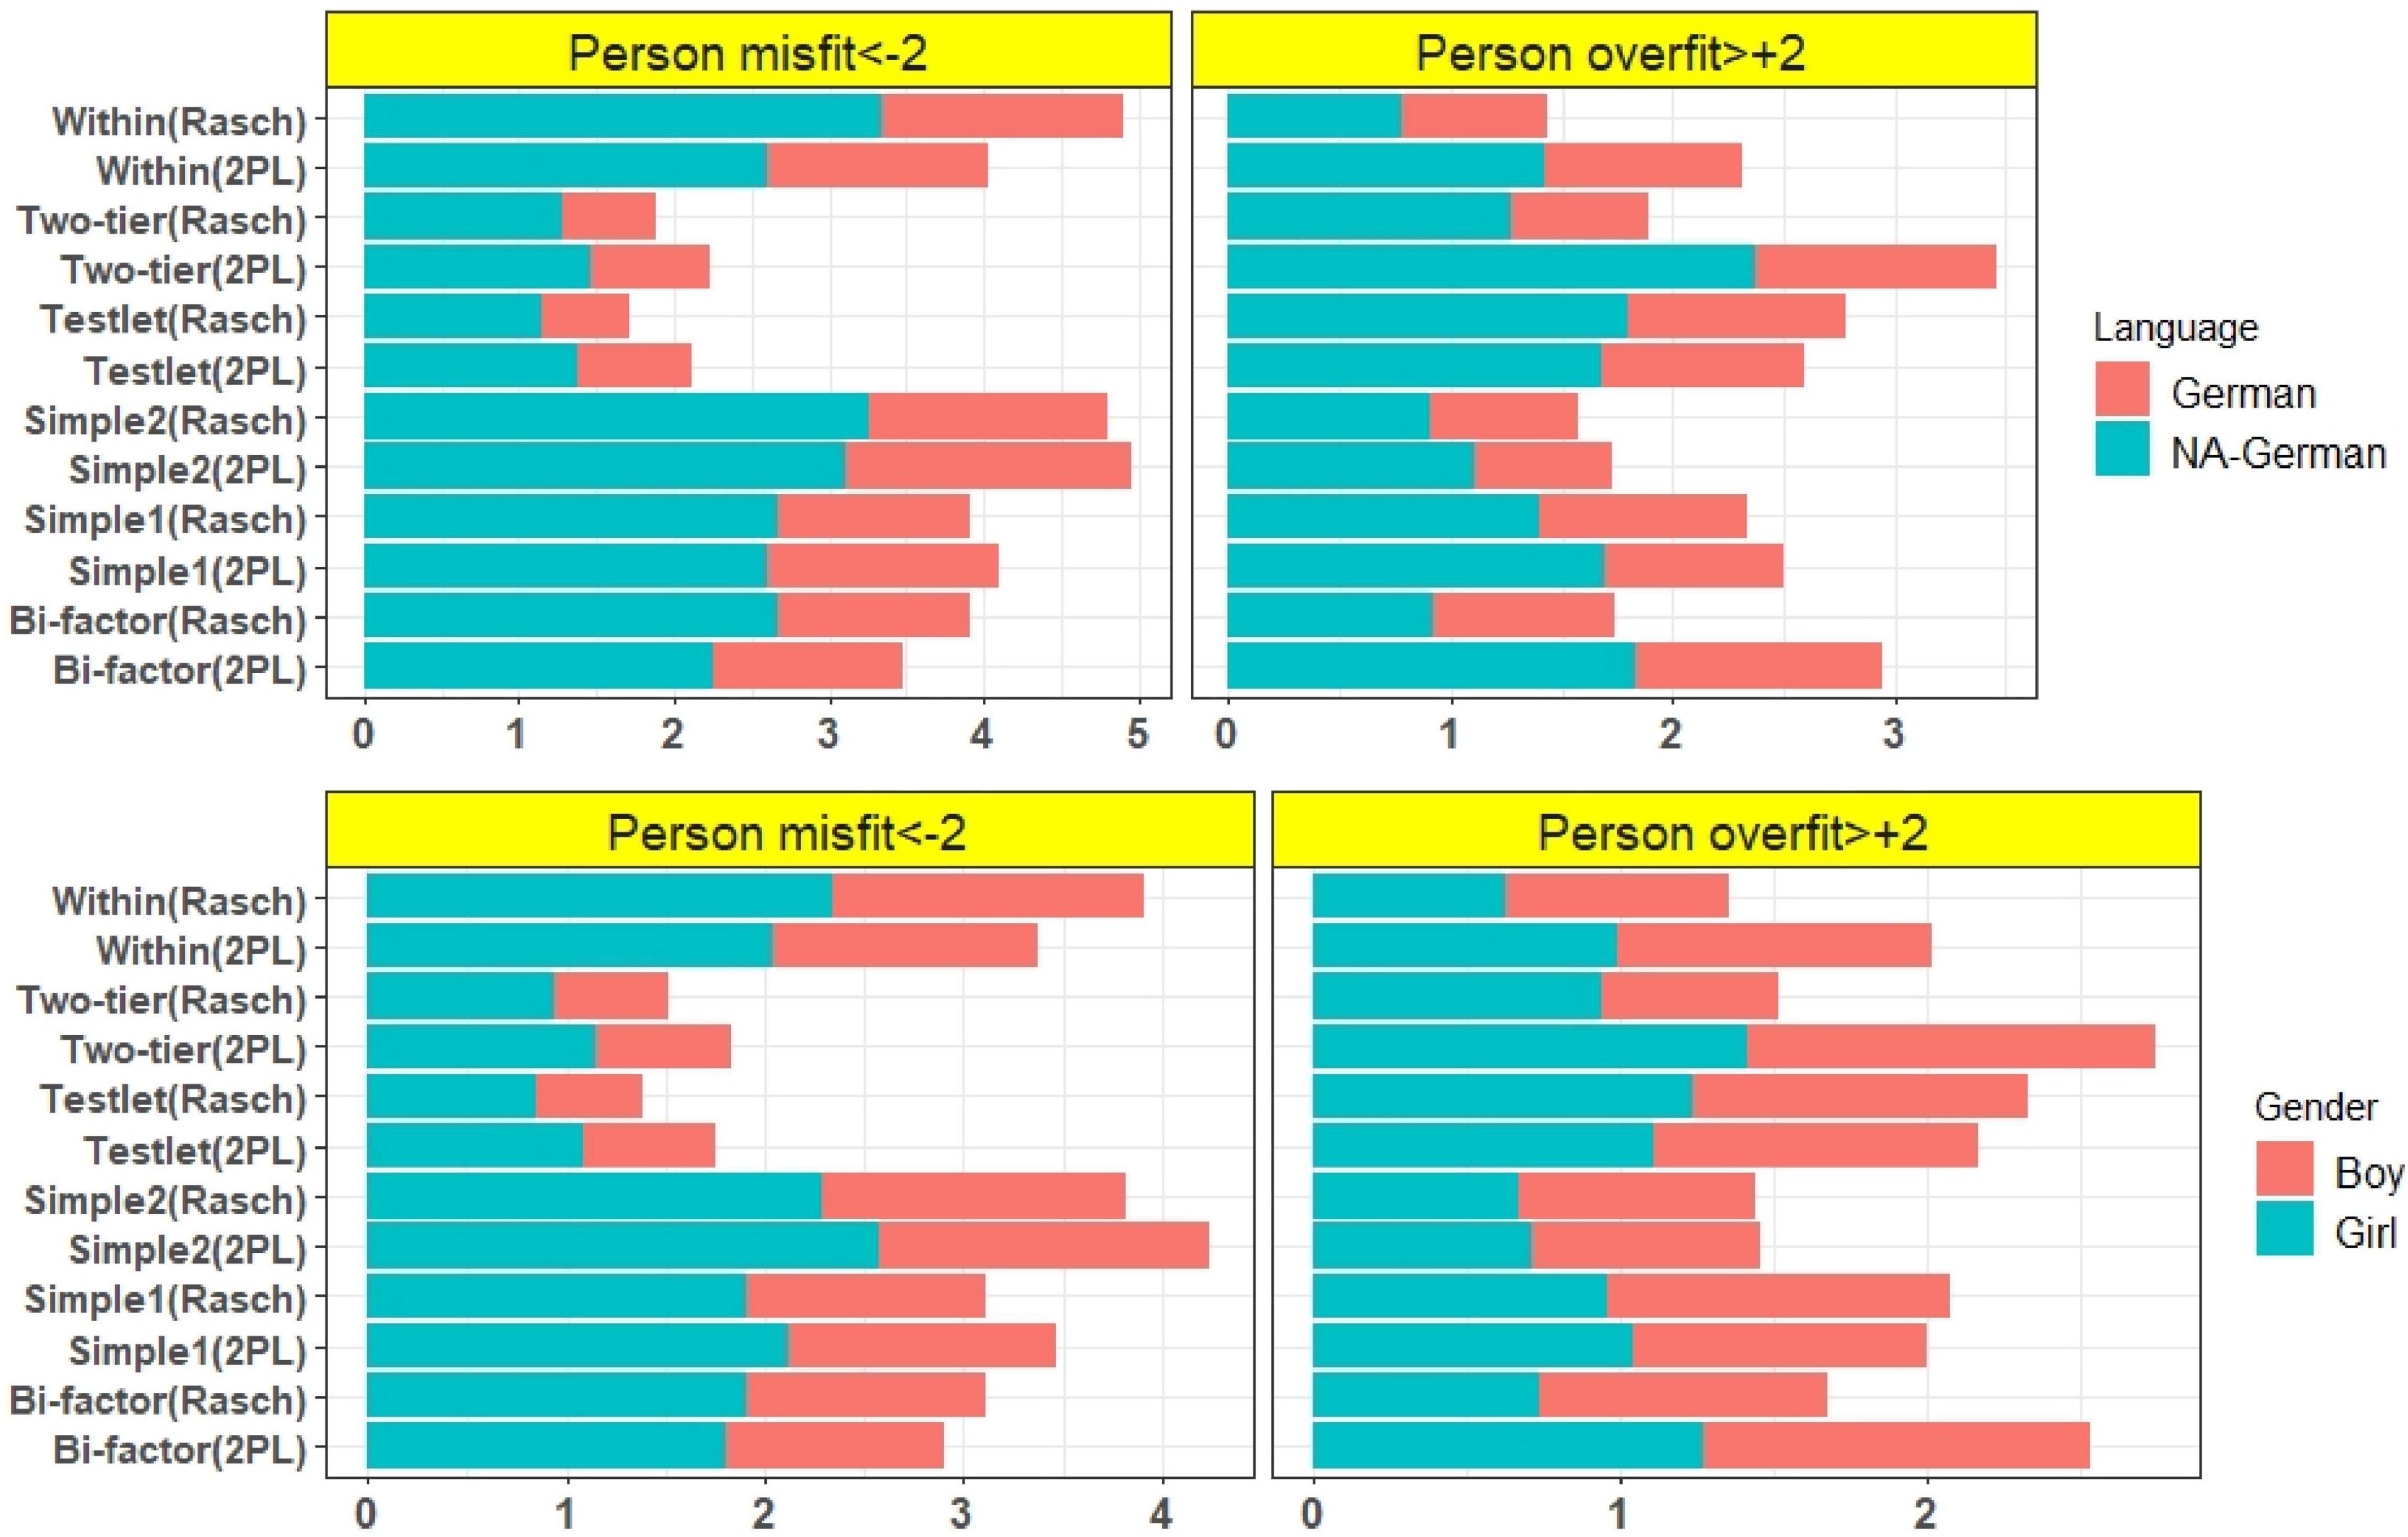
Figure 7. Proportion (%) of the misfit and overfit person of multidimensional models of German Test.
Test Score Correlations
The correlations between the subtests and the test scores were presented in Figure 8. The results indicated that the correlation between the reading and listening subtests is 0.72 (Rasch model) and 0.73 (2PL). The correlation between German test and reading and listening subscores was very high for both models (Rasch and 2PL) and was close to 1. In addition to the one general or primary factor, the subsets of items in the bifactor model, the two-level model, and the testlet model load on their own specific factor, respectively. The correlation between these general factors and the specific factors was also estimated and the results were presented in Figure 9. The results indicated that the general factors of each model were highly correlated and the correlation between the specific factors and the general factors was low.
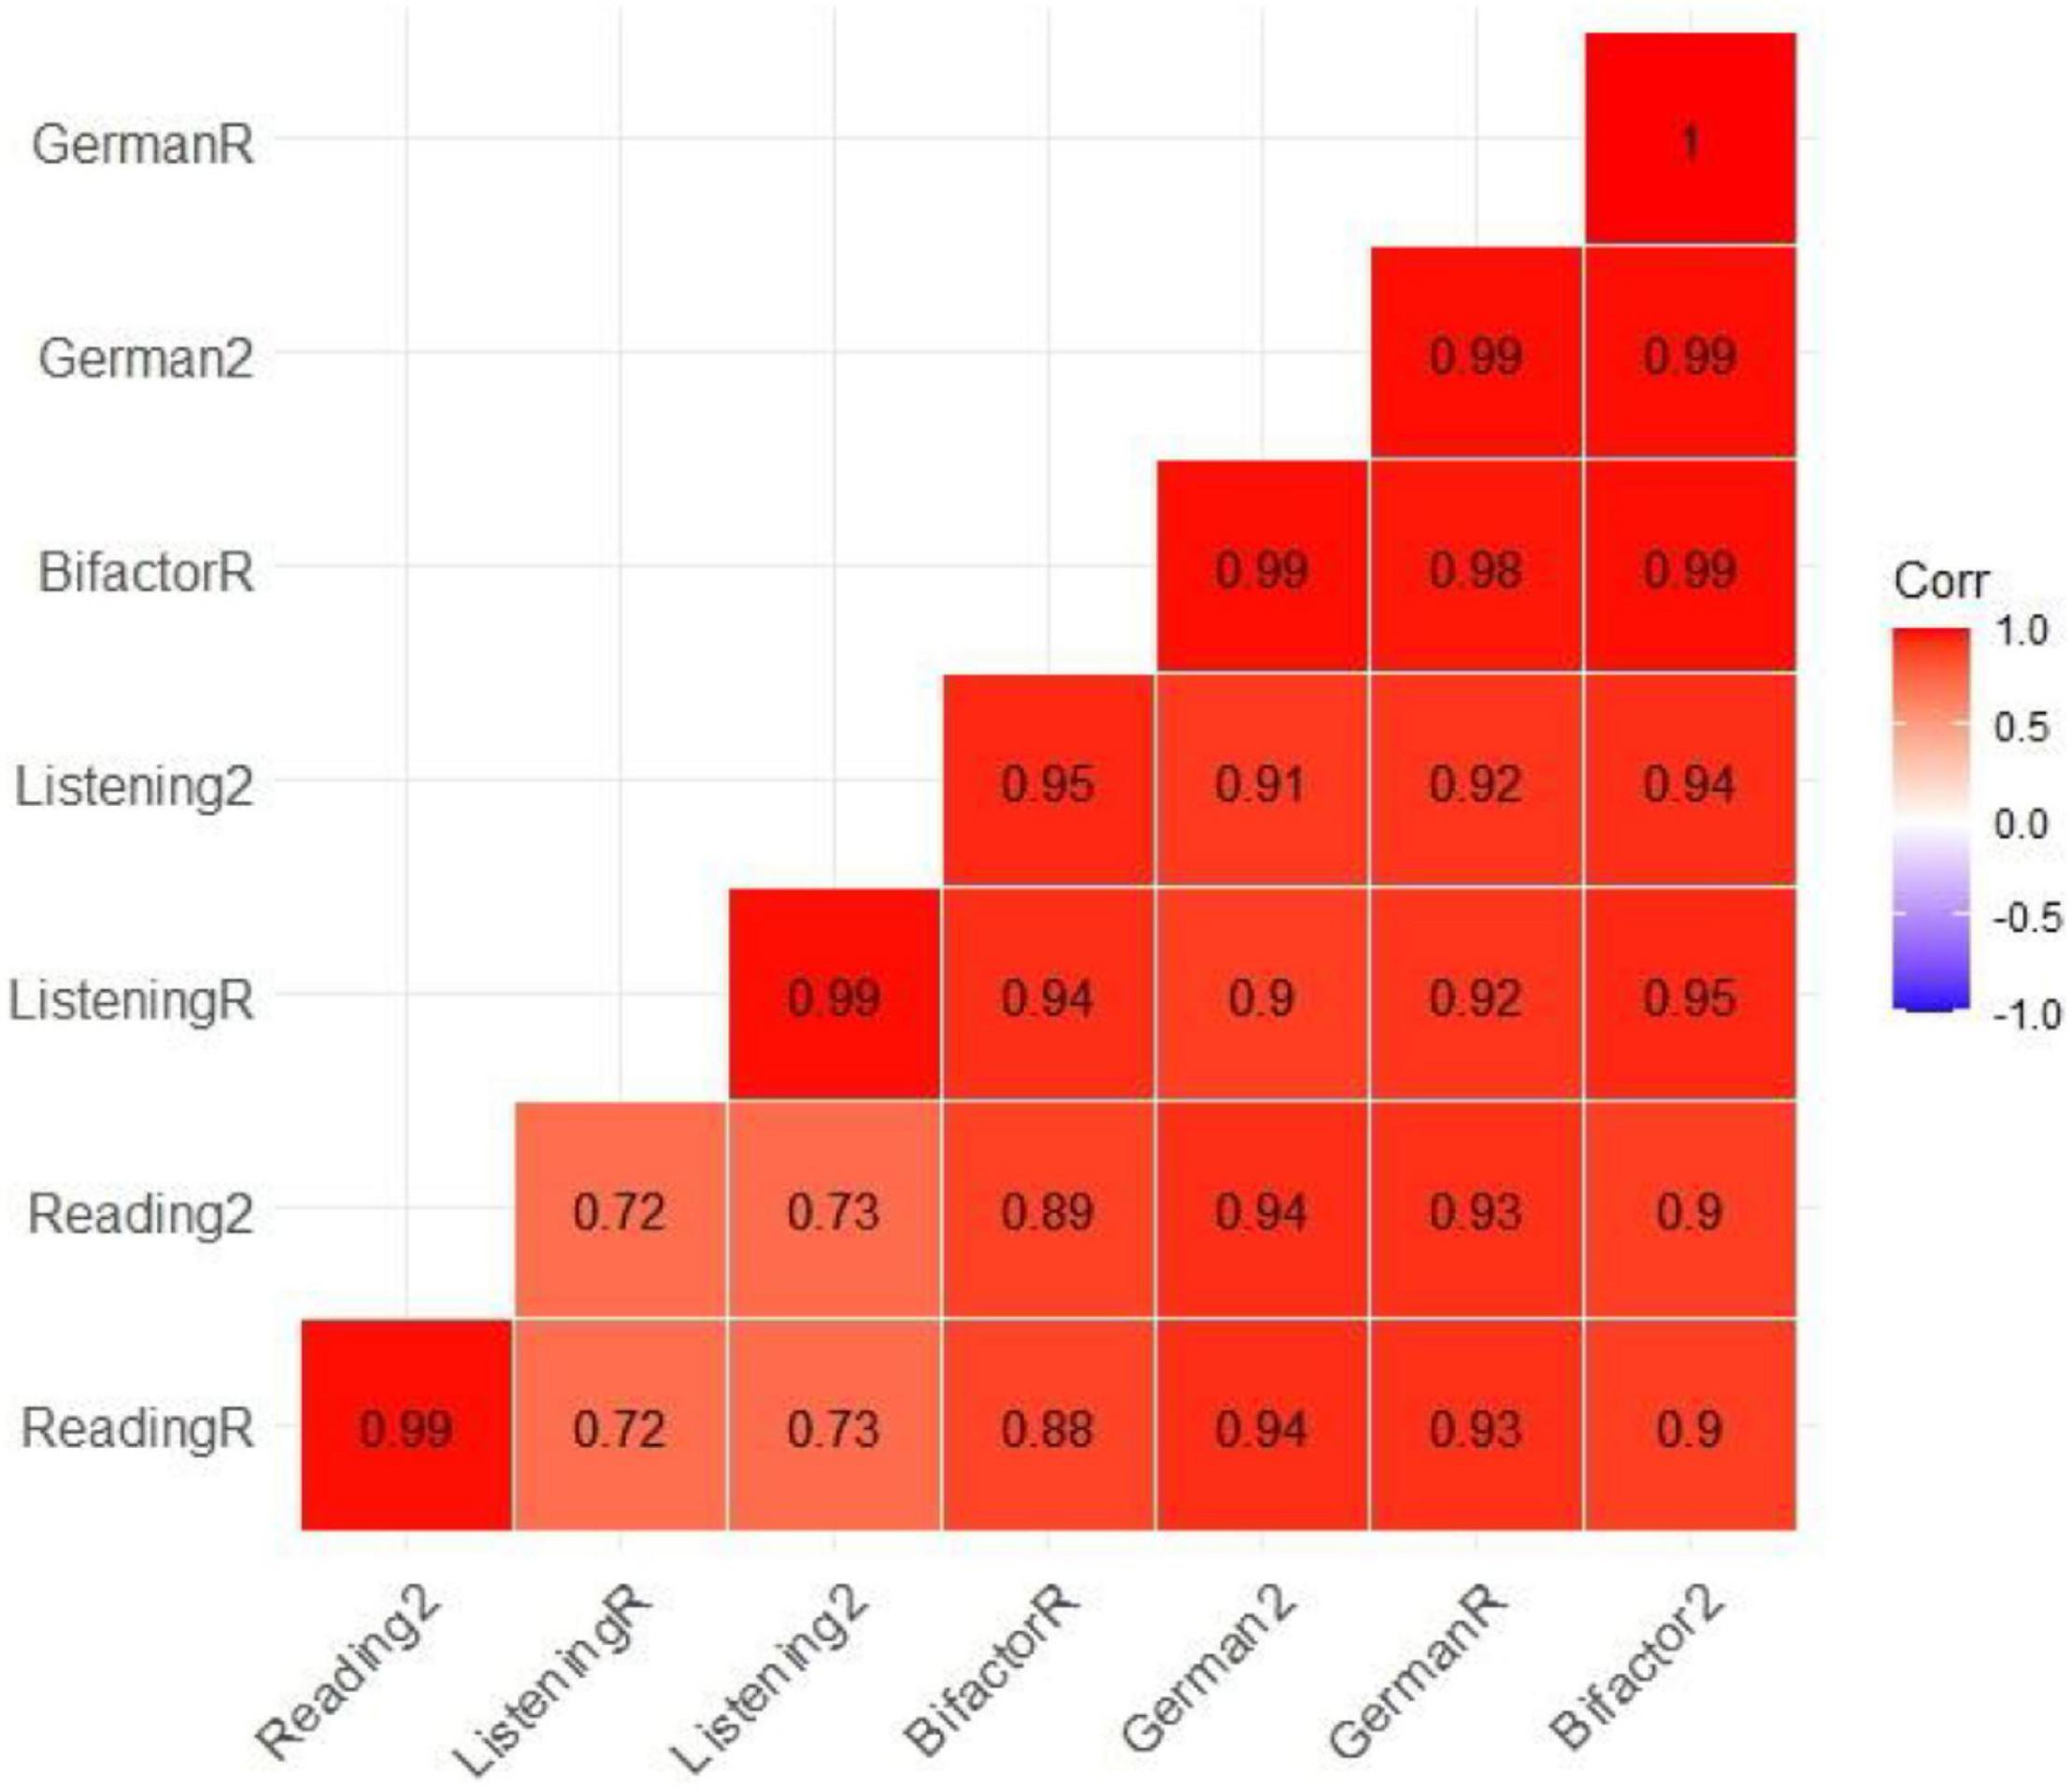
Figure 8. Pearson correlations between subtest scores and German test scores have been estimated using the MAP method. This matrix included only the correlation between the general factors.
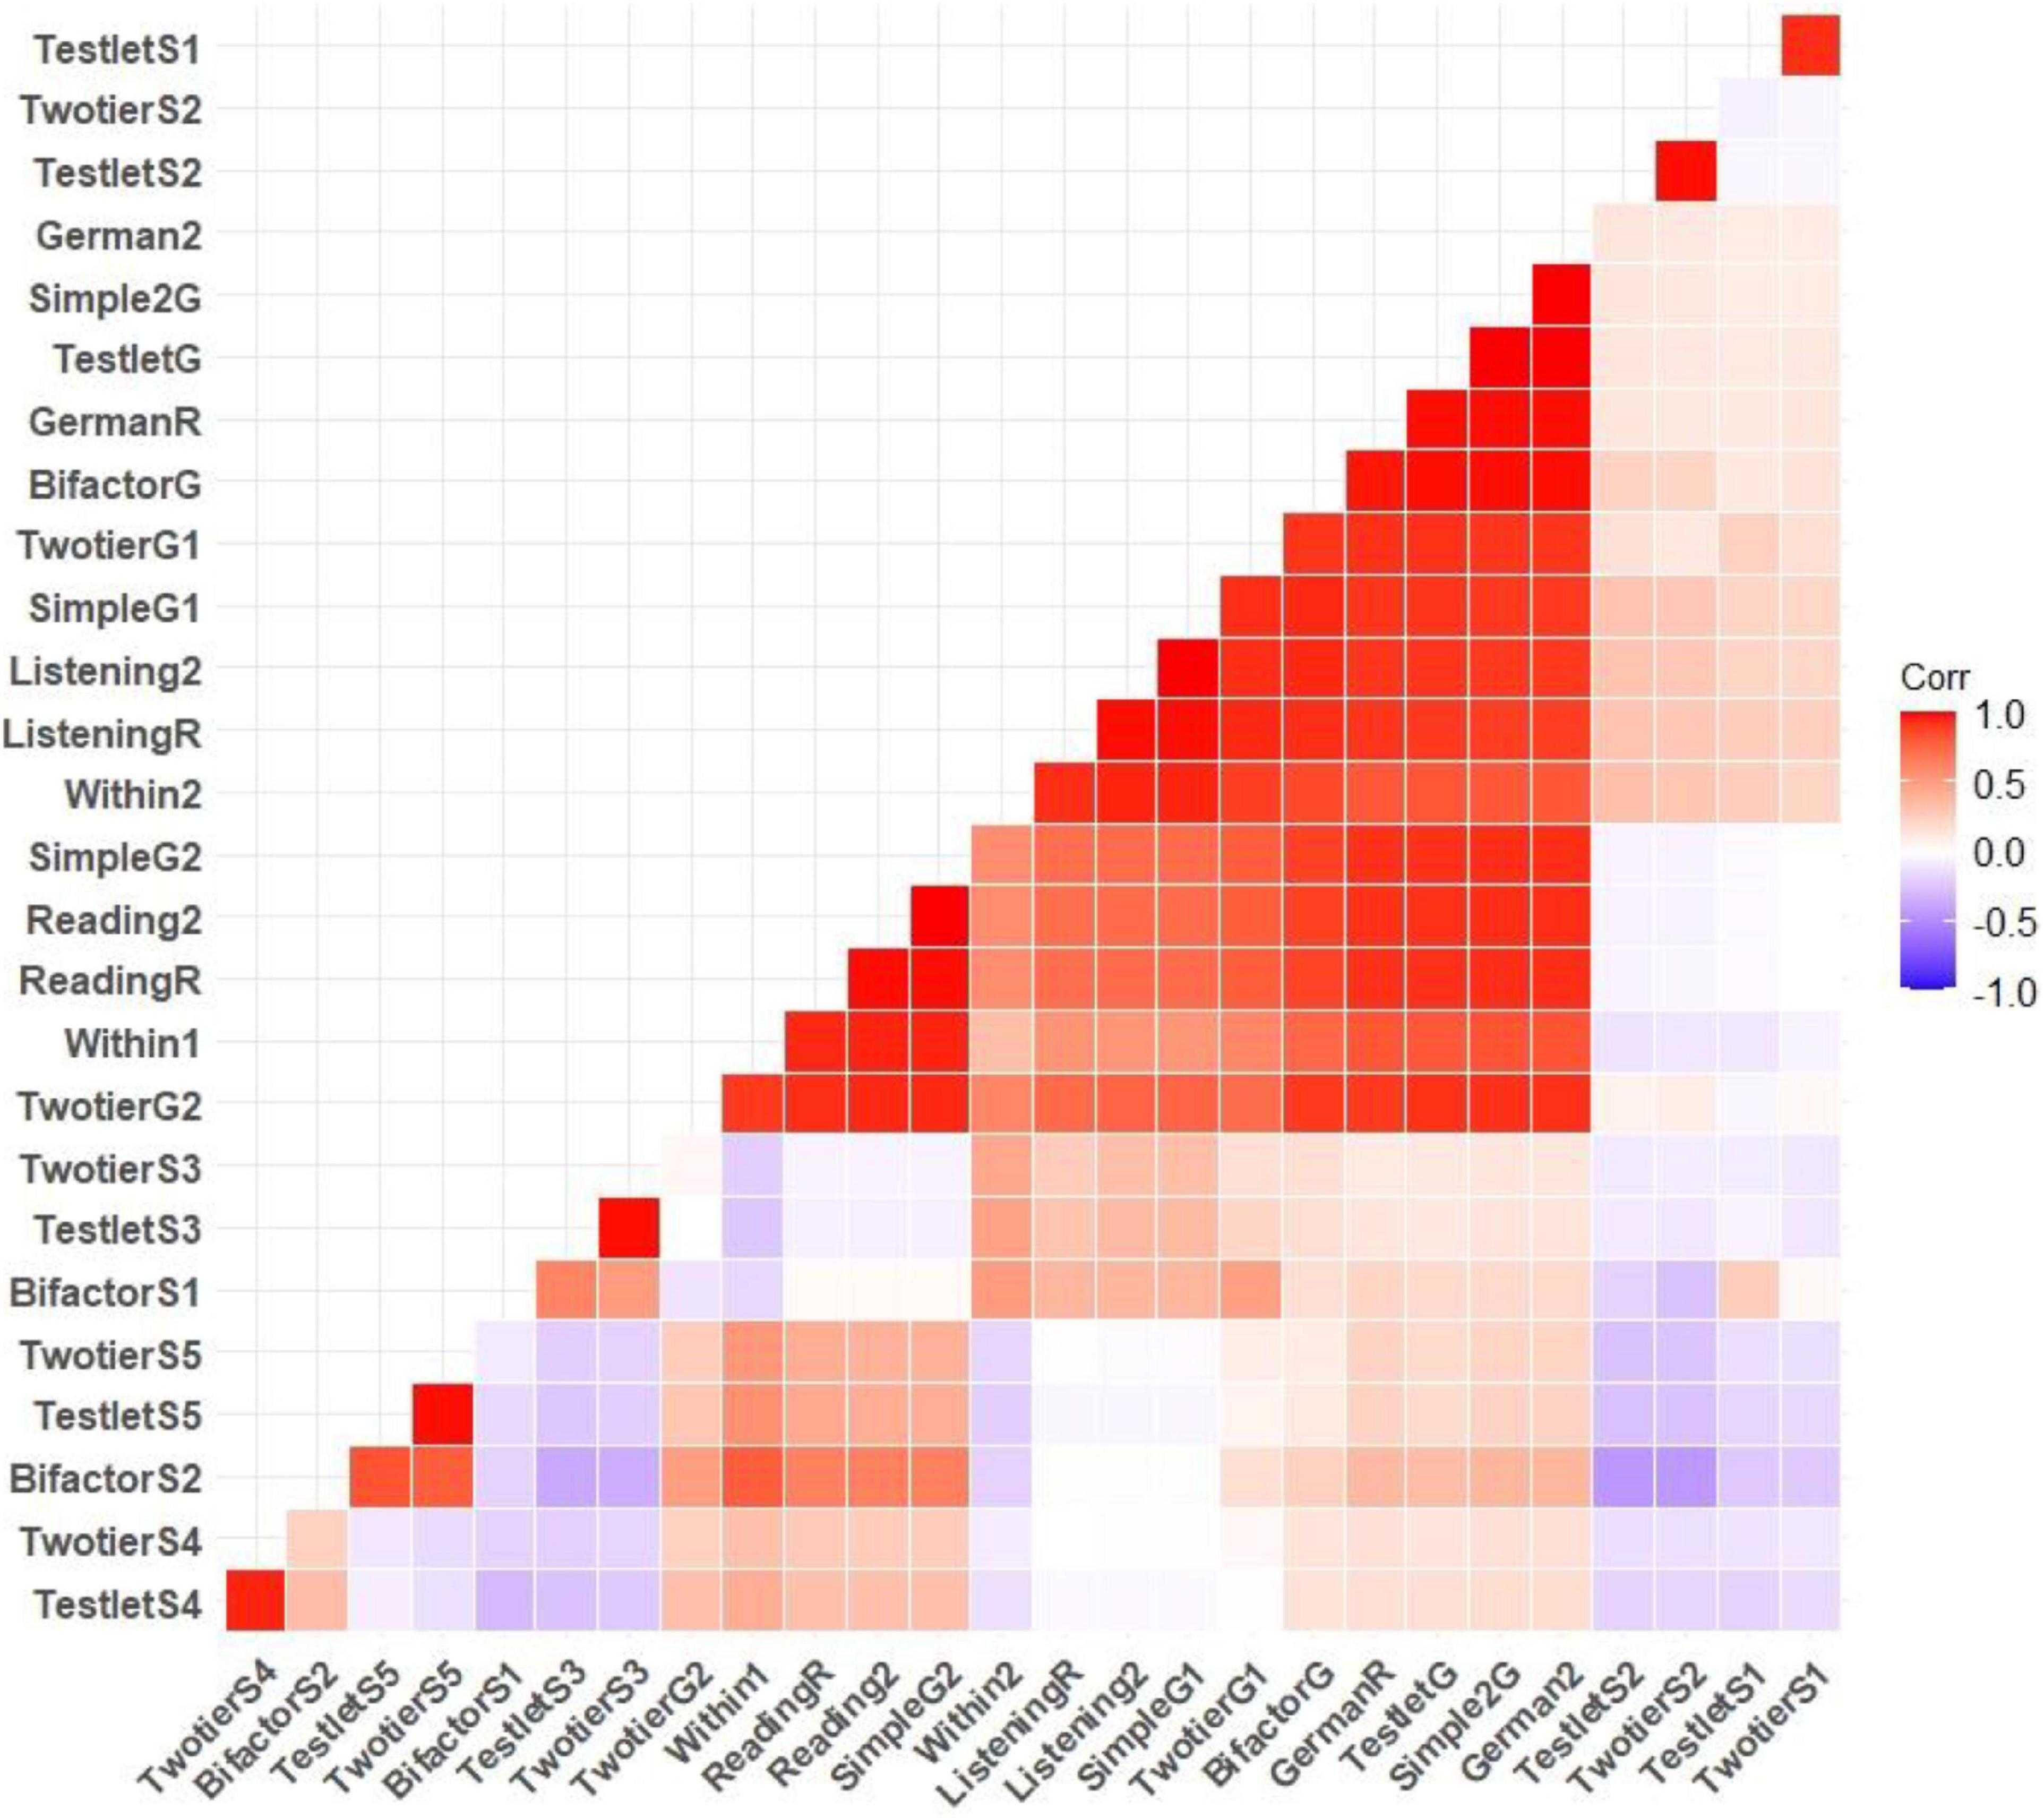
Figure 9. Pearson correlations between subtest scores and German test scores (test scores estimated with the MAP method) and correlations between general factor scores and scores estimated with specific factors were indicated. Symbols used in the matrix were indicated as follows: G, general factor; S, specific factor; R, Rasch model; 2, two-parameter model.
Test Reliabilities
The empirical reliabilities of the subtests and the German test (with Rasch and 2 PL) were also calculated, and their results were reported in Table 1. The results of the general factor reliabilities were above 0.70, and these reliabilities were considered acceptable or high. Also, within model included two general dimensions G1 and G2 in the model, and the reliabilities of the dimensions were 0.6629 and 0.6503, respectively. In addition to the general factors with bifactor, testlet, and two-tier models, the reliabilities of the specific factors were also calculated, and all these reliabilities were very low and close to 0.2 or 0.3.
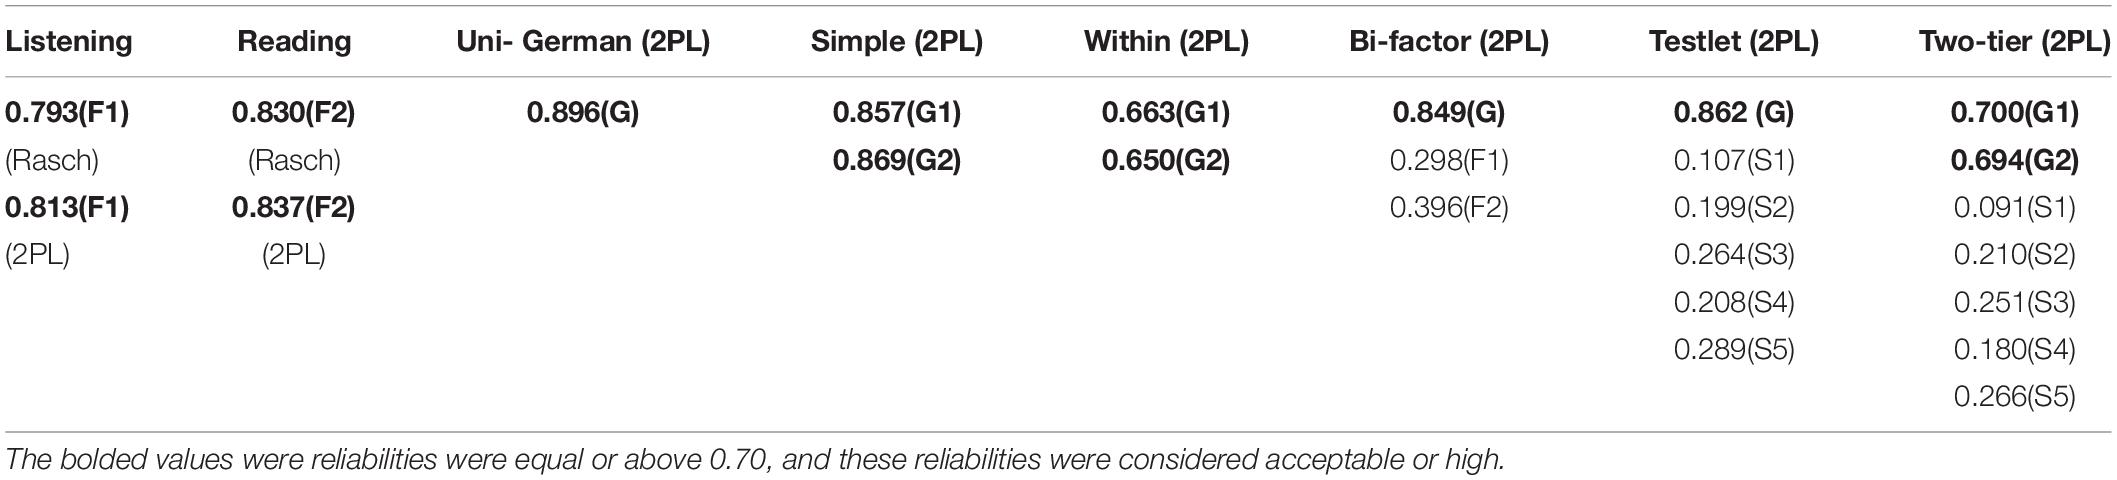
Table 1. The empirical internal reliabilities of scores which estimated on general and specific factors/dimensions.
Results of Test Information and Standard Error of Measurement of Test
Test information is used as a measure of the accuracy of the estimate of the cSEM and is the sum of the IIFs for all items (a larger IIF also means that more information is available for examinees at that level of the latent trait). The maximum point of the TIF corresponds to the lowest point of the cSEM, and it is possible to obtain greater accuracy in estimating the level of the latent trait for the test items around this point. Since the graphical features in the R packages are limited to the high-dimensional data space (e.g., 3 factors, 4 factors), we could not draw TIF plots for two-tier and testlet models.
Item information function, TIF graphs for the reading, listening, and German subtests estimated with the Rasch model and 2PL models. The graphs were presented in the Supplementary Figures 3–21. Simple correlated (simple 2), within- and bifactor models, surface, and contour plots (they present the information from a bird’s eye view and are easier to interpret than surface plots) were also given in the Supplementary Files, and the maximum point of TIF was determined. The results show that the 2PL model provides superior TIF and accuracy estimates than the Rasch model. In addition, the maximum point of the TIF of the within (I(θ) = 12), bifactor (I(θ) = 10), and unidimensional models of the German test (I(θ) = 10) also have more accuracy in estimating the level of the latent trait than other models.
Discussion
In this article, subscores of the VERA German test were systematically examined using unidimensional and multidimensional IRT models. The reporting of subscores of the test offers practical benefits, such as identifying the academic strengths and weaknesses of individual students in specific learning areas (e.g., Sinharay et al., 2011), and the superiority of MIRT has been reported by several researchers (e.g., Yao and Boughton, 2007) in terms of the accuracy of subscores. Before estimating and interpreting subscores, the underlying dimensional structure of test items can be determined using various psychometric/structural models (e.g., single correlated, within, or bifactor), and these psychometric models must be fitted to the data sets. Theoretically, these models can be used to design different test structures with perfect fit. In the study, we found that the German test subscores (both the reading and listening subtests) had adequate psychometric properties. Their reliabilities were higher than 0.70 and a unidimensional test structure with Rasch model provided acceptable data fit. However, we also found that the psychometric properties of the subtests could be improved if a 2PL model was used instead of the Rasch model. After evaluating the model data fits, we observed a general factor in the test instead of two different factors in overall test. These outputs could be crucial for VERA test applications and development process. Since test scores are used to improve teaching and learning conditions, 2PL can be used to estimate item parameters and test scores instead of the Rasch model.
Various fit indices can be used to evaluate each model, but the nature of these statistics may be sensitive to sample size (e.g., chi-square values and associated p-values) or it may not be realistic to expect accurate model data fit [e.g., for IRT with large data sets, M2* statistics (e.g., RMSEA, CFI)]. However, the empirical representations of the models have shown that it might be different in the real test applications in this study. In addition to the using overall data set (N = 81454) for model data fit evaluation, the data sets randomly divided into five equal parts and model-data fits were evaluated on these sets. The effect of sample size on the fit of the IRT model data should also be determined in simulation studies.
Corresponding to the person-misfit results, some more general models (e.g., two-tier) yielded smaller values for misfits but larger numbers for overfits. When the probability of the examinee’s response pattern is higher than the probability predicted based on the selected IRT model, the Zh values are determined to be an overfit (> + 2) (Embretson and Reise, 2000). When we calculated the percentage of girls and boys from the total number of misfit persons, the proportions of girls and boys, who were classified as misfit, were not very different from each other, but the proportions of German and NA-German students were different from each other. This means that when examining overall person misfit, the proportion of students who did not speak German all-day was higher than that of students who spoke German all-day. Different reasons (e.g., cheating, careless answering, lucky guessing, creative answering) have been identified by some researchers (e.g., Meijer et al., 2008; Meijer and Tendeiro, 2014). Because in this study only the proportion of persons who fit the models was described, the relationship between the person fit results and the different types of underlying test-taking behavior should also be investigated and the reason for these misfits with the VERA tests should be determined. The profile of these misfits can be determined in several ways.
Additionally, the reliabilities, the correlation between test scores and overall TIF as well as the cSEM were evaluated. In the study, the subscores of test were also evaluated with different confirmatory test structures. The results showed that a general factor was clearly indicated by the test scores which provided high reliabilities and total TIF. According to the results of the model data fit indices, the bifactor model was the best fit. The superiority of the bifactor models was argued in many aspects of the study of dimensionality (e.g., the usefulness of the bifactor model for understanding concepts and dimensionality). In addition to this superiority in model-data fit, some critical aspects of the bifactor model should also be considered. For instances, in the study, the specific factors reliabilities obtained by the bifactor model, the two-tier model, and the testlet model were also very low. However, it should also be noted that internal consistency reliabilities are sensitive to test length (Nunnally and Bernstein, 1994; Tavakol and Dennick, 2011), and there are similar findings in the literature about the low reliabilities of subcores and the studies aimed at improving these reliabilities (e.g., Gignac and Watkins, 2013; Savalei and Reise, 2019; Dunn and McCray, 2020; Trizano-Hermosilla et al., 2021). The interpretation of the TIF provides an estimate of the measurement error at each ability level, and thus provides greater accuracy than overall reliability (Hambleton and Swaminathan, 1985; Samejima, 1994). Based on the results of the IIF, TIF, and cSEM plots, the unidimensional model (2PL) or bifactor model (2PL) provides accurate estimates than the unidimensional Rasch model.
Data Availability Statement
The data analyzed in this study is subject to the following licenses/restrictions: The datasets analyzed for this study cannot be available because this is an official data set and must have permission from the Institut für Bildungsanalysen Baden-Württemberg (IBBW) (https://ibbw-bw.de/,Lde/Startseite) and Institut zur Qualitätsentwicklung im Bildungswesen (IQB) (https://www.iqb.hu-berlin.de/institut/staff). Requests to access these datasets should be directed to cG9zdHN0ZWxsZUBpYmJ3Lmt2LmJ3bC5kZQ==, aXFib2ZmaWNlQGlxYi5odS1iZXJsaW4uZGUu
Author Contributions
GY developed the original idea and study design, conducted the data analyses, and wrote most of the overall study. CR provided comments on research process and contributed to editing. MM made an important contribution to official permission for the VERA data sets, contributed to editing, and provided comments on study. DO contributed to editing and provided comments on study. All authors contributed to the article and approved the submitted version.
Funding
This study was supported by the Brigitte-Schlieben-Lange-Programm with “Investigating and Improving the Fairness of Large-Scale Assessments in Germany” Project.
Conflict of Interest
The authors declare that the research was conducted in the absence of any commercial or financial relationships that could be construed as a potential conflict of interest.
Publisher’s Note
All claims expressed in this article are solely those of the authors and do not necessarily represent those of their affiliated organizations, or those of the publisher, the editors and the reviewers. Any product that may be evaluated in this article, or claim that may be made by its manufacturer, is not guaranteed or endorsed by the publisher.
Acknowledgments
We would like to gratefully thank Nina Jude for her wonderful suggestions.
Supplementary Material
The Supplementary Material for this article can be found online at: https://www.frontiersin.org/articles/10.3389/feduc.2022.801372/full#supplementary-material
References
Ackerman, T. A., Gierl, M. J., and Walker, C. M. (2003). Using multidimensional item response theory to evaluate educational and psychological tests. Educ. Measure. Issues Pract. 22, 37–53. doi: 10.1111/j.1745-3992.2003.tb00136.x
Adams, R. J., Wilson, M., and Wang, W. (1997). The multidimensional random coefficient multinomial logit model. Appl. Psychol. Measure. 21, 1–23.
Akaike, H. (1974). A new look at the statistical model identification. IEEE Trans. Automat. Control 19, 716–723.
American Educational Research Association, American Psychological Association, and National Council on Measurement in Education (1999). Standards for Educational and Psychological Testing. Washington, DC: American Educational Research Association.
American Educational Research Association, American Psychological Association, and National Council on Measurement in Education (2014). Standards for Educational and Psychological Testing. Washington, DC: American Educational Research Association.
Andersson, B., and Xin, T. (2018). Large Sample Confidence Intervals for Item Response Theory Reliability Coefficients. Educ. Psychol. Measure. 78, 32–45. doi: 10.1177/0013164417713570
Bock, R. D., and Aitkin, M. (1981). Marginal maximum likelihood estimation of item parameters: application of an EM algorithm. Psychometrika 46, 443–459. doi: 10.1007/BF02293801
Bulut, O. (2013). Between-Person and Within-Person Subscore Reliability: Comparison of Unidimensional and Multidimensional IRT Models. [PhD thesis]. Minneapolis: University of Minnesota.
Cai, L. (2010). A Two-Tier Full-Information Item Factor Analysis Model with Applications. Psychometrika 75, 581–612.
Cai, L., and Thissen, D. (2015). “Modern approaches to parameter estimation in item response theory,” in Handbook of Item Response Theory Modeling: Applications to Typical Performance Assessment, eds S. P. Reise and D. A. Revicki (New York: Routledge), 41–59.
Cai, L., Yang, J. S., and Hansen, M. (2011). Generalized full-information item bifactor analysis. Psychol. Meth. 16, 221–248. doi: 10.1037/a0023350
Chalmers, R. P. (2012). mirt: A multidimensional item response theory package for the R environment. J. Stat. Softw. 48, 1–29.
Cheng, Y., Yuan, K. H., and Liu, C. (2012). Comparison of reliability measures under factor analysis and item response theory. Educ. Psychol. Measure. 72, 52–67.
Dai, S., Svetina, D., and Wang, X. (2017). Reporting Subscores Using R: A Software Review. J. Educ. Behav. Stat. 42, 617–638. doi: 10.3102/1076998617716462
DeMars, C. E. (2006). Application of the bi-factor multidimensional item response theory model to testlet-based tests. J. Educ. Measure. 43, 145–168.
DeMars, C. E. (2012). Confirming testlet effects. Appl. Psychol. Measure. 36, 104–121. doi: 10.1177/0146621612437403
Desjardins, C. D., and Bulut, O. (2018). Handbook of Educational Measurement and Psychometrics Using R, 1st Edn. Parkway, Boca Raton: Chapman and Hall/CRC Press, doi: 10.1201/b20498
Drasgow, F., Levine, M. V., and Williams, E. A. (1985). Appropriateness measurement with polychotomous item response models and standardized indices. Br. J. Math. Stat. Psychol. 38, 67–86.
Dunn, K. J., and McCray, G. (2020). The Place of the Bifactor Model in Confirmatory Factor Analysis Investigations into Construct Dimensionality in Language Testing. Front. Psychol. 11:1357. doi: 10.3389/fpsyg.2020.01357
Embretson, S. E., and Reise, S. P. (2000). Item Response Theory for Psychologists. Mahwah: Lawrence Erlbaum Associates Publishers.
Feinberg, R. A., and Wainer, H. (2014). When can we improve subscores by making them shorter? The case against subscores with overlapping items. Educ. Measure. Issues Pract. 33, 47–54.
Fu, J., and Qu, Y. (2018). A Review of Subscore Estimation Methods. ETS Research Report (RR-18-17). Princeton: Educational Testing Service, doi: 10.1002/ets2.12203
Gibbons, R. D., and Hedeker, D. (1992). Full-information item bi-factor analysis. Psychometrika 57, 423–436.
Gignac, G. E., and Watkins, M. W. (2013). Bifactor Modeling and the Estimation of Model-Based Reliability in the WAIS-IV. Multivar. Behav. Res. 48, 639–662. doi: 10.1080/00273171.2013.804398
Haberman, S., Sinharay, S., and Puhan, G. (2009). Reporting subscores for institutions. Br. J. Math. Stat. Psychol. 62, 79–95. doi: 10.1348/000711007X248875
Haberman, S. J. (2008). When can subscores have value? J. Educ. Behav. Stat. 33, 204–229. doi: 10.3102/1076998607302636
Haberman, S. J., and Sinharay, S. (2010). Reporting of subscores using multidimensional item response theory. Psychometrika 75, 209–227. doi: 10.1007/s11336-010-9158-4
Haladyna, T. M., and Kramer, G. A. (2004). The validity of subscores for a credentialing test. Eval. Health Prof. 27, 349–368. doi: 10.1177/0163278704270010
Hambleton, R. K., and Swaminathan, H. (1985). Item Response Theory: Principles and Applications. Norwell: Kluwer.
Hambleton, R. K., Swaminathan, H., and Rogers, H. J. (1991). Fundamentals of Item Response Theory. Newbury Park: Sage.
Hendrawan, I., Glas, C. A. W., and Meijer, R. R. (2005). The Effect of Person Misfit on Classification Decisions. Appl. Psychol. Measure. 29, 26–44. doi: 10.1177/0146621604270902
Jennrich, R. I., and Bentler, P. M. (2011). Exploratory Bi-Factor Analysis. Psychometrika 76, 537–549. doi: 10.1007/s11336-011-9218-4
Kahraman, N., and Kamata, A. (2004). Increasing the precisions of subscale scores by using out-of-scale information. Appl. Psychol. Measure. 28, 407–426.
Karabatsos, G. (2003). Comparing the aberrant response detection performance of thirty-six person-fit statistics. Appl. Meas. Educ. 16, 277–298. doi: 10.1207/S15324818AME1604_2
Kim, S., and Feldt, L. S. (2010). The estimation of the IRT reliability coefficient and its lower and upper bounds. with comparisons to CTT reliability statistics. Asia Pac. Educ. Rev. 11, 179–188.
Kulturministerkonferenz (2016). KMK Bildungsmonitoring (II) Gesamtstrategie der Kultirministerkonferenz zum Bildungsmonitoring. Berlin: Link.
Levine, M. V., and Rubin, D. B. (1979). Measuring the appropriateness of multiple-choice test score. J. Educ. Stat. 4, 269–290.
Li, Y., Bolt, D. M., and Fu, J. (2006). A comparison of alternative models for testlets. Appl. Psychol. Measure. 30, 3–21.
Liu, Y., Li, Z., and Liu, H. (2018). Reporting Valid and Reliable Overall Scores and Domain Scores Using Bi-Factor Model. Appl. Psychol. Measure. 43, 562–576. doi: 10.1177/0146621618813093
LoMartire, R., Äng, B. O., Gerdle, B., and Vixner, L. (2020). Psychometric properties of Short Form-36 Health Survey, EuroQol 5-dimensions, and Hospital Anxiety and Depression Scale in patients with chronic pain. Pain 161, 83–95. doi: 10.1097/j.pain.0000000000001700
Lord, F. M. (1977). Practical applications of item characteristic curve theory. J. Educ. Measure. 14, 117–138.
Lord, F. M. (1980). Applications of Item Response Theory to Practical Testing Problems. Hillsdale: Erlbaum.
Maydeu-Olivares, A., and Joe, H. (2005). Limited- and full-information estimation and goodness- of-fit testing in 2n contingency tables: A unified framework. J. Am. Stat. Assoc. 100, 1009–1020.
Meijer, R. R., Boevé, A. J., Tendeiro, J. N., Bosker, R. J., and Albers, C. J. (2018). Corrigendum: The Use of Subscores in Higher Education: when Is This Useful? Front. Psychol. 9:873. doi: 10.3389/fpsyg.2018.00873
Meijer, R. R., Egberink, I. J. L., Emons, W. H. M., and Sijtsma, K. (2008). Detection and validation of unscalable item score patterns using item response theory: an illustration with Harter’s self-perception profile for children. J. Pers. Assess. 90, 227–238. doi: 10.1080/00223890701884921
Meijer, R. R., and Tendeiro, J. N. (2014). The Use of Person-Fit Scores in High Stakes Educational Testing: How to Use Them and What They Tell Us (LSAC Research Report 14-03). Newton: Law School Admission Council.
Monaghan, W. (2006). The Facts About Subscores (ETS R&D Connections No. 4). Princeton: Educational Testing Service.
Nunnally, J. C., and Bernstein, I. H. (1994). Psychometric Theory, 3rd Edn. New York, NY: McGraw-Hill.
Reckase, M. D. (1997). The past and future of multidimensional item response theory. Appl. Psychol. Measure. 21, 25–36.
Reckase, M. D., and Xu, J. R. (2015). The Evidence for a Subscore Structure in a Test of English Language Competency for English Language Learners. Educ. Psychol. Measure. 75, 805–825. doi: 10.1177/0013164414554416
Reise, S. P. (1990). A comparison of item-and person-fit methods of assessing model-data fit in IRT. Appl. Psychol. Meas. 14, 127–137.
Samejima, F. (1994). Estimation of reliability coefficients using the test information function and its modifications. Appl. Psychol. Measure. 18, 229–244. doi: 10.1177/014662169401800304
Savalei, V., and Reise, S. P. (2019). Don’t Forget the Model in Your Model-based Reliability Coefficients: A Reply to McNeish (2018). Collabra Psychol. 5:36. doi: 10.1525/collabra.247
Schult, J., and Wagner, S. (2019a). VERA 3 in Baden-Württemberg 2019 (Beiträge zur Bildungsberichterstattung). Stuttgart: Institut für Bildungsanalysen Baden-Württemberg.
Schult, J., and Wagner, S. (2019b). VERA 8 in Baden-Württemberg 2019 (Beiträge zur Bildungsberichterstattung). Stuttgart: Institut für Bildungsanalysen Baden-Württemberg.
Schwarz, G. (1978). Estimating the Dimension of a Model. Ann. Stat. 6, 461–464. doi: 10.1007/978-3-319-10470-6_18
Sijtsma, K., and Junker, B. W. (2006). Item Response Theory: past Performance. Present Developments. and Future Expectations. Behaviormetrika 33, 75–102. doi: 10.2333/bhmk.33.75
Sinharay, S. (2010). How often do subscores have added value? Results from operational and simulated data. J. Educ. Measure. 47, 150–174.
Sinharay, S. (2019). Added Value of Subscores and Hypothesis Testing. J. Educ. Behav. Stat. 44, 25–44. doi: 10.3102/1076998618788862
Sinharay, S., Haberman, S. J., and Boughton, K. (2015). Too simple to be useful: A Comment on Feinberg and Wainer (2014). Educ. Measure. Issues Pract. 34, 6–8.
Sinharay, S., Puhan, G., and Haberman, S. J. (2011). An NCME instructional module on subscores. Educ. Measure. Issues Pract. 30, 29–40.
Sugiura, N. (1978). Further analysis of the data by Akaike’s information criterion and the finite corrections. Commun. Stat. Theor. Meth. 7, 13–26.
Tate, R. L. (2004). Implications of multidimensionality for total score and subscore performance. Appl. Measure. Educ. 17, 89–112.
Tavakol, M., and Dennick, R. (2011). Making sense of Cronbach’s alpha. Int. J. Med. Educ. 2, 53–55. doi: 10.5116/ijme.4dfb.8dfd
Trizano-Hermosilla, I., Gálvez-Nieto, J. L., Alvarado, J. M., Saiz, J. L., and Salvo-Garrido, S. (2021). Reliability Estimation in Multidimensional Scales: comparing the Bias of Six Estimators in Measures with a Bifactor Structure. Front. Psychol. 12:508287. doi: 10.3389/fpsyg.2021.508287
Wagner, I., Loesche, P., and Bißantz, S. (2021). Low-stakes performance testing in germany by the vera assessment: analysis of the mode effects between computer-based testing and paper-pencil testing. Eur. J. Psychol. Educ. [Epub online ahead of print]. doi: 10.1007/s10212-021-00532-6
Wainer, H., Vevea, J. L., Camacho, F., Reeve, B. B. III, Rosa, K., Nelson, L., et al. (2001). “Augmented scores -“Borrowing strength” to compute score based on small numbers of items,” in Test Scoring, eds D. Thissen and H. Wainer (Mahwah: Erlbaum), 343–388.
Wang, W. C., Chen, P. H., and Cheng, Y. Y. (2004). Improving measurement precision of test batteries using multidimensional item response models. Psychol. Meth. 9, 116–136. doi: 10.1037/1082-989X.9.1.116
Warm, T. A. (1989). Weighted likelihood estimation of ability in item response theory. Psychometrika 54, 427–450. doi: 10.1007/BF02294627
Wedman, J., and Lyren, P. (2015). Methods for examining the psychometric quality of subscores: A review and application. Pract. Assess. Res. Eval. 20, 1–14. doi: 10.7275/ng3q-0d19
Xu, J., Paek, I., and Xia, Y. (2017). Investigating the Behaviors of M2 and RMSEA2 in Fitting a Unidimensional Model to Multidimensional Data. Appl. Psychol. Measure. 41, 632–644. doi: 10.1177/0146621617710464
Yao, L. (2018). Comparing methods for estimating the abilities for the multidimensional models of mixed item types. Commun. Stat. Simul. Comput. 47, 74–91. doi: 10.1080/03610918.2016.1277749
Yao, L. H., and Boughton, K. A. (2007). A multidimensional item response modeling approach for improving subscale proficiency estimation and classification. Appl. Psychol. Measure. 31, 83–105.
Yen, W. M. (1987). “A Bayesian/IRT index of objective performance,” in Paper Presented at the Annual Meeting of the Psychometric Society (Montreal: Psychometric society).
Yen, W. M., Sykes, R. C., Ito, K., and Julian, M. (1997). “A Bayesian/IRT index of objective performance for a test with mixed-item types,” in Paper Presented at the Annual Meeting of the National Council on Measurement in Education (Chicago: National Council on Measurement in Education).
Zanon, C., Hutz, C. S., Yoo, H., and Hambleton, R. K. (2016). An application of item response theory to psychological test development. Psicol. Refl. Crít. 29:18. doi: 10.1186/s41155-016-0040-x
Keywords: IRT, MIRT, VERA tests, subscore, reliability
Citation: Yavuz Temel G, Machunsky M, Rietz C and Okropiridze D (2022) Investigating Subscores of VERA 3 German Test Based on Item Response Theory/Multidimensional Item Response Theory Models. Front. Educ. 7:801372. doi: 10.3389/feduc.2022.801372
Received: 25 October 2021; Accepted: 14 March 2022;
Published: 08 April 2022.
Edited by:
Okan Bulut, University of Alberta, CanadaReviewed by:
Soo Lee, American Institutes for Research, United StatesRen Liu, University of California, Merced, United States
Copyright © 2022 Yavuz Temel, Machunsky, Rietz and Okropiridze. This is an open-access article distributed under the terms of the Creative Commons Attribution License (CC BY). The use, distribution or reproduction in other forums is permitted, provided the original author(s) and the copyright owner(s) are credited and that the original publication in this journal is cited, in accordance with accepted academic practice. No use, distribution or reproduction is permitted which does not comply with these terms.
*Correspondence: Güler Yavuz Temel, eWF2dXpAcGgtaGVpZGVsYmVyZy5kZQ==