 Mausam Kumar Garg
 Poulomi Chowdhury2
 Md Illias Kanchan SK
- 1Department of Migration and Urban Studies, International Institute for Population Sciences (IIPS), Mumbai, India
- 2Health Research Institute, University of Canberra, Canberra, ACT, Australia
- 3EMS & DE, International Institute for Population Sciences (IIPS), Mumbai, India
Objective: To assess the change in the level of educational inequality and the contribution of social factors and demographic factors.
Data source: Three rounds of National Sample Survey viz. 64th (2007–2008), 71st (2014), and 75th (2017-2018) have been used.
Methods: Education Gini is used to study the extent of educational inequality over the time period. Decomposition method is used for "within-group" and “between group” inequality. Tobit regression model is utilized to study factors influencing average years of schooling (AYS). Finally, regression-based Shapley decomposition method is used to identify factors contributing in educational inequality.
Results: The level of AYS has improved over the period and reached to 7.7 years in 2018. Further, the level of educational inequality gone down between 2007 and 2018, but the Gini indices are still concentrated around 38%. Decomposition of the Gini and Shapley regression approach indicates that the within-group component and rural-urban division contribute the most to educational inequality. Tobit model signifies that digital exposure, household occupation, wealth quintile, and household size play a key role in determining educational attainment.
Conclusion: The paper underscores the improvement of education in rural areas by focusing on school infrastructure, e-learning, educational quality, and parent involvement.
Introduction
Education has been a long-known important factor for human development, contributing to the betterment of individuals significantly by ameliorating the level of remuneration and living standards through raising skills and self-determination. It has been documented that educated parents can influence the prosperity of future generations, as they can provide better education and healthier lives to their children (Dreze and Sen, 2002; Agrawal, 2014). Education generates positive externalities which in turn affects the welfare of society (Tilak, 2008). Further, enhancing the participation in schooling compels numerous reasons, such as indicators of wellbeing which are health outcome/condition, fertility, nutritional level, and infant mortality (Cochrane, 1979; Behrman, 1996; Lewin, 2011). Notably, current competition among different countries, states, and regions for foreign and domestic investments mainly depends on the proportion of the workforce who have at least achieved a basic level of education (Lewin, 2011). Maksymenko and Rabbani (2008) state that there is a positive relationship between education and economic growth. Similarly, there is a strong correlation between educational quality and an increase in GDP per capita (Sebastien, 1999; Hanushek and Kimko, 2000). In addition, improving education is also important for achieving Sustainable Development Goals (SDGs-4), which accentuates comprehensive and better quality of education for all and encourages prolonging learning by the year 2030 (Government of India, 2018).
According to the Census of India 2011, the younger population aged 0 to 14 years contribute around 39.5% of the total population, while the population aged 0 to 4 years share 9.7% of the total population. Considering this large population, providing equitable access to education is a big task for any policy maker, especially when most of the population belongs to middle-income and poor families. Moreover, the sluggish improvement in educational attainment has always been a long-known issue for our country. For instance, in the year 2001, the number of illiterates in the country was quite high compared to the total population at the time of independence. Roughly 350 million of this illiterate population were the direct result of poor performance of the policies and funding patterns persisting since the second Five-Year Plan (Mehrotra, 2012). Nonetheless, later in 2004, an upsurge in the level of schooling was detected, although the share of illiteracy remained relatively high (Pieters, 2011). The percentage of schooling was increased by two to three times in all the states except Andhra Pradesh, Rajasthan, Odisha, and Tripura. Additionally, educational attainment is prominently higher in urban India compared to its rural counterpart (Asadullah and Yalonetzky, 2012). Lack of schooling and illiteracy among females was substantially higher with a differential of 24% found in 2001. Previous studies have documented that there is significant progress in educational enrolment. Noteworthy universal educational enrolment among children aged 6 to 10 years is detected, but at the same time, illiteracy levels are moderately higher, particularly in rural India and female children, which may be associated with unabated dropout rates (Chatterjee et al., 2018).
In 1968, the Government of India articulated its first National Policy on Education (NPE), while the second and third policies were enacted in 1986 and 1992, respectively. These policies have mainly focused on radical restructuring, special weightage to the eradication of discrepancies, equalizing education opportunities, and establishing a common minimum program. Thereafter, the Right to Education (RTE) bill was enacted in December 2002, as the Indian parliament passed the Constitution 86th Amendment Act, and also inserted Article 21A in the list of fundamental rights which states that “the State shall provide free and compulsory education to all the children aged 6–14 years in such a manner as the State may, by law, determine” (Mehrotra, 2012). The bill aims to provide universal access to elementary education up to the threshold of secondary school for children aged 6 to 14 years. Following the success of RTE, the Government of India has planned to organize a nationwide program that mainly highlights universal access to elementary education. For this purpose, the Integrated Childhood Development Scheme (ICDS) was formulated which also involves the Mid-day meal Scheme, which has boosted the level of preschool education among children. Under ICDS, the number of children belonging to 3 to 5 + years has increased from 16.7 million to 35.3 million in 2012–2013 (NUEPA, 2014).
The Sarva Shiksha Abhiyan (SSA) is another program that was brought into the picture to universalize primary education. It builds on the successful level programs of the 1990s to increase enrolments rapidly in the lower primary grades, especially for Empowered Action Group (EAG) states (Government of India, 2002; Prakash, 2008; Govinda and Bandyopadhyay, 2010; Ward, 2011). The latest report of the National University of Education Planning and Administration (NUEPA) suggests that this program contributed to significant progress in improving school enrolment. During the 11th Five Year Plan, the government has supplemented SSA with a new program designed to universalize access to secondary schools called Rashtriya Madhyamic Shiksha Abhiyan (RMSA). However, despite great efforts, only a small proportion of the population in India is enrolled in secondary education compared to Russia, Brazil, China, and the other BRIC countries (Lewin, 2011). The reason for poor enrolment at the secondary level is the lack of attention of NPE, RTE, and SSA on the quality of education at government schools. The RTE and SSA are formulated to universalize elementary education by emphasizing the parameters such as infrastructure, teacher qualification, and curriculum design (Banerji and Mukherjee, 2008). However, RTE failed to focus on the learning parameters, whereas NPE struggled with poor design flaws and improper implementation due to which the marginalized and economically weaker section of society has to deal with a poor quality of education (Bhatty and Weekly, 2014). Mehrotra (2012) pointed out that the Indian education system was half a century behind in legalizing universal schooling for children aged 6 to 14 years within 10 years of independence.
Previously, many studies have given a snapshot of educational attainment in India (Gandhi Kingdon, 2002; Chamarbagwala, 2008; Govinda and Bandyopadhyay, 2010; Velaskar, 2010, 2012; Asadullah and Yalonetzky, 2012; Agrawal, 2014; Kugler and Kumar, 2017; Chatterjee et al., 2018). Most of these studies have described the overall picture of educational attainment discussing the level of educational attainment at the national and state levels. Very few studies have worked on educational inequality in India which is based on the proportion of the population by their education level using the education Gini method and Lorenz curve (Pieters, 2011; Asadullah and Yalonetzky, 2012; Agrawal, 2014). These studies have pointed out that the major factors attributing to educational inequality are gender, place of residence, and social and religious groups. However, these studies have used a very old dataset to present education inequality and did not elucidate major contributing factors. Studies done internationally have emphasized education inequality through the Gini method as well as factors contributing to this inequality (Yang et al., 2014; Yu et al., 2015; Mesa, 2007; Picard and Wolff, 2008). For example, the study by Yang et al. (2014) decomposed the education Gini and found that the greatest contributing factor to educational inequality in China is the place of residence and social stratification division. The study by Mesa (2007) shows that in the Philippines, the education Gini coefficient has decreased over the last two decades, however, there are still wide disparities across regions and among provinces. Using Education Gini and decomposition method, the international literature have found regional and social stratification as the major factor for educational inequality. Therefore, deviating from the previous Indian literature and following international research, the current study aims to understand factors affecting educational attainment in India. Then, the aim is to assess the change in the level of educational inequality and the contribution of social factors (e.g., gender, place of residence, caste groups, and religious groups) attributed to inequality over the period.
Research design
Data sources
The study utilizes unit-level information from household surveys conducted by the National Sample Survey Organization (NSSO) in India. NSSO conducts the national survey on “Social Consumption: Education,” which is the primary source of data on various indicators of the education scenario of the country, like literacy rates, attendance ratios, incentives received by students, expenditure incurred for education, and so on. This is very important for planning, policy formulation, and decision support as input for further analytical studies by various Government organizations, academicians, researchers, and scholars (NSSO, 2008, 2014, 2018). The present study focuses on three rounds of NSS viz. 64th (2007–2008), 71st (2014), and 75th (2017–2018).
The NSSO collects information on education from participants aged 5 to 29 years. Then, it classifies the information on the educational attainment of an individual into one of the following categories: not literate; literate without any schooling; literate without formal schooling: through NFEC, though TLC/AEC, and others; literate with formal schooling: below primary, primary, upper primary/middle, secondary, higher secondary; and diploma/certificate course (up to secondary), diploma/certificate course (higher secondary), diploma/certificate course (graduation and above), graduate, and postgraduate and above (NSSO, 2018).
The NSSO surveys are nationally representative household surveys that follow a multistage stratified sampling design. The census villages (Panchayat wards in the case of Kerala) in the rural areas and Urban Frame Survey (UFS) blocks in the urban areas are the first stage units (FSU). The ultimate stage units (USU) are households in both rural and urban areas. In the case of large FSUs, one intermediate stage of sampling is the selection of two hamlet groups (hgs)/sub-blocks (sbs) from each rural/urban FSU (NSSO, 2018).
Methodology
This section discusses the indicators and methods of statistical analysis used in the study. As this study discusses educational inequality in India, the average years of schooling (AYS) for children aged 18 years and above is taken as an indicator of educational attainment. However, NSS data does not provide information on years of schooling. So, the AYS can be estimated using the official years of schooling (YOS). The Indian education system is divided into seven levels, that is, No schooling, below primary, Primary, Middle, Secondary, Higher Secondary, and Graduate and above. The years of schooling for each level are presented in Table 1.
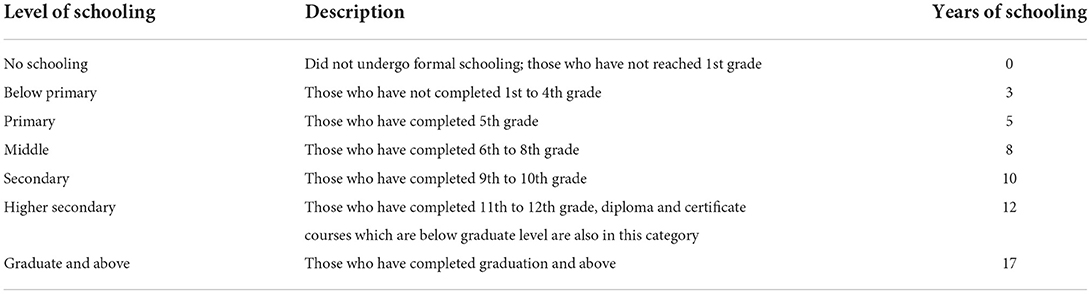
Table 1. Educational attainment levels.
The years of schooling shown above can also be calculated using the following formula adopted from Thomas et al. (2001).
Suppose y is the year of schooling then:
• No schooling y1 = 0
• Below primary y2 = y1 + 0.5Cp = 0.5 Cp
• Primary y3 = y1 + Cp = Cp
• Middle y4 = y3 + Cm = Cp + Cm
• Secondary y5 = y4 + Cs = Cp + Cm + Cs
• Higher Secondary y6 = y5 + Chs = Cp + Cm + Cs + Chs
• Graduation and above y7 = y6 + Cg = Cp + Cm + Cs + Chs + Cg
Where Cp, Cm, Cs, Chs, and Cg are the completed levels of school for primary, middle, secondary, higher secondary, and graduation and above, respectively. Therefore, average years of schooling will be calculated as follows:
where,
AYS = Average Years of Schooling
HSai = Proportion of the population in age group a for which the level of education i is the highest level attained.
YSai = Official duration of the level of education l for age group a at the time when this age group was in school/college.
Thus equation (1) provides the population-weighted average of AYS for each age group a.
The education Gini is the second indicator, which provides the extent of educational inequality in India. Ram (1990) mentioned in their study that the extent of educational inequality can be calculated using a standard deviation of years of schooling, but this method only calculates the dispersion of schooling distribution. The method of calculating education Gini is different from traditional Gini (Thomas et al., 2001). The estimation of the Gini is based on years of schooling, which is a discrete variable, not a continuous variable. Moreover, the traditional method which most often uses income data does not have a lower or upper boundary, while in the case of years of schooling, it has both a lower (zero) and upper boundary (17 years). Therefore, the present study uses the method suggested by Thomas et al. (2001) to calculate the education Gini based on educational attainment data.
Where EL is the education Gini based on educational attainment distribution, large population; μ is the average years of schooling for the concerned population; pi and pj stand for proportions of the population with certain levels of schooling; yi and yj are the years of schooling at the different educational attainment levels; and n is the number of levels in the attainment data.
The education Gini coefficient has a value that varies between 0, indicating perfect education equality, and 1, indicating perfect education inequality. The education Gini is presented by the educational Lorenz curve using the information of all three rounds of NSSO.
Decomposing educational inequality using Gini coefficient
The inequality can be segregated into “within-group (intra-group)” and “between-group (inter-group)” inequality and can be done using the decomposition method. Gini coefficient decomposition includes two main approaches: one is decomposition by subgroups and calculation of between-group contribution and within-group contribution, such as population between rural and urban, poor and non-poor, and male and female.
The classical formula for Gini decomposition is as follows:
where Pi, μi, Ei (i = 1,2) represents the proportion of the population, mean education, and Gini coefficient for two exclusive subgroups of the population. EB is residual and is the between-group contribution to the total inequality in absolute terms. The first part of Equation (3) is the contribution of subgroup 1 to total educational inequality in absolute terms while the second part reflects the contribution of the subgroup. However, the Equation (3) method has two limits. First, it only decomposes the Gini into two subgroups. Moreover, it makes the Gini decomposition additive and decomposed, and provides a biased result. Therefore, in Gini decomposition, previous research has emphasized on adding the overlapping term, which will capture the unexplained contribution. The present study will use the decomposition method of Lambert and Aronson (1993), which follows the following Gini decomposition form:
where,
i = 1,2,….,n,
EL = Education Gini,
EB = Between group Gini coefficient, defined as the one which would obtain if every year of education in every subgroup is replaced by the relevant subgroup mean.
Pi = Proportion of population,
μi = mean education for each i subgroup,
Ei = Education Gini for each i subgroup,
R = R is residual, which is zero if subgroup ranges do not overlap.
Statistical analysis
The study used both bivariate and multivariate analysis for all three rounds. First, AYS and education Gini are presented by states/Union Territories (UTs)1, sex, sector, caste groups, and religion. Then, the Lorenz curve is used to present the educational inequality for all three rounds. Next, the Tobit regression model is used to study the correlates of YOS for all three rounds. Following the previous literature, several important correlates have been taken into account for the Tobit model. Detailed information on these correlates is presented in Table 2. Later, the decomposition of education Gini is performed by social indicators to study the “within” and “between” components. Finally, the Shapley decomposition method is used to study the important contributor to educational inequality.
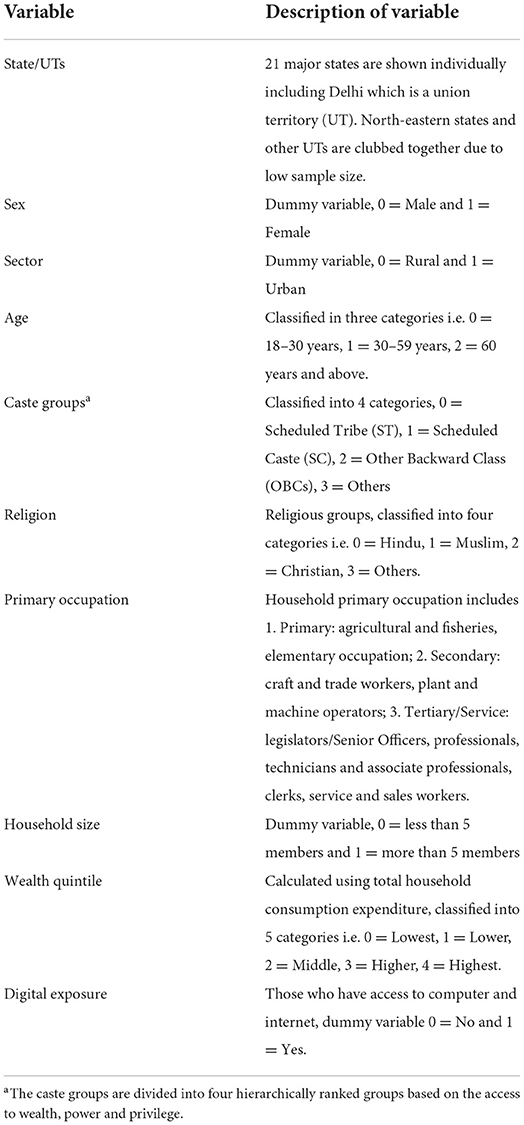
Table 2. Variable summary.
Table 3 shows the sample information as well as AYS by background characteristics.
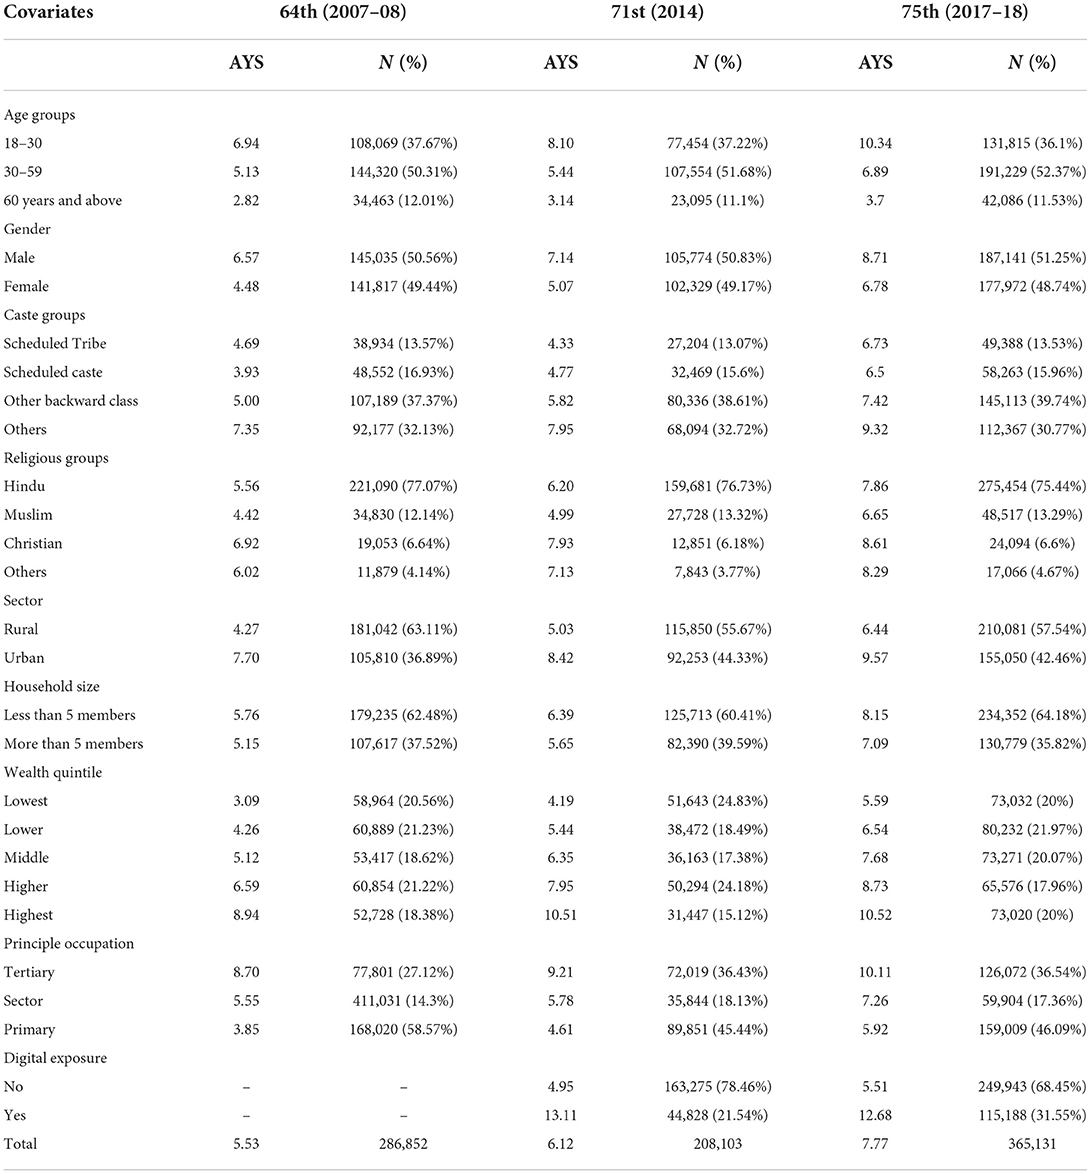
Table 3. Background characteristics of population 18 years and above.
Tobit regression model
As mentioned earlier, the outcome variable of the study is years of schooling, which is a discrete variable in nature. For a country like India, where a considerable proportion of the population has no formal education, it is quite obvious that YOS will be influenced by zero factors. Moreover, using ordinary least square regression will not provide correct results. Therefore, the Tobit model is used in the study to control censored information. Moreover, to understand the level of change in the effect of the covariates of YOS, separate models are fitted for all three rounds. The model is mentioned below:
where, is a latent variable, ϵi ~N (0, σ2), and Xi denotes the (K x 1) vector of exogenous and fully observed regressors.
The usual OLS method is used to estimate the β and σ2, if is greater than 0. Combining equations (5) and (6), we get:
Shapley decomposition
The decomposition analysis in equation (4) gives the within-group and between-group contributions in the view of rural-urban division, gender disparity, and social-religious stratification. However, it does not provide the answer to a particular question, that is, in contrast to the factors mentioned above, which factor imparts more to overall educational inequality? Decomposition based on regression analysis is an important method that identifies the factors influencing the outcome of the study by taking a significant number of variables. The traditional Gini decomposition and general Entropy decomposition methods do not have such an advantage (Yang et al., 2014). This regression-based method is called the Shapley decomposition. The Shapley decomposition function is as follows:
Here, YOS represents the years of schooling mentioned in Table 2. Equation (8) shows that years of education is a function of social indicators viz. sex, sector, caste groups, and religious groups. Similar to the Tobit regression model, Shapley decomposition is also applied for all three rounds.
All the analysis has been carried out in the STATA 16 software.
Empirical results
As evident in Figure 1, the educational Gini coefficient for India has abated (23.52%) significantly since 2007, including all the states and union territories. Stark examples can be seen in northern and southern regions. For instance, Uttarakhand's education Gini coefficients tapered off from 0.487 to 0.308 in 2018, although in Kerala, the corresponding figures were 0.292 and 0.245 in 2007 and 2018, respectively. Moreover, the Northern states viz. Himachal Pradesh, Punjab, and Haryana have a maximum reduction in educational gaps compared to southern states such as Tamil Nadu, Maharashtra, and Karnataka. On the other hand, Delhi (Gini = 0.260: AYS = 10.49) and Goa (Gini = 0.230: AYS = 9.89) performed better in dwindling education inequality than all the northern and southern states. AYS and education Gini are inversely related to each other: if AYS is higher, education Gini is lower. But this is not completely true for a few states of India, specifically in Bihar, Rajasthan, Uttar Pradesh, Odisha, Chhattisgarh, Madhya Pradesh, and Andhra Pradesh, where average years of schooling have amplified drastically (see Figure 2), though the decline in educational gaps are not significant enough. For the past 11 years, the education inequality in Goa, Uttarakhand, Delhi, Punjab, and Himachal Pradesh has decreased considerably by 38.75, 36.62, 29.85, 29.74, and 29.23%. Not least, the North-Eastern states have also consistently performed better in maintaining higher education levels and abating educational gaps. Over the years, education inequality might have reduced more than before, but the gaps persist between the states.
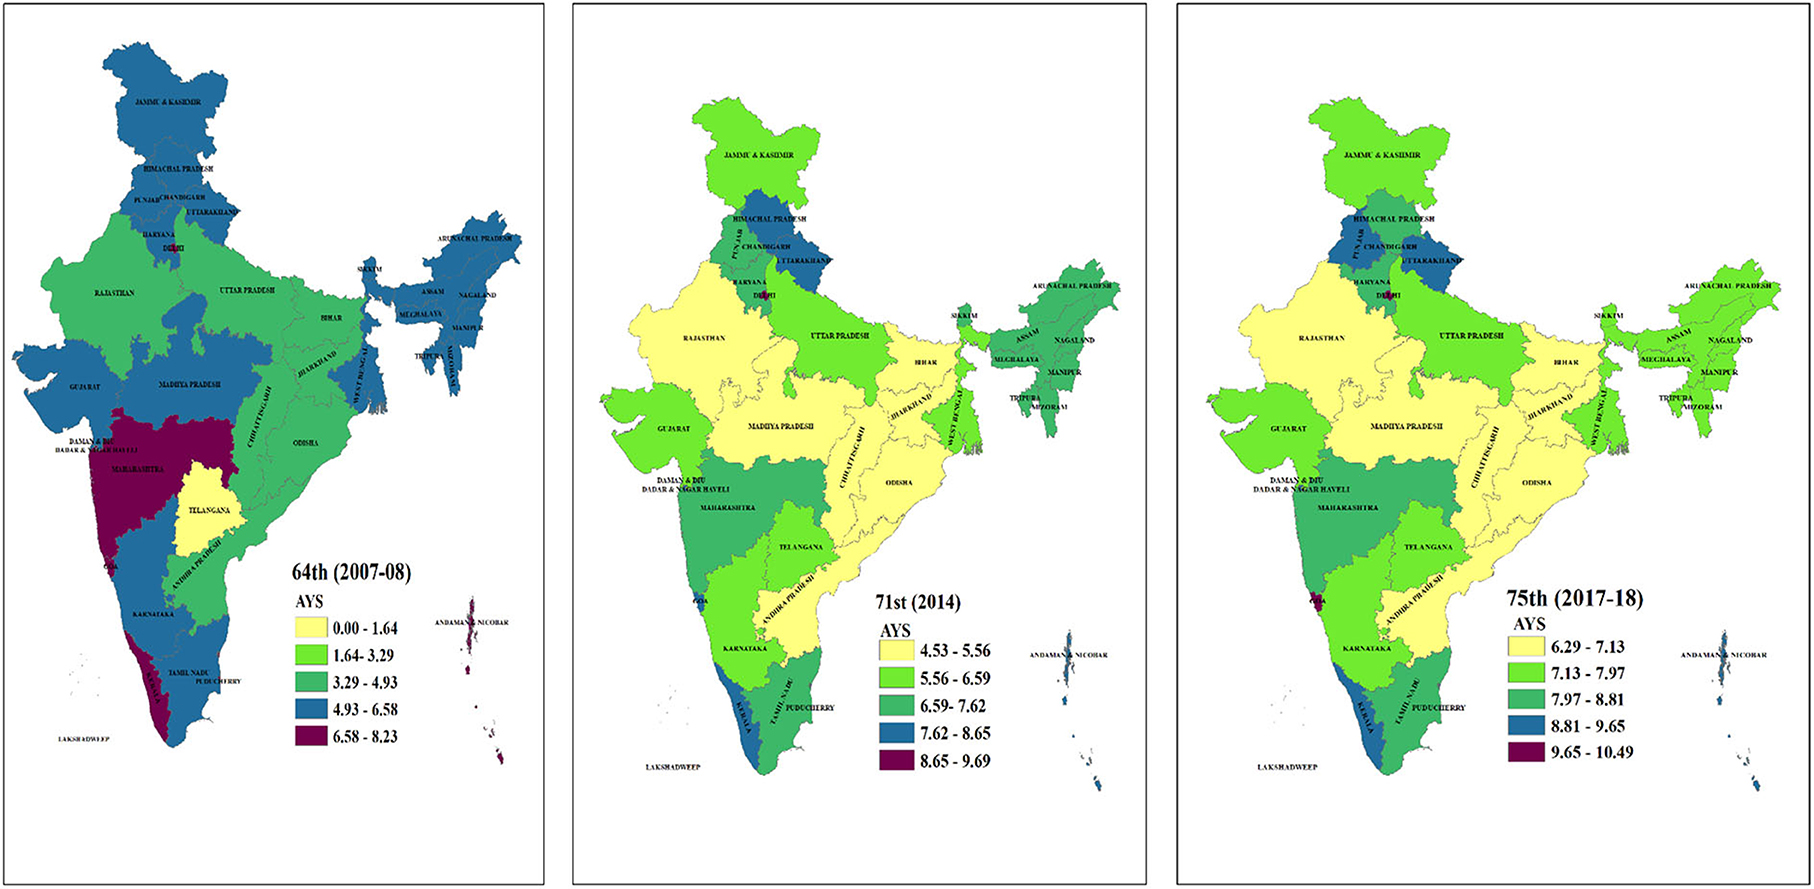
Figure 1. Average years of schooling by state/UTs. Note: 1. Telangana state is formed in the year 2014, so data are not available for the 64th round. 2. North-Eastern includes: Assam, Arunachala Pradesh, Sikkim, Meghalaya, Manipur, Mizoram, Tripura, and Nagaland.
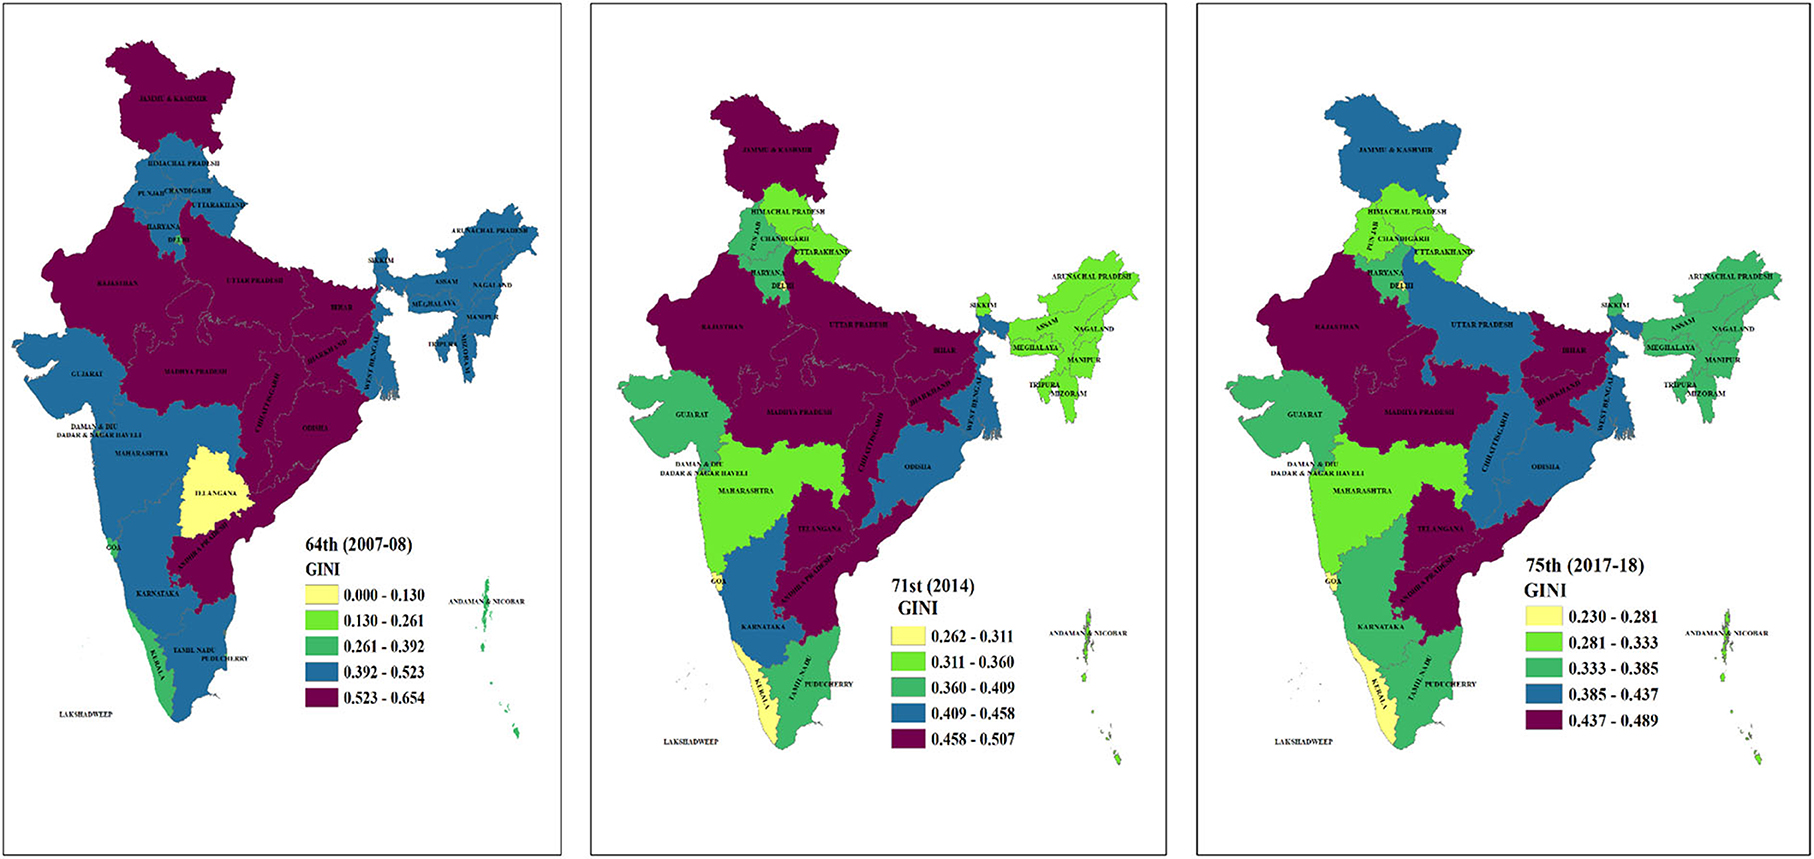
Figure 2. Education Gini by state/UTs. Note: 1. Telangana state is formed in the year 2014, so data are not available for the 64th round. 2. North-Eastern includes: Assam, Arunachala Pradesh, Sikkim, Meghalaya, Manipur, Mizoram, Tripura, and Nagaland.
Figure 3 depicts that education distribution has improved over time. Further, this Lorenz curve estimates that the bottom 27% of the population has roughly 2% of the total accumulated years of schooling, though the top 3% of the population has nearly 7% of the total accumulated years of schooling in 2018. Comparatively, in 2007, the bottom one-third of the population has no education whatsoever.
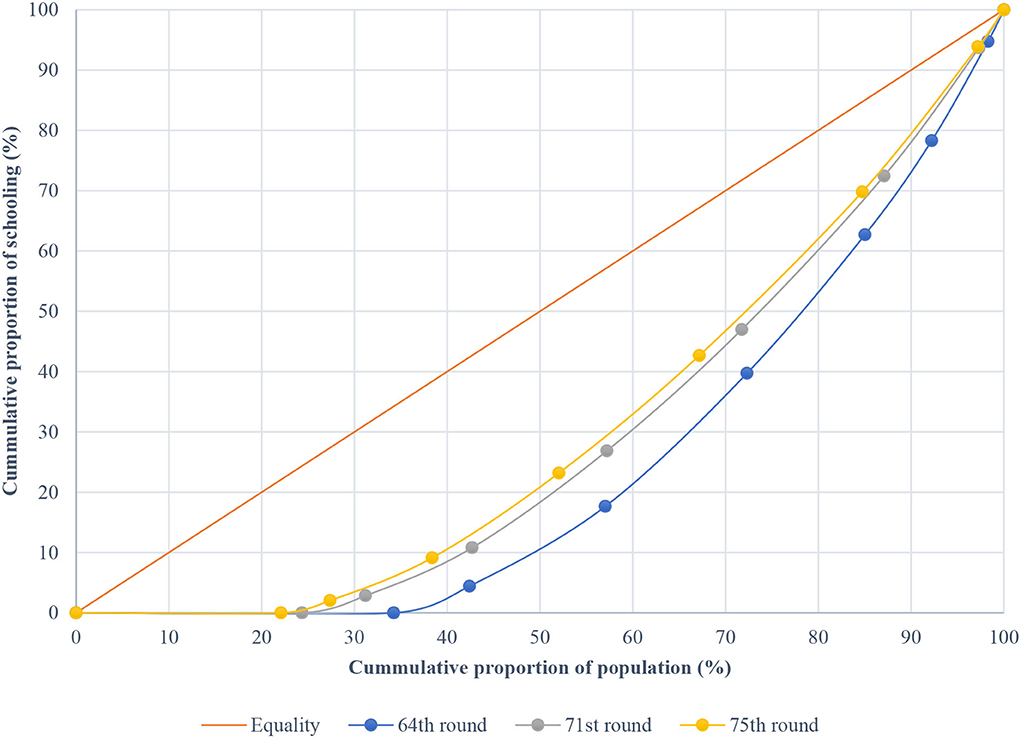
Figure 3. Lorenz curve for educational attainment.
The findings (Table 4) of the Tobit model signify that the average years of schooling decreases with the increase in age. For instance, average years of schooling are −3.098 (p < 0.001) and −7.487 (p < 0.001) units for the age groups 30–59 and 60 + years, respectively. Likewise, a reduction in average years of schooling can be detected more among females than their male counterparts. In the case of caste groups, an upsurge in the level of AYS can be observed among others, other backward classes and scheduled castes compared to the scheduled tribe. On the other hand, average years of schooling abate significantly among the Muslim community by −2.153 (p < 0.001) units. Further, place of residence plays a vital role, as it tends to have a positive influence on AYS. In other words, individuals living in urban areas have more years of schooling than those in rural areas. Conversely, a family with more than five members tend to have fewer years of education compared to their counterpart. Noteworthy differences can also be seen while moving from lowest to highest wealth quintiles, as AYS amplifies considerably. Although, it has been encountered that the individuals working in the tertiary sector have more years of education than those working in the secondary and primary sectors. Moreover, a predictor like digital exposure also played a substantial role in determining average years of schooling as it upsurges by 4.508 (p < 0.001) units. Comparing the Tobit model of all the rounds, considerable changes can be observed among all the covariates. The gap of years by gender, caste groups, religion, occupation, and wealth has been reduced. However, the rural-urban difference is consistently the same throughout the year. The progress in years through digital involvement has also been observed.
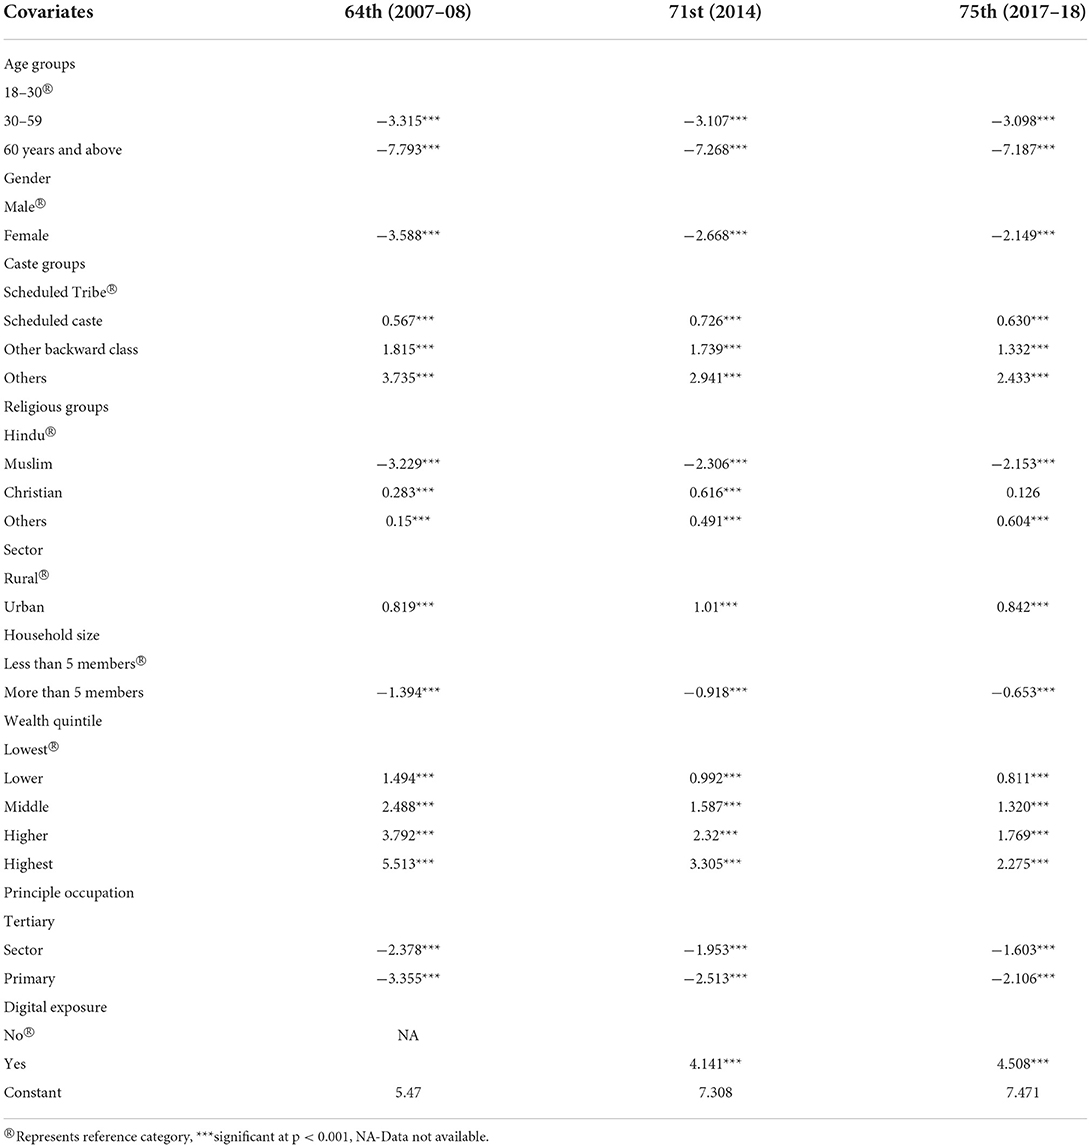
Table 4. Result of the Tobit model for average years of schooling.
The results revealed in Table 5 outline that there is substantial education inequality between males and females which has not been eradicated, even though AYS ameliorated noticeably and the educational disparity declined moderately in recent years. Moreover, considering educational attainment in rural and urban sectors, the average years of schooling in 2018 accounts to 6.44 years and 9.57 years, respectively. However, educational gaps between these two sectors are still prevailing over the decade. Further, a more striking disparity can be seen between the caste groups, as there is a reduction in the AYS gap and education Gini coefficient at the same time, but overall, the education inequality between these groups is quite high. Specifically, if schedule caste and others are considered, then there is a stark difference in educational attainment as their education Gini coefficient turns out to be 0.453 and 0.308 in 2018. Noteworthy disparities in the attainment of Muslim and other religious groups have been detected over the past 11 years. In the current survey, the calculated number for the Muslim community turns out to be 6.64 years and 44.3%, respectively.
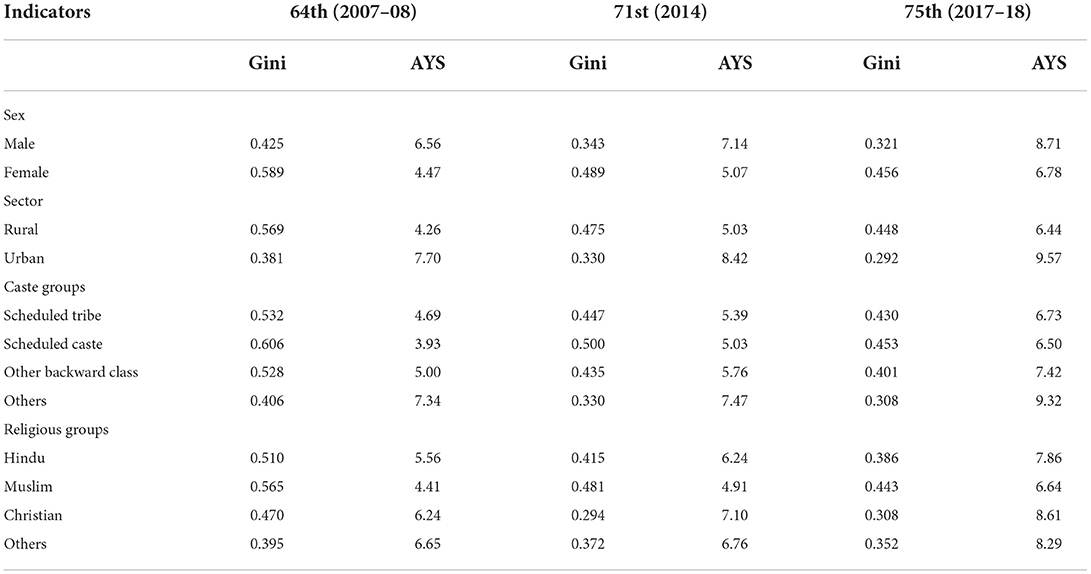
Table 5. Gini coefficient and average years of schooling (AYS) by social indicators.
Apparently, from the decomposition results in Table 6, it can be observed that around 50% of the total education inequality is due to a within-group component, and the main contributor seems to be religious groups (59.6%) followed by sex and sector. However, the picture has not changed throughout the year because both within- and between-group contribution is almost consistent in all the rounds except for religion and caste groups. Nearly one-third of the inequality is concentrated within the caste groups, and among them, the other backward class holds the major share in contribution. Conversely, in the case of gender, men and women are equally contributing to prevailing within-group disparities. Besides, within-group inequalities are specifically driven by rural areas as compared to urban areas in 2018. Further, higher intensity of within-group education inequality is also detected among the Hindu community which is the prime contributor to its other counterparts. Concerning between-group contribution in overall inequalities, the proportion is relatively smaller than that of the within-group component. The key contributors in escalating between-group disparities are sector, caste groups, and sex, which are the same in all the rounds.
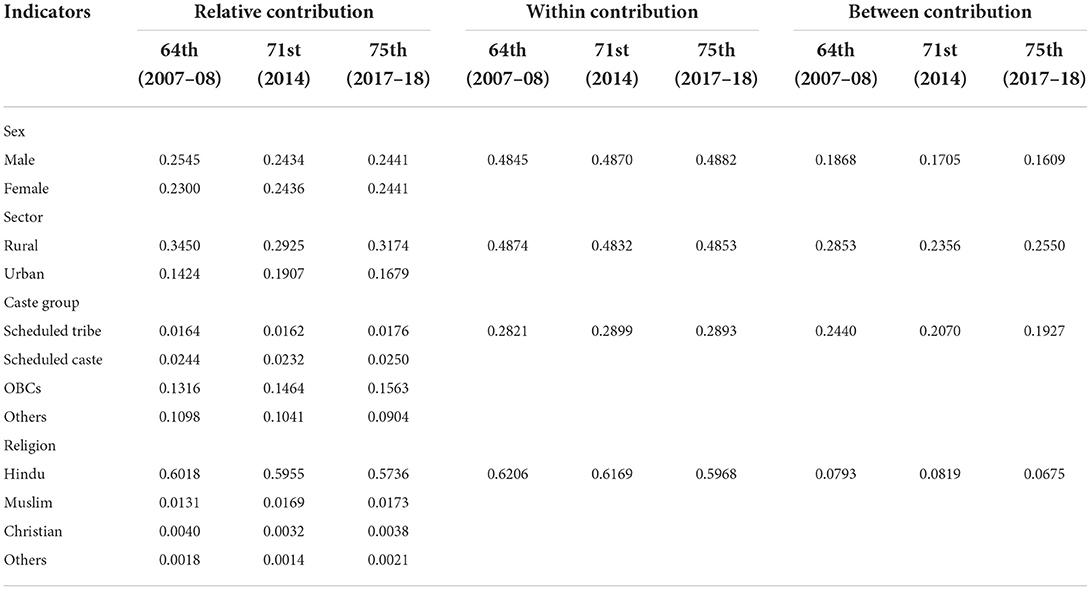
Table 6. Decomposition of Gini by subgroups.
From Table 7, it can be illustrated which predictor contributes the most to the overall educational disparity. Accordingly, the sector is the major contributor (30.1%) to overall education inequality, which means the educational gap between urban and rural areas is still a prime attribute in accelerating educational discrepancies and it has increased compared to the previous rounds. Next, caste groups are the second most influencing factor which escalates the educational gaps. However, a tremendous decline has been noted among sex; earlier its contribution was around 10.4% but it has gone down to 2.0% in the current round. No matter what, social stratification plays a crucial role in widening the disparities. Moreover, religious groups have also contributed to expanding educational disparity to a certain extent and experienced a slight increase, which depicts uneven educational distribution among religious groups in the country. Further, the least contributing factor turns out to be sex, however, it denotes dissimilar educational attainment and persisting educational gaps between male and female populations.
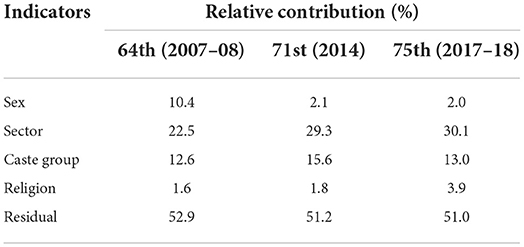
Table 7. Shapley decomposition by social indicators.
Discussion and conclusion
Over time, the Indian education system has achieved a remarkable improvement in dropping the level of illiteracy/no education and escalating primary education. The study of Agrawal (2014) depicts that 31.7% of the population had no education in 2009, however, through our study, it is visible that the level declined by 30% (Appendix Table A) in 2018. Second, sharp progress is evident concerning higher education in India, which was calculated at around 7.3% in 2009 (Agrawal, 2014) and marked at 16.26% (Appendix Table A) presently. From the aforesaid statements, a bird's eye view of overall educational attainment cannot be exemplified, thus, AYS is an appropriate measure that provides a brief picture of educational attainment for any country. In these 11 years, AYS has amplified drastically, which suggests that the majority of the population has achieved a universal level of primary education. It can be explained through Appendix Table-A that more than two-thirds of the population aged 18 years and above have completed at least a primary level of education. Moreover, the young population in the age group of 18 to 30 years have an education of more than 10 years. While in the remaining age groups, years of education account to be 6.89 and 3.70 years (Table 3), respectively.
Previously, average years of schooling for the states, namely Bihar, Rajasthan, Uttar Pradesh, Odisha, Chhattisgarh, Madhya Pradesh, and Andhra Pradesh, were estimated to be less than 5 years, indicating a large proportion of the population did not complete a primary level of education. Nonetheless, in recent times, these states have accomplished more than 5 years of education, even though the educational disparity has not reduced to a satisfactory level, and is still concentrated at 50%. One of the main reasons may be that these states have a large proportion of the rural population. Several studies have highlighted that in rural parts of India, education attainment of children suffers due to poor physical infrastructure, lack of access to a school with reasonable distance, quality of teaching, teacher absenteeism, and teacher-student ratio (Agrawal, 2014; Kugler and Kumar, 2017; Chatterjee et al., 2018). Besides, most of the rural population usually engages in agricultural activities, and during the peak season, they do not allow their children to attend classes which may result in long absenteeism and even drop-out (Ramachandran, 2009). In states like Rajasthan, Madhya Pradesh, and Uttar Pradesh, there is a considerable number of scheduled tribe and scheduled caste populations who are generally deprived of schooling, and as indicated in Table 3, the years of schooling of these groups are far below other caste groups. On the contrary, Himachal Pradesh, which has a similar level of rural population, plays a crucial role in successfully improving their basic education. Despite challenges, the educational experience of this state can be observed from the recent figures of AYS and Gini coefficient which are 8.71 years and 31%, respectively. This success story can be attributed to the state government's commitment, parental demand, and community involvement (Dreze and Sen, 2002; De et al., 2011). Another exemplary state is Kerala, which has already achieved a high level of literacy rate way before any state in India. The evolution of education is ascribed to numerous actions and policy measures taken by both public and private sectors, the provision of a better quality of education, and the high level of accessibility and availability of schools in rural areas (Government of India, 2008). Lately, Goa has shown growth in enhancing educational attainment, which is quite noticeable as it surpasses Kerala's progress in terms of average years of education and educational inequality (see Figures 1, 2). The current progress is the result of government interventions through SSA in effectively diminishing school dropouts and improving enrolment rates (Andrade and Singhal, 2012). The states and union territory, specifically Uttarakhand, Punjab, and Delhi, have also improved their educational outcomes in recent times.
Additionally, the findings demonstrate that years of schooling are influenced by all socio-economic and demographic indicators considered in the study. It has been encountered that people who are exposed to digital platforms have substantially more advanced levels of education than their counterparts. Several studies illustrate that a higher level of digital exposure leads to improvement in children's cognitive performance and their learning motivation (Finn Jr and Horn, 2013; Cavanaugh et al., 2016; Lin et al., 2017). The influence of digital platforms on education in India has improved compared to the previous round. The increase in exposure to digital platforms has been the result of an increase in internet connectivity as well as easier access to computers. However, the exposure to digital platforms may vary by place of residence, because in rural areas, children are still out of reach of access to computers and the internet.
The caste and religious mechanisms have negative repercussions on educational outcomes, however, the difference in years of education has narrowed to a certain extent. It is evident that scheduled caste, scheduled tribe, and the Muslim community displayed around 43% educational disparity in 2018. Again, the year of education is influenced by household/family size, which denotes that a large number of family members may put a financial strain on household income, further affecting educational attainment. The results have provided a magnitude of comparison with the study of Kugler and Kumar (2017), which states that the majority of the children belonging to large families have a low level of educational attainment, especially those from rural areas, poorer households, and lower caste hierarchy. On the other hand, higher occupational grades and wealthier households are less likely subjected to credit constraints when making any choice for educational opportunities. Thus, children from such households hold an advanced level of education (Filmer and Pritchett, 1999; Filmer, 2005). However, being a girl has serious implications for their educational attainment. Even though the years of education among females have upsurged over the past decade by 50%, their educational disparity is still concentrated around 45%. This reflects huge gender differences in terms of educational outcomes instigated by the prevailing social norm of son preference, which is widely known in a developing nation like India (Bose, 2012; Kugler and Kumar, 2017). The impact of gender preference has built the context of parental biases against daughters, as it is considered that daughters provide low educational returns compared to sons (Jere et al., 1999; Gandhi Kingdon, 2002). Further, there are multiple reasons which put daughters at greater educational disadvantage viz. early marriage (Gouda and Sekher, 2014), poor school infrastructure (Govinda and Bandyopadhyay, 2010; Kishore and Shaji, 2012; Gouda and Sekher, 2014), poor social and economic circumstances (Velaskar, 2005; Wu et al., 2007; Govinda and Bandyopadhyay, 2010), and finally mother's education (Maitra and Sharma, 2009; Govinda and Bandyopadhyay, 2010; Bose, 2012; Nakajima et al., 2018). Inefficacious educational delivery and outcomes for girls have also been manifested in the state of Andhra Pradesh, as they are generally driven toward household chores which make them more pronounced, exclusively those from poor social groups and rural areas (Venkatanarayana, 2004; Ramachandran, 2009; Nakajima et al., 2018).
The educational disparity has recovered over recent times, as indicated by education Gini which is nearly 38% compared to 50% in 2008. Nevertheless, high intensity of educational inequality can be observed among within-group components, especially in the rural sector, Other Backward Class (OBC), and the Hindu community. The high within-group contribution indicates the existence of serious education disparity within the rural area, OBC, and Hindu population. This inequality could be due to high income and class inequality in terms of access to education. Accordingly, between-group component sketches the idea of educational differences between two mutually exclusive groups. Evidently from all three rounds, it can be seen that large rural-urban differences and caste and gender discrimination still exist in India, which contributes significantly to prevailing educational inequality. Consistent with this result, Shapley's decomposition shows that the sector is the prime contributor to escalating education inequality followed by caste groups. Thus, it indicates that greater educational disadvantage among rural students is due to a lack of good quality education and other educational resources which could benefit them in attaining tertiary-level schooling.
The article suffers from certain limitations: first: it has utilized cross-sectional data so cannot explicate causal relationships. Second, the present data lack some important indicators related to the quality of education during school/college, parents' educational background, parental occupation, and parents' aspiration toward education, which would play a key role in determining educational attainment. Moreover, the use of computer and internet services is taken as the proxy of digital exposure, instead, the information regarding online classes could have provided better picturization for the given indicator. Therefore, future research should emphasize longitudinal data and incorporate the suggested indicators.
Improving educational attainment in India has been challenging over time because the society predominantly follows the principle of hierarchy, division, and mutual repulsion (Velaskar, 2010). Although, signs of success are seen in education expansion and enrolment with the help of RTE, SSA, and the Mid-day meal Scheme implemented by the government of India. However, other factors like physical infrastructure, teacher-student ratio, and teacher absenteeism are still a matter of concern that is substantially contributing to educational inequality. Besides, access to education is still very problematic as there is great variation between and within states, and large differences in participation between distinguishable sub-populations, for example, Scheduled Caste, Scheduled Tribe, females, and the Muslim population (Lewin, 2011). Stratum variations including rural and urban sectors are deeply rooted (Wu et al., 2007; Asadullah and Yalonetzky, 2012), and has accelerated the discrepancy based on educational investment and resources. Relatively, the urban class is enjoying a better quality of education, resources, and opportunities, excluding the underprivileged group (Yang et al., 2014). To accentuate balanced development, it is essential to focus on better school infrastructures, adequate toilet facilities, and good quality of education which can encourage rural children to accomplish their desired years of education. Effectively prioritizing elementary schooling services in remote areas of the country will motivate and benefit the children, even those belonging to neglected sections of rural society.
Growing income inequality has imprinted stark disparities in widening the educational gaps. Prominently, income inequality triggers gender and caste discrimination which in turn affects educational attainment. Consequently, designing equitable and affordable mechanisms can lessen income inequality and would help the population in attaining desired education. Furthermore, the policies and programs should promote awareness regarding the importance of education among parents and their children to reduce the marked gaps. Steps taken by educationally advanced states who have demonstrated their success story should be considered as a basis for policy formulation. Additionally, digital learning or internet-based learning could be an essential contributor to enhancing educational outcomes. However, due to the cross-sectional nature of the present study, the causal effect of digital learning on educational attainment cannot be claimed, but future research with longitudinal information could focus on this aspect. Although, due to the resourceful nature of e-learning, emphasis should be given to this new mode of platform as well, which could provide equitable access to knowledge for all children belonging to various sections of Indian society without any biases.
Data availability statement
Publicly available datasets were analyzed in this study. This data can be found here: http://www.icssrdataservice.in/datarepository/index.php/catalog.
Author contributions
MG and PC have contributed to data analysis and writeup. MS has provided valuable comments for the improvement of the manuscript. All authors contributed to the article and approved the submitted version.
Acknowledgments
This article is a part of a Ph.D. thesis, and I would like to thank my supervisor for his continuous support and guidance.
Conflict of interest
The authors declare that the research was conducted in the absence of any commercial or financial relationships that could be construed as a potential conflict of interest.
Publisher's note
All claims expressed in this article are solely those of the authors and do not necessarily represent those of their affiliated organizations, or those of the publisher, the editors and the reviewers. Any product that may be evaluated in this article, or claim that may be made by its manufacturer, is not guaranteed or endorsed by the publisher.
Supplementary material
The Supplementary Material for this article can be found online at: https://www.frontiersin.org/articles/10.3389/feduc.2022.871043/full#supplementary-material
Footnote
1. ^In India, UTs are the administrative divisions, which are governed by the central government. Union Territories include Delhi, Chandigarh, Puducherry, Daman and Diu, Dadar and Nagar Haveli, Andaman and Nicobar, Lakshadweep.
References
Agrawal, T. (2014). Educational inequality in rural and urban India. Int. J. Educ. Develop. 34, 11–19. doi: 10.1016/j.ijedudev.2013.05.002
Andrade, F., and Singhal, D. J. M. (2012). Towards Achieving Education for All: Sarva Shiksha Abhiyan and Its Progress in Goa, 49.
Asadullah, M. N., and Yalonetzky, G. (2012). Inequality of educational opportunity in India: changes over time and across states. World Develop. 40, 1151–1163. doi: 10.1016/j.worlddev.2011.11.008
Banerji, R., and Mukherjee, A. N. J. M. (2008). Achieving universal elementary education in India: Future strategies for ensuring access, quality and finance. 2, 213–228. doi: 10.1177/097380100800200204
Behrman, J. R. (1996). The impact of health and nutrition on education. World Bank Res. Observ. 11, 23–37. doi: 10.1093/wbro/11.1.23
Bhatty, K. J. E., and Weekly, P. (2014). Review of Elementary Education Policy in India: Has It Upheld the Constitutional Objective of Equality?. 100–107.
Bose, S. (2012). A contextual analysis of gender disparity in education in india: the relative effects of son preference. Women's Status Commun. 55, 67–91. doi: 10.1525/sop.2012.55.1.67
Cavanaugh, J. M., Giapponi, C. C., and Golden, T. D. J. J. (2016). Digital technology and student cognitive development: the neuroscience of the university classroom. Jama 40, 374–397. doi: 10.1177/1052562915614051
Chamarbagwala, R. (2008). Regional returns to education, child labour and schooling in India. J. Develop. Stud. 44, 233–257. doi: 10.1080/00220380701789935
Chatterjee, I., Li, I., and Robitaille, M.-C. (2018). An overview of India's primary school education policies and outcomes 2005–2011. World Develop. 106, 99–110. doi: 10.1016/j.worlddev.2018.01.016
De, A., Khera, R., Samson, M., and Kumar, A. S. K. (2011). Probe Revisited: A Report on Elementary Education in India. Oxford: Oxford University Press. Available online at: https://econpapers.repec.org/scripts/showcites.pf?h=repec:oxp:obooks:9780198071570
Dreze, J., and Sen, A. (2002). India: Development and Participation. Oxford: Oxford University Press.
Filmer, D. (2005). Gender and wealth disparities in schooling: evidence from 44 countries. Int. J. Educat. Res. 43, 351–369. doi: 10.1016/j.ijer.2006.06.012
Filmer, D., and Pritchett, L. (1999). The effect of household wealth on educational attainment: evidence from 35 countries. Populat. Develop. Rev. 25, 85–120. doi: 10.1111/j.1728-4457.1999.00085.x
Finn Jr, C. E., and Horn, M. B. J. E. N. (2013). Can digital learning transform education. Educ. Next 13, 54–56.
Gandhi Kingdon, G. (2002). The gender gap in educational attainment in india: how much can be explained? J. Develop. Stud. 39, 25–53. doi: 10.1080/00220380412331322741
Gouda, S., and Sekher, T. (2014). Factors leading to school dropouts in India: an analysis of national family health survey-3 data. IOSR J. Res. Method Educ. 4, 75–83. doi: 10.9790/7388-04637583
Govinda, R., and Bandyopadhyay, M. (2010). Social exclusion and school participation in India: expanding access with equity. Prospects 40, 337–354. doi: 10.1007/s11125-010-9160-8
Hanushek, E. A., and Kimko, D. D. (2000). Schooling, labor-force quality, and the growth of nations. Am. Econ. Rev. 90, 1184–1208. doi: 10.1257/aer.90.5.1184
Jere, R., Behrman, A. D., Foster, M. R., Rosenzweig, E., and Prem, V. (1999). Women's schooling, home teaching, and economic growth. J. Polit. Econ. 107, 682–714. doi: 10.1086/250075
Kishore, A. N. R., and Shaji, K. S. (2012). School dropouts: examining the space of reasons. Indian J. Psychologic. Med. 34, 318–323. doi: 10.4103/0253-7176.108201
Kugler, A. D., and Kumar, S. J. D. (2017). Preference for boys, family size, and educational attainment in India. Demography 54, 835–859. doi: 10.1007/s13524-017-0575-1
Lambert, P. J., and Aronson, J. R. (1993). Inequality decomposition analysis and the Gini coefficient revisited. Quantitative Economics: Theory and Practice (Essays in Honour of Professor N. Bhattacharya. Calcutta: Allied Publishers (for the Indian Statistical Institute), 1998. This is also journal article 40 ahead, 217–228.
Lewin, K. M. (2011). Expanding access to secondary education: Can India catch up? Int. J. Educat. Develop. 31, 382–393. doi: 10.1016/j.ijedudev.2011.01.007
Lin, M.-H., Chen, H., and Science Education, T. (2017). A study of the effects of digital learning on learning motivation and learning outcome. EURASIA J. Math. Sci. Tech. Ed. 13, 3553–3564. doi: 10.12973/eurasia.2017.00744a
Maitra, P., and Sharma, A. (2009). Parents and children: Education across generations in India. Paper presented at the 5th annual conference on economic growth and development, ISI Delhi, Delhi.
Maksymenko, S. V., and Rabbani, M. (2008). “Economic reforms, human capital, and economic growth in India and South Korea: a cointegration analysis,” in Human Capital, and Economic Growth in India and South Korea: A Cointegration Analysis (August 1, 2008).
Mehrotra, S. (2012). The cost and financing of the right to education in India: can we fill the financing gap? Int. J. Educ. Develop. 32, 65–71. doi: 10.1016/j.ijedudev.2011.02.001
Nakajima, M., Kijima, Y., and Otsuka, K. (2018). Is the learning crisis responsible for school dropout? a longitudinal study of Andhra Pradesh, India. Int. J. Educ. Develop. 62, 245–253. doi: 10.1016/j.ijedudev.2018.05.006
NSSO. (2008). Participation and Expenditure in Education. National Sample Sruvey Office, Government of India, New Delhi.
NSSO. (2014). Social Consumption on Education in India. National Sample Survey Office, Government of India, New Delhi.
NSSO. (2018). Social Consumption on Education in India. National Statistical Office, Ministry of Statistics and Programme Implementation, Government of India, New Delhi.
NUEPA. (2014). Education For all: Towards Quality With Equity. Available online at: http://mhrd.gov.in/sites/upload_files/mhrd/files/upload_document/EFA-Review-Report-final.pdf (accessed June 18, 2021).
Picard, N., and Wolff, F.-C. (2008). Measuring educational inequalities: Evidence from Albania. J. Populat. Econ. 23, 989–1023.
Pieters, J. (2011). Education and household inequality change: a decomposition analysis for India. J. Develop. Stud. 47, 1909–1924. doi: 10.1080/00220388.2011.561323
Prakash, V. (2008). Perspectives on Education and Development: Revisiting Education Commission. New Delhi: Shipra Publications.
Ram, R. (1990). Educational expansion and schooling inequality: international evidence and some implications. Rev. Econ. Statistic. 72, 266–274. doi: 10.2307/2109716
Ramachandran, V. (2009). Systemic barriers to equity in education. Concerns, Conflicts Cohesions: Universalisation of Elementary Education in India. New Delhi: Oxford University Press.
Sebastien, D. (1999). Human Capital and Growth: The Recovered Role of Education Systems. Available online at: https://ssrn.com/abstract=632700
Thomas, V., Wang, Y., and Fan, X. (2001). Measuring Education Inequality: Gini Coefficients of Education (Vol. 2525). New Delhi: World Bank Publications.
Tilak, J. B. (2008). Higher education: a public good or a commodity for trade? Prospects 38, 449–466. doi: 10.1007/s11125-009-9093-2
Velaskar, P. (2005). Education, caste, gender: Dalit girls' access to schooling in Maharashtra. J. Educat. Plann. Administr. 19, 459–482.
Velaskar, P. (2010). Quality and inequality in Indian education. Some Critical Policy Concerns. 7, 58–93. doi: 10.1177/0973184913411200
Velaskar, P. (2012). Sociology of Educational Inequality in India: A Critique and a New Research Agenda. doi: 10.1093/acprof:oso/9780198082866.003.0006
Venkatanarayana, M. (2004). Educational Deprivation of Children in Andhra Pradesh : Levels and Trends, Disparities and Associative Factors. CDS Working Papers, No.362. Trivandrum: CDS.
Ward, M. (2011). Aid to education: the case of Sarva Shiksha Abhiyan in India and the role of development partners. J. Educat. Policy 26, 543–556. doi: 10.1080/02680939.2011.555001
Wu, K. B., Goldschmidt, P., Boscardin, C. K., and Azam, M. (2007). “Girls in India: poverty, location, and social disparities,” in Exclusion, gender and education: Case studies from the Developing World, 119–143.
Yang, J., Huang, X., and Liu, X. (2014). An analysis of education inequality in China. Int. J. Educat. Develop. 37, 2–10. doi: 10.1016/j.ijedudev.2014.03.002
Keywords: educational inequality, educational attainment, Shapley decomposition, Tobit regression, India
Citation: Garg MK, Chowdhury P and SK MIK (2022) An overview of educational inequality in India: The role of social and demographic factors. Front. Educ. 7:871043. doi: 10.3389/feduc.2022.871043
Received: 07 February 2022; Accepted: 27 October 2022;
Published: 18 November 2022.
Edited by:
Raman Grover, Psychometric Consultant, Vancouver, CanadaReviewed by:
Rachel Wollschläger, University of Luxembourg, LuxembourgNathanaël Friant, Université libre de Bruxelles, Belgium
Copyright © 2022 Garg, Chowdhury and SK. This is an open-access article distributed under the terms of the Creative Commons Attribution License (CC BY). The use, distribution or reproduction in other forums is permitted, provided the original author(s) and the copyright owner(s) are credited and that the original publication in this journal is cited, in accordance with accepted academic practice. No use, distribution or reproduction is permitted which does not comply with these terms.
*Correspondence: Mausam Kumar Garg, bWF1c2Fta3VtYXIzOUBnbWFpbC5jb20=