Abstract
Developing chemistry students' capability to use representations to explain phenomena is a challenging task for educators. To overcome chemistry students' learning difficulties, strategies that favor the development of visualization capabilities have been identified as productive. We are particularly interested in exploring the use of augmented reality in chemistry education to foster the development of those capabilities in undergraduate students. Our research objective was to analyze the contribution of augmented reality to support undergraduate chemistry students' visualization capacities while explaining the physical-kinetic processes of chromatography. Using an exploratory case study approach, we designed and conducted four task teaching and learning sequences, with seven Augmented Reality markers embedded. Thirty-eight undergraduate students, who voluntarily agreed to participate, explained the different elution rates of pigments in a chromatographic column. Their written accounts were analyzed to identify the level of sophistication of their representations. After using Augmented Reality, students' representations progressed from simple macroscopic descriptions of observed phenomena to explanations of processes where scientific ideas and microscopic representations were used as supporting evidence. Our study shows that the use of Augmented Reality has the potential to favor a more sophisticated use of representations when undergraduate students explain chromatographic processes. However, there are still limitations in reaching the highest levels of performance described in the literature.
Introduction
Chemistry undergraduate students should be able to use their knowledge to ascertain the chemical aspects of the world around them (Stowe et al., 2019). Applying chemical knowledge to build appropriate descriptions, predictions, and explanations around chemical phenomena requires representing matter at different scales. Working within macroscopic, submicroscopic, and symbolic models of matter, and switching between them, enables undergraduate students to connect their experiences and interpretations of the world, with the world modeled by science (Talanquer, 2011).
Connecting the world we can perceive with atoms and molecules requires making inferences that are not intuitive. Developing undergraduate chemistry students' ability to build mental representations of the behavior of atoms and molecules in chemical processes is still a challenging task for educators (Abdinejad et al., 2021). This is partly because the construction of representations of real-world phenomena involves entities that are rarely visible to the human eye. It also requires students to mentally invoke the entities involved in chemical phenomena, at a given scale, and infer how variations of the system conditions might affect their behavior (Gilbert, 2008). The mental models that chemistry undergraduate students build are expressed through representations, using descriptive, symbolic, and semantic forms of representation to communicate their ideas (Kozma and Russell, 2005). According to the authors, a higher level of representation in the expression of a scientific model would be evidenced by the greater use of various forms of representation. Moreover, high levels of representation respond to more sophisticated ideas that configure a model with a higher level of adjustment to reality and therefore enable the building of more accurate descriptions, predictions, and explanations (Kozma and Russell, 2005; Russell and Kozma, 2005).
Given the difficulties of undergraduate chemistry students in the construction of mental representations, visual static and dynamic artifacts, such as graphs, images, diagrams, animations, or simulations, have been identified as effective scaffolding tools to facilitate visualization (Kozma and Russell, 2005). According to Reiner and Gilbert (2008), students' visualization capacity would be the ability to interpret these physical representations of a phenomenon, attributing meanings to the various forms of representation by recognizing the chemical entities represented and their behavior, and connecting them with the real phenomena (Reiner and Gilbert, 2008). Through real world, iterative interactions with phenomena, the physical representations, chemistry undergraduate students develop visualization capacities, evaluate and adjust their mental models, and move toward more sophisticated mental representations of phenomena.
Among the various visual artifacts suggested in chemistry education, augmented reality (AR), as a technology that overlays virtual objects over real images (Azuma et al., 2001; Abdinejad et al., 2021), has been identified as a particularly valuable visual-dynamic artifact. The learning processes of students can benefit from augmented reality, by showing the relationship between objects and learned concepts (Fabri et al., 2008). These benefits are especially relevant in situations and environments where the description of the objects, their behavior, and the concepts related to them are complex to explain and require a greater effort in learning. According to the literature, the integration of AR in chemistry teaching and learning sequences facilitates the visualization of entities and interactions at the microscopic level, fostering the comprehension of a wide range of chemical processes (Fabri et al., 2008; González et al., 2020).
In recent years, technologies have been combined with augmented reality for the design of applications that can be used on mobile devices that are accessible to students (Papagiannakis et al., 2008). However, since most of the research published so far has had an emphasis on technological and motivational aspects, rather than pedagogical or epistemic (Akçayir and Akçayir, 2017; Arici et al., 2019; Garzón et al., 2019, 2020; Pedaste et al., 2020), we still barely understand how AR promotes inferences between reality, virtual objects, and students' representations (Saritaş et al., 2021).
The study of chromatographic processes could benefit from the use of AR. Chromatography is a mixture separation technique based on the different retention of the components of a mixture contained in a mobile phase when eluting through a stationary phase. Chromatographic processes allow a mixture to be separated into its individual components, determine the amount of each of them, and identify the chemical species present in the mixture. The separation process is represented by a chromatogram, a diagram that shows the elution process of the components using peaks and allows an observer to evaluate the efficiency of the separation process. A mixture separation process is efficient if there is no overlap between the peaks and they have low bandwidth. Achieving this efficiency depends on many factors: the interaction of the analytes with the stationary phase, its length, and the elution rate, among others (Scott, 2020).
Understanding a chromatographic mechanism, interpreting chromatograms, and optimizing the efficiency of a chromatographic system requires visualizing the behavior of analyte particles during the separation process. It requires the representation of the analyte particles at the individual level to understand their affinity for the stationary phase; and at the molar level, understanding the dispersion of their trajectories, which is dependent on the kinetics and thermodynamic factors of the process (Marson and Torres, 2011; Quiroz et al., 2013).
Statement of the problem and research question
Existing literature on learning chromatography in higher education confirms the challenges undergraduate students face when studying these complex chemical processes (Starkey, 1986; Quiroz et al., 2013). Since the interpretation of chromatographic processes requires representing the behavior of the particles of the mixture at various scales, their explanation becomes an opportunity to develop students' visualization capacity. Our assumption, informed by the existing research, is that the use of dynamic technological artifacts, such as AR, can foster chemistry undergraduate students' capacity to visualize particle behavior both on an individual and molar-level scale. Therefore, students would be able to build better interpretations of chromatographic figures and the effect that experimental variables—such as elution rate, chromatographic length, and particle diameter—have on them (Skoog et al., 2017).
Studies in education about chromatography teaching are scarce. The need to use technological tools for chromatography teaching has been discussed in the literature since 1976, when Scott published a work using computers to simulate the chromatographic behavior of an analyte using the theoretical bases of countercurrent extraction processes, focusing mainly on the prediction of elution profiles (Scott, 1971). In 1986, Starkey published a brief review about common chromatography misconceptions. For example, it is claimed that students believe that the notion that the separation of compounds involves differing lengths of time that each compound spends in the mobile phase instead of considering that all the components that reach the detector spend the same length of time in the mobile phase since they all have the same distance to traverse (Starkey, 1986).
Curtright et al. published a study about the teaching of chromatography based on a hands-on approach by separating plant pigments by Thin Layer Chromatography (TLC) by a collaborative approach. The study was focused on understanding the thermodynamics principles of chromatography by following retention time vs. mobile solvent polarity (Curtright et al., 1999). In 2007, Stone published a work about the use of chromatography educational software using virtual laboratory exercises in a 4-year undergraduate course in separation science. In this study, the activities were focused mostly on simulating the effects of experimental variables such as pH, polarity, temperature, or mobile phase gradients on chromatographic figures of merit such as selectivity, retention factor, resolution, and retention time, through specially designed software generating a significant experience for students (Stone, 2007).
On the other hand, in 2010, Hernández-Abad et al. published a research paper on the teaching of chromatography under the approach of the Gowin V where they conclude that the teaching and learning processes of HPLC subjects were improved through the undertaken intervention increasing approval rates (Mora-Guevara et al., 2010). In 2019, Donoso-Tauda et al. published a work about the teaching of the basic concepts of HPLC based on a collaborative and linked learning approach in a project-based activity. This study was focused mostly on macroscopic concepts such as retention time, peak identification, stationary and mobile phase, reverse elution, and quantification (Tauda et al., 2019).
In 2020, Xie et al. published a work about chromatography teaching based on an experiential learning module. The main chromatographic topics in this study were a chromatographic column, solvent selection, experimental design, and preparative chromatography. Main chromatographic concepts such as retention time, recovery, retention factor, flow, injection volume, and peak intensity were included with positive feedback from learners (Xie et al., 2020). In 2020, Ibarra et al. reported the use of a homemade experimental kit for the separation of the primary colors of ink markers and food coloring for understanding the basic principles of chromatography. The activity was mostly focused on observational results of the separation of primary colors and discussions about the molecular interactions of the analytes with the solvents and columns (Ibarra-Rivera et al., 2020).
Previous articles have been an important contribution to education in chromatography. All of them have been focused mainly on both visual macroscopic observational variables such as colors of the analytes in an elution process, as well as the effect of thermodynamic variables associated with the mobile and stationary phases on the chromatographic figures of merit. On the other hand, at the microscopic level, they have focused mainly on analyzing the effect of the molecular structure of the analyte particle on its interaction forces with the stationary phase molecules. In our opinion, between the macroscopic and microscopic levels, there has been a gap with respect to the molar level associated with the dynamic processes of mass transport throughout the chromatographic process, which are fundamental within the kinetic theory of chromatography.
In this article, we analyze undergraduate chemistry students' development of visualization capacities when providing interactive visual-dynamic artifacts to support the visualization of entities that are not accessible to their senses, to reason about chemical processes. This study centered on the analysis of students' explanations of chromatographic chemical substances separation, and it was guided by the following research question:
RQ1: How does the use of AR promote the visualization capacities of undergraduate chemistry students, when explaining chromatographic processes?
Methods
Context and participants
This research was based on the analysis of the written records generated by 38 third-year undergraduate chemistry students enrolled in an analytical chemistry class, taught by a teacher who volunteered to participate in the study, and their attention, relevance, confidence, and satisfaction when using this technological artifact. The teacher reported having repeatedly experienced difficulties with students' learning of the chromatography processes, despite having made improvements in the design of the course in recent years.
Data were collected as part of a lesson where an immersive AR artifact was used, maintaining other ongoing pedagogical approaches from previous iterations of the course, aimed at understanding the mechanism of chromatography. The participants were informed of the scope of the research conducted and gave their consent to participate in the study, according to the guidelines of the bioethics committee of the institution sponsoring the research.
Research instruments
In this research, our objective was to document the development of students' visualization capacity using an AR artifact to support the visualization of entities that are not perceivable, when teaching chemical complex phenomena such as chromatography, and we considered their attention, relevance, confidence, and satisfaction when using this technological artifact.
Through a quasi-experimental methodology, with a non-probabilistic sample, we explored the contributions of the AR artifact in the chromatography learning processes of chemistry undergraduate students. We used an exploratory case study approach, as it facilitates the exploration of the phenomenon within its context, to reach concrete and particular abstractions pertinent to the analyzed sample and from which patterns can be identified (Yin, 2003; Baxter and Jack, 2008).
To that end, we designed and validated a chromatography teaching-learning sequence consisting of four tasks, that contained seven AR markers that met the key features of dynamic technological artifacts in science education (Azuma et al., 2001; Méheut and Psillos, 2004; Munn et al., 2018). The AR artifact allowed the dynamic visualization of chromatographic processes through various forms of representation, allowing us to relate the peaks of a chromatogram with the particles' behavior. In doing so, the AR artifact made it possible to dynamically visualize aspects of the phenomenon that were not within the reach of students' senses, especially those that are highly kinetic, and articulate them with those aspects that can be perceived. The English version of those tasks is presented in Table 1. Nuances in the original text may be lost in translation. The teaching-learning sequence was validated before application through content specialists, peer validation, and testing in small groups (Bego et al., 2019).
Table 1
| Task | Objectives | Context | Problems to be solved | AR artifact |
|---|---|---|---|---|
| T1 | Identify the thermodynamic and kinetic concepts of chromatographic theories. | Two chromatograms are presented, where the macroscopic distribution of the components of a mixture is represented.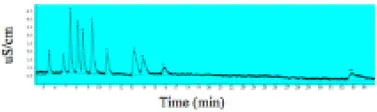 | What do you think the different elution speeds of different substances are due to? Are they possible causes of the different chemical speeds, are they just physical, or are they both? For particles of the same substance or compound, could all particles be expected to move at the same speed? | Marker 1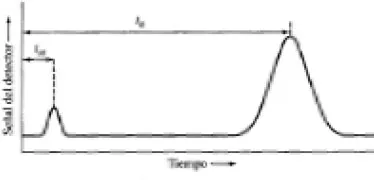 The elution process on the solid support is shown dynamically and macroscopically. |
| T2 | Explain the physical-kinetic processes of chromatography. | A dynamic chromatogram is presented, showing the retention time of an analyte. In the chromatogram, the bandwidth represents the dispersion of the particles during the chromatographic process.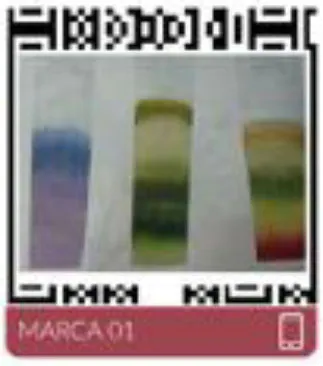 | What is the zone of lowest theoretical plate height (H)? How can we adjust the physical parameters to minimize dispersion? | Marker 2, 3 and 4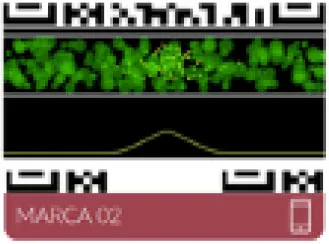 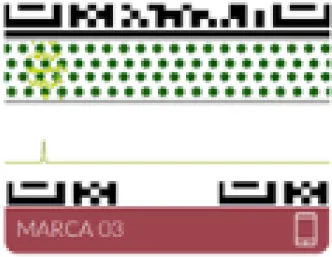 The concepts of retention time, elution rate, and mobile phase are presented dynamically and microscopically. 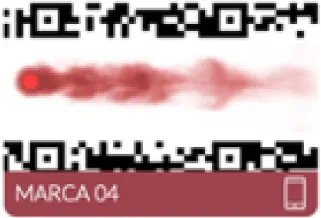 It shows how the effect of the mass transport phenomenon on the elution of substances would be seen at a macroscopic level. |
| T3 | Relate the calculation of Rs to those of bandwidth and time. | The concept of resolution, its mathematical expression, and a chromatogram to which the formula for calculating resolutions can be applied are presented. | How is the resolution improved? How do you expect the separation to change? Is it getting better or worse? | Marker 5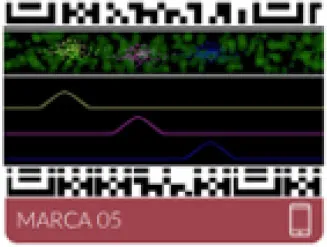 Resolution between co-eluting species is presented. |
| T4 | Apply kinetic theory of chromatography to make predictions. | It explores how the length of the chromatographic column affects the retention times and the dispersion of the analytes throughout the process. | What is the effect of a longer column on the chromatographic figure of merit? What is the effect of the diameter of the stationary phase particles on the chromatographic figures of merit? What is the effect of mobile phase flow on the chromatographic figures of merit? | Marker 6 and 7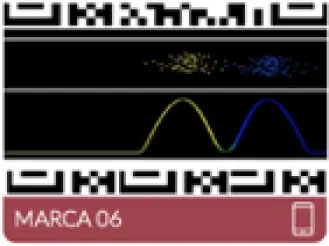  The separation of 2 substances is shown showing dynamically and kinetically the dispersion of the particles. |
Task descriptions.
Additionally, a questionnaire (Instructional Materials Motivation Survey—IMMS) was used to characterize the motivation of the students when using the AR resource (Loorbach et al., 2015). This questionnaire establishes the specific reactions of students who use a technological artifact, through an appreciation scale on 36 items that explore the Attention (A), Relevance (R), Confidence (C), and Satisfaction (S) of students (Keller, 2010). According to the author, this instrument allows students to characterize their perceptions in relation to the contribution of the artifact to maintain their curiosity and persistence in the task (A), its usefulness in achieving the objectives associated with the task in progress (R), the confidence that the use of the resource will facilitate the achievement of the expected learning outcomes (C), and their satisfaction with the performances achieved through the resource (S).
Data collection
Students' written accounts were collected during the two lessons dedicated to chromatographic processes in the analytical chemistry course. The teacher handed a paper copy of the “SPECTO Chromatography” workbook (Figure 1) and asked students to download the “SPECTO Chromatography” App on their devices (available in PlayStore https://play.google.com/store/apps/details?id=cl.PUCV.Cromatografia). Although the resource could have been fully implemented in digital format, we decided to combine the analog format (pen and paper activity) with the digital format (AR). This decision was made out of convenience, since recording students' responses on paper facilitated the incorporation of descriptive, symbolic, and semantic forms of representation, which was key to assessing their visualization capacity (Kozma and Russell, 2005).
Figure 1
Students worked in pairs on the four tasks, with teacher monitoring. Once the sequence was completed, the groups' written responses were collected for analysis. At the end of the activities, the IMMS questionnaire was applied and the students responded individually.
Data analysis
Students' written records and associate drawings were revised and classified using a constant comparison method looking for emerging patterns in student representations (Creswell, 2013). To complete the analysis, we adapted the level of representation through the visualization analysis framework proposed by Kozma and Russell (2005) to characterize undergraduate students' chromatographic representation levels. An initial coding system was developed based on the four categories suggested by these authors. From the application of these categories to the analysis of the students' productions, the descriptors could be refined for the representation of chromatographic processes. The adjusted coding scheme was tested by two different researchers, who coded 100% of the collected data. For the evaluation of the degree of agreement between the experts, the Kappa Index test (concordance index) was used. The K-value for the writings and drawings' classification had an average of 0.88, which can be considered substantial (Taber, 2018).
The coding scheme included the categories of analysis shown in Table 2. The values ranged from 1 to 4, considering Level 1 as the simplest level of representation and Level 4 as the most complex level of representation.
Table 2
| Levels | Description linked to chromatography |
|---|---|
| L1: Representations as a description | The student represents the chromatographic column based solely on its macroscopic physical characteristics at a specific point of the process. |
| L2: Early symbolic skills | The student represents not only the chromatographic column based on its physical characteristics, but also includes elements to account for notions of movement in the column, e.g., analyte transition, flow, color separation or distinct phases, color bands, or elution peaks that represent the molar distribution of substances during the elution process on the solid support of the plate or column. Each color at the macroscopic level represents a substance, and each particle represents an atom or molecule of the substance. |
| L3: Syntactic and formal use of representations | The student represents not only the chromatographic column based on its physical characteristics but also includes elements to account for dynamic chromatographic notions and includes representations that allow making connections with the concepts of elution, kinetics theory such as retention time, chromatographic peak width, elution velocity, mobile phase velocity. It incorporates representations that allow identifying the effect of the mobile phase flow on the dispersion of the analyte particles with the consequent macroscopic effect on the broadening of the chromatographic peak. |
| L4: Semantic and formal use of representations | The student represents in a formally correct way not only the chromatographic column based on its physical characteristics but also includes the elements of the previous level, identifies overlapping parameters of chromatographic peaks of co-eluting species that would be represented in his drawing, showing the separation of 2 species A and B whose signals present different degrees of overlap between them. It includes formal representations of the equivalent theoretical plate theory and the algebraic type of elution kinetics theory to refer to the concept of resolution. |
To illustrate our process of data analysis, we present three examples of its application using written responses to Activity 2 (Table 1).
The analysis of the components that appear both in the image and in the text of Figure 2 shows that students S7 and S13 represent the chromatographic column with its noticeable features at one point of the process, which would correspond to a Representation as a description [Level 1].
Figure 2
The analysis of the components that appear in the image in Figure 3 shows that students S4 and S19, in addition to representing the perceptible characteristics of the column, include arrows indicating the flow of the eluent, representing the elution of substances as a process. Since their representation includes notions of movement, but not other symbolic references to the dynamic of analyte particles nor their dispersion, it corresponds to Early symbolic skills [Level 2].
Figure 3
The analysis of the components that appear in the image and text of Figure 4 shows that students S11 and S21 represent the physical characteristics of the column, the flow of the eluent as arrows, and the particles as scattered points in the column. Given that references appear both to the dynamic of analyte particles and their dispersion, but chemical species are not distinguished nor do algebraic references appear, we consider that the student's responses correspond to the Syntactic and formal use of representations [Level 3].
Figure 4
On the other hand, the answers to the questionnaire were processed by associating each one of the 36 items with one of the four dimensions evaluated (Loorbach et al., 2015). For each dimension (attention, relevance, confidence, and satisfaction), a value was assigned, which corresponded to the average of the appreciations assigned by the student to the corresponding items. Subsequently, the group average value and the standard deviation for each of the dimensions were calculated to visualize the average value and the dispersion of the responses.
Results
In this section, we summarize and discuss the results of our study. First, we address the students' chromatographic representations and then their motivation when using the AR artifact.
Students' chromatographic representations
The analysis of the representations of the students in the sequence of four tasks allowed us to monitor how their levels of chromatographic representation progress when using an immersive AR artifact (Figure 5).
Figure 5
The first task (T1) that students carried out was aimed at identifying the kinetic and thermodynamic components of the chromatographic theories, with questions focused on identifying the causes of the different particle elution rates. The marker associated with this task represented the elution process on the solid support dynamically and macroscopically. During the development of this activity, the representations of all students (100%) were located at the first level of chromatographic representation (Level 1), focusing on the processes that occur in the column. Their responses were descriptive in nature, focusing primarily on the physical characteristics that could be observed at a given point in the chromatographic process (Kozma and Russell, 2005). Even when the students were able to macroscopically represent the separation of the analytes, they failed to recognize that the cause was the different particle elution rate, and therefore, they still cannot identify the kinetic and thermodynamic components of the process.
Since the marker for this task represented the phenomenon at the macroscopic level, it was not expected that students' representations would be located at the microscopic level. However, we did expect references to the dynamic nature of this process. We assume that the low familiarity of the students with the chromatographic phenomenon, as well as with the technological artifact, would explain this less sophisticated initial performance (Hsiao et al., 2012).
The second task (T2) was focused on the kinetic aspects of the process, seeking to recognize the dispersion of the particles and the variables that affect them. The three AR markers presented dynamic chromatograms that allow the concepts of retention time, chromatographic peak width, elution rate, mobile phase rate, and retention time to be introduced, through both macroscopic and microscopic representations. In this activity, we observed a substantive advance in the chromatographic representation levels of the students: 11 responses were at the first level (Level 1: 58%), six responses at the second level (Level 2: 32%), and two responses at the third level of chromatographic representation (Level 3: 10%). Even though most of the answers continued to be located at the lowest level of representation, a significant number of students began to incorporate early symbolic aspects that alluded to the movement of the mobile phase, recognizing the molar distribution of substances during the process of elution.
Even when this task was associated with three AR markers that showed particle dispersion processes in various scales, both at the macroscopic and microscopic levels, more than half of the students continued to build static representations, strongly associated with descriptions of what they could perceive. However, the rest of the students began to incorporate the kinetic aspects of the chromatographic processes, and symbolically represented the behavior of the particles through their dispersion. The greater familiarity with the technological resource, as well as the combination of macroscopic and microscopic representations, allowed those students to acquire early symbolic skills, moving toward more sophisticated ideas, which allowed them to understand the behavior of particles more accurately (Kozma and Russell, 2005). Some of them even managed to reach the syntactic and formal use of representations, which allowed them to reason qualitatively about chromatographic processes to formulate predictions and explanations.
The third task (T3) focused on the calculation of the resolution, and its articulation with the elution time and the bandwidth in a chromatogram. The questions focused on how the resolution of a chromatography could be improved by modifying some process parameters and formulating predictions of how each of these modifications would affect the resolution. The AR marker associated with this task helped to visualize the chromatographic resolution through the overlap of the chromatographic peaks of co-eluting species, showing the separation of two species whose signals presented different degrees of overlap. In this activity, the level of chromatographic representation was slightly improved in the group of undergraduate students: nine responses were in the first level (Level 1: 47%), eight responses were in the second level (Level 2: 42%), and two responses were in the third level of chromatographic representation (Level 3: 10%).
Through this task, the dynamic aspects of chromatography and the understanding of particle behavior were consolidated in those students who had already shown more sophisticated ideas in the previous task. Even though some groups of students who were in the first level managed to progress, most students in this group maintained a low level of sophistication in their answers, still of a descriptive nature and associated with what can be perceived (Kozma and Russell, 2005).
Finally, the fourth task (T4) was focused on applying the kinetic knowledge of chromatography to predict the effect of longer columns on the retention time and the dispersion of particles. The two AR markers associated with this task fostered the visualization of those processes at the macroscopic level, assuming that students would be able to visualize them at a microscopic level on their own at this point. In this activity, we could observe 11 responses at the first level (Level 1: 58%), four responses at the second level (Level 2: 22%), and two responses at the third level (Level 3: 10%) and the fourth level (Level 4: 10%), respectively.
At this point, two opposing tendencies were identified. On the one hand, those students whose answers in the first two tasks were at the lowest level of sophistication, and even those who advanced in the third task, finished the teaching-learning sequence with descriptive representations, without having managed to incorporate dynamic aspects in their representations of chromatographic processes. Looking at their representations, we can assume that these students had not been able to understand the behavior of particles at the molar or microscopic level, and therefore their possibilities of predicting and explaining chromatographic phenomena were very limited (Marson and Torres, 2011). On the other hand, the group of students who were showing progress throughout the sequence continued to advance toward more sophisticated levels of representation, and the highest level of sophistication appeared for the first time. This group of students gradually incorporated forms of syntactic representation of chromatographic processes that allowed them to progressively build qualitative understandings at the molar and microscopic levels (Kozma and Russell, 2005). In a few cases, semantic and algebraic aspects were incorporated that allowed reaching quantitative understandings. In both cases, the chromatographic representation levels would indicate that those students managed to understand the behavior of the particles, which would allow them to build accurate predictions and explanations about the chromatographic processes.
Students' Motivation when using the AR artifact
Regarding the students' appreciation of using the technological resource, based on the questions answered in the IMMS survey, group results are shown in the boxplot in Figure 6.
Figure 6
The results indicate a positive perception of the students regarding the use of the AR artifact in the chromatography learning sequence.
Confidence presented the best average (5,4) and the smallest dispersion. This would indicate that most students had high expectations regarding the potential contribution of the AR artifact to their chromatography learning processes. However, satisfaction (5,3), relevance (5,3), and attention (5,2) had lower values and greater dispersion in the results obtained. This would indicate that there were important differences in the students' perceptions in relation to whether the technological resource helped them to persist in the task, and their satisfaction with the performances achieved through the resource (Keller, 2010). While for a few students the AR artifact hindered sustained work on the task, the artifact had little contribution and relevance in the development of the tasks. For the majority, the artifact contributed by maintaining their curiosity and persistence on the tasks, including being decisive in the learning process (Loorbach et al., 2015).
According to the existing literature, these results could be attributed to differences in the visualization capacity of participating students (Reiner and Gilbert, 2008). For those who were able to attribute meanings to the different forms of representation presented in the AR artifact, it became a scaffolding tool that allowed them to persist in the task and was relevant in moving toward a more sophisticated representation of chromatographic processes and achieving the expected learning outcomes (Kozma and Russell, 2005). However, for those who were unable to attribute these meanings to them, the AR artifact not only did not contribute to improving their visualization capacities but was hardly relevant in the development of the tasks.
Discussion
The central goal of our research was to characterize how the use of AR promoted the visualization capacity of undergraduate chemistry students when they interpreted chromatographic processes. Our study participants were asked to formulate explanations of chromatographic processes with the scaffolding of AR markers, embedded in a four-task teaching and learning sequence. Our analysis revealed a wide range of levels of representation, ranging from descriptive to semantic. These modes of representation correspond to different conceptualizations, progressively more sophisticated, of the behavior of the analyte particles when they elude through the stationary phase of a chromatographic column. They were characterized by paying attention to both the texts and drawings invoked by the participants. Our analytical framework, adapted from Kozma and Russell (2005), proved to be a productive tool to characterize the level of chromatographic representation and how these representations progress with instruction.
All students represented the chromatographic processes in a descriptive manner with a low level of sophistication at the beginning of the teaching and learning sequence. Despite having introduced an AR artifact that allowed them to visualize the kinetic aspects of these processes, the students were not able to incorporate syntactic and semantic ways to represent the particle behavior both on an individual and molar-level scale (Skoog et al., 2017). The prevalence of this type of descriptive view of complex chemical processes, such as chromatography, has been highlighted by several authors in previous studies (e.g., Starkey, 1986; Gilbert, 2008; Marson and Torres, 2011; Abdinejad et al., 2021). Our results show that, although dynamic artifacts may favor the development of visualization skills in some students (Kozma and Russell, 2005), others were unable to go beyond their intuitive visions of chromatographic processes.
Some students were able to benefit from embedding AR markers in the teaching and learning sequence. Their chromatographic representation levels progressed, revealing the construction of increasingly sophisticated ideas (Kozma and Russell, 2005). This would respond to the development of their visualization capacity: by interacting with each of the AR markers and recognizing the components of the represented models, chemistry undergraduate students were able to progressively adjust their mental representations of the chromatographic processes using the AR markers as supporting evidence (Reiner and Gilbert, 2008; Abdinejad et al., 2021). For these students, iterations between the physical representations of the particles' behavior and their representations of this process were fruitful. The development of the visualization capacity of these students represents an important advance in their ability to represent matter at various scales, which opens new possibilities for them to use their chemical knowledge to understand the phenomena around them (Stowe et al., 2019). However, more opportunities are still required for them to reach the highest levels of performance described in the literature.
However, limitations in the contribution of the technological resource become evident in our study. There was a significant number of students for whom the AR artifact was not relevant nor effective in scaffolding their learning (Kozma and Russell, 2005). The limited visualization capacity of these students prevented them from attributing meaning to the AR markers (Gilbert, 2008; Reiner and Gilbert, 2008). Without the possibility of evaluating their models by contrasting them with the model represented in the AR artifact, these students' representations did not progress beyond what they could perceive. At the end of the teaching and learning sequence, these students continued to have difficulties in representing chemical processes at different scales, which limited their possibilities to apply their knowledge to interpret real-world experiences (Talanquer, 2011; Abdinejad et al., 2021).
Implications
Our study elicited the wide range of chromatographic representation levels that can be found among a group of chemistry undergraduate students in a single class, when using an AR artifact to scaffold the comprehension of the particles' behavior, and how they evolve with instruction. This diversity highlights the challenges teachers face to advance students' construction of representations of real-world phenomena to construct descriptions, predictions, or explanations that involve non-perceivable entities (Gilbert, 2008).
Helping all students develop their capacity to visualize the behavior of atoms and molecules in chemical processes is likely to require refined teaching and learning sequences. We recognize the need for different tasks, AR markers, and teacher mediation to trigger other levels of representation and learning progressions, to move forward on the characterization of how AR artifacts facilitate chemistry undergraduate students' visualization capacity development.
We believe that the analysis framework introduced in this article can be of great use to teachers and researchers interested in characterizing chromatographic learning, especially using technological artifacts. The proposed approach focuses attention on the identification of the forms of representation invoked by undergraduate students and how they evolve with instruction. The characterization of this form of representation allows us to anticipate the accuracy of undergraduate students' understanding of the behavior of particles.
Teachers should recognize and take advantage of the potential of AR artifacts to advance students' levels of representation. This demands the creation of multiple opportunities for students to engage in predictions and explanations of complex chemical processes, scaffold their thinking with visual resources, share ideas, and receive explicit guidance and feedback on how to build semantic representations.
We expect to continue exploring the contributions of AR artifacts in teaching and learning processes in chemistry, seeking to contribute to characterizing the pedagogical aspects of chemistry learning in higher education.
Funding
This work has received funding from the National Agency for Research and Development (ANID) through FONDECYT Programs 1190843 and 1211092. Government of Chile.
Publisher's note
All claims expressed in this article are solely those of the authors and do not necessarily represent those of their affiliated organizations, or those of the publisher, the editors and the reviewers. Any product that may be evaluated in this article, or claim that may be made by its manufacturer, is not guaranteed or endorsed by the publisher.
Statements
Data availability statement
The original contributions presented in the study are included in the article/supplementary material, further inquiries can be directed to the corresponding author/s.
Ethics statement
The studies involving human participants were reviewed and approved by the Committee of Bioethics at the Pontificia Universidad Católica de Valparaíso. The patients/participants provided their written informed consent to participate in this study.
Author contributions
CM, AM, and BM drafted the manuscript. SP designed and programmed the Android Application Package with augmented reality. WQ performed the implementation in the classroom. FL and XC contributed to data analysis. All authors contributed to the design of the teaching-learning sequence, edited, and wrote the final version.
Acknowledgments
The authors would like to thank all the students that were so generous with their honest input.
Conflict of interest
The authors declare that the research was conducted in the absence of any commercial or financial relationships that could be construed as a potential conflic of interest.
References
1
AbdinejadM.TalaieB.QorbaniH. S.DaliliS. (2021). Student perceptions using augmented reality and 3d visualization technologies in chemistry education. J. Sci. Educ. Technol.30, 87–96. 10.1007/s10956-020-09880-2
2
AkçayirM.AkçayirG. (2017). Advantages and challenges associated with augmented reality for education: A systematic review of the literature. Educ. Res. Rev. 20, 1–11. 10.1016/j.edurev.2016.11.002
3
AriciF.YildirimP.CaliklarS.YilmazR. M. (2019). Research trends in the use of augmented reality in science education: Content and bibliometric mapping analysis. Comput. Educ.142, 103647. 10.1016/j.compedu.2019.103647
4
AzumaR.BaillotY.BehringerR.FeinerS.JulierS.MacIntyreB. (2001). Recent advances in augmented reality. IEEE Comput. Graph. Applic.21, 34–47. 10.1109/38.963459
5
BaxterP.JackS. (2008). Qualitative case study methodology: Study design and implementation for novice researchers. Qual. Rep.13, 544–559. 10.46743/2160-3715/2008.1573
6
BegoA.AlvezM.GiordanM. (2019). The planning of chemistry teaching sequences based on the Topological Model of Teaching: potentialities of the EAR (Elaboration, Application and Re-elaboration) process on pre-service teacher education. Ciênc. Educ. Bauru. 25, 625–645. 10.1590/1516-731320190030016
7
CreswellJ. W. (2013). Qualitative Inquiry & Research Design: Choosing Among Five Approaches. Thousand Oaks, CA: SAGE.
8
CurtrightR.EmryR.MarkwellJ. (1999). Student Understanding of Chromatography: A Hands-On Approach. J. Chem. Educ. 76, 249. 10.1021/ed076p249
9
FabriD.FalsettiC.LezziA.RamazzottiS.ViolaS.LeoT. (2008). “Reality virtual and augmented,” in: Handbook on Information Technologies for Education and Training, eds A. Adelsberger, J. Kinshuk, J. Pawlowski, and D. Sampson (Berlin: Springer). 10.1007/978-3-540-74155-8_7
10
GarzónJ.KinshukB. SGutiérrezJ.PavónJ. (2020). How do pedagogical approaches affect the impact of augmented reality on education? A meta-analysis and research synthesis. Educ. Res. Rev. 31, 100334. 10.1016/j.edurev.2020.100334
11
GarzónJ.PavónJ.BaldirisS. (2019). Systematic review and meta-analysis of augmented reality in educational settings. Virtual Real. 23, 447–459. 10.1007/s10055-019-00379-9
12
GilbertJ. (ed.). (2008). “Visualization: An emergent field of practice and enquiry in science education,” in: Visualization: Theory and Practice in Science Education, (London: Springer). 10.1007/978-1-4020-5267-5_1
13
GonzálezA. A.LizanaP. A.PinoS.MillerB. G.MerinoC. (2020). Augmented reality-based learning for the comprehension of cardiac physiology in undergraduate biomedical students. Adv. Phys. Educ.44, 314–322. 10.1152/advan.00137.2019
14
HsiaoK. F.ChenN. S.HuangS. Y. (2012). Learning while exercising for science education in augmented reality among adolescents. Interact. Learn. Environ. 20, 331–349. 10.1080/10494820.2010.486682
15
Ibarra-RiveraT.Delgado-MontemayorC.Oviedo-GarzaF.Pérez-MeseguerJ.Rivas-GalindoV.Waksman-MinskyN.et al. (2020). Setting up an educational column chromatography experiment from home. J. Chem. Educ. 97, 3055–3059. 10.1021/acs.jchemed.0c00532
16
KellerJ. M. (2010). Motivational Design for Learning and Performance. Boston, MA: Springer10.1007/978-1-4419-1250-3
17
KozmaR.RussellJ. (2005). “Students becoming chemists: developing representationl competence.” In: Visualization in Science Education, ed J. K. Gilbert (Dordrecht: Springer). 10.1007/1-4020-3613-2_8
18
LoorbachN.PetersO.KarremanJ.SteehouderM. (2015). Validation of the Instructional Materials Motivation Survey (IMMS) in a self-directed instructional setting aimed at working with technology. Br. J. Educ. Technol. 46, 204–218. 10.1111/bjet.12138
19
MarsonG. A.TorresB. B. (2011). Fostering multirepresentational levels of chemical concepts: A framework to develop educational software. J. Chem. Educ. 88, 1616–1622. 10.1021/ed100819u
20
MéheutM.PsillosD. (2004). Teaching–learning sequences: aims and tools for science education research. Int. J. Sci. Educ.26, 515–535. 10.1080/09500690310001614762
21
Mora-GuevaraJ.Marroquín-SeguraR.Sánchez-GonzálezE.Hernández-AbadV.Espinosa-ContrerasC. (2010). Meaningful learning of the high performance liquid chromatography technique by QFB students from FES Zaragoza. Rev. Mex. Cien. Farma.41, 50–56. Available online at: https://www.redalyc.org/pdf/579/57916060007.pdf (accessed September 24, 2022).
22
MunnZ.PetersM. D. J.SternC.TufanaruC.McArthurA.AromatarisE. (2018). Systematic review or scoping review? Guidance for authors when choosing between a systematic or scoping review approach. BMC Medic. Res. Meth. 18, 1–7. 10.1186/s12874-018-0611-x
23
PapagiannakisG.SinghG.Magnenat-ThalmannN. (2008). A survey of mobile and wireless technologies for augmented reality systems. Comput. Anim. Virt. World19, 3–22. 10.1002/cav.221
24
PedasteM.MittG.JüriveteT. (2020). What is the effect of using mobile augmented reality in k12 inquiry-based learning?Educ. Sci. 10, 94. 10.3390/educsci10040094
25
QuirozW.OlivaresC.MerinoC.BravoM. (2013). The urgent need for figures of merit in order to evaluate the performance of teaching and learning methodologies: Constructive criticism from a scientific metrological discipline. Qual. Quan.47, 367–381. 10.1007/s11135-011-9523-0
26
ReinerM.GilbertJ. (2008). “When an image turns into knowledge: The role of visualization in thought experimentation,” in Visualization: Theory and Practice in Science Education (Dordrecht: Springer). 10.1007/978-1-4020-5267-5_13
27
RussellJ.KozmaR. (2005). “Assessing learning from the use of multimedia chemical visualization software,” in: Visualization in Science Education (Dordrecht: Springer). 10.1007/1-4020-3613-2_15
28
SaritaşD.ÖzcanH.Adúriz-BravoA. (2021). Observation and inference in chemistry teaching: a model-based approach to the integration of the macro and submicro levels. Sci. Educ. 30, 1289–1314. 10.1007/s11191-021-00216-z
29
ScottR. M. (1971). The use of the computer in teaching the theory of chromatography. J. Chromatography A60, 313–318. 10.1016/S0021-9673(00)95568-7
30
ScottR. P. (2020). Techniques and Practice of Chromatography. CRC Press. 10.1201/9780367811914
31
SkoogD.HollerJ.CrouchS. (2017). Principles of Instrumental Analysis. Cengage Learning.
32
StarkeyR. (1986). Common chromatography misconception. J. Chem. Educ. 63, 514. 10.1021/ed063p514.2
33
StoneD. C. (2007). Teaching chromatography using virtual laboratory exercises. J. Chem. Educ. 84, 1488. 10.1021/ed084p1488
34
StoweR. L.HerringtonD. G.McKayR. L.CooperM. M. (2019). Adapting a core-idea centered undergraduate general chemistry curriculum for use in high school. J. Chem. Educ. 96, 1318–1326. 10.1021/acs.jchemed.9b00071
35
TaberK. S. (2018). The use of Cronbach's alpha when developing and reporting research instruments in science education. Res. Sci. Educ. 48, 1273–1296. 10.1007/s11165-016-9602-2
36
TalanquerV. (2011). Macro, submicro, and symbolic: The many faces of the chemistry “triplet”. Int. J. Sci. Educ.33, 179–195. 10.1080/09500690903386435
37
TaudaO. R. D.ValenciaA. P.PobleteM. R.MéndezJ. U. (2019). Teaching of basic concepts of high-performance liquid chromatography (HPLC) with a project-based learning (PBL) approach: determination of acrolein in cigarette smoke. Educación química. 30, 15–23. 10.22201/fq.18708404e.2019.3.69368
38
XieM.InguvaP.ChenW.PrasetyaN.MaceyA.DiMaggioP.et al. (2020). Accelerating students' learning of chromatography with an experiential module on process development and scaleup. J. Chem. Educ. 97, 1001–1007. 10.1021/acs.jchemed.9b01076
39
YinR. K. (ed.). (2003). “Designing case studies,” in: Case Study Research: Design and Methods (Thousand Oaks, CA: Sage).
Summary
Keywords
representation, chemistry, teaching-learning sequence, chromatography, immersive technologies
Citation
Merino C, Marzábal A, Quiroz W, Pino S, López-Cortés F, Carrasco X and Miller BG (2022) Use of augmented reality in chromatography learning: How is this dynamic visual artifact fostering the visualization capacities of chemistry undergraduate students?. Front. Educ. 7:932713. doi: 10.3389/feduc.2022.932713
Received
30 April 2022
Accepted
08 September 2022
Published
28 October 2022
Volume
7 - 2022
Edited by
Johannes Pernaa, University of Helsinki, Finland
Reviewed by
Antti Karttunen, Aalto University, Finland; Lizethly Cáceres Jensen, Universidad Metropolitana de Ciencias de la Educación, Chile
Updates
Copyright
© 2022 Merino, Marzábal, Quiroz, Pino, López-Cortés, Carrasco and Miller.
This is an open-access article distributed under the terms of the Creative Commons Attribution License (CC BY). The use, distribution or reproduction in other forums is permitted, provided the original author(s) and the copyright owner(s) are credited and that the original publication in this journal is cited, in accordance with accepted academic practice. No use, distribution or reproduction is permitted which does not comply with these terms.
*Correspondence: Cristian Merino cristian.merino@pucv.cl
This article was submitted to STEM Education, a section of the journal Frontiers in Education
Disclaimer
All claims expressed in this article are solely those of the authors and do not necessarily represent those of their affiliated organizations, or those of the publisher, the editors and the reviewers. Any product that may be evaluated in this article or claim that may be made by its manufacturer is not guaranteed or endorsed by the publisher.