 Inga Laukaityte
 Ewa Rolfsman1
 Marie Wiberg
- 1Department of Applied Educational Science, Umeå University, Umeå, Sweden
- 2Department of Statistics, USBE, Umeå University, Umeå, Sweden
This paper explores the measurement capabilities of the Trends in International Mathematics and Science Study (TIMSS) and the Program for International Student Assessment (PISA) in assessing school factors that influence student performance. We specifically focus on the 2015 assessments of the science performance of eighth graders in Sweden and Norway. This was the latest year when the two assessments were conducted in the same year and science was the major subject area in the PISA assessment, which was essential for maximizing the assessments’ comparability. Using multilevel models, the study identifies common and unique factors across the assessments and investigates the factors that influence student performance at different proficiency levels. The findings highlight the importance of school-level factors, which are significant in both assessments. Moreover, both assessments provide information on overlapping sets of factors that have varying influence on the performance of students with different proficiency levels. Overall, there are limited common factors between TIMSS and PISA. School factors vary between low-performing and high-performing schools, with differing significance in Norway and Sweden. The results indicate that TIMSS and PISA assessments offer complementary information, particularly for low-performing schools. Our findings suggest that different school types may benefit or suffer from distinct school factors. The findings are relevant for both educational professionals and policy-makers.
1 Introduction
Trends in International Mathematics and Science Study (TIMSS) and Program for International Student Assessment (PISA) are large-scale series of assessments of the performance of students in more than 60 countries, including the Nordic countries. The two programs have some similarities but differing objectives.
The purpose of TIMSS is to compare and describe students’ knowledge in mathematics and science (see, e.g., Mullis and Martin, 2013) and TIMSS emphasize the link between student achievement and curricula. In contrast, the purpose of PISA is to examine the extent to which students are prepared to succeed in society by examining the effects of education in reading, mathematics and science (see, e.g., OECD, 2017b). In addition, while TIMSS assessments address performance in the same two subjects (mathematics and science) every year, PISA assessments are triennial and focus particularly on one of three subject areas (reading, mathematics, or science). Broad patterns of TIMSS and PISA results have both similarities and differences. Overall, Asian countries outperform western countries in both TIMSS and PISA tests. Norway and Sweden are the only Nordic countries to have participated in both TIMSS and PISA assessments. Both countries have obtained higher average science scores in TIMSS than in PISA assessments. Overall, Sweden’s average TIMSS scores for science have consistently been above the international average (of 500), with a downward trend until 2011, followed by a small upward trend (Mullis et al., 2016, 2020). In contrast, Norway’s average TIMSS science scores, which have been fluctuating up and down, have mostly been slightly below the international average, except in 1995 and 2015 (for grade 9), when they were slightly above the average.
Contrary to TIMSS, both Scandinavian countries have achieved average PISA science achievement scores that were both below (2009–2012 in Sweden, 2006–2012 in Norway) and above (2006, 2015, and 2018 in Sweden; 2015–2018 in Norway) the international PISA average (which varies between administrations). However, there is a notable difference in trends of their scores. Swedish scores first decreased (2006–2009) and then rose (2015–2018), while Norwegian scores have been fluctuating up and down (see, for example, OECD, 2013, 2019; Jensen et al., 2019).
Nevertheless, results of these large-scale assessments arouse the interest of various parties. In particular, the “PISA shock” in 2012 triggered fierce debate about education and education policy in several countries, including Sweden and Norway (Haugsbackk, 2013). Political decisions regarding educational investments are also often underpinned by these assessments, although it is difficult to show a relationship between results of large-scale assessments like PISA and domestic shaping of policies (Rautalin et al., 2019).
An important question is what all these data tell us, as students spend much of their time preparing for and taking tests or answering questionnaires. Not all students participate in large-scale assessments like TIMSS and PISA, but most participate in national assessments of their achievements in various subjects and teacher-based tests. There are also indications that tests have some negative consequences, as there is limited time for learning in school, and tests raise students’ stress levels which is also highlighted in PISA 2015 by focusing on students’ well-being (OECD, 2017a) as well as in research based on PISA 2015 (see, e.g., Gil-Madrona et al., 2019). Thus, it is crucial to ensure that the assessment instruments (subject tests and questionnaires) provide reliable and useful information about the concepts and abilities they are intended to measure in order to promote equitable school development and student success.
Over the years, numerous studies have investigated various aspects of TIMSS and PISA data. However, most have focused solely on either TIMSS or PISA (see, e.g., Teig et al., 2022), including several that have addressed Nordic results (e.g., Nilsen et al., 2018; Oskarsson et al., 2018; Reimer et al., 2018; Lundgren, 2023). Few studies have addressed both TIMSS and PISA results, and analyzed student performance in relation to validity aspects, i.e., what the instruments actually assess. In one, Wu (2010) examined similarities in, and differences between, PISA and TIMSS scores for mathematics in 2003, and stressed the importance of the two programs providing complementary rather than duplicate information. Wu also highlighted the importance of considering the differences in PISA and TIMSS assessment designs, when interpreting the results. While PISA assessments focus on “everyday mathematics,” TIMSS focuses “school mathematics.” In addition, in contrast to TIMSS, PISA put different emphasize on the subjects each year, and therefore it is recommended to take that into consideration when choosing assessment wave in order to make the two assessments more comparable. In another relevant study, Sollerman (2019) considered both TIMSS and PISA in relation to the Swedish national assessments, analyzing the framework and content of the tests in mathematics in both cases. He found that the Swedish context is not sufficiently considered in either TIMSS or PISA assessments to allow Swedish students to show their full potential. He concluded that they provide indication of trends in mathematics knowledge over time, but not more comprehensive information about the Swedish students’ knowledge of mathematics or detailed assessments of students’ performance levels. He also found that TIMSS mathematics assessments do not include items that provide information on abilities at the highest level (A), although TIMSS mathematics knowledge tests are more similar to Swedish counterparts than the PISA tests. The construction of PISA items places higher demands on reading comprehension. Sollerman (2019) concluded that this may not affect the average performance of Swedish students, but it must be considered for students with low reading comprehension, since it could clearly influence their mathematics scores. The latter is of special interest, since PISA results show that performance level is related to subject, e.g., only a small percentage of high-performing students are high-performers in all assessed subjects (OECD, 2016).
An intention of both TIMSS and PISA is not only to assess educational outcomes in different countries by subject tests, but also to collect background information regarding students, teachers, and principals, to provide foundations for interpreting the results. Thus, it is important to assess the utility of the available questionnaire data for promoting school development and student success. To exploit the collected data, there are urgent needs to acquire deeper knowledge of the information that TIMSS and PISA results can provide about student performance and their associations with school factors, and their relations with each other.
Internationally, research focus on identifying school factors that enhance success in their students. The school effectiveness research field has resulted in ambitious publications aiming to guide not just school leadership but also policy (see, e.g., Goldstein and Woodhouse, 2000; Scheerens, 2013; Cremers et al., 2022). Rutter et al. (1979) conducted one of the first studies of school effectiveness, where the leadership is highlighted as an important factor. A basic assumption within this field of research is that a school is successful—or effective—if it “adds value” to the students in terms of different forms of outcomes, regardless of the characteristics of the students within a school.
Similarly to Wu (2010) and Sollerman (2019), here we consider both TIMSS and PISA. However, in contrast to the cited studies we focus on questionnaire data and school-related factors in relation to student success. For this, we draw on explorations of links between student success and school related factors such as schools’ climate, organizational structure, and leadership (see, e.g., Cremers et al., 2022; Nilsen and Teig, 2022).
Since both TIMSS and PISA assessments provide data from numerous countries, it is tempting to include as many countries as possible in comparisons. However, a previous study showed that a number of questions and variables were excluded from the questionnaires, due to varying national adaptations, and concluded that further studies should investigate countries with similar school contexts, such as the Nordic countries (Wiberg and Andersson, 2010). Education models of the Nordic countries are similar, and those of Norway and Sweden are viewed as the most similar for comprehensive school (Helgøy and Homme, 2006; Imsen et al., 2017). In addition, Sweden and Norway are the only Nordic countries that have participated in nearly all of the assessment waves of both programs. Both countries participated in every PISA assessment wave since the beginning in 2000. However, Sweden did not participate at all in the TIMSS assessment wave in 1999, and only with eighth graders in 2003. Norway did not participate at all in 1999. Note, since 2015 Norway has assessed students in the fifth and ninth years of schooling, so students of similar age should be compared in the Nordic countries. In line with the recommendation by Wu (2010), the present study is based on an assessment wave where the two programs put the same emphasize on a subject, in order to make the results more comparable.
1.1 Aim
The aim of this paper is to empirically examine TIMSS and PISA assessments, particularly the information they can provide regarding school factors that influence students’ performance in Sweden and Norway. The paper focuses on TIMSS and PISA science results for 8th grade students in 2015, the latest year when they both assessed students’ performance and science was the major PISA subject area.
The study specifically addresses the following research questions.
RQ1: What school factors are measured by both TIMSS and PISA, only TIMSS, and only PISA?
RQ2: What school factors appear to be associated with student success in TIMSS and PISA?
RQ3: Are there school factors that are of particular relevance in relation to different school types with reference to performance levels?
2 Methodology
2.1 Data
The TIMSS 2015 science test results for grade 8 students in Sweden, grade 9 students in Norway, and the PISA 2015 science test results for 15-year-old were used, as science was the major subject area of the PISA 2015 assessment, and these are the only Nordic countries that participated in both assessments. TIMSS and PISA assessments provide not only performance data but also data collected through questionnaires. TIMSS 2015 had student, home (parent), teacher, school (principles), and curriculum questionnaires. PISA 2015 had student and school questionnaires. There were also some optional questionnaires, such as parent and teacher questionnaires, but neither Sweden nor Norway participated in them. We used just student and school questionnaires in our study, as only these were present in both assessments. The data also included responses to both the school and student questionnaires of the two assessments, particularly the school questionnaires.
Table 1 presents the numbers of students and schools sampled in each studied country and assessment, as well as students’ average science scores. More schools were included in the PISA sample than the TIMSS sample. The average TIMSS scores were better than the average PISA scores for students in both countries. However, Norway obtained a higher average score for science performance on PISA compared to Sweden. Sweden, on the other hand, obtained a higher average score for science on TIMSS compared to Norway.
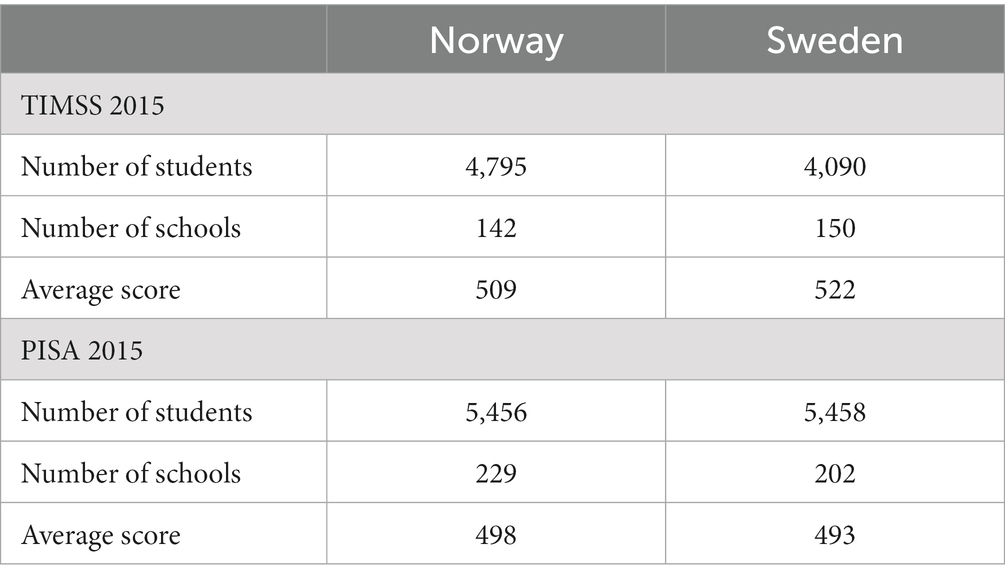
Table 1. Numbers of students and schools, and average science achievement in Norway and Sweden in TIMSS and PISA 2015.
2.2 Student and school-related factors
Following a comprehensive review of both student and school questionnaires, student-level home background factors and school-level factors were derived from the complete set of variables available in TIMSS and PISA 2015. Subsequently, these factors were classified into common and unique factors.
2.3 Statistical analysis
A multistage sampling procedure is applied in both TIMSS and PISA assessments, thus multilevel analysis was applied, as described for example by Gelman and Hill (2006) and Snijders and Bosker (2012). Multilevel models, implemented in Mplus 8.9 (Muthén and Muthén, 1998–2017), with student background factors at student-level and school-related factors at school-level were used to identify factors associated with the students’ performance in each considered country. IEA IDB Analyzer V5 (IEA, 2022) and SPSS 26 (IBM Corp, 2019) were used for descriptive statistical analysis.
The multilevel analysis consisted of two parts. First, general models were applied to analyze effects of considered factors in both Norway and Sweden and both assessments. In the second part, schools were divided into low-and high-performing and separate multilevel models were analyzed for each performance level. Division criteria were chosen to be as close to the international TIMSS and PISA scales as possible (see Table 2). The definition of low-performance is equivalent to the one used by TIMSS 2015 (Mullis et al., 2016). The definition of high-performance was slightly modified, as we wanted to ensure that at least 20 schools of each performance-level in both countries were included. This restriction is needed for more accurate multilevel analyses.
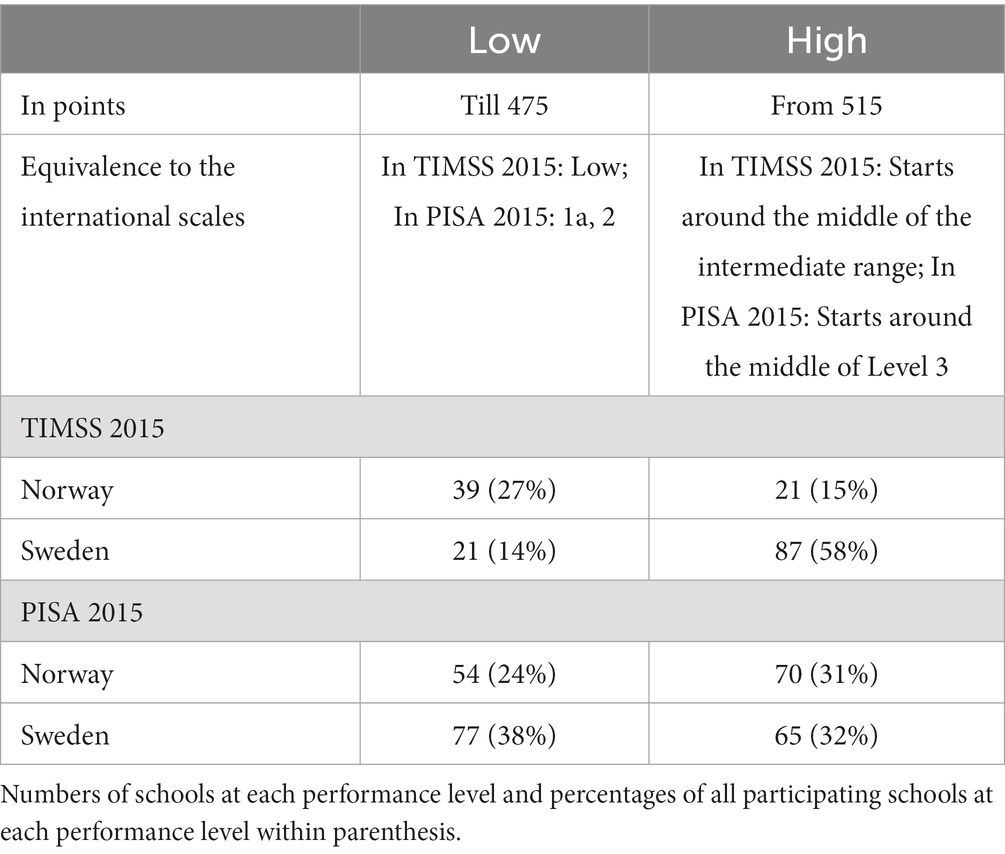
Table 2. Division of school performance.
As well as the school-level factors, derived from the school questionnaire, we also utilized aggregated student-level factors, denoted , as contextual school-level factors.
For each studied country and assessment, we analyzed performance using pairs of two-level models (denoted Model 1 and 2), with the five and 10 plausible values for science performance provided by the TIMSS 2015 and PISA 2015, respectively.
In Model 1, the associations between school-level factors and students’ mathematics performance were evaluated while controlling for students’ home background factors. At the student level (also referred to as level 1), students’ home background factors ( ) weighted with student weights, and at the school-level (also referred to as level 2), school-related factors ( ) weighted with school weights were included:
Student-level (within schools):
School-level (between schools):
Model 2 differs from Model 1 by including aggregated student-level factors ( ), as contextual school-level factors at the school level:
Student-level (within schools):
School-level (between schools):
As our response variables were sets of five (TIMSS) or 10 (PISA) plausible values, every analysis was done separately for each plausible value and then combined using Rubin’s (1987) method implemented in Mplus.
The Bayesian information criterion (BIC: Schwarz, 1978) was used to decide which models to use. BIC allows comparison of competing models, regardless of whether they are nested, as long as the sample remains constant (McCoach and Black, 2008).
Missing data frequencies for all included student-level factors were low, less than 4%. Thus, listwise deletion was used for handling missing student-level data (Tabachnik and Fidell, 2007). At the school level, listwise deletion could not be applied because this would have also impacted the student-level data. We assumed that missing student-level data were missing at random (MAR), implying that a student’s probabilities of response were related solely to his or her own set of observed items (Schafer and Graham, 2002). Thus, following Schafer and Graham (2002) recommendations we used the FIML (full-information maximum likelihood) procedure for handling missing data at the school level.
3 Results
3.1 Student-level and school-level factors
Student-level home background factors and school-level factors were constructed from variables for which were available in both TIMSS 2015 and PISA 2015. It was not easy to find common questions as the TIMSS school questionnaire is devoted more to attitudes among the interested parties in education, i.e., teachers, parents, and students and leadership experience and characteristics, while the PISA school questionnaire focuses on school policies, resources, and student characteristics. However, a review of the questionnaires showed that some of the questions related to student home background and school resources were almost identical while others differed in formulation or possible responses. In total, we constructed eight common school-level factors related to school location, resources and discipline of students and teachers.
At student level, we conditioned on variables of proven significance for the students’ achievement in previous studies (e.g., Haahr et al., 2005; Wiberg et al., 2013; Wiberg and Rolfsman, 2023). The variables and constructed factors were defined as follows:
[H1] Books at home: Students’ responses to a question about the number of books at their homes: 1 = 0–10 books, 2 = 11–25 books, 3 = 26–100 books, 4 = 101–200 books, and 5 = more than 200 books.
[H2] Home resources: Students’ responses to questions about their home possessions such as study desk, own room, quiet place to study, computer or tablet, and internet link. In each case, the possible responses were 0 = No, and 1 = Yes, and the sum of the responses was used as a final result.
[H3] Native parents: Students’ responses to questions about their parents’ country of birth, classified as 1 if the student had at least one native parent and 0 otherwise.
[H4] Occurrence of boys: Recoded as 0 for female and 1 for male.
The factors Books at home and Home resources constitute a measure of students’ home background. We also considered including another factor—Education of parents. However, around 5% of the responses to questions about parents’ education of parents in Sweden and Norway were missing in the TIMSS 2015 data, and around 40% of the answers were “I do not know.” Thus, we decided not to use this factor in our analyses.
Characteristics (means or percentages, and standard errors in parentheses) of the student-level variables and factors are presented in Table 3. The results obtained from both the TIMMS and PISA are quite similar for both countries.
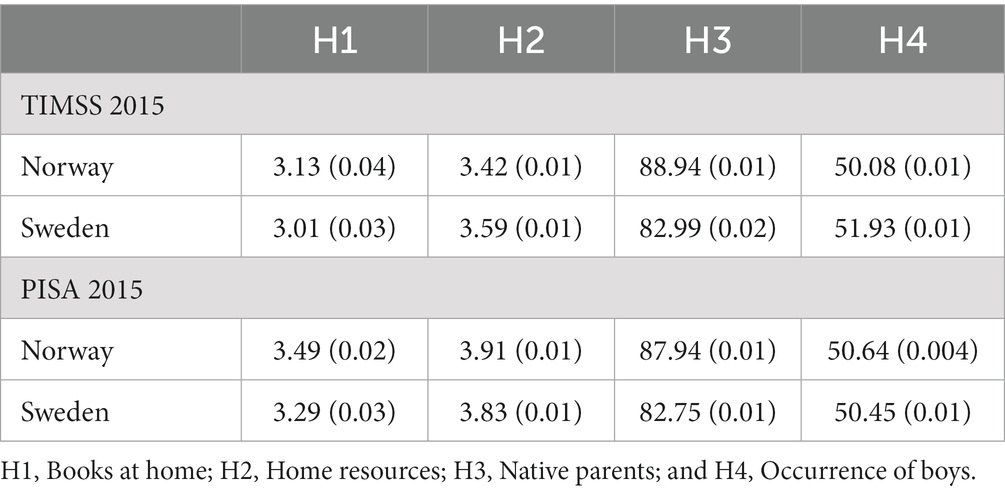
Table 3. Student-level factors H1 and H2 with their means and standard errors and the proportions of student-level factor H3 (% of at least one native parent) and variable H4 (% of males).
At school level, all variables present in the school questionnaires were examined except for the questions with many missing responses, e.g., questions about the qualifications of teachers in PISA 2015 or school location, and percentage of students whose heritage language was different from the test language in Sweden (PISA 2015), that were removed from the analysis. Altogether, 37 school level factors were analyzed. Besides eight common factors mentioned earlier, there were 10 factors that were present only in TIMSS 2015. These factors were related to instructional time, attitudes among students, parents, and teachers, as well as experience, and leadership of principals. The remaining 19 factors were present only in PISA 2015 and were related to leadership, responsibilities, type of school, professional development of staff, monitoring of teachers, accountability and achievement, special needs of students, and finally parental involvement and participation.
In the following text, we describe factors that proved to be significant according to at least one of the constructed models, starting with the common factors (covered by both assessments), then the unique factors (covered only by TIMSS or only by PISA).
3.1.1 Common factors
[S1] Discipline of students: covered by three items asking principals to what extent the learning of students is hindered by various kinds of negative behavior, such as absenteeism, intimidation or lack of respect for teachers, and intimidation or bullying of other students. The sum of all responses was used as a final result. The larger the sum—the bigger problems with discipline of students. Cronbach’s alpha for this factor was around 0.7.
[S2] School location: Number of people living in the area where the school is located. Recoded as: 0 = Rural areas, 0–15,000 people; 1 = Urban areas, and more than 15,000 people.
[S3] School resources A, shortage of competence/staff: covered by items asking principals how much their school’s capacity to provide instruction is affected by a shortage or inadequacy of teachers with a specialization in science (in TIMSS) and whether the school’s capacity to provide instruction is hindered by a lack of teaching/assisting staff (in PISA). Possible responses varied from 1 (Not at all) to 4 (A lot).
[S4] School resources B, offering help with homework: covered by items asking principals whether their schools provide assisting staff to help with students’ homework. The responses were recoded as 0 = No, and 1 = Yes.
[S5] School resources C, lack of supplies and infrastructure: covered by items asking principals to what extent their school’s capacity to provide instruction is hindered by a shortage or a lack of resources, such as instructional materials, supplies, school buildings, grounds, or heating/cooling systems. As these included four and two items in the TIMSS and PISA questionnaires, respectively, to compare results of the two assessments the summed responses were classified into three categories: 1 = Low, 2 = Medium, and 3 = High. Cronbach’s alpha for this factor was around 0.7.
[S6] Teachers’ absenteeism: covered by items asking principals about teachers’ absenteeism. Possible responses ranged from 1 to 4, with 4 denoting a serious problem.
3.1.2 Unique factors only covered by TIMSS 2015
[S7] Days per year: (that schools were open for instruction), covered by a question for principals.
[S8] Experience of principal: covered by a question asking principals how many years they had been a principal at their present school. The responses were given in number of years.
[S9] Parents’ attitudes and activities: covered by five items asking principals about the positivity of parents’ attitudes and activities within their schools, with possible responses ranging from 1 (very low) to 5 (very high). The scale was reverse-recoded and the sum of all responses was used as a final result. Cronbach’s alpha for this factor was around 0.9.
[S10] Students’ attitudes and activities: covered by three items asking principals about the positivity of students’ attitudes and activities within the school, with possible responses ranging from 1 (very low) to 5 (very high). The scale was reverse-recoded and the sum of all responses was used as a final result. Cronbach’s alpha for this factor was around 0.7.
3.1.3 Unique factors only covered by PISA 2015
[S11] Evaluation: covered by a question asking principals whether achievement data were tracked over time by an administrative authority, with possible responses recoded as 0 = No, and 1 = Yes.
[S12] Leading/promotion: covered by 13 items asking principals to indicate the frequency of various activities and behaviors conducted to enhance students’ success in their schools during the last academic year. Possible responses ranged from 1 (did not occur) to 6 (More than once a week). The sum of all responses was used as a final result. Cronbach’s alpha for this factor was around 0.9.
[S13] School-to-home communication on academic progress: covered by a question asking principals whether their school designs effective forms of school-to-home and home-to-school communications about school programs and children’s progress. The responses were recoded as 0 = No, and 1 = Yes.
[S14] School-to-home information & guidance: covered by questions asking principals whether their schools provide information and ideas for families to help students at home with homework and other curriculum-related activities, decisions, and planning. The responses were recoded as 0 = No, and 1 = Yes.
[S15] Special students—language: Principals were asked to estimate the percentage of students whose heritage language differed from the test language. The responses were given in percentages.
Means and standard errors for the school-level factors for Norway and Sweden are given in Table 4. Most of the factors have quite similar descriptive characteristics in both studied countries, if compared assessment-wise. However, some characteristics, like for School resources B, can differ much between the countries and even assessments. According to the principals’ responses, schools in Sweden provide more assistance with homework. Around 90% of participating schools provide staff to assist students with homework in Sweden, according to both TIMSS and PISA, compared to 59 or 40% of schools in Norway, according to TIMSS and PISA, respectively. The TIMSS data also clearly indicate that Sweden provides more instructional time per year than Norway. The largest difference between the two countries in the PISA data was in principals’ responses to the question asking whether their school designs effective forms of school-to-home and home-to-school communications about school programs and children’s progress. In Norway, about 98% answered yes, but only around 88% in Sweden.
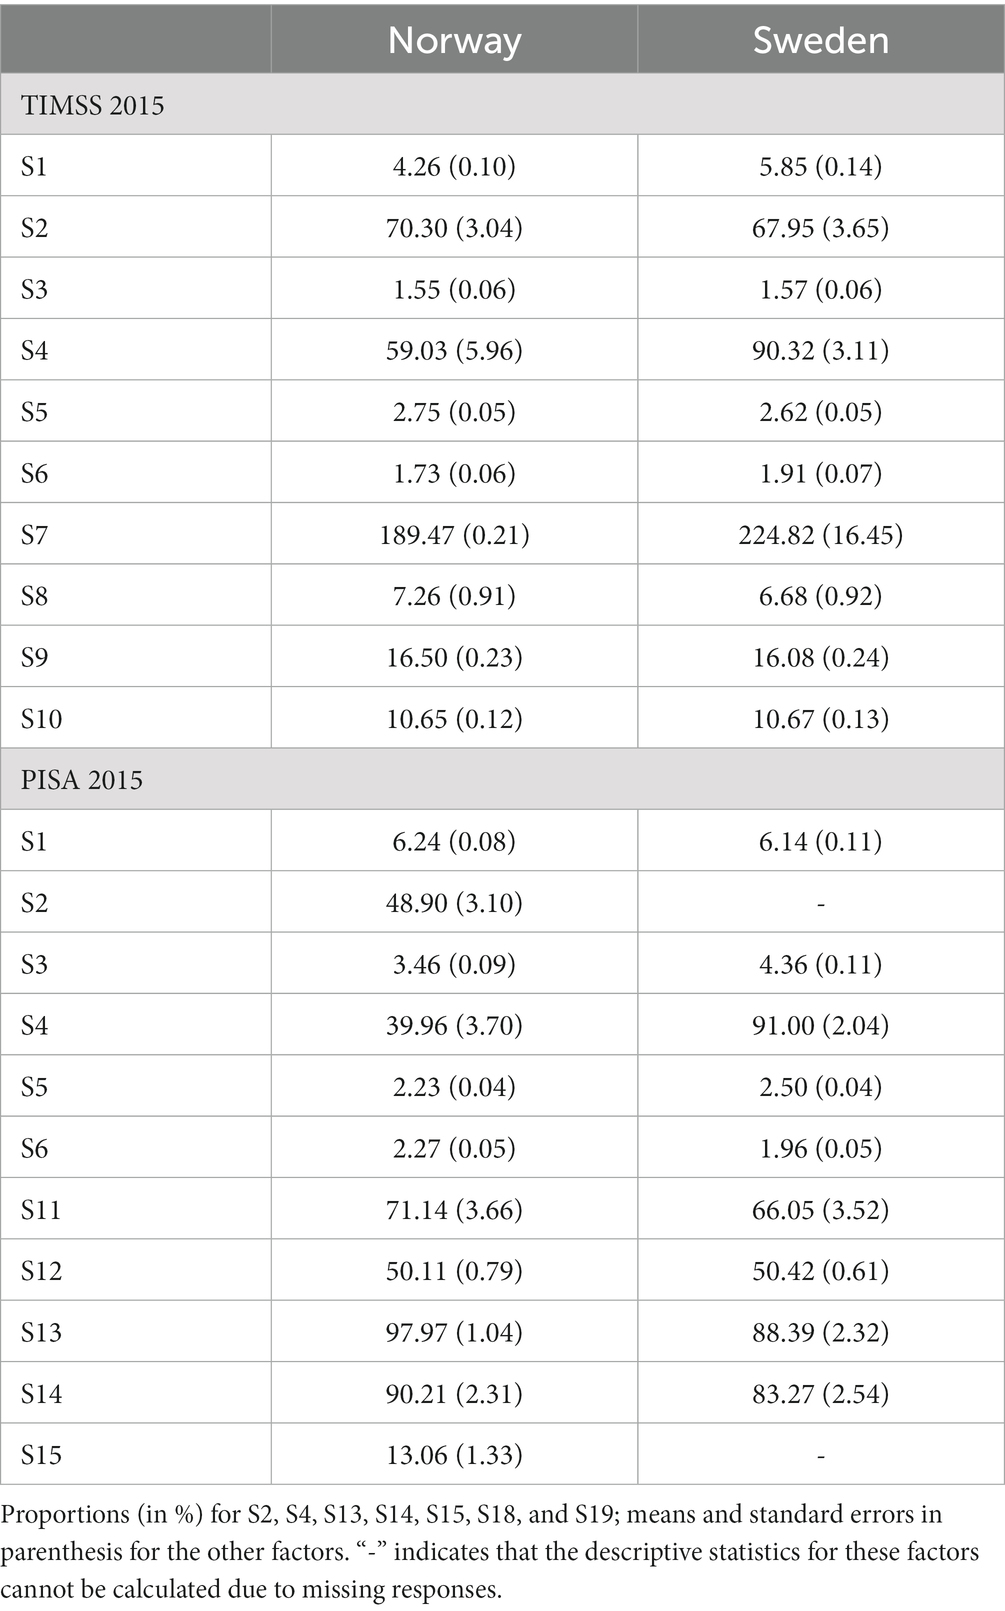
Table 4. Descriptive statistics for the school-level factors.
3.2 Multilevel analyses
This sub-section reports results of the analyses with the two types of multilevel models, designated M1 (incorporating student-and school-level factors, excluding aggregated student-level factors) and M2 (expanded versions of M1 models, including aggregated student-level factors). For more detailed descriptions, see the Methodology section.
The school level factors are initially discussed in three parts focusing on: Aggregated student-level factors, calculated as averages of each student-level factor for every individual school; Common factors covered by TIMSS and PISA, and Unique factors (covered only by PISA or only by TIMSS). In the next section, effects of the school-level factors are also analyzed by proficiency level (as summarized in Tables 5, 6). The actual estimates of the models are presented in detail in Appendix Tables A1–A4.
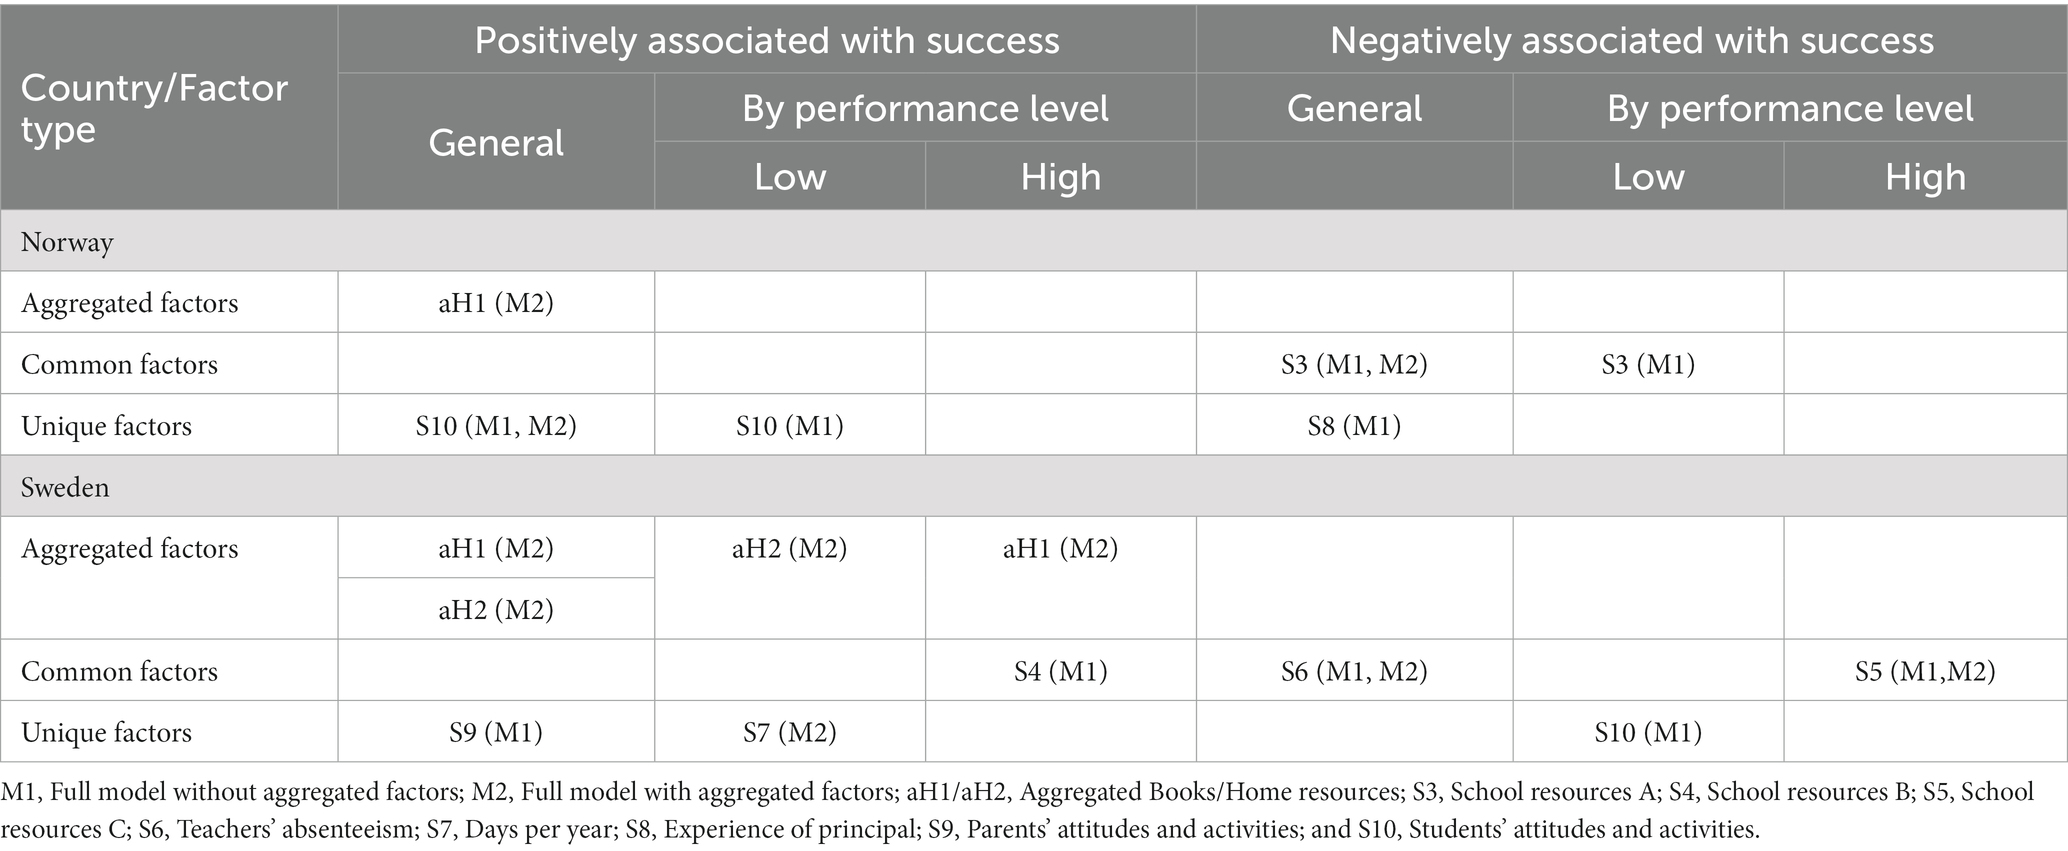
Table 5. School variables associated with students’ performance in TIMSS 2015.
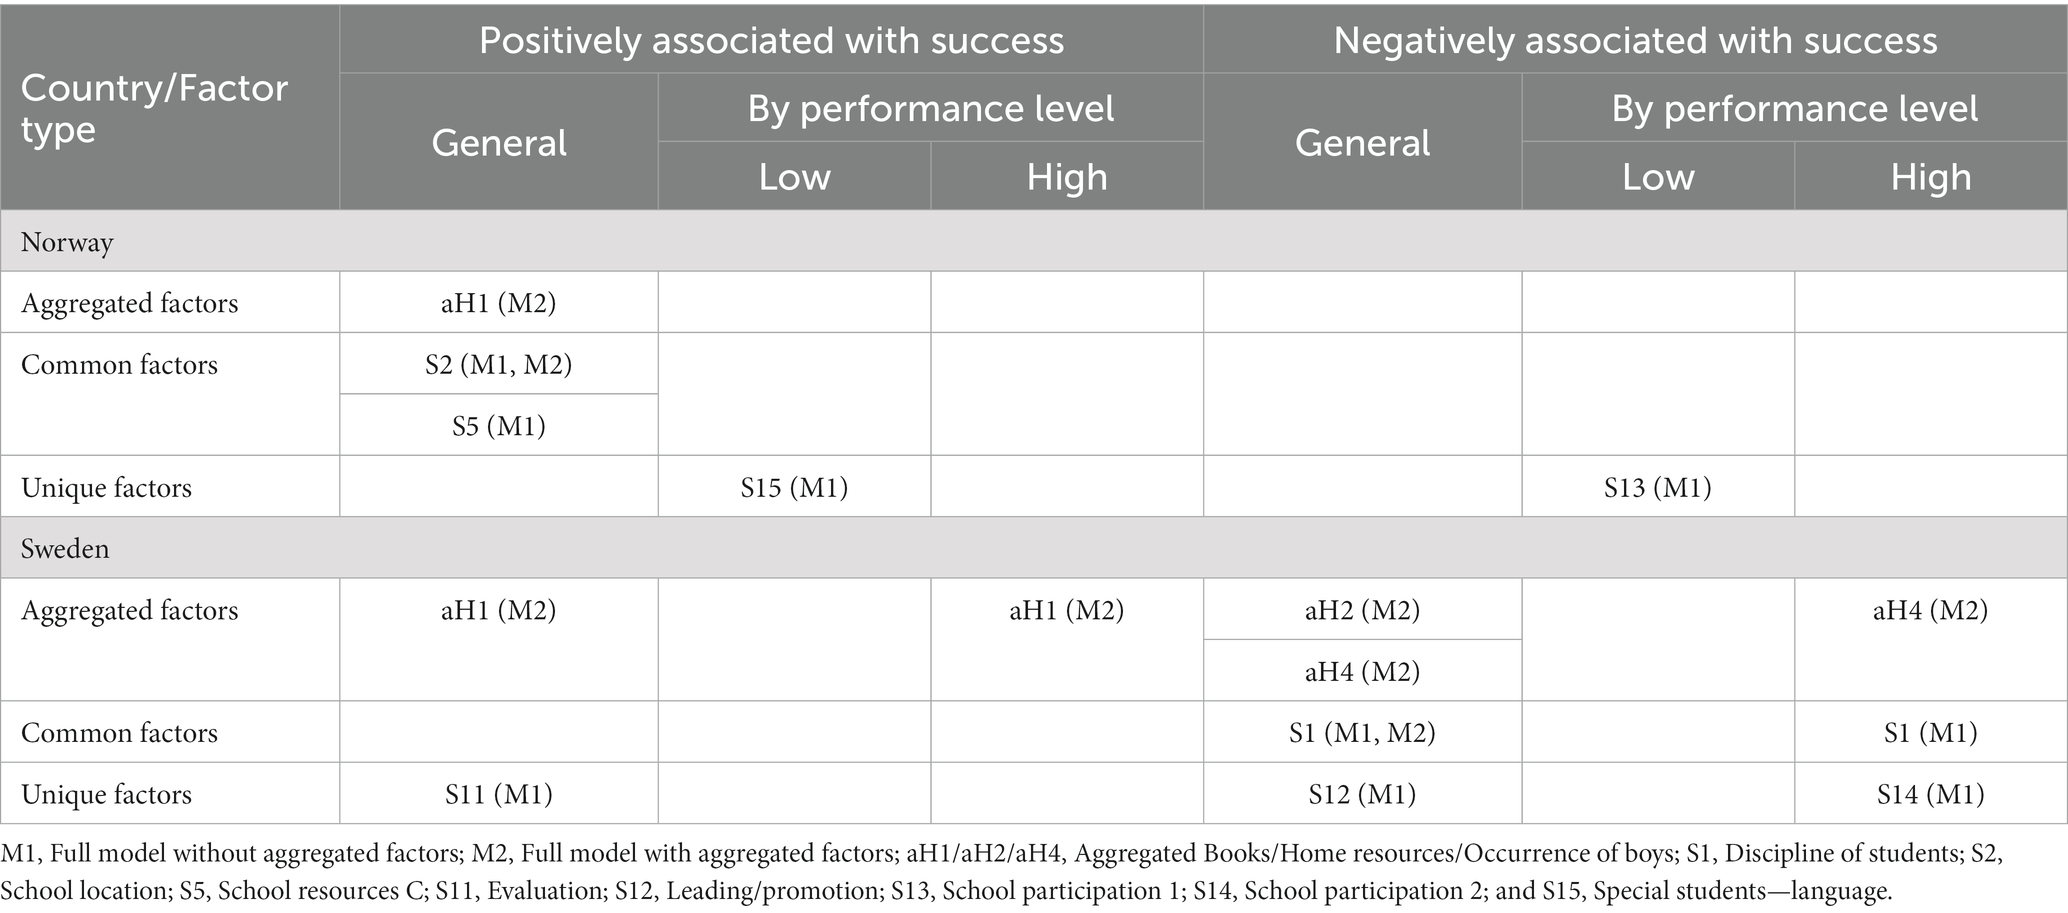
Table 6. School variables associated with students’ performance in PISA 2015.
3.2.1 Aggregated factors
Only one of the aggregated factors, Books at home (aH1), was found to have a consistently significant positive relationship with science achievement, according to both the TIMSS and PISA for Norway and Sweden. In Sweden, the Home resources factor (aH2) was also positively associated with student success according to the TIMSS, but not the PISA. In contrast, presence of Home resources (aH2) and being in a school dominated by boys (aH4) were negatively associated with success according to the PISA.
Generally, the incorporation of aggregated student-level factors, such as Books at home (aH1) or Home resources (aH2), tended to reduce the significance of other school-level factors.
3.2.2 Common factors
Just three of the factors covered by both TIMSS and PISA (S3 in Norway and S6 in Sweden by TIMSS, and S1 in Sweden by PISA) were identified as being negatively associated with success. These factors are all based on items asking principals about the extent to which student learning is hindered by factors related to students or their teachers. Discipline of students (S1) indicates levels of various kinds of negative student behavior while factors linked to the teachers are about shortage of staff or lack of competence (School resources A, S3), or the effect of Teachers’ absenteeism on students learning (S6). These, three factors (S1, S3, and S6), were significant according to both M1 and M2 models. Consequently, none of the factors in TIMSS were significantly associated with success in either country. The PISA data also indicate that School location (S2) and School resources C (S5) were associated with success in Norway. However, when aggregated student-level factors were included in the model, the significance of School resources C (S5), diminished and became statistically insignificant.
3.2.3 Unique factors
Overall, only a few statistically significant school-level factors were solely covered by TIMSS or PISA among the Nordic countries. In the case of TIMSS, Students’ attitudes and activities (S10) appear to be associated with their success, but only in Norway. On the other hand, in Sweden, it is the Parents’ attitudes and activities (S9) that are associated with students’ success. The only factor found to be associated with a lack of success is experience of principal (S8), in Norway, where length of employment/service at the same school seemed to be negatively associated with success. Note, both S8 and S9 were only statistically significant according to the M1 model.
For PISA, there were no statistically significant factors in Norway but two statistically significant factors in Sweden, although they seem to be differently associated with student success. Following-up achievement over time, Evaluation (S11), appeared to enhance success, but the presence of leading and promoting activities and behavior in school (Leading/promotion, S12) seemed to have an opposite, negative effect on success. Both factors were only statistically significant according to the M1 model excluding aggregated student-level factors.
3.2.4 TIMSS and PISA by proficiency level
When data is viewed by proficiency level, a somewhat different pattern is revealed. The analysis revealed that aggregated student level factors were only statistically significant among students in Sweden, demonstrating a statistically significant association with success on both TIMSS and PISA. However, it is important to note that the nature of this association differs between the two assessments. On TIMSS, the aggregated Books at home (aH1) and aggregated Home resources (aH2) such as study desk, student’s own room, a quiet place to study, computer or tablet, or a link to the internet are associated with success in school and this is true for high and low-performing schools. Regarding PISA, school factors are only identified among high-performing schools. Similar to TIMSS, the existence of Books at home (aH1) is also associated with success among high performing schools. Another factor identified among high performing schools on PISA is the Occurrence of boys (aH4), but this aggregated factor is negatively associated with success. None of the aggregated factors seem to be important for achievements of students in low-performing schools on PISA.
Regarding common factors on TIMSS and PISA, different kind of school resources (S3, S4, and S5) can be identified as associated with success or lack of success by TIMSS in Norway and Sweden. Discipline of students (S1) was the only factor identified by PISA and only in Sweden. The factors identified on TIMSS were present in low-performing (S3) and high-performing (S4, S5) schools. These are potentially illuminating distinctions, as S3 indicates practical facilities offered by some schools (a place for students to work on their homework before and/or after school), while S4 and S5 concern resources for providing instruction. S3 was positively associated with student performance in low-performing schools, but not significant in high-performing schools, while in high-performing schools’ provision of staff to assist the students with their homework (S4) and Lack of resources such as instructional materials (S5) had positive and negative impacts on students’ performance, respectively. Furthermore, S5 was the only factor that was statistically significant according to both M1 and M2 models.
Analysis of the impact of unique factors in relation to proficiency levels indicated that those associated with success, either positively or negatively, mainly have effects in low-performing schools. Note the TIMSS data indicate that the Students’ attitude and activities factor (S10) was positively associated with success in Norway, but negatively associated with success in Sweden, and only statistically significant in model M1.
4 Discussion
The overall aim of this study was to conduct an empirical examination of TIMSS and PISA, with a specific focus on the information they can provide regarding factors within the school that are associated with student performance. More specifically, we first aimed to identify school factors that are measured by both TIMSS and PISA, only TIMSS, and only PISA (RQ1). Our findings indicate that comparison of the two assessment programs is challenging due to the limited number of common factors. The TIMSS school questionnaire is devoted more to specific curricular areas, teaching practices, and teacher qualifications, while the PISA school questionnaire focuses on school policies, resources, and student characteristics. A general conclusion of our analysis is that TIMSS and PISA assessments provide partially complementary information.
Secondly, we aimed to identify school factors that appear to be associated with student success according to the TIMSS and PISA results (RQ2). Our findings show that Books at home (aH1) is the only contextual (Aggregated) factor that is significantly positively related to science achievement, according to both TIMSS and PISA assessments in Norway and Sweden. Of all the common factors, only those associated with school resources were found to be significant according to both TIMSS and PISA, although the questions in the questionnaires may not be formulated identically. However, the findings also show that among all the common factors that exist, TIMSS and PISA seem to catch partly different school factors. For example, School location (S2) was only significant in PISA (positively associated with student success). In addition, there are some unique factors in TIMSS and PISA that provide insight into factors associated with student success or lack thereof.
Thirdly, we aimed to examine whether there are school factors that are of particular relevance in relation to different school types, i.e., low-or high-performing schools (RQ3). An overall finding is that significant school factors differ to some extent between low-and high-performing schools. Consequently, analysis based on proficiency levels proved to be beneficial for obtaining a deeper understanding of the significance of school factors. Among the common factors, our analysis reveals that school factors tend to have a significant impact primarily among high-performing schools in Sweden and within the context of TIMSS, while the unique school factors are solely influential in low-performing schools in both Norway and Sweden, apart from one factor (School participation, S14, PISA). Thus, a general conclusion is that the significance of school factors for student success, or lack thereof, is not context-free, as their relevance seems to vary between countries and different types of schools, and they seem to be associated with success in different ways. Nevertheless, the findings provide valuable clues for disentangling factors that may be significant for enhancing the performance of low achievers in the school systems.
The findings have significant relevance for school professionals, as they imply that both TIMSS and PISA provide valuable data that can inform educational investments and guide the implementation of effective strategies. However, they indicate that it is not possible to draw robust conclusions regarding differences in the abilities of PISA and TIMSS to identify school factors associated with success or lack thereof. Due to fundamental differences in the framework and design of TIMSS and PISA they seem to provide complementary information, as also indicated by previous comparisons (see, for example, Sollerman, 2019). However, given the limited number of studies that have explored both TIMSS and PISA, especially concerning questionnaire data, it is difficult to relate our findings to prior relevant research.
It should also be noted that the presented results are based on data from the 2015 assessments and specifically relate to student success in science. Additionally, 2015 was the latest year when the two assessments were distributed the same year, and science was the major PISA subject. However, it would be beneficial to expand the analysis by including other subjects, to obtain more comprehensive understanding of the factors influencing student success across academic domains, as few students are high performers in all subjects (OECD, 2016). This should be kept in mind when interpreting results from these large-scale assessments. Nevertheless, we successfully identified specific school factors that seem to be positively associated with student success (and some that seem to be negatively associated) in one of the assessed subjects. Our findings suggest that some factors related to the school may be beneficial, or disadvantageous, in specific types of schools. This is highly relevant for prioritizations in educational investments. The findings are also of highly relevant for educational professionals, particularly school leaders, as they are ultimately responsible for their schools’ and students’ success.
Our analysis, taking into account different school types, has provided a deeper understanding of the school factors linked to success, and highlighted urgent needs for further research to examine in more detail. Further research should examine the significance of school factors in relation to different kind of school-types’, which can be defined in different ways, and not only limited to performance level and the subject science, as in our study.
Data availability statement
Publicly available datasets were analyzed in this study. This data can be found at: https://timssandpirls.bc.edu/timss2015/international-database/ and https://www.oecd.org/pisa/data/2015database.
Author contributions
IL: Data curation, Formal analysis, Investigation, Methodology, Resources, Software, Visualization, Writing – original draft, Writing – review & editing. ER: Conceptualization, Funding acquisition, Investigation, Project administration, Validation, Writing – original draft, Writing – review & editing. MW: Investigation, Validation, Writing – review & editing.
Funding
The author(s) declare financial support was received for the research, authorship, and/or publication of this article. This work was supported by Swedish Research Council (grant number 2015-02160).
Conflict of interest
The authors declare that the research was conducted in the absence of any commercial or financial relationships that could be construed as a potential conflict of interest.
Publisher’s note
All claims expressed in this article are solely those of the authors and do not necessarily represent those of their affiliated organizations, or those of the publisher, the editors and the reviewers. Any product that may be evaluated in this article, or claim that may be made by its manufacturer, is not guaranteed or endorsed by the publisher.
Supplementary material
The Supplementary material for this article can be found online at: https://www.frontiersin.org/articles/10.3389/feduc.2024.1323687/full#supplementary-material
References
Cremers, B. P. M., Peters, T., and Reynolds, D. Eds. (2022). School Effectiveness and School Improvement. 1st ed. Routledge.
Gelman, A., and Hill, J. (2006). Data Analysis Using Regression and Multilevel/Hierarchical Models. New York, NY: Cambridge University Press.
Gil-Madrona, P., Martínez-López, M., and Sáez-Sánchez, M.-B. (2019). Objective and subjective factors associated with Spanish students' performance in science in PISA 2015/Factores objetivos y subjetivos asociados al rendimiento del alumnado español en ciencias en PISA 2015. Cult. Educ. 31, 671–715. doi: 10.1080/11356405.2019.1656485
Goldstein, H., and Woodhouse, G. (2000). School effectiveness research and education policy. Oxf. Rev. Educ. 26, 353–363. doi: 10.1080/713688547
Haahr, J. H., Nielsen, T. K., Hansen, M. E., and Jakobsen, S. T. (2005). Explaining student performance: evidence from the international PISA, TIMSS and PIRLS surveys. Danish Technological Institute.
Haugsbackk, G. (2013). From sputnik to PISA shock–new technology and educational reform in Norway in Norway and Sweden. Educ. Inq. 4, 607–628. doi: 10.3402/edui.v4i4.23222
Helgøy, I., and Homme, A. (2006). Policy tools and institutional change: comparing education policies in Norway, Sweden and England. J. Publ. Policy 26, 141–165. doi: 10.1017/S0143814X0600050X
IEA (2022). Help Manual for the IEA IDB Analyzer (Version 5.0). Hamburg, Germany. Available at: www.iea.nl
Imsen, G., Blossing, U., and Moos, L. (2017). Reshaping the Nordic education model in an era of efficiency. Changes in the comprehensive school project in Denmark, Norway, and Sweden since the millennium. Scand. J. Educ. Res. 61, 568–583. doi: 10.1080/00313831.2016.1172502
Jensen, F., Pettersen, A., Frønes, T. S., Kjærnsli, M., Rohatgi, A., Eriksen, A., et al. (2019). PISA 2018. Norske elevers kompetanse i lesing, matematikk og naturfag. Oslo: Universitetsforlaget.
Lundgren, E. (2023). Modellering av responsprocessdata från PISA: Inferenser relaterade till motivation och problemlösning. Doctoral Thesis from the Department of Applied educational science, 15. Umeå: Umeå Universitet.
McCoach, D. B., and Black, A. C. (2008). Assessing model adequacy in Multilevel Modeling of Educational Data. (eds.) O’Connell, A.A., and McCoach, D.B. (Charlotte, NC: Information Age Publishing), 245–272
Mullis, I.V.S., and Martin, M.O. (eds.) (2013). TIMSS 2015 assessment frameworks. Boston College, TIMSS & PIRLS International Study Center website. Available at: https://timssandpirls.bc.edu/timss2015/frameworks.html
Mullis, I.V.S., Martin, M.O., Foy, P., and Hooper, M. (2016). TIMSS 2015 International Results in Science. Boston College, Chestnut Hill, MA.
Mullis, I. V. S., Martin, M. O., Foy, P., Kelly, D. L., and Fishbein, B. (2020). TIMSS 2019 international results in mathematics and science. Boston College, TIMSS & PIRLS International Study Center website. Available at: https://timssandpirls.bc.edu/timss2019/international-results/
Mullis, I. V. S., Martin, M. O., and Loveless, T. (2016). 20 years of TIMSS: International trends in mathematics and science achievement, curriculum, and instruction. Chestnut hill, MA: TIMSS & PIRLS International Study center, Boston College.
Muthén, L.K., and Muthén, B.O. (1998–2017). Mplus User’s Guide 8th Edn. Los Angeles, CA: Muthén & Muthén
Nilsen, S., Scherer, R., and Blömeke, S. (2018). “The relation of science teachers’ quality and instruction to student motivation and achievement in the 4th and 8th grade: a Nordic perspective” in Northern lights on TIMSS and PISA 2018: TemaNord 2018: 524.
Nilsen, T., and Teig, N. (2022). “A systematic review of studies investigating the relationships between school climate and student outcomes in TIMSS, PISA, and PIRLS” in International Handbook of Comparative Large-Scale Studies in Education: Perspectives, Methods and Findings, Springer, Cham: Springer International Handbooks of Education. 1–34.
OECD (2013). Results in Focus: What 15-Year-Olds Know and What They Can Do With What They Know. Paris: OECD.
OECD (2016). PISA 2015 Results (Volume I): Excellence and Equity in Education. Paris: PISA, OECD Publishing.
OECD (2017b). PISA 2015 Assessment and Analytical Framework: Science, Reading, Mathematic, Financial Literacy and Collaborative Problem Solving. Paris: PISA, OECD Publishing.
OECD (2019). PISA 2018 Results (Volume I): What Students Know and Can Do. Paris: PISA, OECD Publishing.
Oskarsson, M., Kjærnsli, M., Sørensen, S., and Eklöf, H. (2018). Nordic students’ interest and self-belief in science. In northern lights on TIMSS and PISA 2018: TemaNord 2018, 524.
Rautalin, M., Alasuutari, P., and Vento, E. (2019). Globalisation of education policies: does PISA have an effect? J. Educ. Policy 34, 500–522. doi: 10.1080/02680939.2018.1462890
Reimer, D., Skovgaard Jensen, S., and Kjeldsen, D. (2018) “Social inequality in student performance in the Nordic countries: a comparison of methodological approaches” in Northern lights on TIMSS and PISA 2018: TemaNord 2018: 524.
Rutter, M., Maughan, B., Mortimore, P., Ouston, J., and Smith, A. (1979): Fifteen Thousand Hours: Secondary Schools and Their Effects on Children. London: Open book
Schafer, J. L., and Graham, J. W. (2002). Missing data: our view of the state of the art. Psychol. Methods 7, 147–177. doi: 10.1037//1082-989X.7.2.147
Scheerens, J. (2013). What is effective schooling. A review of current though and practice (international baccalaureate organization). University of Twente, The Netherlands.
Schwarz, G. (1978). Estimating the dimension of a model. Ann. Stat. 6, 461–464. doi: 10.1214/aos/1176344136
Snijders, T.A.B., and Bosker, R.J. (2012). Multilevel Analysis: An Introduction to Basic and Advanced Multilevel Modeling, 2nd Edn. London: Sage.
Sollerman, S. (2019). Kan man räkna med PISA och TIMSS? Relevansen hos internationella storskaliga mätningar i matematik i en nationell kontext. (doctoral thesis from the Department of Mathematics and Science Education 21). Stockholms universitet, Stockholm.
Tabachnik, B. G., and Fidell, L. S. (2007). Using Multivariate Statistics. 5th Edn. Allyn & Bacon/Pearson Education, Inc.
Teig, N., Scherer, R., and Vegar Olsen, R. (2022). A systematic review of studies investigating science teaching and learning: over two decades of TIMSS and PISA. Int. J. Sci. Educ. 44, 2035–2058. doi: 10.1080/09500693.2022.2109075
Wiberg, M., and Andersson, E. (2010). School effectiveness in Sweden compared with countries in Europe and Asia-Pacific. Paper presented at the 4th IEA international research conference in Gothenburg, July 1–3, 2010. Available at: www.iea-irc.org/fileadmin/IRC_2010_papers/TIMSS/Wiberg_Andersson.pdf (Accessed December 1, 2012).
Wiberg, M., and Rolfsman, E. (2023). Students’ self-reported background SES measures in TIMSS in relation to register SES measures when analysing students’ achievements in Sweden. Scand. J. Educ. Res. 67, 69–82. doi: 10.1080/00313831.2021.1983863
Wiberg, M., Rolfsman, E., and Laukaityte, I. (2013). School effectiveness in mathematics in Sweden and Norway 2003, 2007 and 2011. Paper presented at the 5th IEA international research conference in Singapore, July 28–30, 2013. Accessed at: https://www.iea.nl/sites/default/files/2019-04/IRC-2013_Wiberg_etal.pdf (Accessed April 20, 2023).
Keywords: multilevel models, student success, school-factors, TIMSS, PISA
Citation: Laukaityte I, Rolfsman E and Wiberg M (2024) TIMSS vs. PISA: what can they tell us about student success?—a comparison of Swedish and Norwegian TIMSS and PISA 2015 results with a focus on school factors. Front. Educ. 9:1323687. doi: 10.3389/feduc.2024.1323687
Edited by:
Loris Vergolini, University of Bologna, ItalyReviewed by:
Pedro Gil-Madrona, University of Castilla-La Mancha, SpainTrude Nilsen, University of Oslo, Norway
Copyright © 2024 Laukaityte, Rolfsman and Wiberg. This is an open-access article distributed under the terms of the Creative Commons Attribution License (CC BY). The use, distribution or reproduction in other forums is permitted, provided the original author(s) and the copyright owner(s) are credited and that the original publication in this journal is cited, in accordance with accepted academic practice. No use, distribution or reproduction is permitted which does not comply with these terms.
*Correspondence: Inga Laukaityte, aW5nYS5sYXVrYWl0eXRlQHVtdS5zZQ==