Abstract
Objectives:
Medical student education is critical in equipping future doctors to impact patient healthcare and the national public health system significantly. This study aimed to identify factors influencing student academic success (honors level or high-grade group) among medical students using data mining techniques applied to multidimensional educational data.
Materials and methods:
A retrospective cohort study was conducted using a standardized questionnaire administered to 145 medical students. A total of 13 factors spanning four domains—academic activity, demographics, environment, and psychology or learning style—were examined. The prevalence ratio (PR) and adjusted prevalence ratio (APR) were calculated using multivariate logistic regression. Unsupervised learning techniques, including cluster analysis and association rules, were used to identify hidden patterns. Visualization techniques, such as heatmaps and centroid plots derived from cluster analysis, were employed to depict data relationships and facilitate the interpretation of key trends. Internal validation was also evaluated.
Results:
Among the 13 factors analyzed, logistic regression identified a pre-med GPAX ≥3.75 and an interest in internal medicine as statistically significant predictors of high academic performance, with adjusted prevalence ratios (APRs) of 1.73 (95% CI, 1.02–2.91, p = 0.040) and 1.52 (95% CI, 1.14–2.03, p = 0.005), respectively. Cluster analysis revealed characteristic traits of high-grade students, including metropolitan residence, very high pre-med GPAX, and a preference for kinesthetic and reading learning styles. Association rules analysis further emphasized the importance of environmental factors, particularly transportation time to school and access to learning resources, in supporting academic success.
Conclusion:
Educational data mining (EDM) provided valuable insights into factors contributing to medical student success. Logistic regression highlighted pre-med GPAX and an interest in internal medicine as key predictors. Cluster analysis uncovered patterns linking learning styles and academic performance, while association rules emphasized the role of environmental factors, such as school proximity and resource availability. Together, these methods provide a comprehensive and visually engaging framework to inform educational planning, potentially generating novel insights for addressing medical challenges and enhancing clinical practice.
Introduction
Competent medical students are essential for cultivating a skilled cadre of doctors who not only contribute directly to patient healthcare but also enhance collaboration within the national public health system.
To achieve these goals, most medical institutions strive to develop optimal educational programs that achieve academic success and professionalism. Addressing the complexity of multifactorial data is a critical challenge in this process. As a result, the introduction of educational data mining (EDM) has gained attention as a promising solution.
EDM is an emerging interdisciplinary research area that involves education and computer science, with the ability to extract and convert large amounts of educational data into useful patterns of information and important knowledge. Various tasks are involved, such as description, prediction, estimation, classification, clustering, and association discovering, leading to the development of numerous techniques, including regression, naïve Bayes, decision trees, neural networks (NN), K-means, Apriori, FP-Growth, and many more (Aleem and Gore, 2020). Until now, several applications of EDM have emerged, such as regression models for graduate-level performance prediction (Zimmermann et al., 2015), association rule mining for teaching assessment (Sy and Que, 2019), and cluster analysis for learning style classification (Beal et al., 2006).
While various definitions of student success exist in the literature, they focus primarily on academic achievements and professionalism, and the latter is difficult to measure (Kuh et al., 2006; Alyahyan and Düştegör, 2020). Student achievement is commonly addressed using the grade point average (GPA), which remains a crucial consideration for postgraduate training programs such as residency and fellowship (McGaghie, 2019).
Numerous studies in the literature have explored influential factors based on learning, cognitive, and behavioral theories for predicting academic success (Kolb, 2014). Our research primarily concentrates on four domains: academic activity, demographics, environment, and psychology or learning style. These domains are frequently reported as predictive or associated with our outcomes in numerous systematic literature reviews (Alyahyan and Düştegör, 2020; Baashar and Alkawsi, 2021; Hellas et al., 2018; Crisp et al., 2015), with prior academic achievement and demographics ranking highest (44 and 25%, respectively), followed by environment and psychology or learning style (17 and 11%, respectively) (Alyahyan and Düştegör, 2020). Psychology, or learning style, is defined as the composite of cognitive, affective, and psychological characteristics that are stable indicators of how a learner perceives, interacts with, and responds to the learning environment (Nguyen, 2013). Unfortunately, a multifactorial linkage is believed to occur due to the complexity of human behavior and the learning process (Alyahyan and Düştegör, 2020; Salem et al., 2013).
Compared to traditional medical education, which relies on passive memorization of content, recent research has introduced more active approaches, emphasizing creativity and innovative active learning (Hindin et al., 2023).
Notably, educational analysis could engage with many dimensions and data types, such as categorical data in attitude or learning style and continuous GPA data. Thus, it is a unique tool that can potentially be applied to collect and mine different data types for targeted outcomes.
Definition: Student success is defined as academic achievement, engagement in educationally purposeful activities, satisfaction, acquisition of desired knowledge, skills and competencies, persistence, attainment of educational outcomes, and post-college performance (Kuh et al., 2006).
Materials and methods
The retrospective cohort study was conducted using an online standardized questionnaire consisting of 13 questions and one learning style test (Table 1). The questionnaire was administered to medical students who graduated from Phramongkutklao College of Medicine between April 2010 and April 2023. It included questions pertaining to specific periods of the 6-year medical student experience and was conducted from January 2022 to April 2023. The study followed a four-step approach, modified from the Foundational Method for Data Science (FMD), IBM 2015, as presented in Figure 1.
Table 1
| Domains | Attributes/study factors | Type of data | Descriptions |
|---|---|---|---|
| Demographics | Sex | Categorical | Female/Male |
| BMI status | Underweight/Normal/Overweight/Obesity | ||
| Relationship status | Single/Dating | ||
| Family address | Metropolis/Others | ||
| Family income | <20,000/20–100,000/100,000 THB/month | ||
| Environment | Transportation time | <30/30–60/>60 min | |
| Learning resources | Wi-Fi/Computer/iPad | ||
| Academic activities | Online learning | Hybrid to complete online/None | |
| Attendance | Medicine/Obstetrics & Gynecology/Surgery/ Pediatrics | ||
| Specialties of interest | <1/ 1–2/ >2 h per day | ||
| Time for study | 1/2/3/4 | ||
| Course session* | <3.5/3.5–3.75/≥3.75 | ||
| GPAX in pre-medical school | < 3.25 (Low grade)/ ≥ 3.25 (High grade) | ||
| Psychology | Learning style | Conclusion (V/A/R/K) | |
| Integer | Visual score (1-16) Auditory (1-16) Reading (1-16) Kinetics (1-16) |
Study factors with descriptions and data types for analysis.
BMI, body mass index; GPAX, accumulated grade point average; THB, Thai Bath.
*Course session: defined by a session of different educational courses (usually modified every 3–5 years).
Figure 1
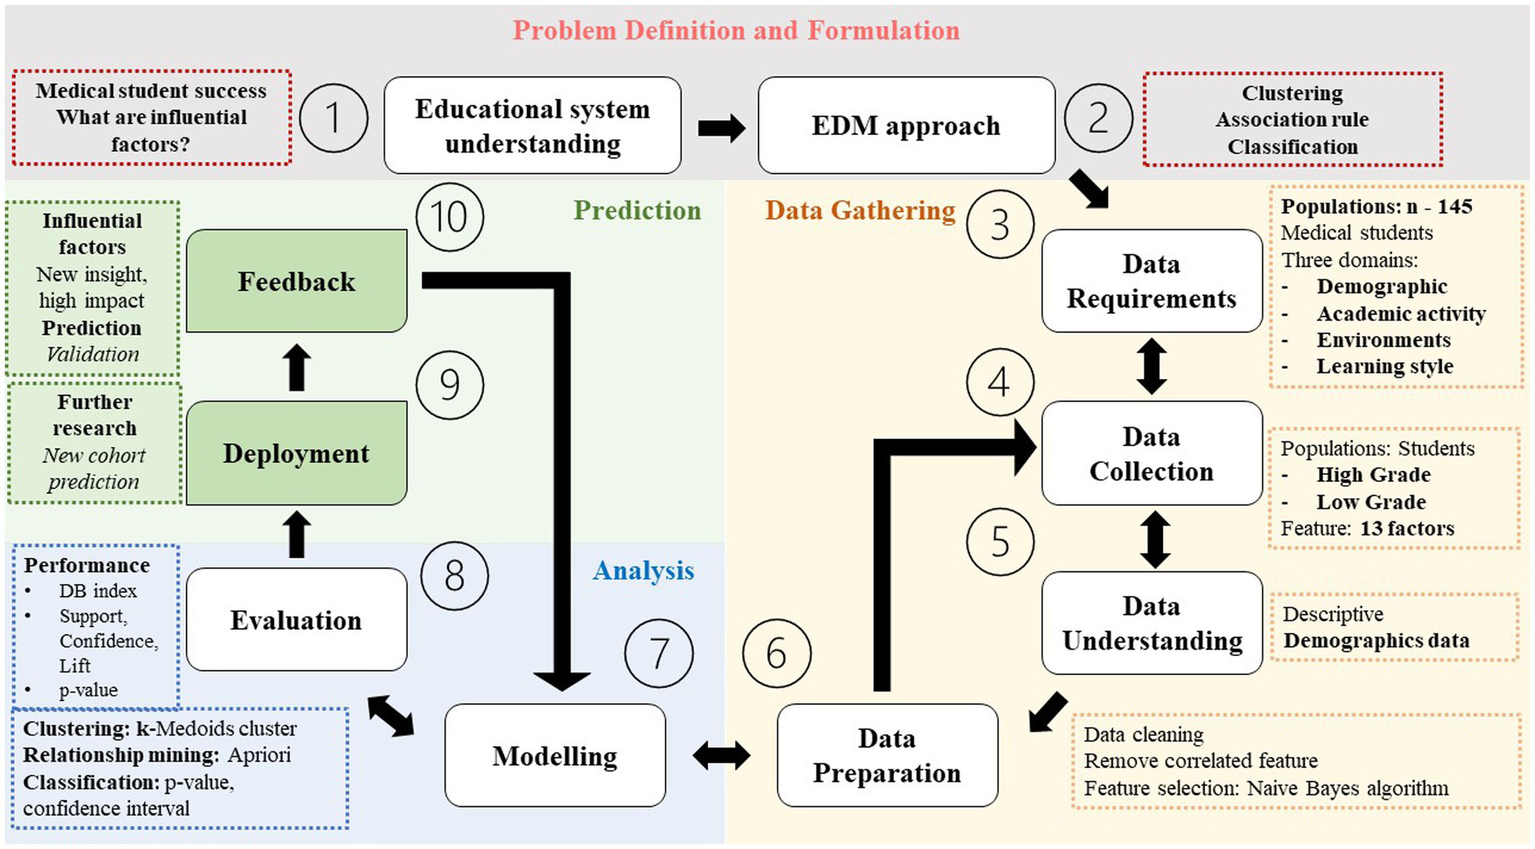
The study flow diagram adapted from the Foundational Method for Data Science (FMD), IBM 2015 (Rollins, 2015; Foroughi and Luksch, 2018). DB index, Davies Bouldin; DT, decision tree.
Problem definition and formulation
The primary outcome was academic success, measuring the accumulated grade point average of graduated students in medical school, or GPAX (Med). The factors affecting our outcomes were analyzed from the literature (Alyahyan and Düştegör, 2020; Salem et al., 2013) and concluded in four domains: academic activity, demographics, environment, and learning style or psychology. Based on students’ data, the inclusion criteria were graduation between April 2010 and April 2023 to minimize the recall bias and ensure the voluntary completion of all questionnaire questions. Incomplete questionnaires were excluded. The Royal Thai Army Medical Department Institutional Review Board approved the study, reference number R192h/64_Exp. Student identification was coded before analysis and discussion.
Outcome of measurement
The GPAX was categorized as either high-grade or honors level and low-grade or average grade using a cutoff of 3.25.
The analysis had two objectives. First, supervised learning with logistic regression was used to classify outcomes based on the probability of occurrence. Second, unsupervised learning was applied using association rules and cluster analysis to gain further insights from the data, allowing for exploration without predetermined outcome labels. Visualization techniques, such as heat maps and centroid plots, were employed to illustrate patterns and relationships identified by supervised and unsupervised methods. For a visual overview of the analytical approach, refer to Figure 2.
Figure 2
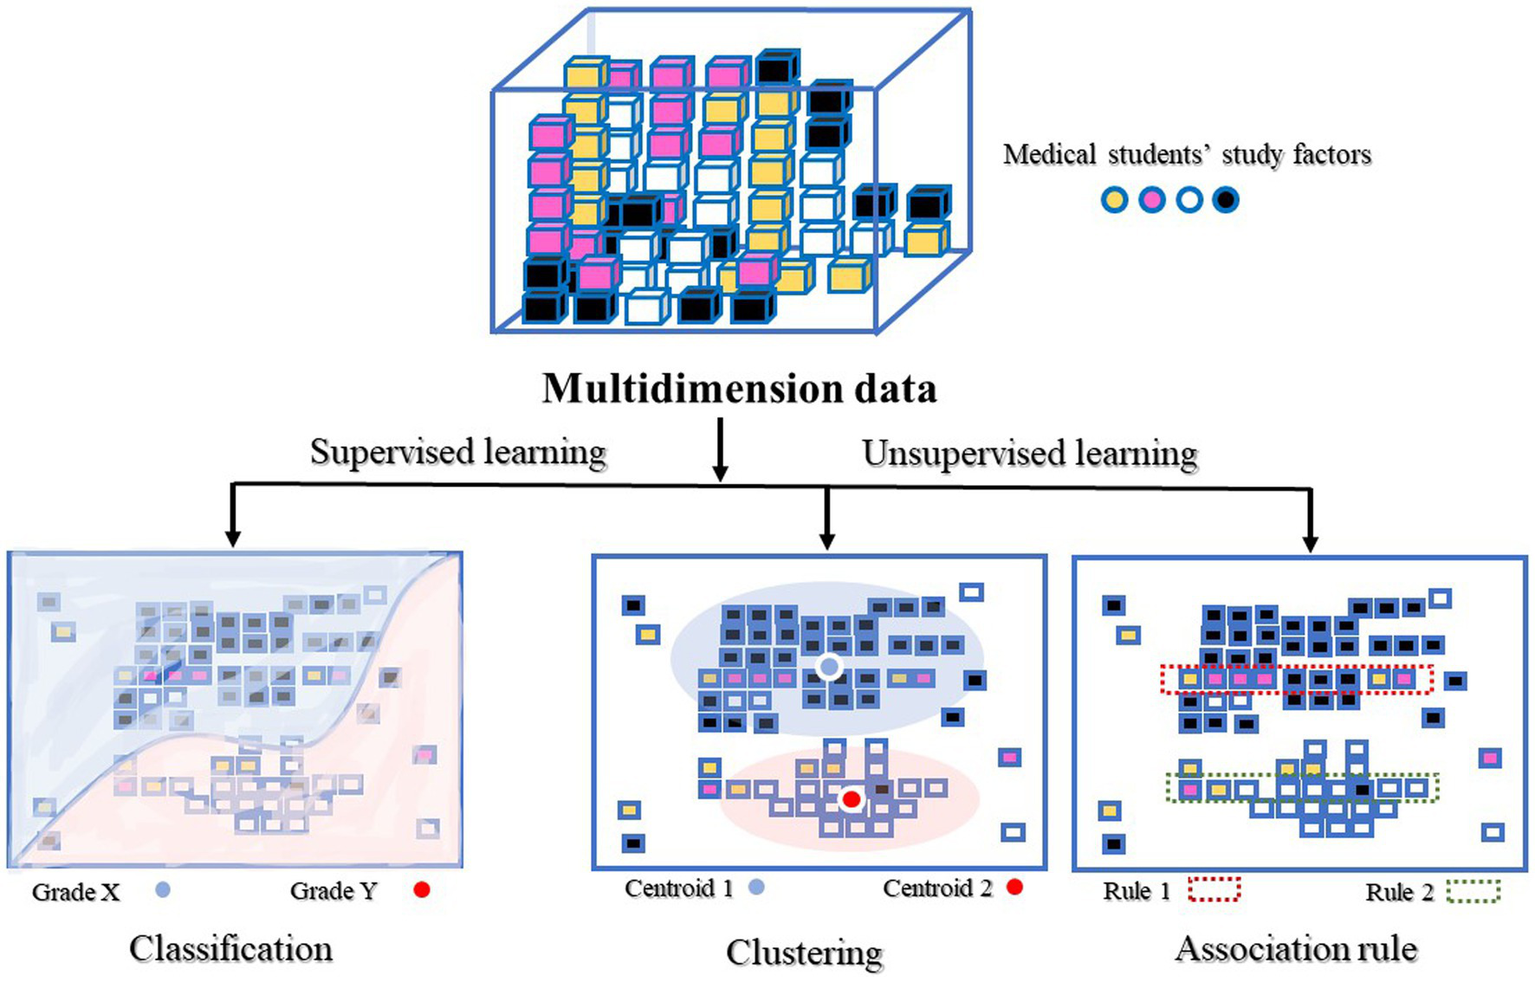
Conceptual overview of four predictive models.
Logistic regression (LR)
A traditional statistical method invented by a British statistician in 1958, widely used for classification problems via the logistic function (Cox, 1958). In this study, logistic regression was selected as an appropriate method to analyze the relationship between multiple predictor variables and a binary outcome—academic success. Its capacity to estimate adjusted risk measures or associations while controlling covariates and confounders aligns well with our study objectives. The adjusted prevalence ratio (APR) was used to measure the risk associated with the probability of the outcome occurring (Petersen and Deddens, 2008). In addition, the ‘margins’ command was analyzed to obtain predicted probabilities.
Cluster analysis is a useful tool when dealing with unstructured data. The ability to organize data into homogeneous groups provides immediate insights, patterns, or a foundation for constructing a hypothesis. Our analytical goal is to achieve optimal similarities within each cluster and dissimilarities across clusters while also determining an appropriate number of clusters that offer meaningful clinical information (Bergman et al., 2003). The model was validated internally using the Davies Bouldin (DB) index. This calculates the ratio of the average intra-cluster distance for points in two clusters to the distance within the clusters. The lowest DB index represents the optimal number of clusters and often indicates good clustering (Davies and Bouldin, 1979). Secondary validation was the average within centroid distance, which involved calculating the average distance between each point in a cluster and its centroid. Considering any obvious outlier deviating from a smooth progression is important since the average distance naturally decreases as the number of clusters increases (Hofmann and Klinkenberg, 2016).
The association rule was initially proposed by Agrawal et al. (1993) for market basket analysis. Our study uses association rules to identify correlations and co-occurrences among several factors affecting human behavioral outcomes or student success. The aim is to explain patterns in data derived from independent information repositories.
Association rules (R) are expressed as “if-then” statements or X → Y, where X and Y represent two sets of items. These rules are defined based on a set of transactions (T). Two measures are associated with association rules: support or sup(R) and confidence or conf (R). The support is the probability of X appearing in a transaction, while the confidence is the conditional probability of Y appearing when X is also present in a transaction (Pei, 2009).
Frq, frequent; supp, support.
Software
RapidMiner Studio 10.1.3, a well-known data mining tool, is efficiently available for both supervised and unsupervised analyses (Hofmann and Klinkenberg, 2016; KDnuggets, 2016).
Data gathering
Study population: a dataset of 145 medical students.
Attributes (study factors): a total of 13 attributes from four categorical and numerical data domains, as shown in Table 1. All factors were selected based on their statistical and clinical relevance to our research outcomes from literature reviews.
Data preparation:
Missing value: none
Remove correlated features: to mitigate the risk of confusing correlation with causation, features were selected based on a p-value threshold of <0.20 or determined by clinical significance (Akoglu, 2018).
Feature selection: backward stepwise optimization selection was applied to identify the most useful attribute for classifying examples, with a generation without improvement set at 1.
Data mining analysis
Logistic regression: prevalence ratios and adjusted prevalence ratios were calculated using univariate and multivariate logistic regression, with statistical significance determined by a p-value <0.05.
Association rule: rules were identified based on strong support, confidence, and independence correlation, with a Lift value >1.
Clustering analysis: the number of clusters was determined based on clinical significance and robust internal validation, enabling the extraction of meaningful knowledge and insights from each group.
Prediction
Model training–testing (internal validation)/deployment (external validation): further research with a new cohort is required to test the model using an independent sample, as our study’s datasets are inadequate.
Results
Characteristics of the study population
A total of 145 students, including 72 men and 73 women, participated in this survey. The majority of the respondents belonged to the high-grade group, comprising 92 students (63.4%), and the average age of the participants was 27.4 ± 3.1 years. The majority of the students resided in metropolitan areas (79.3%) and had a commute time to school of less than 30 min (72.4%), with an equal distribution of relationship statuses (Table 2).
Table 2
| Characteristics | High-grade | Low-grade | Total (n = 145) | p-value |
|---|---|---|---|---|
| n (%) | n (%) | n (%) | ||
| Gender | 0.562a | |||
| Male | 44 (61.1%) | 28 (38.9%) | 72 (49.7%) | |
| Female | 48 (65.8%) | 25 (34.3%) | 73 (50.3%) | |
| Age (years) | <0.001a | |||
| 20–24 | 29 (82.9%) | 6 (17.1%) | 35 (24.1%) | |
| 25–29 | 48 (69.6%) | 21 (30.4%) | 69 (47.6%) | |
| ≥ 30 | 15 (36.6%) | 26 (63.4%) | 41 (28.3%) | |
| mean ± SD | 26.6 ± 2.9 | 28.9 ± 3.0 | 27.4 ± 3.1 | <0.001b |
| BMI (kg/m2) | 0.088a | |||
| < 18.5 | 54 (73.0%) | 20 (27.0%) | 74 (51.0%) | |
| 18.5–22.9 | 30 (53.6%) | 26 (46.4%) | 56 (38.6%) | |
| 23–24.9 | 5 (62.5%) | 3 (37.5%) | 8 (5.5%) | |
| ≥ 25 | 3 (42.9%) | 4 (57.1%) | 7 (4.8%) | |
| mean ± SD | 18.4 ± 3.0 | 19.6 ± 3.4 | 18.8 ± 3.2 | 0.038b |
| GPAX (Pre-medical school) | 0.030a | |||
| <3.5 | 8 (38.1%) | 13 (61.9%) | 21 (14.5%) | |
| 3.5–3.75 | 20 (64.5%) | 11 (35.5%) | 31 (21.4%) | |
| ≥ 3.75 | 64 (68.8%) | 29 (31.2%) | 93 (64.1%) | |
| mean ± SD | 3.78 ± 0.20 | 3.62 ± 0.38 | 3.72 ± 0.29 | 0.001b |
| Graduated interval (year) (mean ± SD) | 2.9 ± 3.0 | 4.7 ± 2.7 | 3.5 ± 3.0 | <0.001b |
| Course of study (Year of session) (mean ± SD) | 0.631a | |||
| Session 1 (less than 3 years) | 40 (65.6%) | 21 (34.3%) | 61 (42.1%) | |
| Session 2 (4–5 years) | 16 (57.1%) | 12 (42.9%) | 28 (19.3%) | |
| Session 3 (6–8 years) | 24 (60.0%) | 16 (40.0%) | 40 (27.6%) | |
| Session 4 (more than 8 years) | 12 (75.0%) | 4 (25.0%) | 16 (11%) | |
| Relationship status | 0.501a | |||
| Single | 47 (66.2%) | 24 (33.8%) | 71 (49%) | |
| Dating | 45 (60.8%) | 29 (39.2%) | 74 (51%) | |
| Family address | 0.196a | |||
| Metropolis | 16 (53.3%) | 14 (46.7%) | 115 (79.3%) | |
| Others | 76 (66.1%) | 39 (33.9%) | 30 (20.7%) | |
| Transportation time to school (min) | 0.016a | |||
| Less than 30 min. | 74 (70.5%) | 31 (29.5%) | 105 (72.4%) | |
| 30 to 60 min. | 13 (43.4%) | 17 (56.7%) | 30 (20.7%) | |
| More than 60 min. | 5 (50.0%) | 5 (50%) | 10 (6.9%) | |
| Family income (Thai Baht per month) | 0.588a | |||
| Less than 20,000 | 5 (71.4%) | 2 (28.6%) | 7 (4.8%) | |
| 20,000–1000,000 | 58 (65.9%) | 30 (34.1%) | 88 (60.7%) | |
| More than 100,000 | 29 (58.0%) | 21 (42.0%) | 50 (34.5%) | |
| Learning resources | 0.349a | |||
| Internet Wi-Fi | 3 (100.0%) | 0 (0%) | 3 (2.1%) | |
| Internet Computer | 6 (54.5%) | 5 (45.5%) | 11 (7.6%) | |
| Internet Computer iPad | 83 (63.4%) | 48 (36.6%) | 131 (90.3%) | |
| Online learning attendance (% of total in class/clinic) | 0.628a | |||
| Hybrid to complete online | 52 (69.3%) | 23 (30.7%) | 75 (51.7%) | |
| No online learning | 40 (57.1%) | 30 (42.9%) | 70 (48.3%) | |
| Specialties of interest | <0.001a | |||
| Internal medicine | 32 (91.4%) | 3 (8.6%) | 35 (30.4%) | |
| Obstetrics & Gynecology | 9 (45.0%) | 11 (55.0%) | 20 (15.4%) | |
| Surgery | 11 (64.7%) | 6 (35.3%) | 17 (12.8%) | |
| Pediatrics | 10 (76.9%) | 3 (23.1%) | 13 (9.5%) | |
| Others | 30 (50.0%) | 30 (50%) | 60 (31.9%) | |
| Time for study (per day) | 0.782a | |||
| Less than 1 h | 42 (61.8%) | 26 (38.2%) | 68 (46.9%) | |
| 1–2 h | 42 (63.6%) | 24 (36.4%) | 66 (45.5%) | |
| More than 2 h | 8 (72.7%) | 3 (27.3%) | 11 (7.6%) | |
| Learning style | 0.964a | |||
| Visual | 21 (60.0%) | 14 (40%) | 35 (24.1%) | |
| Auditory | 15 (62.5%) | 9 (37.5%) | 24 (16.6%) | |
| Reading | 8 (61.5%) | 5 (38.5%) | 13 (9%) | |
| Kinesthetics | 34 (64.2%) | 19 (35.8%) | 53 (36.6%) | |
| Mixed | 14 (70.0%) | 6 (30.0%) | 20 (13.7%) | |
Baseline characteristics and study factors of the population.
SD, Standard Deviation; BMI, body mass index; GPAX, accumulated grade point average; THB, Thai Baht.
achi-square test.
bt-test.
Baseline characteristic data between the two groups show significant differences in age, body mass index, and baseline GPAX (pre-med). The average age in the high-grade group was estimated to be 2 years younger, indicating an earlier interval to graduation. However, when comparing educational course sessions, no differences were observed. Therefore, age or interval time was not considered an influential factor, and the course session was used for analysis instead.
While the overall sample’s average BMI indicated underweight, the low-grade group exhibited a normal weight distribution, albeit slightly lower, nearing the borderline limit. Finally, the baseline pre-med GPAX was 4% lower in the low-grade group, with an average of 3.62 compared to 3.78 in the high-grade group.
Furthermore, no differences were found between the two groups regarding gender, relationship status, family address, and income. Among the medical students, the predominant learning style was kinesthetic (36.3%), followed by visual, auditory, mixed, and reading. While there were differences in transportation time and specialties of interest, these will be further analyzed and presented below.
Logistic regression was primarily performed to identify influential factors for high-grade students. Univariate analysis revealed three significant factors: baseline GPAX (pre-med), transportation time, and specialties of interest. Backward-stepwise elimination was then used for factor selection, resulting in two significant factors, presented in Table 3. A GPAX of ≥3.75 in pre-medical school had an adjusted prevalence ratio (APR) of 1.73 (95% CI, 1.02–2.91, p-value = 0.040) for high-grade outcome. In contrast, an interest in internal medicine specialties had an APR of 1.52 (95% CI, 1.14–2.03, p-value = 0.005).
Table 3
| Attributes | Total | High-grade | Univariable | Multivariable | ||
|---|---|---|---|---|---|---|
| n (%) | n (%) | PR (95%CI) | p-value | APR (95%CI) | p-value | |
| Sex | ||||||
| Male | 72 (49.7%) | 44 (61.1%) | 1 | 1 | ||
| Female | 73 (50.3%) | 48 (65.8%) | 1.08 (0.84–1.38) | 0.562 | 1.13 (0.90–1.42) | 0.278 |
| BMI (kg/m2) | ||||||
| 18.5–22.9 | 56 (38.6%) | 30 (53.6%) | 1 | 1 | ||
| < 18.5 | 74 (51%) | 54 (73.0%) | 1.36 (1.03–1.80) | 0.031 | ||
| 23–24.9 | 8 (5.5%) | 5 (62.5%) | 1.17 (0.65–2.10) | 0.608 | ||
| ≥ 25 | 7 (4.8%) | 3 (42.9%) | 0.80 (0.33–1.95) | 0.623 | ||
| GPAX (Pre-medical school) | ||||||
| <3.5 | 21 (14.5%) | 8 (38.1%) | 1 | 1 | ||
| 3.5–3.75 | 31 (21.4%) | 20 (64.5%) | 1.69 (0.92–3.10) | 0.088 | 1.69 (0.98–2.91) | 0.058 |
| ≥ 3.75 | 93 (64.1%) | 64 (68.8%) | 1.81 (1.03–3.17) | 0.039 | 1.73 (1.02–2.91) | 0.040 |
| Course session (Graduated interval - year) | ||||||
| Session 1 (less than 3 years) | 61 (42.1%) | 40 (65.6%) | 1 | 1 | ||
| Session 2 (4–5 years) | 28 (19.3%) | 16 (57.1%) | 0.87 (0.60–1.26) | 0.464 | 0.61 (0.34–1.11) | 0.108 |
| Session 3 (6–8 years) | 40 (27.6%) | 24 (60.0%) | 0.92 (0.67–1.25) | 0.576 | 0.70 (0.40–1.22) | 0.206 |
| Session 4 (more than 8 years) | 16 (11%) | 12 (75.0%) | 1.14 (0.82–1.60) | 0.434 | 0.96 (0.57–1.61) | 0.865 |
| Relationship status | ||||||
| Single | 71 (49%) | 47 (66.2%) | 1 | |||
| Dating | 74 (51%) | 45 (60.8%) | 0.92 (0.72–1.18) | 0.501 | ||
| Family address | ||||||
| Metropolis | 115 (79.3%) | 16 (53.3%) | 1 | |||
| Others | 30 (20.7%) | 76 (66.1%) | 1.24 (0.87–1.78) | 0.242 | ||
| Transportation time (min) | ||||||
| Less than 30 min. | 105 (72.4%) | 74 (70.5%) | 1 | 1 | ||
| 30 to 60 min. | 30 (20.7%) | 13 (43.4%) | 0.61 (0.40–0.94) | 0.026 | 0.74 (0.52–1.04) | 0.080 |
| More than 60 min. | 10 (6.9%) | 5 (50.0%) | 0.71 (0.38–1.33) | 0.287 | 0.59 (0.30–1.14) | 0.118 |
| Family income (Thai Baht per month) | ||||||
| Less than 20,000 | 7 (4.8%) | 5 (71.4%) | 1 | |||
| 20,000-1000,000 | 88 (60.7%) | 58 (65.9%) | 0.92 (0.56–1.51) | 0.749 | ||
| More than 100,000 | 50 (34.5%) | 29 (58.0%) | 0.81 (0.48–1.37) | 0.436 | ||
| Learning resources | ||||||
| Internet Wi-Fi | 3 (2.1%) | 3 (100.0%) | 1 | |||
| Internet Computer | 11 (7.6%) | 6 (54.5%) | 0.69 (0.20–2.40) | 0.563 | ||
| Internet Computer iPad | 131 (90.3%) | 83 (63.4%) | 1 | |||
| Online learning attendance (% of total in class/ clinic) | ||||||
| Hybrid to complete online | 75 (51.7%) | 52 (69.3%) | 1 | |||
| No online learning | 70 (48.3%) | 40 (57.1%) | 1.07 (0.81–1.42) | 0.636 | ||
| Specialties of interest | ||||||
| Minor | 60 (31.9%) | 30 (50.0%) | 1 | 1 | ||
| Internal medicine | 35 (30.4%) | 32 (91.4%) | 1.83 (1.39–2.40) | <0.001 | 1.52 (1.14–2.03) | 0.005 |
| Obstetrics & Gynecology | 20 (15.4%) | 9 (45.0%) | 0.9 (0.52–1.55) | 0.706 | 0.54 (0.20–1.49) | 0.235 |
| Surgery | 17 (12.8%) | 11 (64.7%) | 1.29 (0.84–1.99) | 0.243 | 0.84 (0.34–2.08) | 0.709 |
| Pediatrics | 13 (9.5%) | 10 (76.9%) | 1.54 (1.04–2.27) | 0.031 | 0.98 (0.41–2.33) | 0.967 |
| Time for study (per day) | ||||||
| Less than 1 h | 68 (46.9%) | 42 (61.8%) | 1 | |||
| 1–2 h | 66 (45.5%) | 42 (63.6%) | 1.03 (0.79–1.34) | 0.823 | ||
| More than 2 h | 11 (7.6%) | 8 (72.7%) | 1.18 (0.84–1.99) | 0.432 | ||
| Learning style | ||||||
| Visual | 35 (24.1%) | 21 (60.0%) | 1 | 1 | ||
| Auditory | 24 (16.6%) | 15 (62.5%) | 1.04 (0.69–1.57) | 0.846 | 1.06 (0.74–1.52) | 0.743 |
| Reading | 13 (9%) | 8 (61.5%) | 1.03 (0.62–1.70) | 0.922 | 1.06 (0.68–1.67) | 0.798 |
| Kinetics | 53 (36.6%) | 34 (64.2%) | 1.07 (0.76–1.50) | 0.697 | 1.03 (0.75–1.41) | 0.853 |
| Mixed | 20 (13.7%) | 14 (70.0%) | 1.17 (0.79–1.73) | 0.444 | 1.18 (0.84–1.66) | 0.348 |
Univariate and multivariate logistic regression analyses of the factors associated with student high GPAX.
PR; prevalence rate, APR; adjusted prevalence rate, CI; confidence interval, BMI; body mass index, GPAX; accumulated grade point average, THB; Thai Baht.
Second, due to the hypothesis that multi-factors correlate with student outcomes, multidimensional data tools or unsupervised learning techniques were performed.
Cluster analysis was conducted using the k-Medoids algorithm, which was chosen for its capability to handle mixed data types (categorical and numerical) as required by our study. Clusters were generated from unlabeled data, with up to five clusters tested to optimize performance.
The optimal number of clusters was determined by evaluating the Davies-Bouldin (DB) index and the average within-centroid distance, aiming to achieve a balance between compactness within clusters and separation between clusters. The lowest DB index identified the optimal clustering structure, with two clusters achieving an acceptable balance of minimized within-cluster distance and maximized between-cluster distance. Based on these criteria, we selected and performed the analysis with two clusters, as shown in Table 4.
Table 4
| Performance Vector Numbers of clusters | 2 | 3 | 4 | 5 |
|---|---|---|---|---|
| Average within centroid distance: | 1.844 | 1.572 | 1.413 | 1.255 |
| Average within centroid distance_cluster_0: | 1.595 | 1.468 | 1.229 | 1.163 |
| Average within centroid distance_cluster_1: | 1.967 | 1.221 | 1.221 | 1.058 |
| Average within centroid distance_cluster_2: | 1.776 | 1.229 | 1.221 | |
| Average within centroid distance_cluster_3: | 1.674 | 1.602 | ||
| Average within centroid distance_cluster_4: | 1.429 | |||
| Davies Bouldin: | 0.086 | 0.091 | 0.09 | 0.098 |
Performance evaluation of the optimal number of clusters.
Study factors clustered into two groups, with detailed centroids shown in Table 5. A graphical centroid plot and a heat map, emphasizing learning styles, are shown in Figures 3, 4, respectively.
Table 5
| Attributes | Description | Cluster 0 | Cluster 1 |
|---|---|---|---|
| Gender | Female/male | Male | Male |
| Weight status | Underweight/ | Underweight | Underweight |
| Session | 1–4 | 2 | 1 |
| Relationship | Dating/single | Single | Single |
| Home address | Metropolis/others | Metropolis | Others |
| Transportation time | Min/day | Less than 30 min | Less than 30 min |
| Family income | THB/day | Less than 20,000 THB | Less than 20,000 THB |
| Learning resources Wi-Fi to iPad | Internet Wi-Fi, computer, iPad | Internet Wi-Fi, computer | Internet Wi-Fi, computer |
| Online learning attendance is less than classroom | Online-Hybrid/Onsite-classroom | Hybrid | Hybrid |
| GPAX (Pre-medical school) | 3.98 | 3.89 | |
| GPAX (Medical school) | 3.67 | 3.01 | |
| Specialties of interest | Medicine/ OB-GYN/ Pediatrics/ Surgery/ Others | Others | Surgery |
| Time for study less to more | Min/ day | 30–60 min | 30–60 min |
| Point_V | Point 0–16 | 2 | 4 |
| Point_A | Point 0–16 | 1 | 4 |
| Point_R | Point 0–16 | 5 | 5 |
| Point_K | Point 0–16 | 8 | 3 |
| Conclusion VARK | VARK | K | K |
Descriptive centroid table of cluster analysis.
V, visual; A, auditory; R, reading; K, kinesthetics.
Figure 3

Centroid plot of cluster analysis for all attributes. Created by RapidMiner Studio 10.1.3.
Figure 4
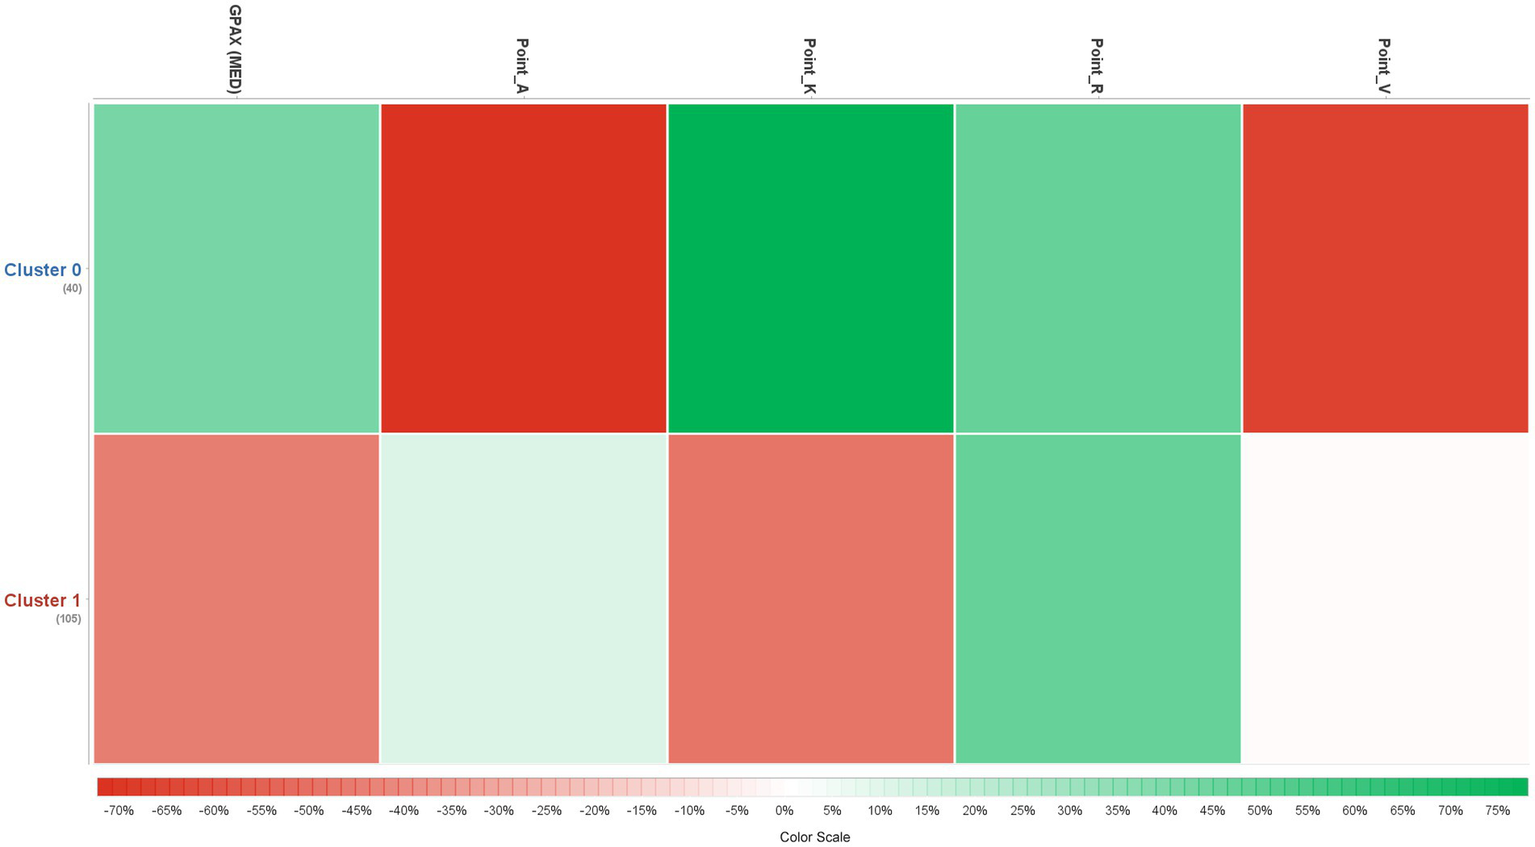
Heat map of cluster analysis of learning style. Created by RapidMiner Studio 10.1.3.
Cluster 0 (n = 48) has a smaller population, estimated to be one-third of the students. These students tended to perform at a high-grade level (GPAX = 3.67) and had home addresses in metropolis areas. Their baseline pre-med GPAX was higher (3.98), and their preferred learning style was kinesthetic (score = 8).
Cluster 1 (n = 97) was the largest, consisting of students who graduated earlier (session 1). Their academic performance fell within the low-grade range of the study (GPAX = 3.01), while their pre-med GPAX was slightly lower (3.89). They had home addresses outside of metropolis areas and showed interest in the field of surgery. The predominant learning style was not specific, but the highest score was associated with reading.
A comparison of the two clusters focusing on learning styles, as illustrated by the heat map in Figure 4, reveals distinct associations between learning styles and performance across the two clusters. Cluster 0 (higher-grade students) shows a stronger preference for kinesthetic learning (Point_K) but lower scores in auditory and visual styles (Points_A and V). Although both clusters exhibit a similar preference for reading (Point_R), Cluster 1 (lower-grade students) demonstrates a slightly higher association with auditory learning.
Association rule
From the association analysis, a total of 351 rules were generated. The selected rules, primarily screened based on lift (>1, indicating a positive independent association), are presented in Table 6. Lift is an important metric as it measures the strength of the relationship between the premise and the outcome, showing how much more likely the outcome is to occur when the premise holds true, compared to random chance. A lift greater than 1 indicates a meaningful positive association. The rule with the highest confidence was: {Metropolis address + transportation time less than 30 min + underweight} ⇒ high-grade student, with a confidence of 0.81 and lift of 1.34, indicating that these factors increase the likelihood of achieving a high grade.
Table 6
| Premises | Conclusion | Support | Confidence | Lift |
|---|---|---|---|---|
| Confidence > 0.8 | ||||
| Home address_metropolis, Transportation time = Less than 30 min., Weight status = Underweight | GPAX (MED)_High | 0.27 | 0.81 | 1.34 |
| Support > 0.3 | ||||
| Home address_metropolis, Transportation time = Less than 30 min. | GPAX (MED)_High | 0.41 | 0.76 | 1.25 |
| Learning resources = Internet Computer iPad, Home address_metropolis, Transportation time = Less than 30 min. | GPAX (MED)_High | 0.37 | 0.75 | 1.23 |
Selected association rules involving high GPAX in medical students.
The second rule, which had the highest support (indicating how frequently this combination of items appeared in the dataset), reinforced the first rule: {Metropolis address + transportation time less than 30 min} ⇒ high-grade student, with a support of 0.41 and lift of 1.25. Additionally, a third rule, although with slightly lower support, introduced a new factor related to learning resources: {Learning resources (e.g., internet, computer, and iPad) + metropolis address + transportation time less than 30 min} ⇒ high-grade student, with a support of 0.37 and lift of 1.23, highlighting the importance of access to educational tools.
Discussion
Our study successfully employed logistic regression, cluster analysis, and association rules to identify factors affecting academic success among medical students, with a particular focus on visualization techniques; it is illustrated in a tree framework (Figure 5). Each method provided unique insights, enhancing our understanding of how academic, demographic, environmental, and psychological factors interact to shape student outcomes.
Figure 5
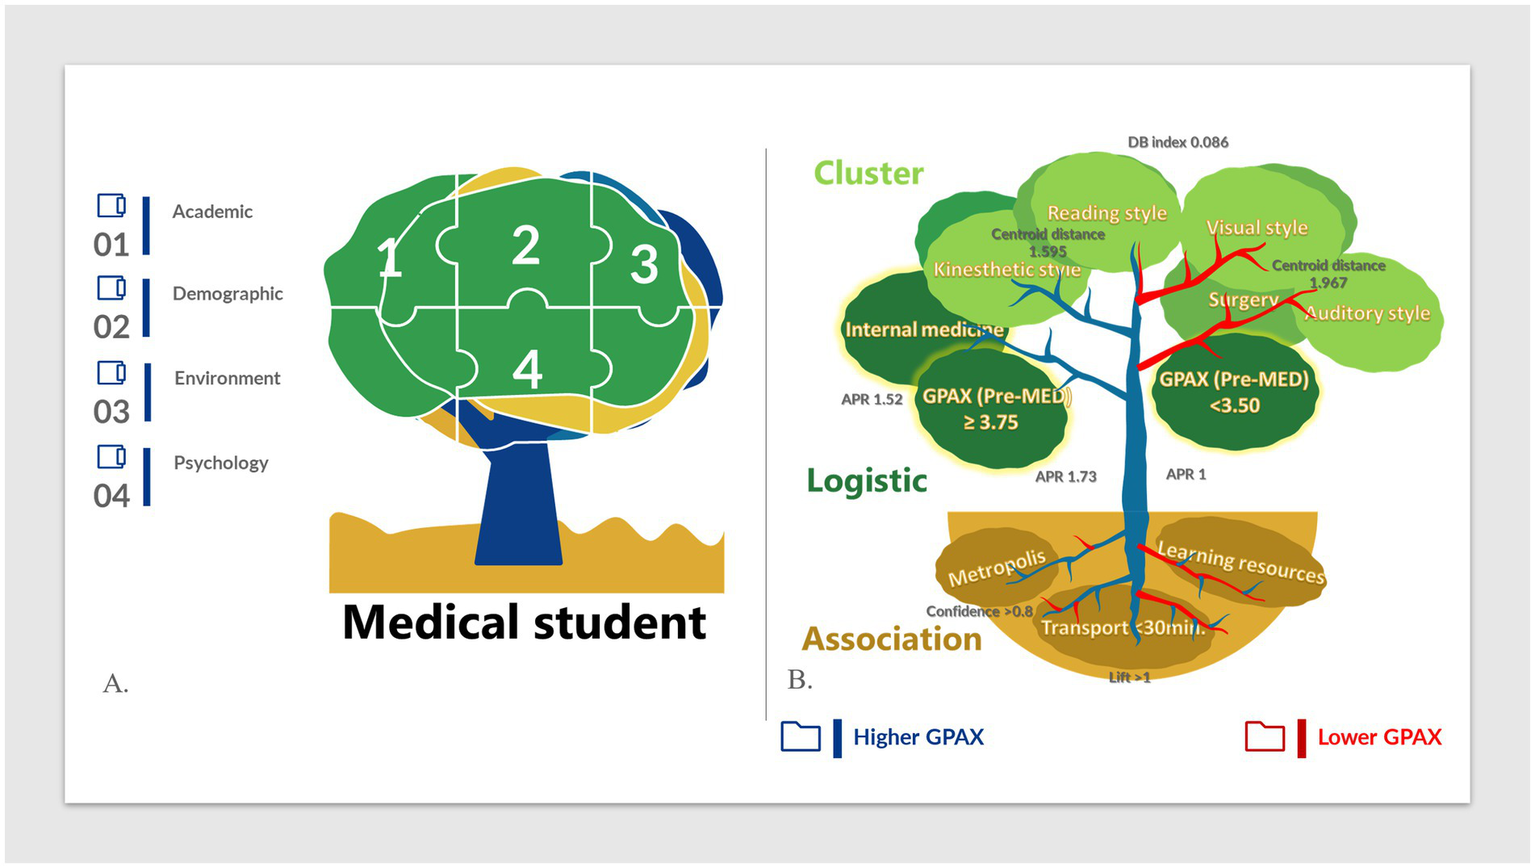
Visual tree framework for influential factors in medical student success (A) Overview of the four main study domains: academic, demographic, environmental, and psychological factors. (B) Visual representation of the relationships between academic performance and key factors identified through logistic regression, cluster analysis, and association rules. APR, adjusted prevalence rate; DB index, Davies-Bouldin index.
Logistic regression was applied to identify significant predictors of academic performance, with a pre-med GPAX of ≥ 3.75 and an interest in internal medicine emerging as statistically significant factors associated with higher grades (APR 1.73, p = 0.005; APR 1.52, p = 0.040, respectively). Margins analysis also showed a predicted mean GPAX (med) of 3.41 (p < 0.005) for students with a pre-med GPAX of ≥3.75. This finding aligns with previous research highlighting GPAX as a strong predictor of academic performance (Furnham and Monsen, 2009; Jacobparayil et al., 2022). While baseline GPAX is unchangeable, ongoing support and targeted interventions could benefit students with lower pre-med GPAX, emphasizing the need for early awareness and academic assistance. Additionally, motivation toward specialty choice was found to influence academic outcomes, with internal medicine showing a significant association. Strong correlations were observed between internal medicine and an intellectual, inquisitive, and ‘investigative’ personality profile, as identified through a validated 140-item questionnaire in a cluster analysis study (Sievert et al., 2016). This essentially suggests that the personality traits that draw students to internal medicine—such as intellectual curiosity and a preference for investigation—might also help them succeed in the cognitive assessments commonly used in medical education. This alignment could help explain why students interested in internal medicine tend to perform better academically. Similar associations between competitive specialties and academic performance have also been noted (Mitsouras et al., 2019). This may also reflect a supply–demand dynamic, where students motivated to pursue competitive fields with high academic standards work harder to achieve better grades. However, we recognize that personal preferences, experiences, and external factors can influence specialty choice and academic outcomes (Soethout et al., 2008). The above findings positively show the important role of factors in “academic activities.” However, we found no statistical relevance to demographic, environmental, or psychological factors. Interestingly, the finding of irrelevance of learning style and high-grade students, referring to high-performing students, indicates that they may have different ways of learning. Similar results have been reported in studies involving dental and medical students, including a larger cohort of 600 medical students (Mozaffari et al., 2020; Almigbal, 2015). Notably, subgroup analysis found that 40% (14 in 35) of high-grade students who were interested in medicine had a K learning style and achieved high grades. Similarly, other studies conducted involving medical students from Thailand and Saudi Arabia have suggested that specific learning styles are associated with higher achievement. Those were sequential learning or logical sequencing patterns and visuality (Jiraporncharoen et al., 2015; Al Fhaid et al., 2022). These contrasting results highlight the need for teachers to recognize that “everyone cannot be taught the same way” when designing classroom interventions and environments (Shakeri et al., 2022).
However, we acknowledge that focusing solely on these two factors might oversimplify the complexity of academic success, as other potential influences were excluded due to a lack of statistical significance. This limitation indicates the need for additional methods to capture multidimensional factors beyond simple predictive models.
Utilizing cluster analysis to address the limitations of LR, we employed cluster analysis on unlabeled data, grouping students based on shared characteristics without predefined academic performance labels. This exploratory approach allowed us to uncover patterns within each cluster and then observe performance trends. We could identify typical characteristics of the high-grade group, which included residing in a metropolis, achieving a very high GPAX during pre-med, and a strong preference for kinesthetic learning, followed by the reading learning style. While the first two factors are non-modifiable, the discovery of kinesthetic learning style as a key factor in high-grade success is noteworthy. In contrast to the lower grade group, various types with slightly higher reading styles but very low K-style were investigated. This revealed a very high-grade cluster (GPAX centroid of 3.67), and K-style might be an interesting key factor in its success. As medical programs require both knowledge and skill, we assume that students approach their learning through a combination of reading and hands-on learning to effectively prepare students for the medical curriculum and lead to an honors degree. This aligns with the concept that medicine is not solely about scientific knowledge but also knowledge-driven practice or kinesthetic skill (De Camargo, and Jr. Coeli, 2006). However, this theory should be applied cautiously, as observational studies using questionnaire reports that study strategies based on VARK results showed no correlation with anatomy course outcomes (Husmann and O'Loughlin, 2019).
Finally, association analysis discovered informative rules emphasizing the importance of transportation time to school and access to learning resources, highlighting the significance of institutional resources in facilitating student knowledge acquisition.
Exploring individual learning styles can empower students to understand their strengths and preferences, aligning with Howard Gardner’s theory of multiple intelligences, which emphasizes that learners excel through different modalities (Durie, 1997; Hopper and Hurry, 2000). Recognizing one’s learning style can encourage self-directed learning, as outlined in constructivist theories, where students actively build understanding through engagement with content and adapt to the academic environment (Vygotsky, Piaget’s theories) (Blake, 2008). Incorporating learning styles into lesson planning may enhance students’ ability to relate to and comprehend material, fostering deeper and faster practical application. This aligns with Kolb’s experiential learning cycle, specifically the active experimentation phase, where learners apply new knowledge to real-world scenarios, cultivating skills for lifelong learning (Kolb, 2014).
For Teachers: We advocate for a tailored, student-centered approach to address diverse learning needs.
Similar to colors, students possess unique “hues” or learning styles, and by recognizing these differences, educators can implement varied instructional strategies to support and actualize each student’s potential. Howard Gardner’s theory of multiple intelligences supports this perspective, encouraging instructors to pluralize their teaching and assessment methods, thereby enriching student learning by addressing multiple modalities (Durie, 1997; Hopper and Hurry, 2000). Teachers can make learning more effective and inclusive by investing time to understand each learner’s style and implementing multi-modality instructional methods, from passive (reading, auditory lectures) to active (kinesthetic activities, simulations, and role-play).
Dale’s Cone of Experience reinforces this approach, demonstrating that hands-on and participatory methods often lead to better retention and understanding (Dale, 1969; Amin and Khoo, 2003). This strategy aligns with constructivist and humanistic theories, which emphasize active, collaborative, and context-rich learning for self-actualization. For example, problem-based learning (PBL) encourages students to engage in real-world problem-solving, deepening their understanding. Humanistic theories also advocate for a nurturing environment that fosters personal development and self-determination, underscoring the importance of adaptive, flexible teaching strategies (Blake, 2008; Brockett, 1996). Additionally, connectivism suggests that students in the digital age benefit from continually updating knowledge and connecting new and existing information, making a pluralistic approach even more relevant (Duke et al., 2013).
Finally, institutions are pivotal in supporting student success by modifying environmental factors. Reducing transportation time and enhancing access to learning resources, such as digital tools and quiet study spaces, can positively impact academic outcomes. Maslow’s hierarchy of needs suggests that meeting students’ basic needs (e.g., safe and accessible study environments) can facilitate higher-order achievements such as academic success. This aligns with humanistic theory, which highlights the role of a supportive and nurturing environment in fostering learning. When students have access to essential resources, they are more likely to engage fully with their studies, potentially achieving self-actualization as lifelong learners (Brockett, 1996).
The strength of our study lies in the introduction of two unique analytical techniques—logistic regression and data mining—which enabled us to identify both statistically significant factors and meaningful hidden patterns. To the best of our knowledge, this is the first research to use multidomain factors to investigate medical students’ academic success, analyzing them with these techniques and emphasizing visualization.
Our study has several limitations. As a retrospective study relying on medical students’ recollections of experiences, recall bias may be present. We sought to reduce this by limiting the number of recall questions, focusing on specific periods within the 6-year medical program to improve accuracy. Additionally, reliance on self-reported data introduces potential recall and social desirability biases. To mitigate recall bias, we designed clear and specific questions, especially for demographic and environmental factors, and pre-tested the questionnaire to enhance reliability. To reduce social desirability bias, we assured participants of confidentiality and included disclaimers to encourage honesty. Another limitation relates to our sample composition. The study’s focus and title may have attracted high-achieving students, potentially skewing the prevalence of high GPAX students in our sample and impacting representativeness. However, as our primary objective was to examine associations between factors, we believe this limitation only minimally affects the findings. Another limitation that could confound the outcome was the variation of students’ graduation years and other uncontrolled external factors such as scoring, teamwork, or health issues. However, multivariate analysis using a session period as a training course was believed to eliminate one confounder. Noteworthy that our populations might not truly represent the general medical student population, and further research is planned to investigate different universities and regions of the country. Future research may benefit from larger, more diverse datasets to enhance robustness and enable external validation, supporting broader generalizability. Additionally, advanced methods like hierarchical clustering and SVMs could uncover nuanced patterns and complex relationships, providing further insights for educational programs and decision-making.
Conclusion
By utilizing three analytical methods, we identified key factors influencing medical students’ academic success. Logistic regression highlighted pre-med GPAX and an interest in internal medicine as significant predictors. Cluster analysis revealed distinct learning style patterns, with high-grade students favoring kinesthetic and reading styles, while lower-grade students preferred auditory and visual styles. Association rules emphasized the role of environmental factors, such as proximity to school and access to resources, in supporting academic outcomes. Together, these findings underscore the importance of a holistic approach in educational planning that considers learning preferences, personal interests, and supportive environments.
In summary, a multi-domain framework in educational planning can foster more effective and personalized learning experiences. By addressing individual learning styles, adaptive teaching strategies, and supportive environments, institutions can better equip medical students to achieve their academic and professional goals.
Statements
Data availability statement
The raw data supporting the conclusions of this article will be made available by the authors, without undue reservation.
Ethics statement
The studies involving humans were approved by the Royal Thai Army Medical Department Institutional Review Board. The studies were conducted in accordance with the local legislation and institutional requirements. The participants provided their written informed consent to participate in this study.
Author contributions
PR: Conceptualization, Data curation, Formal analysis, Investigation, Methodology, Project administration, Software, Visualization, Writing – original draft, Writing – review & editing. CT: Writing – original draft, Writing – review & editing, Methodology, Project administration. BS: Writing – review & editing. AP: Formal analysis, Investigation, Methodology, Software, Supervision, Validation, Visualization, Writing – review & editing.
Funding
The author(s) declare that no financial support was received for the research, authorship, and/or publication of this article.
Acknowledgments
The authors express their sincere gratitude to Akara, Boonsub, and Chulaluck for their contributions to the study design, hypothesis development, data interpretation, and manuscript revision. Additionally, we thank the Department of Obstetrics and Gynecology, Phramongkutklao College of Medicine, for their support in completing this study and acknowledge RapidMiner Studio 10.1.3 as the data mining tool. Special thanks to Dr. Molly for her warmhearted support and invaluable guidance during challenging times.
Conflict of interest
The authors declare that the research was conducted in the absence of any commercial or financial relationships that could be construed as a potential conflict of interest.
Publisher’s note
All claims expressed in this article are solely those of the authors and do not necessarily represent those of their affiliated organizations, or those of the publisher, the editors and the reviewers. Any product that may be evaluated in this article, or claim that may be made by its manufacturer, is not guaranteed or endorsed by the publisher.
References
1
AgrawalRImielińskiTSwamiA, editors. Mining association rules between sets of items in large databases. Proceedings of the 1993 ACM SIGMOD international conference on management of data; (1993).
2
AkogluH. (2018). User's guide to correlation coefficients. Turk J Emerg Med.18, 91–93. doi: 10.1016/j.tjem.2018.08.001
3
Al FhaidFSamiWAlzahraniMKZaid AljulifiMAhmed AlmufarrihYIbrahim AlaqilAK. (2022). The study of learning styles among medical students at Majmaah university, Saudi Arabia. 13, 270–277.
4
AleemAGoreMM, editors. Educational data mining methods: A survey. 2020 IEEE 9th international conference on communication systems and network technologies (CSNT. 10–12. (2020).
5
AlmigbalT. H. (2015). Relationship between the learning style preferences of medical students and academic achievement. Saudi Med. J.36, 349–355. doi: 10.15537/smj.2015.3.10320
6
AlyahyanE.DüştegörD. (2020). Predicting academic success in higher education: literature review and best practices. Int. J. Educ. Technol. High. Educ.17, 1–21. doi: 10.1186/s41239-020-0177-7
7
AminZ.KhooH. E. (2003). Basics in medical education. Singapore: World Scientific.
8
BaasharYAlkawsiG, NaAliAlhussianHBahbouhHT, editors. Predicting student’s performance using machine learning methods: a systematic literature review. 2021 international conference on Computer & Information Sciences (ICCOINS); (2021).
9
BealCRQuLLeeH, editors. Classifying learner engagement through integration of multiple data sources. Proceedings of the National Conference on artificial intelligence; (2006) 1999.
10
BergmanL. R.MagnussonD.El KhouriB. M. (2003). Studying individual development in an interindividual context: A person-oriented approach. Mahwah (NJ): Lawrence Erlbaum Associates.
11
BlakeB. (2008). Developmental psychology: Incorporating Piaget’s and Vygotsky’s theories in classrooms. J. Cross-Disciplinary Perspect. Educ. 1, 59–67.
12
BrockettRG. editor (1996). Humanistic adult education: a critical appraisal. Annual adult education research conference proceedings.
13
CoxD. R. (1958). The regression analysis of binary sequences. J. Royal Statis. Soc. Series B20, 215–232. doi: 10.1111/j.2517-6161.1958.tb00292.x
14
CrispG.TaggartA.NoraA. (2015). Undergraduate Latina/o students: a systematic review of research identifying factors contributing to academic success outcomes. Rev. Educ. Res.85, 249–274. doi: 10.3102/0034654314551064
15
DaleE. (1969). Audiovisual methods in teaching. 3rd ed. New York: Dryden Press.
16
DaviesD. L.BouldinD. W. (1979). A cluster separation measure. IEEE Trans. Pattern Anal. Mach. Intell.PAMI-1, 224–227. doi: 10.1109/TPAMI.1979.4766909
17
De CamargoK.Jr CoeliC. M. (2006). Theory in practice: why "good medicine" and "scientific medicine" are not necessarily the same thing. Adv. Health Sci. Educ. Theory Pract.11, 77–89. doi: 10.1007/s10459-005-6924-7
18
DukeB.HarperG.JohnstonM. (2013). Connectivism as a digital age learning theory. Int. HETL Rev.2013, 4–13.
19
DurieR. (1997). An interview with Howard Gardner. Mindshift Connection: Multiple Intelligence. Tucson (AZ): Zephyr Press.
20
ForoughiF.LukschP. (2018). Data science methodology for cybersecurity projects [Internet]. arXiv. Available from: https://arxiv.org/abs/1810.10547
21
FurnhamA.MonsenJ. (2009). Personality traits and intelligence predict academic school grades. Learn. Individ. Differ.19, 28–33. doi: 10.1016/j.lindif.2008.02.001
22
HellasAIhantolaPPetersenAAjanovskiVVGuticaMHynninenTet al., editors. Predicting academic performance: A systematic literature review. Proceedings companion of the 23rd annual ACM conference on innovation and technology in computer science education; (2018).
23
HindinD. I.MazzeiM.ChandragiriS.DuBoseL.ThreetonD.LassaJ.et al. (2023). A National Study on training innovation in US medical education. Cureus.15:e46433. doi: 10.7759/cureus.46433
24
HofmannM.KlinkenbergR. (2016). RapidMiner: Data mining use cases and business analytics applications. Boca Raton (FL): CRC Press.
25
HopperB.HurryP. (2000). Learning the MI way: the effects on students’ learning of using the theory of multiple intelligences. Pastoral Care Educ.18, 26–32. doi: 10.1111/1468-0122.00176
26
HusmannP. R.O'LoughlinV. D. (2019). Another nail in the coffin for learning styles? Disparities among undergraduate anatomy students’ study strategies, class performance, and reported VARK learning styles. Anat. Sci. Educ.12, 6–19. doi: 10.1002/ase.1777
27
JacobparayilA.AliH.PomeroyB.BaroniaR.ChavezM.IbrahimY. (2022). Predictors of performance on the United States medical licensing examination step 2 clinical knowledge: a systematic literature review. Cureus.14:e22280. doi: 10.7759/cureus.22280
28
JiraporncharoenW.AngkurawaranonC.ChockjamsaiM.DeesomchokA.EuathrongchitJ. (2015). Learning styles and academic achievement among undergraduate medical students in Thailand. J Educ Eval Health Prof.12:38. doi: 10.3352/jeehp.2015.12.38
29
KDnuggets. RapidMiner Named a Leader in the 2016 Gartner Magic Quadrant for Advanced Analytics Platforms. (2016). Available at:https://www.kdnuggets.com/2016/02/rapidminer-leader-2016-gartner-mq-advanced-analytics-platforms.html.
30
KolbD. A. (2014). Experiential learning: Experience as the source of learning and development. 2nd ed. Upper Saddle River (NJ): FT press.
31
KuhG. D.KinzieJ. L.BuckleyJ. A.BridgesB. K.HayekJ. C. (2006). What matters to student success: A review of the literature. Washington, DC: National Postsecondary Education Cooperative.
32
McGaghieW. C. (2019). America’s best medical schools: a renewed critique of the U.S. news & world report rankings. Acad. Med.94, 1264–1266. doi: 10.1097/ACM.0000000000002742
33
MitsourasK.DongF.SafaouiM. N.HelfS. C. (2019). Student academic performance factors affecting matching into first-choice residency and competitive specialties. BMC Med. Educ.19:241. doi: 10.1186/s12909-019-1669-9
34
MozaffariH. R.JanatolmakanM.SharifiR.GhandinejadF.AndayeshgarB.KhatonyA. (2020). The relationship between the VARK learning styles and academic achievement in dental students. Adv. Med. Educ. Pract.11, 15–19. doi: 10.2147/AMEP.S235002
35
NguyenL. (2013). A new approach for modeling and discovering learning styles by using the hidden markov model. Global journal of human social science. Ling. Educ.13, 1–10.
36
PeiJ. (2009). “Association rules” in Encyclopedia of database systems. eds. LiuL.MTÖ. Z. (Boston, MA: Springer US), 140–142.
37
PetersenM. R.DeddensJ. A. (2008). A comparison of two methods for estimating prevalence ratios. BMC Med. Res. Methodol.8:9.
38
RollinsJ. (2015). Why we need a methodology for data science [Internet]. Why we need a methodology for data science, vol. 1, 2017. Available from: https://www.ibmbigdatahub.com/blog/why-we-need-methodology-data-science
39
SalemR. O.Al-MouslyN.NabilN. M.Al-ZalabaniA. H.Al-DhawiA. F.Al-HamdanN. (2013). Academic and socio-demographic factors influencing students' performance in a new Saudi medical school. Med. Teach.35, S83–S89. doi: 10.3109/0142159X.2013.765551
40
ShakeriF.GhazanfarpourM.MalakotiN.Soleimani HouniM.RajabzadehZ.SaadatS. (2022). Learning styles of medical students: a systematic review. Med. Educ. Bull.3, 435–450.
41
SievertM.ZwirI.CloningerK. M.LesterN.RozsaS.CloningerC. R. (2016). The influence of temperament and character profiles on specialty choice and well-being in medical residents. PeerJ.4:e2319. doi: 10.7717/peerj.2319
42
SoethoutM. B.HeymansM. W.Ten CateO. T. J. (2008). Career preference and medical students’ biographical characteristics and academic achievement. Med. Teach.30, e15–e22. doi: 10.1080/01421590701759614
43
SyD.QueX. (2019). Research on the teaching assessment of students of science and engineering teachers in a university. Comput. Appl. Eng. Educ.27, 5–12. doi: 10.1002/cae.22051
44
ZimmermannJ.BrodersenK. H.HeinimannH. R.BuhmannJ. M. (2015). A model-based approach to predicting graduate-level performance using indicators of undergraduate-level performance. J. Educ. Data Mining7, 151–176.
Summary
Keywords
educational data mining, medical student, logistic regression, unsupervised learning techniques, visualization techniques
Citation
Rueangket P, Thaebanpakul C, Sakboonyarat B and Prayote A (2024) Educational data mining: factors influencing medical student success and the exploration of visualization techniques. Front. Educ. 9:1390892. doi: 10.3389/feduc.2024.1390892
Received
24 February 2024
Accepted
18 November 2024
Published
19 December 2024
Volume
9 - 2024
Edited by
Michael Kickmeier-Rust, University of Teacher Education St. Gallen, Switzerland
Reviewed by
Can Mese, Kahramanmaraş Istiklal University, Türkiye
Ashraf Alam, Indian Institute of Technology Kharagpur, India
Updates
Copyright
© 2024 Rueangket, Thaebanpakul, Sakboonyarat and Prayote.
This is an open-access article distributed under the terms of the Creative Commons Attribution License (CC BY). The use, distribution or reproduction in other forums is permitted, provided the original author(s) and the copyright owner(s) are credited and that the original publication in this journal is cited, in accordance with accepted academic practice. No use, distribution or reproduction is permitted which does not comply with these terms.
*Correspondence: Ploywarong Rueangket, ploywarong.24@gmail.com
Disclaimer
All claims expressed in this article are solely those of the authors and do not necessarily represent those of their affiliated organizations, or those of the publisher, the editors and the reviewers. Any product that may be evaluated in this article or claim that may be made by its manufacturer is not guaranteed or endorsed by the publisher.