Abstract
The higher education sector is a dynamic and competitive environment where service quality plays a crucial role. Higher education institutions must continuously enhance their service quality in the current competitive landscape. This quantitative study examines perceived service quality’s effect on student satisfaction at Khoja Akhmet Yassawi University in Kazakhstan. The study data were collected with SERVQUAL, and Covariance Structural Equation Modeling (CB-SEM) was employed to test the research hypotheses. The CB-SEM findings confirmed the impact of perceived service quality on student satisfaction. It was found that students were generally satisfied with the university facilities. The findings could assist the university, and by extension, the entire higher education industry, in improving its strategic plans to increase student satisfaction and overall institutional performance. Thus, service quality significantly impacts student satisfaction in higher education, and higher education institutions, including yours, should be aware of the dimensions of service quality that affect student satisfaction.
Introduction
Higher education (HE) is one of the most competitive sectors within the service industry (Hoque et al., 2023). While numerous studies have explored service quality in higher education (Brochado, 2009), defining quality remains complex in the HE context (Giannakis and Bullivant, 2016). The higher education environment is a highly competitive market with high service quality (Bhuian, 2016). The service quality in HE institutions is important in the analysis of the performance and competitiveness of a university (Štimac and Šimić, 2012). Service quality is a critical determinant of success in HE institutions (Hill, 1995). Alves and Raposo (2007) reported that service quality in education and higher education is a significant component of educational excellence. The concept of quality in education was also described as “excellence in education” (Yılmaz et al., 2007). Service quality in education is a continuous process that evolves over time as universities continuously improve services for the same customers (students) (Nikel and Lowe, 2010). This constant nature of service quality allows the service providers to improve service delivery over time. In higher education, quality management applications are considered to ensure high HE performance and good customer service (Sohail et al., 2003). Since HEs compete to provide high service quality, analyzing the service quality in education is vital in determining the efficacy of educational plans and practices and motivating the institutions. De Jager and Gbadamosi (2010) suggested that service quality in higher education could be determined by the degree to which stakeholders’ needs and expectations are met. Okunoye et al. (2008) emphasized that fulfilling the needs and expectations of stakeholders and policies consistent with their values were significant competitive factors for success.
Quality in HE is relative based on the priorities of various stakeholders (P. Green, 2014; Toscano-Hernández et al., 2024). One of the primary and challenging stages in improving service quality is the identification of the main stakeholders (Jongbloed et al., 2008). Institutional stakeholders include individuals or groups of individuals who could influence the institution or its objectives (Alves and Raposo, 2007). Administrative staff, faculty members, and students are considered the main stakeholders of higher education institutions (Okunoye et al., 2008). Naturally, students are the “primary stakeholders” or “principal customers” (Hill, 1995; Abdullah, 2006a; Abdullah, 2006b; Chanaka Ushantha and Samantha Kumara, 2016; Mestrovic, 2017), and student satisfaction is considered a potential indicator of service quality (Abdullah, 2006a). Student satisfaction plays a vital role in developing current and better services in educational institutions (Darawong and Sandmaung, 2019). Zhu and Sharp (2022) described the students as the “principal customers” in higher education and emphasized that quality should be analyzed based on student views. Student perceptions about the quality of the services significantly affect their satisfaction. Service quality is considered a significant factor affecting students’ decisions when selecting a higher education institution (Darawong and Sandmaung, 2019). Service quality in higher education was described as the difference between the service the students desire and their actual perception of the service (O’Neill and Palmer, 2004). Weerasinghe et al. (2017) reported that student satisfaction could be considered a short-term attitude (Elliott and Healy, 2001) that develops as a result of students’ views on educational experiences, services, and facilities. Service quality is vital in predicting student satisfaction and determining behavioral intent (Prakash, 2018). Comprehension and management of student expectations are significant underliers of service quality (Zhu and Sharp, 2022).
The correlation between perceived service quality and student satisfaction have been discussed in the literature with conventional approaches (Wider et al., 2024). E-learning, which was rapidly adopted in education during the Covid-19 pandemic (Rajeh et al., 2021), has changed the HEIs and the original models employed to measure service quality. Blended e-learning, which has taken over global higher education, led to the diversification of student perceptions about service quality. The perceived service quality by the students about digital integration (Ban et al., 2024) in HEIs was analyzed based on the impact of several constructs such as perceived e-learning service quality (Alterkait and Alduaij, 2024; Ban et al., 2024; Dangaiso et al., 2022), perceived m-learning quality (Lu et al., 2024; Zaidi et al., 2023), offline service quality, blended learning (Seo and Um, 2023), digital competence of instructors (Elm and Liljestrand, 2024; Guillén-Gámez et al., 2024), student beliefs about mobile learning tools (Mgeni et al., 2024; Talan et al., 2024; Tarhini et al., 2024), information quality (Alterkait and Alduaij, 2024), website design, learning content (Sumi and Kabir, 2021) and security (Zaidi et al., 2023).
The need to understand the factors affecting student satisfaction has increased. Higher education institutions increasingly realize the need to improve institutional activities to facilitate student perceptions and satisfy their expectations. Although several studies have been conducted on service quality in Kazakh higher education, there are still gaps in the literature. The present study focused on analyzing service quality at Khoja Akhmet Yassawi International Kazakh-Turkish University, an international university located in Kazakhstan, based on SERVQUAL. The study aimed to measure service quality and student satisfaction. The causality between the service quality and student satisfaction dimensions was discussed based on a structural model. The study findings were anticipated to assist higher education policymakers and administrators in Kazakhstan in improving the quality of services and student satisfaction in HE institutions.
In this context, the primary research questions of this study are as follows:
This study aims to ascertain how service quality dimensions, including reliability, responsiveness, assurance, empathy, and tangible elements, influence student satisfaction.
What are the causal relationships between service quality dimensions and student satisfaction?
What are the students’ perceptions and satisfaction levels regarding the quality of services provided at Khoja Akhmet Yassawi International Kazakh-Turkish University?
The responses to these research questions will facilitate an understanding of the influence of service quality on students’ overall satisfaction and the formulation of recommendations for practices within the Kazakh higher education system in this context.
Quality of service in higher education
Quality is defined as the user’s or consumer’s service evaluation. The quality construct conceptualized in the service literature was derived from perceived quality. Perceived quality was the consumers’ judgment about their overall experiences with or the superiority of an asset (Zammuto et al., 1996). Quality of service is “the difference between consumer perceptions about the services provided by a particular corporation and their expectations from these corporate services” (Parasuraman et al., 1988). This definition implies that the quality of a service could be measured but only analyzed based on the perceptions of the customers who purchased that service. Parasuraman et al. (1990) argued that consumer perceptions about service quality depend on comparing previous expectations from and actual experiences with the service. Perceived quality is an attitude associated with satisfaction but still different from satisfaction, derived from the comparison of expectations and experiential perceptions (Rowley, 1996). The extent and direction of the gap between the expected and actual perceived services determine service quality (Parasuraman et al., 1985). The consistency between the level of service and customer expectations mainly determines quality. Service quality is critical since it directly affects the service provider’s image (Lien et al., 2017). Service quality is an attitude where expectations are compared with the actual performance, which is associated with satisfaction (Cronin and Taylor, 1994). Quality of service is a significant measure of educational excellence and a strategic factor for improving competitive advantages (Manea, 2014), service quality is the degree to which customer expectations are met. Service quality is a precursor to satisfaction (Cronin and Taylor, 1992), and there is a correlation between these two variables.
Service quality is especially crucial for success in education and instruction. The approach to higher education as a “service” has been debated (Bunce et al., 2017; Jabbar et al., 2018; Wolfe, 2020; Zhu and Sharp, 2022). “Service quality and higher education” was associated with analyzing and improving the quality of services provided by higher education institutions. Service quality in higher education aims to determine the extent to which the services provided meet the stakeholders’ expectations and how the former affects stakeholder satisfaction. Expected levels of service quality could lead to excellence in the education industry. Service quality could lead to lasting effects on both the institution and its stakeholders (Darawong and Sandmaung, 2019).
Student satisfaction
Satisfaction is a summary of a psychological state where the emotion about non-met expectations is combined with previous emotions of the consumers about that consumption experience (Oliver, 1981). Satisfaction is associated with the perceptual analysis of individuals who utilize a service (Oliver, 1999). Satisfaction is a function of the relative state of the expectations and perceived performance. Kolter and Clarke (1987) satisfaction is an emotion consumers feel when a performance or experience meets their expectations.
The satisfaction of the students with the quality of educational services is a crucial indicator of the performance of higher education institutions (De Oliveira Santini et al., 2017; Wong and Chapman, 2023). Service quality is a significant factor that improves student satisfaction and loyalty (Helgesen and Nesset, 2007). For the students, service quality depends on their expectations from the delivery of HE services (Bahadur et al., 2024; O’Neill and Palmer, 2004). Service quality in higher education is the degree to which the needs and expectations of higher education students are met by the colleges they attend.
Satisfaction level directly depends on the clarity of student expectations and whether these expectations are met. Student satisfaction can be interpreted as pleasure and satisfaction, and students feel relief from the physical and non-physical services provided during their education (Green et al., 2015). It is known that quality of service directly affects student satisfaction (Kajenthiran and Karunanithy, 2015). Student satisfaction is affected by the difference between student expectations and university conditions (Rahmawati, 2013), and it is a short-term attitude based on the evaluation of educational experiences (Elliott and Healy, 2001). The main factor that affects service quality is the difference between the expected and perceived service levels. When the service quality is consistent with student expectations, it would be perceived well. Otherwise, the service quality will be perceived as poor. Student perceptions about service quality could lead to student satisfaction, which is a significant criterion for a university’s overall performance (Hwang and Choi, 2019). Therefore, the quality of service is determined by the service provider’s capacity to fulfill student expectations consistently. Student satisfaction could be measured by investigating whether the actual performance meets or exceeds student expectations (Elliott and Healy, 2001). Student satisfaction is the emotion of satisfaction with their experiences in the university, and it is positive when their expectations are met or exceeded (Schreiner and Nelson, 2013; Stankovska et al., 2024).
Previous studies employed several models to investigate quality of service and student satisfaction. SERVQUAL is the most common service quality model used in the literature to measure student satisfaction with quality of service.
Measurement of the quality of service
In the literature on educational service quality, various instruments have been utilized to assess service quality. Among these are SERVQUAL - Service Quality (Parasuraman et al., 1988), SERVPERF - Service Performance (Cronin and Taylor, 1994), HedPERF - Higher Education Performance Scale (Abdullah, 2006a), the combined SERVPERF–HedPERF scale (Abdullah, 2006b). The SERVQUAL scale was developed by Parasuraman et al. (1985, 1988, 1990) in consequent studies to measure consumer service quality perceptions. SERVQUAL is a flexible scale that could be employed in several service industries. SERVQUAL is the golden standard in measuring service quality in several fields that provides a baseline to analyze and improve service quality (Dado et al., 2011). SERVQUAL, short for service quality, is a multidimensional measurement instrument designed to predict consumer expectations and perceptions in five dimensions. SERVQUAL includes the tangibles, reliability, responsiveness, assurance, and empathy dimensions (Parasuraman et al., 1988) SERVQUAL determines customer expectations and perceptions and calculates the difference between them, which is called the service gap. The difference’s positive or negative direction indicates the service quality trend. Thus, the instrument measures service quality based on the expectation-discrepancy paradigm, where customers confirm or reject prior expectations based on actual perceptions after consumption.
Literature review: SERVQUAL
Several studies conducted in various countries employed SERVQUAL to analyze service quality in higher education based on student perceptions. Several studies employed SERVQUAL dimensions to analyze educational service quality (Abd Rashid et al., 2021; Aghamolaei and Zare, 2008; Annamdevula and Bellamkonda, 2016; Asaduzzaman et al., 2013; Ayaz and Arakaya, 2019; Budiyanti et al., 2020; Chen et al., 2023; Cuthbert, 1996a, 1996b; Darawong and Sandmaung, 2019; Devebakan et al., 2019; Đonlagić and Fazlić, 2015; Douglas et al., 2006; Enakrire et al., 2022; Fitri et al., 2008; Fuchs and Fangpong, 2021; Galeeva, 2016; Goumairi et al., 2020; Green, 2014; Khodayari and Khodayari, 2011; McAdam and Welsh, 2000; Mostafa, 2006; Pariseau and McDaniel, 1997; Prasad and Singh, 2022; Prugsamatz et al., 2007; Rolo et al., 2023; Rozak et al., 2022; Șerban and Stoian, 2019; Shahjalal et al., 2021; Sibai et al., 2021; Soares et al., 2017; Twum and Peprah, 2020; Zafiropoulos and Vrana, 2008).
Cuthbert (1996a) suggested that SERVQUAL was an adequate tool to measure service quality in higher education institutions. LeBlanc and Nguyen (1997) developed a 38-item tool based on SERVQUAL to measure service quality in business education based on the data collected from 338 students. Galloway (1998), measured perceived quality in two groups, including academic and administrative staff and college students, using a SERVQUAL-based questionnaire. They reported significant differences between the perceived quality dimensions perceived by internal and external stakeholders. Li and Kaye (1998) employed two alternative approaches (SERVQUAL and SERVPREF) to measure perceived service quality. Statistical findings demonstrated that SERVPREF was a better instrument when compared to SERVQUAL in terms of student satisfaction and the overall quality of the course. Ruby (1998) employed SERVQUAL to determine student satisfaction with four assistance services provided by HE institutions (academic records, admissions, career services, and financial aid).
Oldfield and Baron (2000) investigated student perceptions about service quality in higher education with a performance-based version of SERVQUAL. O’Neill and Palmer (2004) conducted a longitudinal study with SERVQUAL to determine the effect of time on student perceptions of service quality. Sahney et al. (2004) employed SERVQUAL and QFD to determine the total quality of Indian education. SERVQUAL methodology was adopted to determine the gap between the expectations and perceptions of the students about the actual services, and the authors employed the QFD technique to determine the minimum design features and quality components that would help meet student needs considered as the customers in the education industry. Chua (2004) employed SERVQUAL to determine the attitudes of academic stakeholders. The findings suggested that SERVQUAL dimensions were mainly associated only with the “process” phase of the “context, input, process, and product (CIPP)” approach. Sherry et al. (2004) employed the SERVQUAL model to determine the service perceptions of international students. They reported that the SERVQUAL model was a useful baseline for measuring educational quality; however, certain areas of concern should be analyzed further. Tan and Kek (2004) presented a new and improved SERVQUAL approach to measure engineering students’ satisfaction at two universities in Singapore.
Yang et al. (2006) emphasized the significance of SERVQUAL application in Chinese educational institutions. The study redesigned SERVQUAL to analyze the service quality in Chinese higher education. Barnes (2007) employed a modified SERVQUAL to investigate the service quality expectations and perceptions of Chinese postgraduate students in the UK. Yılmaz et al. (2007) studied the difference between the expected and perceived service performance of science faculty students in two universities. They reported that university students prioritized the “service competence” and “enthusiasm” quality dimensions.
Malik et al. (2010) investigated the impact of service quality on student satisfaction in higher education institutions in Punjab province in Pakistan. Yousapronpaiboon (2014) conducted a study on service quality in higher education in Thailand and concluded that the higher education system in Thailand needs to meet the expectations of undergraduate students. The difference between the expected and perceived service quality revealed that the perception scores were lower than the expectation scores. In a study conducted by Mohammadi and Mohammadi (2014) on the perceived service quality in Zanjan University of Medical Sciences (ZUMS), it was predicted that there would be a significant statistical difference between student expectations and perceptions in all service quality dimensions.
Bosu et al. (2018) studied the service quality perceived by students in a Ghanaian public university and the correlation between service quality perceptions and satisfaction with the SERVQUAL and Student Satisfaction Level (SLS) scales. They reported that the service quality perceived by students and their satisfaction levels were moderate. Furthermore, they reported a significant strong correlation between service quality and student satisfaction. Gerşil and Güven (2018) employed SERVQUAL to measure service quality at Celal Bayar University in Turkey and reported that the services provided by the university were below student expectations in all dimensions. Saliba and Zoran (2018) measured service quality with SERVQUAL and compared their findings in several public and private universities to determine the service quality dimensions that required improvement. Specifically, they investigated whether there was an unexpected trend across public universities in specific quality service dimensions by the students. Lodesso et al. (2019) analyzed the services in Ethiopian higher education institutions based on student satisfaction. They employed SERVQUAL to measure service quality and analyzed the study data using the IPA model. The findings indicated that students needed better perceptions of most service quality components. Ertuğrul and Sarı (2019) investigated service quality in a Turkish faculty with the SERVQUAL method. They reported no differences between the expected and perceived service quality based on gender and income, while there was a difference between perceived quality based on the participant age.
Bhattacharjee and Priti (2020) measured the impact of service quality on student perceptions in a study conducted with 372 business administration students in six educational institutions in five cities in India. Suting et al. (2020) analyzed student expectations in a private technical educational institute in South India with SERVQUAL. The study determined that the services did not meet student expectations in the gap analysis conducted to determine the difference between perceptions and expectations. The findings demonstrated that perception scores were lower than expectation scores in all five service quality dimensions.
Abu-Rumman and Qawasmeh, (2022) aimed to measure the satisfaction of international students who attended a Jordanian university with SERVQUAL. Consistent with the literature, the findings demonstrated strong correlations between the five service quality dimensions and student satisfaction. However, the correlations between tangibles and assurance sub-dimensions of SERVQUAL and satisfaction were not statistically significant. Alhazmi (2020) employed a modified service quality (SERVQUAL) scale to determine service quality perceptions in higher education based on the views of the students attending King Khalid University in the Kingdom of Saudi Arabia. The findings demonstrated that the perceptions about all university services were lower than expected. Borishade et al. (2021) collected data with a structured questionnaire from 265 students attending a private university in Nigeria. They reported a significant correlation between service quality and student loyalty. However, the correlation was not mediated by student satisfaction.
Magasi et al. (2022) predicted the impact of service quality on student satisfaction with SERVQUAL and the binary logistic regression model in Tanzanian higher education (HE). Thapa (2022) investigated the correlation between service quality and student satisfaction in Nepalese higher education and reported that five service quality dimensions positively and significantly impacted student satisfaction. Aboubakr and Bayoumy (2022) aimed to analyze the quality of educational services provided for dentistry and nursing students in Egypt and Saudi Arabia with the SERVQUAL approach and determined that student perceptions about educational service quality were above average. Furthermore, they suggested that academic year, field of study, and country of origin significantly affected the quality of educational services. Çerri (2012) analyzed service quality in public higher education institutions in Albania with the SERVQUAL approach.
Hoque et al. (2023) aimed to determine service quality with the SERVQUAL model to measure student satisfaction in private colleges in Bangladesh. They predicted that student satisfaction had the potential to have a significant impact on institutional sustainability and development and concluded that administrators should prioritize good service quality. Bwachele et al. (2023) investigated the main factors that led to dissatisfaction in Tanzanian higher education by including additional variables such as confidence and perceived transparency in the SERVQUAL model. They determined that confidence and perceived transparency had a partial mediating effect on student satisfaction. Amzat et al. (2023) confirmed the impact of internationalization in higher education and university service quality on international student loyalty in Malaysia in a study conducted with 1,575 international students attending ten public universities in Malaysia. Alemu (2023) analyzed service quality perceptions of undergraduate students at Madda Walabu University, Ethiopia, with a mixed method design and an adapted form of SERVQUAL. They reported discrepancies between students’ expectations and perceptions in all service quality dimensions. Faris et al. (2023) proposed a conceptual SERVQUAL model to measure student satisfaction with the University Parcel Service Quality in a higher education institution. De Silva (2023) employed SERVQUAL to analyze service quality in Sri Lankan higher education.
Stankovska et al. (2024) demonstrated that the highest gap in service quality at the University of Tetova, Macedonia, was in the responsiveness dimension, followed by the reliability, assurance, empathy, and tangibles dimensions. Furthermore, they found significant positive correlations between student satisfaction and responsiveness, reliability, assurance, and empathy and a negative correlation between student satisfaction and the tangible dimension. Santoso et al. (2024) SERVQUAL measured the quality of anti-corruption education in Indonesia and statistically evidenced that three service quality dimensions significantly affected it. Pazoki et al. (2024) investigated the quality of educational services based on the views of the medical students attending Semnan University, Faculty of Medical Sciences with SERVQUAL. The findings demonstrated a difference between student perceptions and expectations in five educational service quality dimensions based on the students’ views at all levels.
Hypotheses development
Figure 1 below represents the theoretical framework of the SERVQUAL model adopted in the study. In the model, the service quality latent variable was included in the second-order measurement model along with the five SERVQUAL dimensions and the endogenous latent variable of student satisfaction.
Figure 1
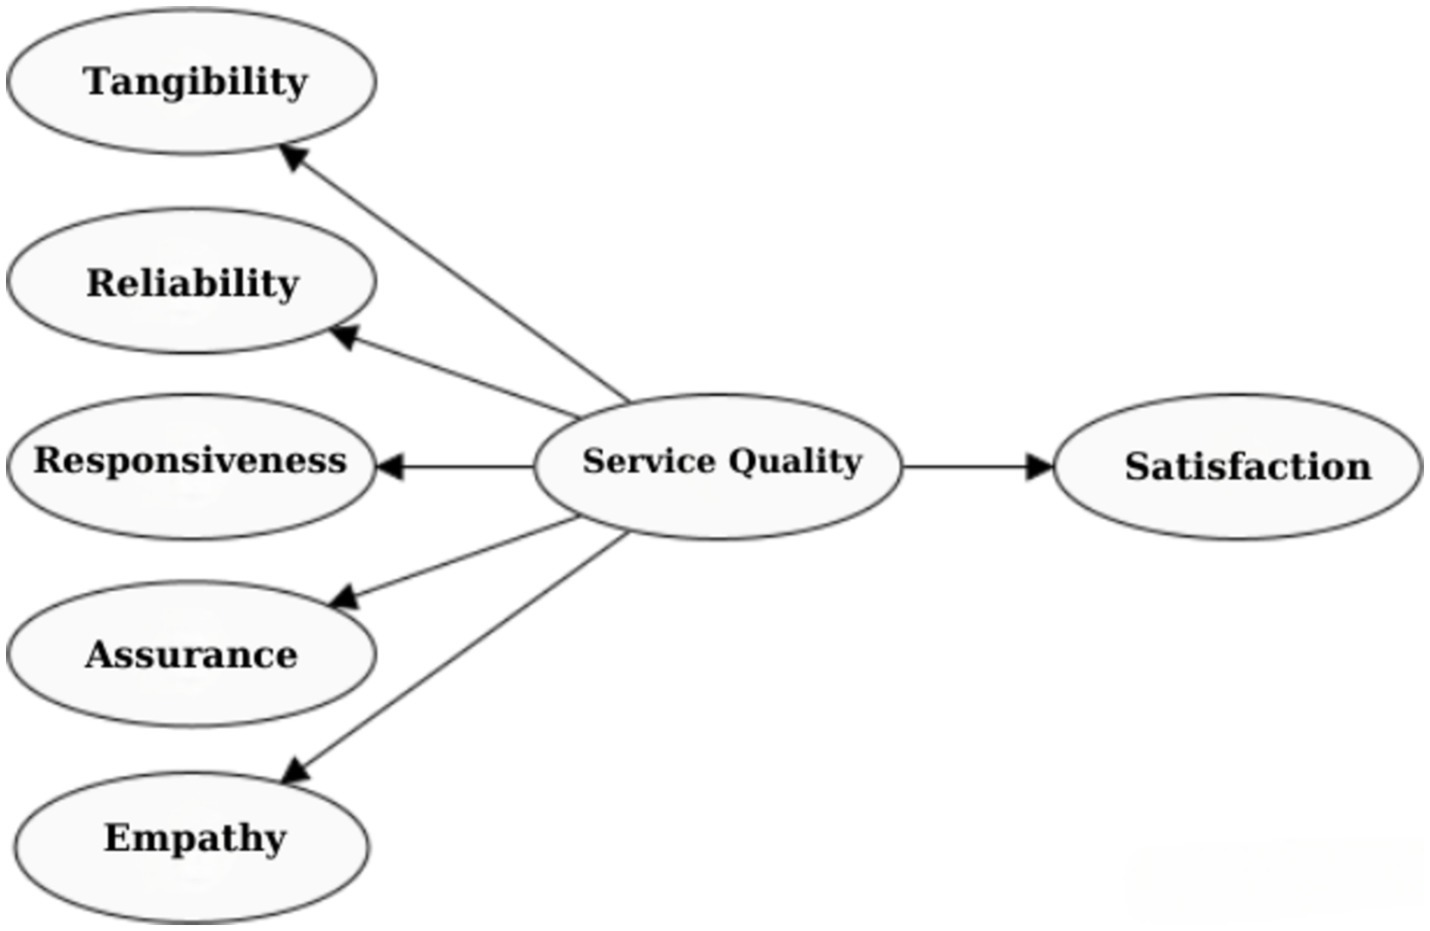
Conceptual service quality and student satisfaction model.
One of the factors that affect student satisfaction is “tangibles.” Tangibles include material physical evidence that could be perceived with senses (Parasuraman et al., 1988). The buildings, training halls, equipment, libraries, and internet lounges that provide communication services are the physical factors in higher education institutions (Alemu, 2023; Bwachele et al., 2023; Hoque et al., 2023). A positive correlation is expected between tangibles and service quality:
H1: There is a positive correlation between the tangibles dimension and perceived service quality.
The ability of HE institutions to fulfill their promises to students positively affects student satisfaction. Reliability is considered a significant factor that affects service quality. Parasuraman et al. (1988) reliability is “the ability to fulfill promised services reliably and accurately.” Similar to previous studies (Hoque et al., 2023; Yılmaz et al., 2007), a positive significant correlation was expected between reliability and service quality:
H2: There is a positive correlation between the reliability dimension and perceived service quality.
The third dimension closely associated with quality is responsiveness. Responsiveness is the willingness or readiness of the staff to provide services and facilities rapidly (Parasuraman et al., 1985). Responsiveness is the ability of the staff to respond to customer demand immediately (Harvey and Williams, 2010), and previous studies (Yılmaz et al., 2007; Schijns, 2021; Wider et al., 2024) reported a positive correlation between responsiveness and service quality. The willingness of the staff to provide services is associated with the service quality in an institution:
H3: There is a positive correlation between the responsiveness dimension and perceived service quality.
The assurance dimension in the SERVQUAL model was described as “the ability of an employee to instill trust and confidence via knowledge and courtesy” (Hanaysha et al., 2011; Parasuraman et al., 1988; Sibai et al., 2021). Assurance is determined by the customer’s view of service providers’ knowledge, courtesy, and ability to motivate trust and confidence in the customers. A positive correlation is expected between assurance and perceived service quality:
H4: There is a positive correlation between the assurance dimension and perceived service quality.
Empathy reflects service providers’ care and personalized attention in their customer relations (Parasuraman et al., 1988). Empathy is associated with the service provider’s emotions toward the service recipient. The personal attention provided by the university staff, their sensitivity, and attitudes could enhance the quality of service in an institution (Hoque et al., 2023; Magasi et al., 2022; Yılmaz et al., 2007):
H5: There is a positive correlation between and perceived service quality.
Previous studies demonstrated that high service quality improves educational services’ impact on student satisfaction (Angell et al., 2008; Hoque et al., 2023; Nadiri et al., 2009). Student satisfaction depends on the consistency of the performance of the educational staff with student expectations. Student expectations reflect their predictions about the quality of services provided by educational institutions; performance reflects the actual quality of service. The main determinants of student satisfaction in educational institutions include the performance of faculty members, staff, and courses. Furthermore, factors such as assistance services, access, the qualifications of the staff, academic quality, accommodation, technological innovation, infrastructure, and facilities also play a crucial role in student satisfaction. Educational institutions should continuously invest in service quality and take strategic steps to sustain quality to improve student satisfaction and allow positive student experiences.
H6: There is a positive correlation between the perceived service quality and student satisfaction.
Several studies focused on the correlations between SERVQUAL service quality dimensions and student satisfaction, where the research mentioned above hypotheses were employed similarly. These studies try to determine and discuss the correlations between service quality and student satisfaction (Borishade et al., 2021; Bwachele et al., 2023; Darawong and Sandmaung, 2019; Hanaysha et al., 2011; Hoque et al., 2023; Sibai et al., 2021; Sohail et al., 2003; Sohail and Hasan, 2021; Widiarto, 2023).
Methodology
Study sample and data collection
The study participants included 350 students attending Khoja Akhmet Yassawi International Kazakh-Turkish University. The sample group was randomly assigned using the stratified sampling method based on the student department. Data were gathered through face-to-face interviews between April and May 2024 to ascertain the influence of perceived service quality on student satisfaction. Before the survey application, the participants were informed that they could terminate participation in the study at any stage, and they signed informed consent forms after reading the information about the study. The scale was applied during the regular classes and took about 20 min to complete. This approach ensured that the views of various student groups were included in the study.
Measurement instrument
The first section of the survey form included sociodemographic questions, and the second section included items from the SERVQUAL and student satisfaction scales. SERVQUAL and student satisfaction items were adapted from the scale developed by Borishade et al. (2021). The survey included 23 items that measured six dimensions: Tangibles (four items), reliability (five items), responsiveness (four items), assurance (four items), empathy (two items), and student satisfaction (four items). The survey form was a 7-point Likert-type scale. All items were translated into Kazakh language. The common traditional approach was employed in the translation. A pilot scheme was conducted with a small sample group (n = 35) with the translated survey, and experts reviewed it.
Data analysis
The study data were collected with a survey form, and covariance-based structural equation modeling (CB-SEM) was employed to predict causality. CB-SEM is a statistical approach for estimating and testing structural equation models (Dash and Paul, 2021; Hair et al., 2017a; Sarstedt et al., 2016). This method utilizes a statistical model to assess and evaluate the correlations between dependent and independent variables and the underlying latent structures. In particular, applying CB-SEM, especially in the context of reflective measurement, where hypothetical constructs are estimated as common factors that are assumed to cause their indicators (i.e., observed or manifest variables), offers a flexible and compelling approach to data analysis (Zhang et al., 2021). CB-SEM estimates model parameters, including loadings and path values, to minimize the difference between the sample covariances and those predicted by the theoretical model (Hair et al., 2017a; Hair et al., 2017b; Sarstedt et al., 2016). This estimation process also aims to reproduce the covariance matrix of the observed measures and evaluate the degree of fit between the hypothesized model and the data, as indicated by overall goodness-of-fit indices (Dash and Paul, 2021; Hair et al., 2017b). Accordingly, CB-SEM is regarded as one of the most appropriate techniques for confirmatory research (Gefen et al., 2000).
SEM includes two primary elements: the outer model (also called the measurement model) and the inner model (also called the structural model) (Henseler et al., 2015). The outer model describes the correlation between manifest variables (MVs) and latent variables (LVs), while the inner model describes the correlations between latent variables (LVs). Three analysis models were employed in the current study: The first-order measurement model, the second-order measurement model, and the structural model. Initially, the measurement model is discussed. Measurement models are employed to estimate the correlations between the items associated with the latent variables and test the measurement’s validity. The measurement model aims to ensure the validity and reliability of conceptual measurements (Hair et al., 2017b; Sarstedt et al., 2016). The first-order measurement model was employed to test the correlations between the five SERVQUAL dimensions and to verify whether it was a fit measurement model based on the previous analyses. This model could also be described as the first-order confirmatory factor analysis (CFA). After determining the statistical evidence for the measurement model with the first-order measurement, the theoretical validity of SERVQUAL was confirmed with the second-order measurement. After analyzing the measurement model in two stages, the structural model was employed to estimate the causalities between the latent variables (Figure 1). All models were estimated with SmartPLS 4.0.
Results
Participant demographics
The present study’s sample, conducted to determine the causality between perceived service quality and student satisfaction in Kazakh higher education, included 350 participants. 57% of the participants were female, 71% were 17–20 years old, and 44% attended social science departments. Participant demographics are presented in Table 1.
Table 1
| Variable | Frequency | Percentage |
|---|---|---|
| Gender | ||
| Female | 198 | 0.57 |
| Male | 152 | 0.43 |
| Age | ||
| 17–20 | 60 | 0.71 |
| 21–26 | 110 | 0.27 |
| Above 26 | 84 | 0.02 |
| Department | ||
| Sciences | 110 | 0.24 |
| Social sciences | 97 | 0.44 |
| Engineering | 45 | 0.09 |
| Business Administration | 22 | 0.23 |
Characteristics of respondents.
Measurement model
First-order measurement model
The first-order measurement model analyzed the tangibles, reliability, responsiveness, assurance, and empathy factors, and the basic measurement model included 19 items. The first-order measurement aimed to verify the validity and reliability of all constructs that supported the statistical fit of the SERVQUAL model. Convergent validity metrics, Cronbach’s alpha (CA), composite reliability (CR), and average variance extracted (AVE) were determined in the study (Henseler et al., 2015). The first condition for discriminant validity is convergent validity (Davis et al., 1989). Discriminant validity was analyzed based on the Heterotrait-Monotrait (HTMT) ratio and the Fornell-Larcker Criteria (FLC) (Hair et al., 2020).
Convergent validity
Initially, the standardized factor loads of all items in the measurement model were determined. The standardized factor loads of all items were greater than 0.60 and statistically significant, as seen in Table 2 and Figure 2 (p < 0.01). Since all item loads for latent variables were greater than 0.60 (MacCallum et al., 1999, 2001), this indicated high convergent validity (Dash and Paul, 2021), as supported by the analysis findings. To determine the reliability of the scale, CA and CR should be greater than 0.70 (Hair et al., 2017b). The present study’s CA and CR for latent variables were above 0.70. The AVE is expected to be greater than 0.50 (Fornell and Larcker, 1981; Hair et al., 2017b). The AVEs of the latent constructs were greater than 0.50. The convergent validity analysis findings in the first-order measurement model demonstrated that the reliability and validity of the SERVQUAL tool were statistically satisfactory (Table 2). In summary, the CA, CR, and AVE findings evidenced the reliability of the measurement model. These findings evidenced the accuracy and consistency of the items used to measure the model constructs. Moreover, the model fit indices (x2/df = 1.146, RMSEA = 0.023, GFI = 0.868, NFI = 0.887, TLI = 0.98, and CFI = 0.984) indicated a good fit between the data and the measurement model (Dash and Paul, 2021).
Table 2
| Factor/Item | Std. load | t- value | Cronbach’s alpha | CR | AVE |
|---|---|---|---|---|---|
| Tangibles | 0.843 | 0.844 | 0.575 | ||
| TAN1 | 0.733 | 25.129 | |||
| TAN2 | 0.792 | 27.662 | |||
| TAN3 | 0.786 | 26.916 | |||
| TAN4 | 0.721 | 21.636 | |||
| Reliability | 0.869 | 0.870 | 0.573 | ||
| REL1 | 0.694 | 22.785 | |||
| REL2 | 0.734 | 24.382 | |||
| REL3 | 0.732 | 23.777 | |||
| REL4 | 0.818 | 37.519 | |||
| REL5 | 0.800 | 32.617 | |||
| Responsiveness | 0.855 | 0.856 | 0.600 | ||
| RES1 | 0.771 | 27.928 | |||
| RES2 | 0.681 | 22.576 | |||
| RES3 | 0.832 | 38.133 | |||
| RES4 | 0.806 | 31.036 | |||
| Assurance | 0.766 | 0.767 | 0.588 | ||
| ASS1 | 0.627 | 15.642 | |||
| ASS2 | 0.692 | 18.245 | |||
| ASS3 | 0.662 | 15.844 | |||
| ASS4 | 0.707 | 19.126 | |||
| Empathy | 0.739 | 0.740 | 0.587 | ||
| EMP1 | 0.740 | 16.507 | |||
| EMP2 | 0.792 | 16.692 |
First-order measurement analysis (reliability, convergent validity).
Figure 2
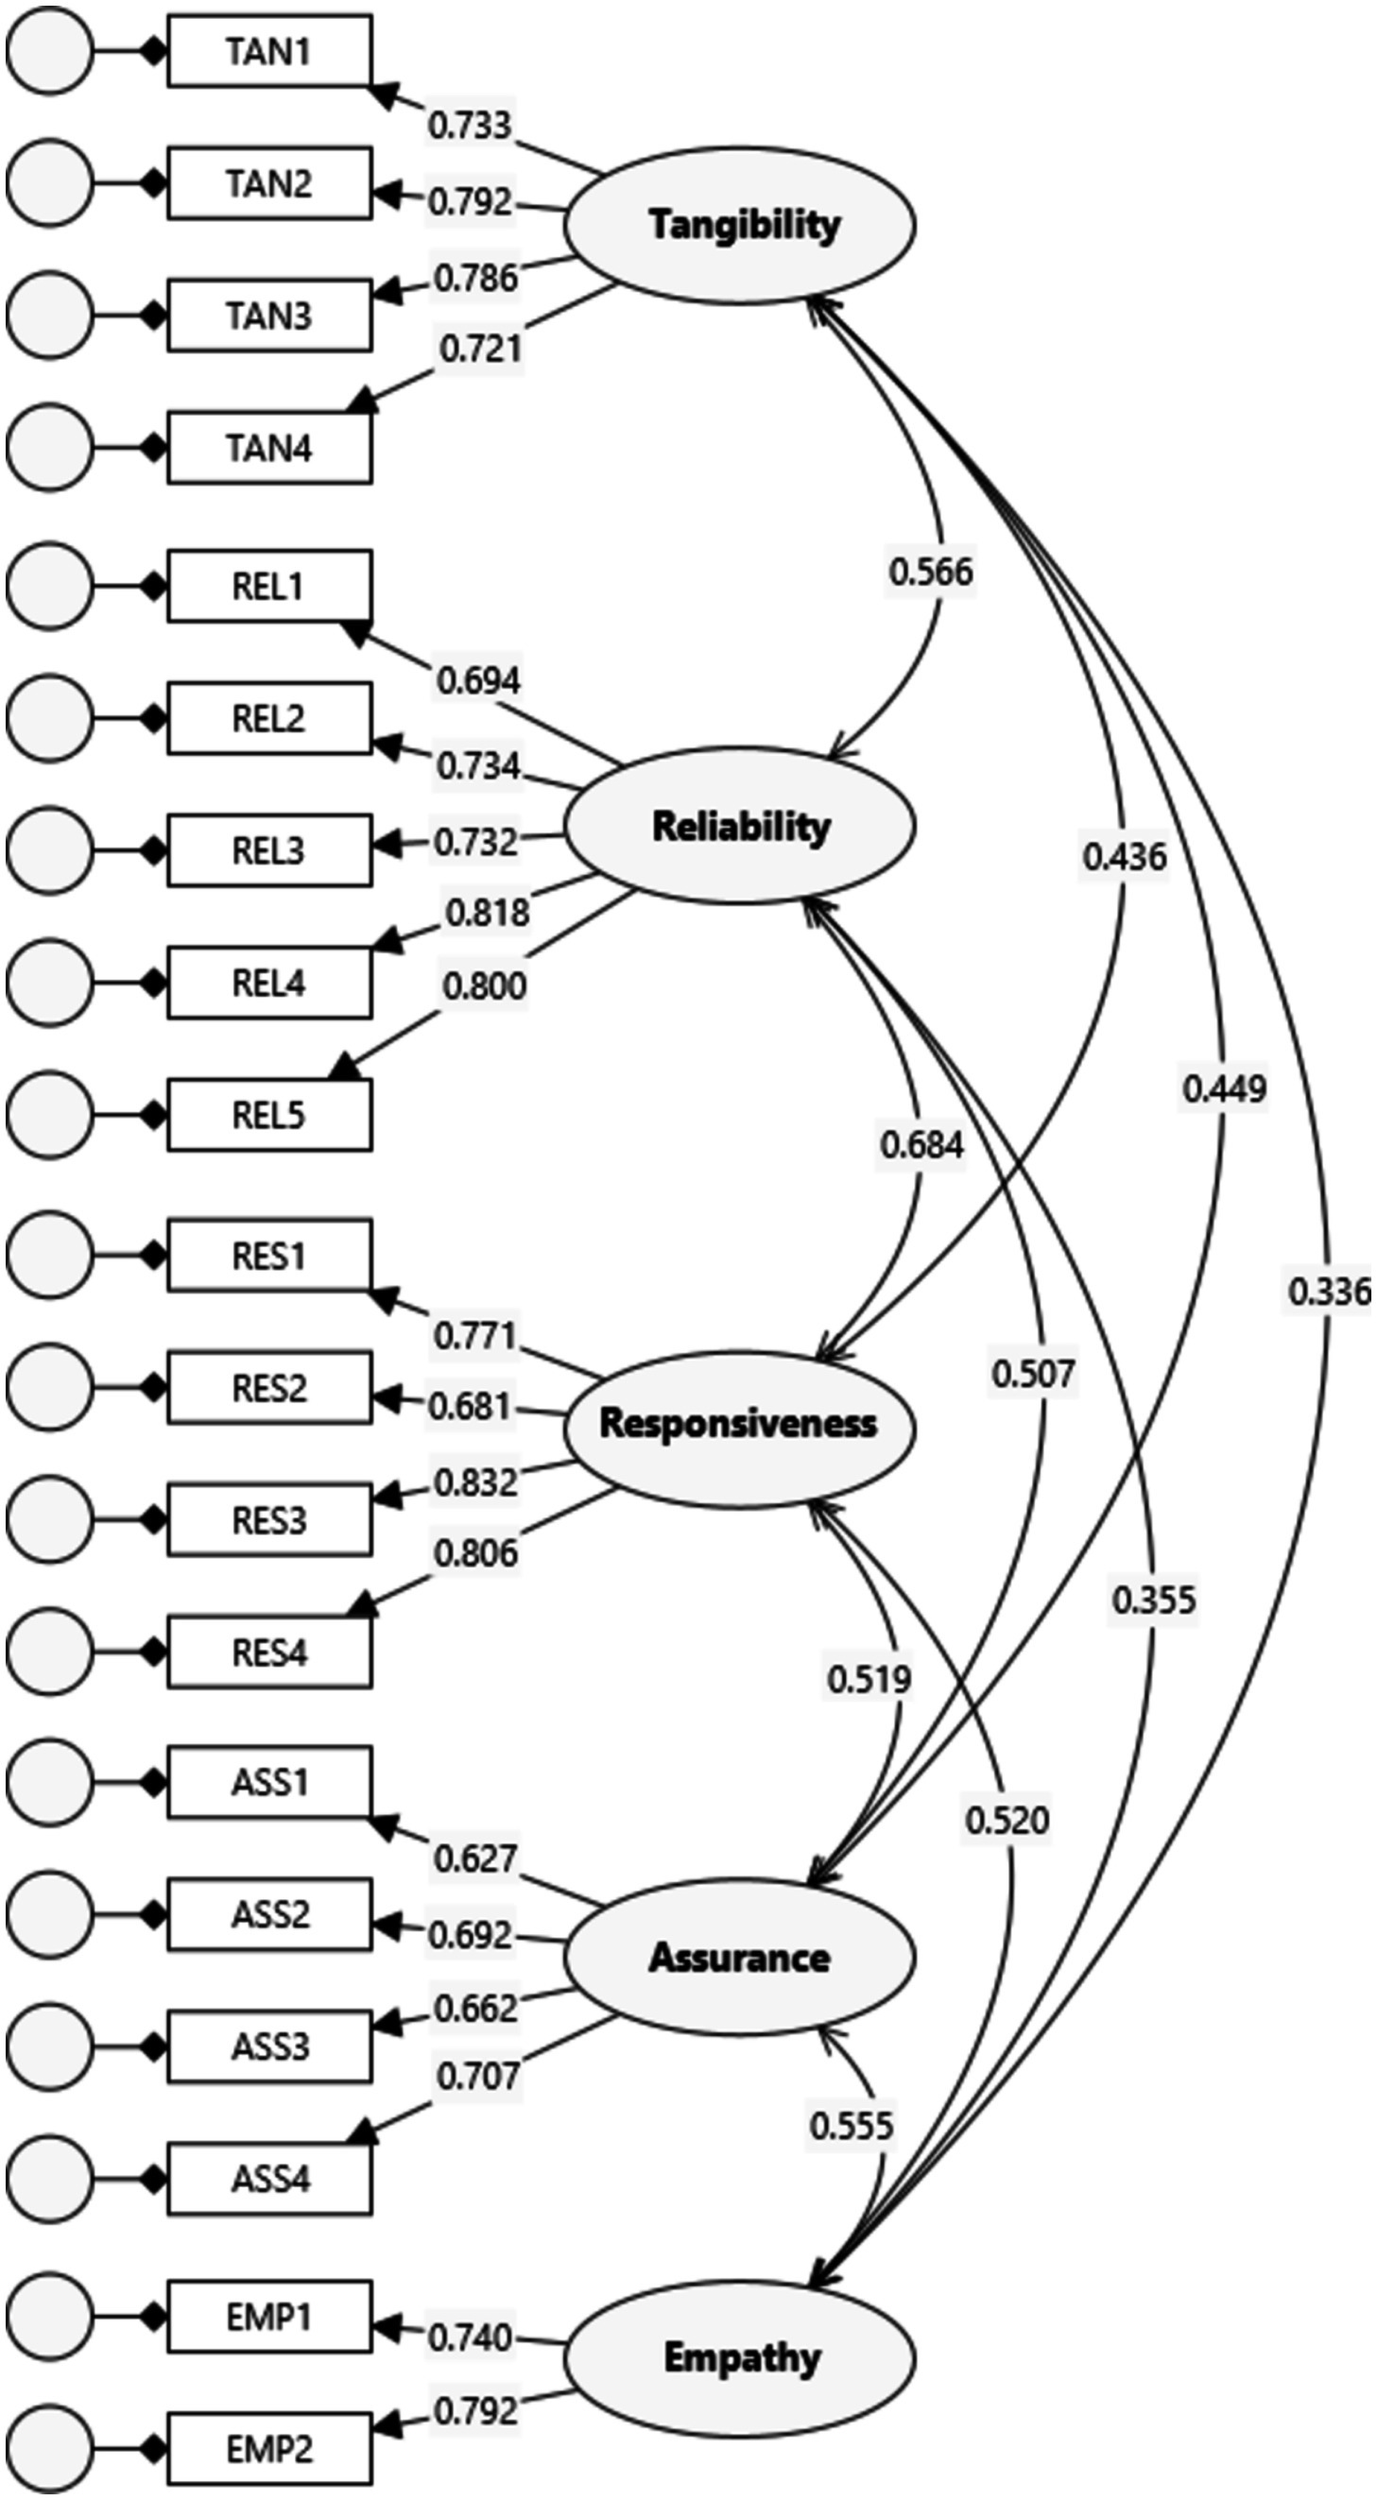
First-order measurement model.
Discriminant validity
After the convergent validity was determined, the discriminant validity of the model was analyzed. Discriminant validity ensures that the scale item loads are strongly associated with the related constructs and are different from the items associated with the other constructs (Hair et al., 2017b). 0.90 was accepted as the HTMT threshold (Hair et al., 2017b). When the HTMT between two latent constructs is below 0.90, it could be statistically argued that there is discriminant validity between the two measured constructs. As seen in Table 3, all HTMT findings between the latent constructs were below 0.90, and the measurement model exhibited discriminant validity based on the HTMT ratio. FLC of discriminant validity reflects that the square root of the construct’s AVE score is greater than the inter-construct correlation (Hair et al., 2017b). The FLC findings presented in Table 4 demonstrated that the AVE of each latent construct was greater than its correlations with other constructs.
Table 3
| Assurance | Empathy | Reliability | Responsiveness | Tangibles | |
|---|---|---|---|---|---|
| Assurance | |||||
| Empathy | 0.551 | ||||
| Reliability | 0.522 | 0.372 | |||
| Responsiveness | 0.527 | 0.518 | 0.693 | ||
| Tangibles | 0.456 | 0.342 | 0.563 | 0.445 |
Discriminant validity: HTMT ratio.
Table 4
| Assurance | Empathy | Reliability | Responsiveness | Tangibles | |
|---|---|---|---|---|---|
| Assurance | 0.673 | ||||
| Empathy | 0.555 | 0.766 | |||
| Reliability | 0.507 | 0.355 | 0.757 | ||
| Responsiveness | 0.519 | 0.520 | 0.684 | 0.775 | |
| Tangibles | 0.449 | 0.336 | 0.566 | 0.436 | 0.759 |
Discriminant validity: Fornell-Larcker criteria.
In the first-order measurement model, correlations between the five latent model constructs were determined. The correlations presented in Table 5 indicated that there were correlations between the constructs (Hair et al., 2017b). All correlations between the 5 SERVQUAL dimensions were statistically significant. The weakest correlation was between tangibles and empathy (r = 0.336), while the highest correlation was between responsiveness and reliability (r = 0.684).
Table 5
| Assurance | Empathy | Reliability | Responsiveness | Tangibles | |
|---|---|---|---|---|---|
| Assurance | 1.000 | ||||
| Empathy | 0.555 | 1.000 | |||
| Reliability | 0.507 | 0.355 | 1.000 | ||
| Responsiveness | 0.519 | 0.520 | 0.684 | 1.000 | |
| Tangibles | 0.449 | 0.336 | 0.566 | 0.436 | 1.000 |
Correlations between the dimensions.
All correlations were significant at alpha 1%.
Finally, the model fit indices were as follows: x2/df=1.231, RMSEA = 0.026, SRMR = 0.033; GFI = 0.953, NFI = 0.943, TLI = 0.986, and CFI = 0.989. These indices demonstrated a good fit between the data and the measurement model (Dash and Paul, 2021). All the findings mentioned above demonstrated that the 19 items and the five dimensions were valid and reliable, as evidenced by the first-order measurement model. The analysis clearly shows that the five service quality dimensions correlate, indicating that a single factor does not influence service quality.
Second-order measurement model
The second-order measurement model used a second-order factor model to test the five service quality dimensions. The analyses demonstrated that the first-order constructs were the same as the second-order constructs. In summary, direct causalities were confirmed between the tangibles, reliability, responsiveness, assurance, and empathy service quality variables and perceived service quality (Figure 3). It was concluded that the second-order factors for perceived service quality were supported. This finding suggested that students considered the five basic dimensions of service, and perceived service quality was a more significant factor that made sense of all dimensions. All first-order factors and items are loaded fully in the second-order construct. The standardized factor loads of all items varied between 0.629 and 0.829 (p < 0.000). In the present study, the standard path coefficients between service quality and the underlying first-order latent variables were 0.624 for tangibles, 0.811 for reliability, 0.809 for responsiveness, 0.676 for assurance, and 0.585 for empathy. Also, the factor CA was higher than 0.70, CR was higher than 0.70, and AVE was higher than 0.50. Second order measurement model fit indices were as follows: x2/df = 1.411, RMSEA = 0.034, SRMR = 0.043; GFI = 0.944, NFI = 0.932, TLI = 0.976, and CFI = 0.979. These indices demonstrated a good fit between the data and the measurement model (Dash and Paul, 2021). The statistical findings of the second-order measurement model demonstrated that it exhibited a good fit.
Figure 3
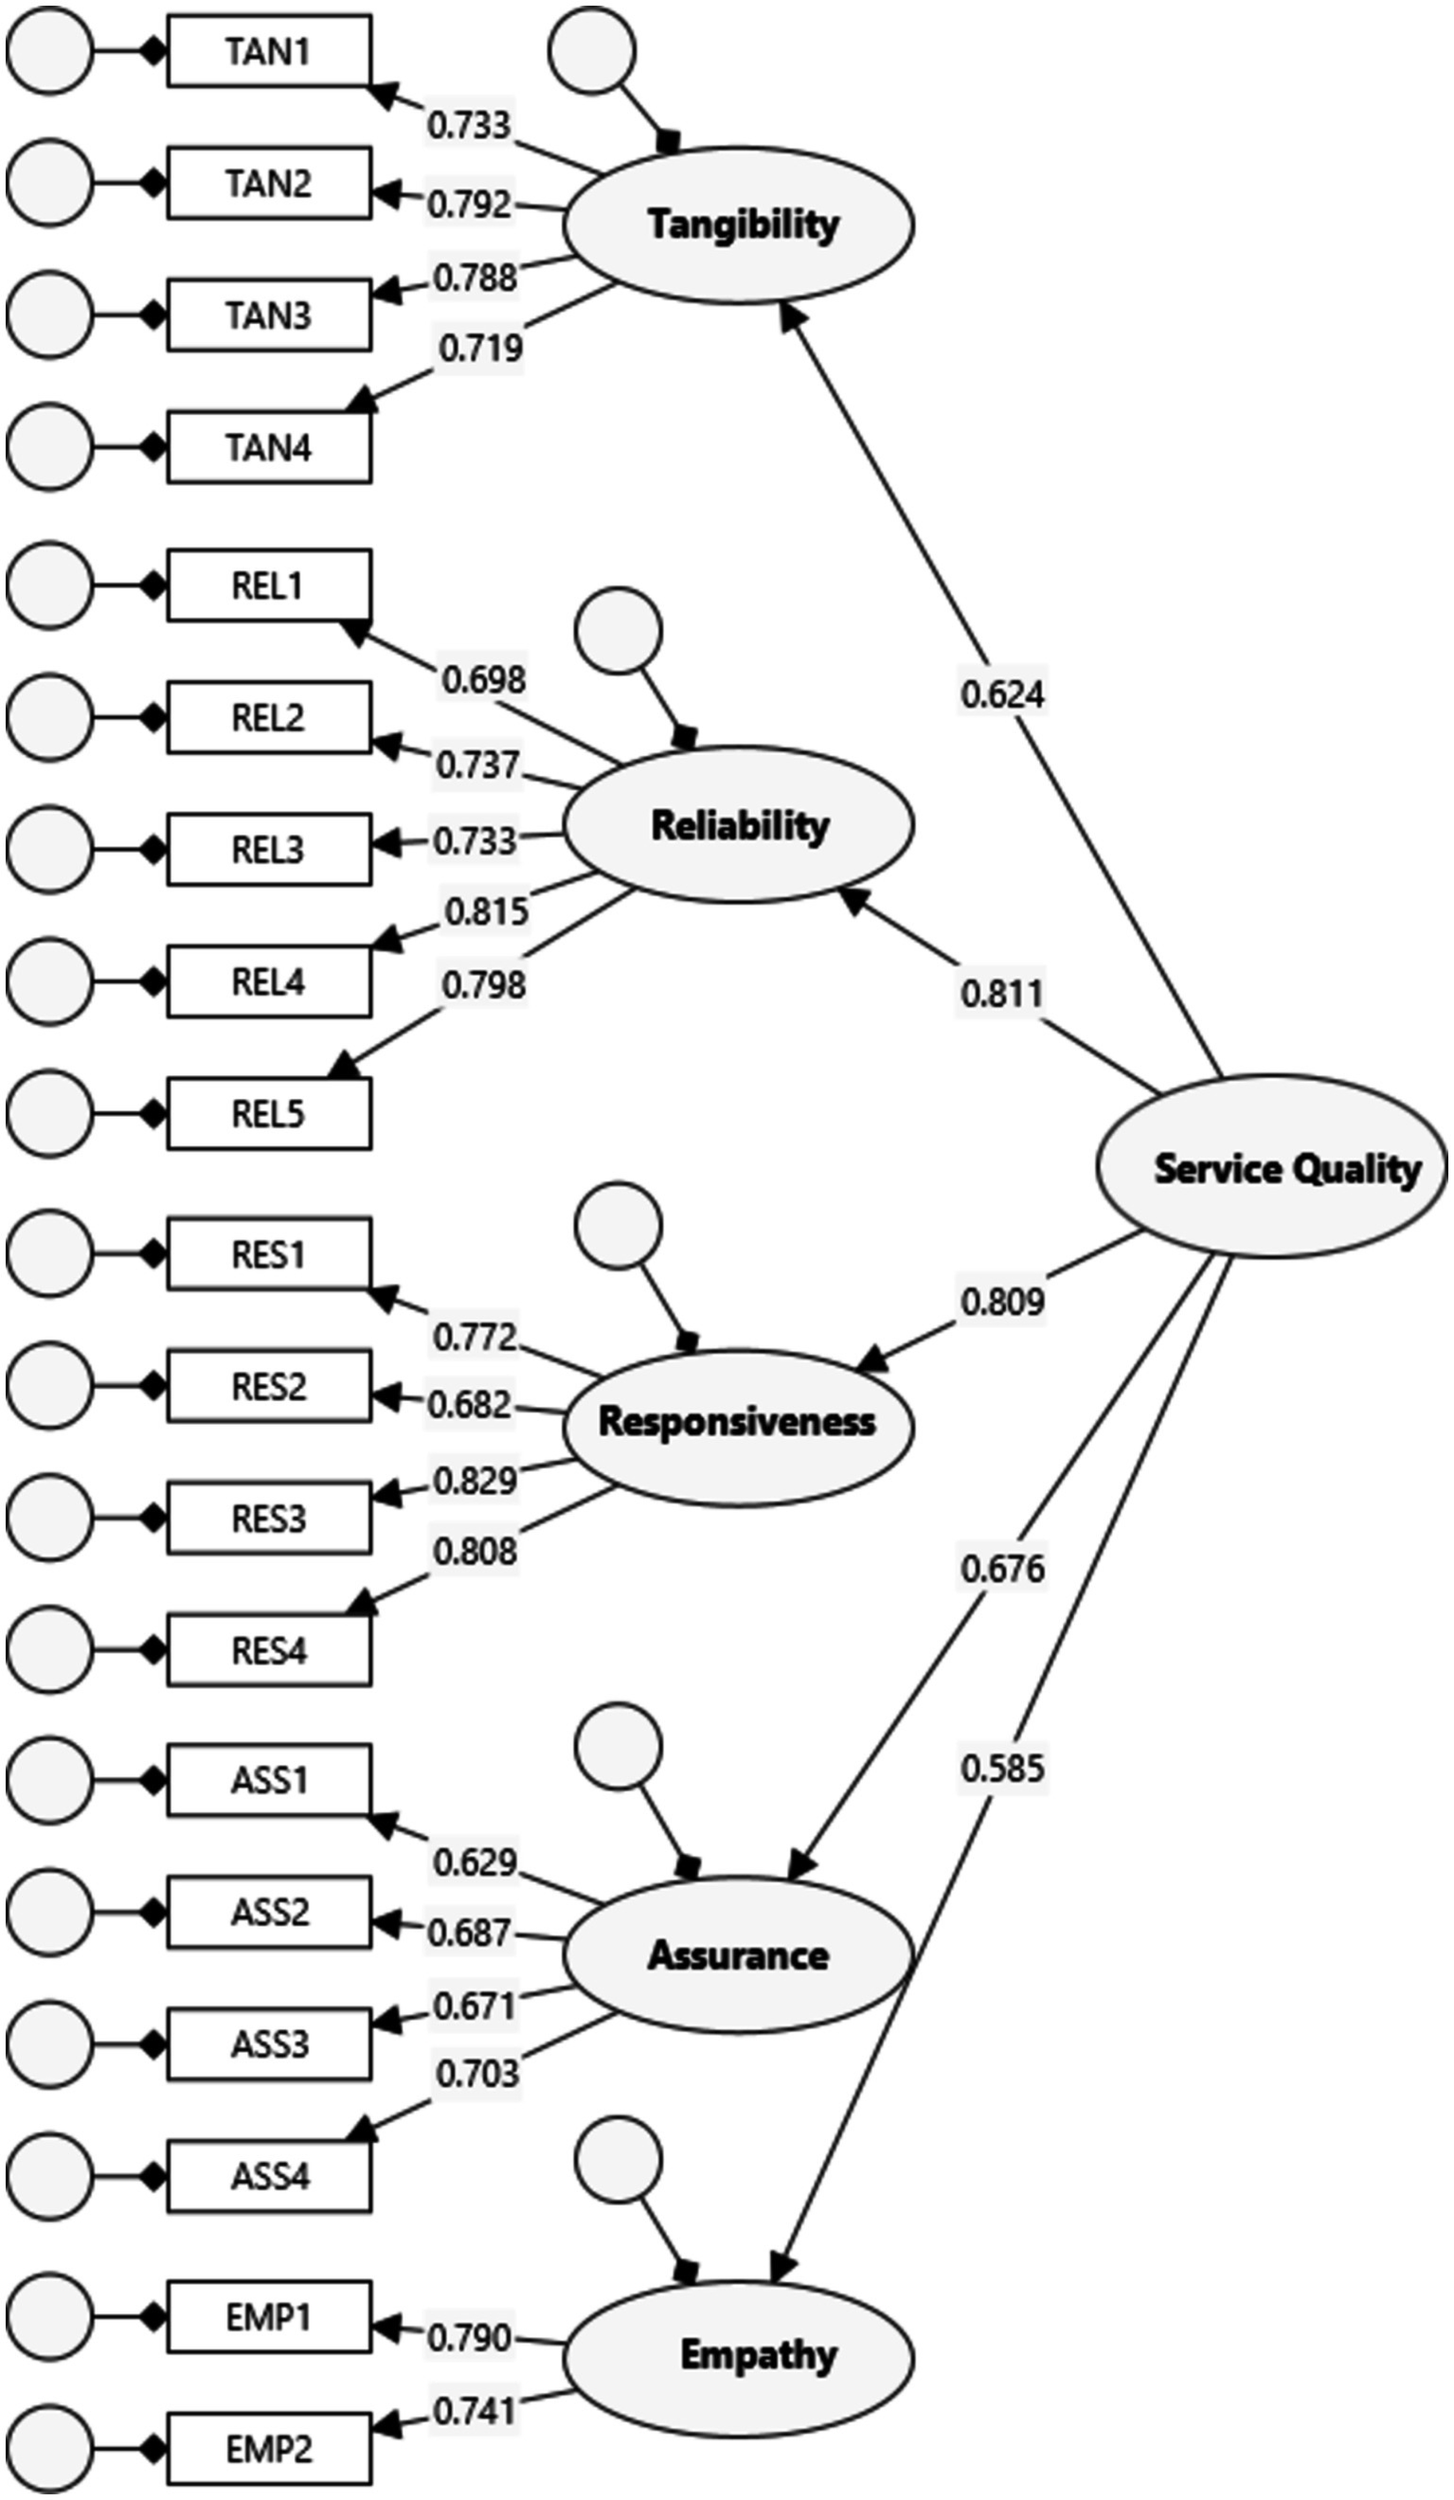
Second-order measurement model.
Structural model
After the reliability and validity of the SERVQUAL model were confirmed, the structural components of the research model were analyzed. The structural model analysis included determining the model’s explanatory and predictive abilities and the significance and validity of the path coefficients. Figure 4 presents the CB-SEM structural model, which was analyzed using the maximum likelihood estimation method. To evaluate the structural model, both absolute and relative goodness-of-fit indices were employed. Structural model fit indices were as follows: x2/df = 1.381, RMSEA = 0.033, SRMR = 0.043; GFI = 0.940, NFI = 0.930, TLI = 0.977, and CFI = 0.980. The fit indices indicate that the structural model is statistically validated (Dash and Paul, 2021).
Figure 4
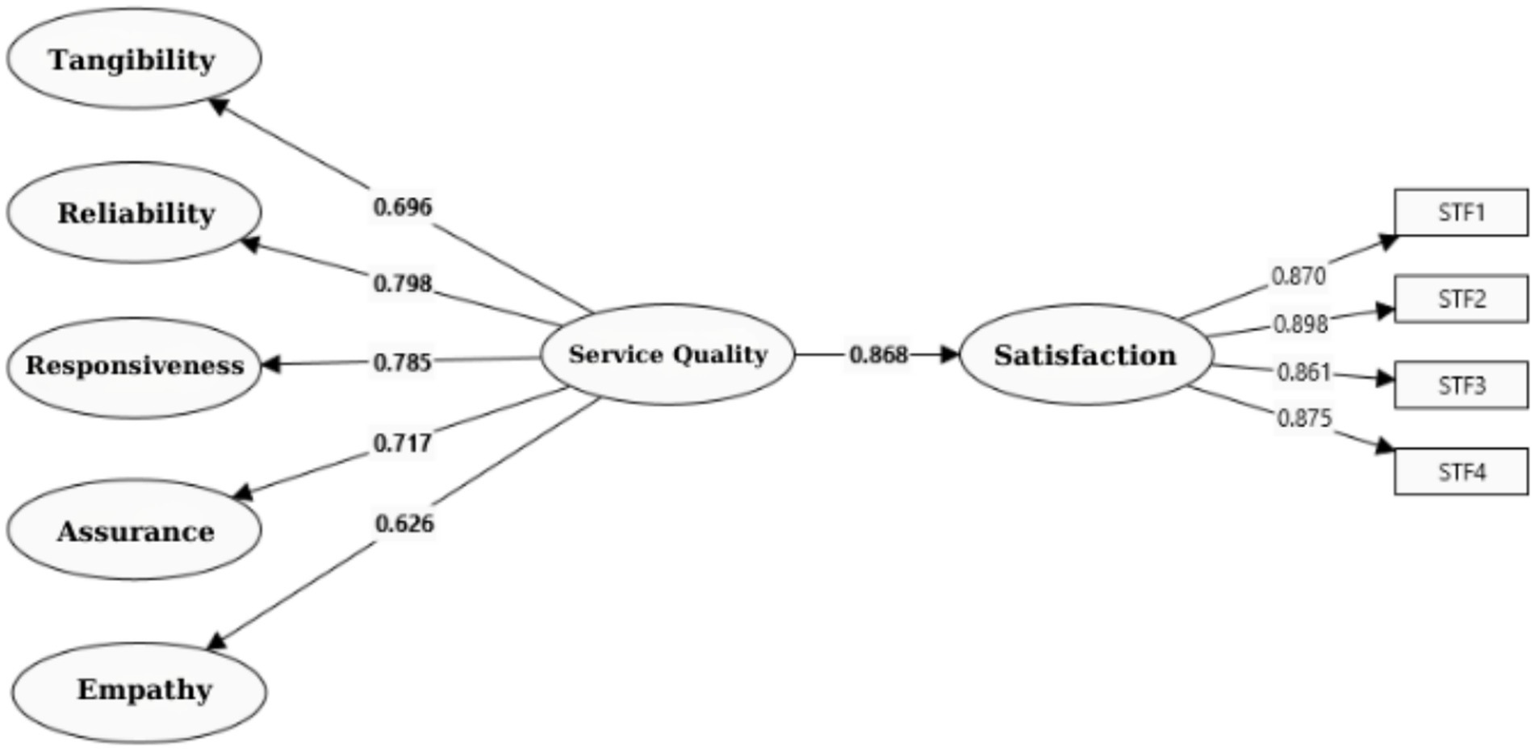
Structural Model.
The standardized path coefficients are employed to estimate the assumed correlations in the structural model with the CB-SEM algorithm. The bootstrap technique was used to analyze the significance of the path coefficients. All path coefficients in the structural model varied between 0.626 and 0.868 (Figure 4). Since the path coefficients were close to 1, it was interpreted as an indicator of the power of the model in predicting dependent constructs (Hair et al., 2020). Furthermore, all model variables’ standardized factor loadings and path coefficients were statistically significant (p < 0.000). Table 6 and Figure 4 present the structural model and hypothesis test findings, and the hypotheses were predicted based on the statistical significance of the structural parameters.
Table 6
| Hypothesis | Std. beta | Std. error | T statistics | Decision |
|---|---|---|---|---|
| H1 Service Quality →Tangibility | 0.696 | 0.757 | 21.112 | Supported |
| H2 Service Quality → Reliability | 0.798 | 0.019 | 46.155 | Supported |
| H3 Service Quality → Responsiveness | 0.785 | 0.022 | 37.769 | Supported |
| H4 Service Quality → Assurance | 0.717 | 0.032 | 25.793 | Supported |
| H5 Service Quality → Empathy | 0.626 | 0.045 | 16.120 | Supported |
| H6 Service Quality → Satisfaction | 0.868 | 0.011 | 85.403 | Supported |
Structural predictions (hypothesis testing).
Critical t-value: 2.58 (p < 0.01)
The data statistically supported all six hypotheses. A significant positive relationship was found between perceived service quality and student satisfaction (β=0.8687, p < 0.01). Service quality also had significant effects on tangibles (β=0.696, p < 0.01), reliability (β=0.798, p < 0.01), responsiveness (β=0.785, p < 0.01), assurance (β=0.717, p < 0.01), and empathy (β=0.626, p < 0.01). The hypothesis test findings were consistent with the findings reported in the literature (Malik et al., 2010; Sultan and Wong, 2010; Borishade et al., 2021; Hoque et al., 2023).
Discussion and conclusion
The present study aimed to determine the effects of service quality perceived by college students in Kazakhstan on student satisfaction. The SERVQUAL model (Wider et al., 2024), the most common methodology in the literature, was employed to analyze perceived service quality. Initially, the first-order measurement model, which addressed five service quality dimensions, was applied to discuss the validity of the measurements and support the findings. Then, confirmatory factor analysis was conducted in the second-order measurement model, which revealed that the five SERVQUAL dimensions, namely tangibility, reliability, responsiveness, assurance, and empathy, significantly positively impacted institutional service quality. The analysis confirmed that these five dimensions were the main components of SERVQUAL. The analysis of the research model with PLS-SEM demonstrated that students’ perceived service quality had a significant positive effect on student satisfaction. It was determined that service dimensions such as reliability and enthusiasm strongly affected the students’ perceived service quality. The findings demonstrated that perceived service quality dimensions were significant in ensuring student satisfaction, consistent with the literature (Annamdevula and Bellamkonda, 2016; Borishade et al., 2021; Magasi et al., 2022; Hoque et al., 2023). It was concluded that service quality was the focus of student satisfaction. In summary, the present study findings demonstrated that quality services played a key role in student satisfaction in higher education.
The study findings were consistent with the existing literature emphasizing the significance of quality management in higher education services (Alves and Raposo, 2007; Hill, 1995; Abari et al., 2011; Alemu, 2023; Borishade et al., 2021; Bwachele et al., 2023; Hoque et al., 2023; Oliso and Alemu, 2023; Rolo et al., 2023). The finding that the five service quality dimensions have different degrees of impact on student satisfaction was also consistent with previous reports (Gerşil and Güven, 2018; Magasi et al., 2022; Hoque et al., 2023). The high impact of the reliability dimension demonstrated that students prioritized the consistency and accuracy of services. This finding was consistent with the report by Parasuraman et al. (1988) that the reliability dimension played a key role in service quality perception.
Furthermore, the low impact of the empathy dimension compared to the other dimensions could indicate that the student culture in Kazakhstan did not prioritize personalized services compared to the other dimensions. This finding confirmed that the cultural differences emphasized by De Jager and Gbadamosi (2010) played a decisive role in service quality perceptions. The finding that students in Kazakhstan did not prioritize personalized services was consistent with the previous reports that cultural context determines service quality perceptions.
The present study could provide insight and data on college service quality perceptions and student satisfaction. The study that aimed to provide an original contribution to the literature could serve as a reference for future research on higher education in Kazakhstan. Due to the inauguration of new universities in Kazakhstan and increased access to higher education, HEIs have started to operate in a competitive market. Higher education institutions should adopt market-focused methods to differentiate themselves from the competition, attract as many students as possible (Kanwar and Sanjeeva, 2022), and meet the quality expectations of these students. Quality service delivery in higher education institutions should aim to improve student satisfaction. Higher education institutions should invest in service quality and take necessary steps to improve student satisfaction. The present study reported significant practical implications for Kazakhstan higher education institutions in enhancing the quality of service management strategies. Especially, continuous surveillance of service quality dimensions and regular analysis of student feedback would play a key role in improving student satisfaction.
Limitations and future research
The present study has certain limitations. The study data were collected from 400 students attending Khoja Akhmet Yassawi International Kazakh-Turkish University during the spring of 2024. Although the student profile of the university was similar to the average student profile in Kazakhstan, the study findings may not represent the entire higher education population. Thus, the study findings may not generalize the entire higher education system. This limitation would lead to new research opportunities to improve diversity in tertiary education.
Furthermore, the current study investigated the impact of perceived service quality on student satisfaction. Future studies could further investigate the effects of service quality on student loyalty, institutional belonging, academic achievement, or post-graduation career achievements, which would contribute to the literature. Thus, including various variables would lead to a broader understanding of the effect of service quality on educational outcomes.
To improve the generalizability of the study and to determine the validity of the findings, similar studies could be conducted in different higher education institutions in Kazakhstan. Also, instead of limiting the scope of the research to Kazakh HEIs, further studies could analyze the differences between service quality perceptions in education systems in neighboring countries and the impact of these perceptions on student satisfaction. Comparative studies that could be conducted to determine the interactions between service quality and cultural, social, and economic contexts would contribute to developing global higher education policies. Studies that could be conducted in different regions, such as Western Europe and Central and Eastern Asia, would allow a comprehensive analysis of the effects of service quality on student satisfaction in different education systems. Such studies would also allow the analysis of the effects of cultural and regional differences on service quality perceptions.
Although it was reported that digital evolution had a significant impact on universities, perceived service quality, and satisfaction of the students, the present study was conducted at a university where digitalization was in the preliminary phase. Thus, the SERVQUAL model, which was employed in previous studies to measure the service quality perceptions of the students in conventional (Bwachele et al., 2023; Çınkır et al., 2021; Hoque et al., 2023) and e-learning (Dangaiso et al., 2022; Sumi and Kabir, 2021; Zaidi et al., 2023), was employed in the learning framework of the present study. Future studies should include new factors that would emerge due to the digitalization of higher education institutions in the main SERVQUAL measurement model and analyze the effects of these factors on perceived service quality and satisfaction of the students.
In conclusion, the present study findings provided significant implications for higher education services in Kazakhstan. However, due to the study’s limitations, further comprehensive and comparative studies are required to elucidate the impact of service quality on student satisfaction.
Statements
Data availability statement
The original contributions presented in the study are included in the article/supplementary material, further inquiries can be directed to the corresponding author.
Ethics statement
The studies involving humans were approved by Khoja Akhmet Yassawi International Kazakh-Turkish University, Kazakhstan. The studies were conducted in accordance with the local legislation and institutional requirements. The participants provided their written informed consent to participate in this study.
Author contributions
MS: Conceptualization, Investigation, Writing – original draft, Writing – review & editing. ZT: Conceptualization, Writing – review & editing, Investigation. LK: Conceptualization, Writing – review & editing, Investigation, Methodology, Validation, Writing – original draft. ZK: Methodology, Validation, Writing – original draft, Writing – review & editing, Conceptualization, Formal analysis, Investigation. HÇ: Formal analysis, Methodology, Validation, Writing – original draft, Conceptualization, Data curation, Investigation, Software, Visualization.
Funding
The author(s) declare that no financial support was received for the research, authorship, and/or publication of this article.
Conflict of interest
The authors declare that the research was conducted in the absence of any commercial or financial relationships that could be construed as a potential conflict of interest.
Publisher’s note
All claims expressed in this article are solely those of the authors and do not necessarily represent those of their affiliated organizations, or those of the publisher, the editors and the reviewers. Any product that may be evaluated in this article, or claim that may be made by its manufacturer, is not guaranteed or endorsed by the publisher.
References
1
AbariA. A. F.YarmohammadianM. H.EstekiM. (2011). Assessment of quality of education a non-governmental university via ServQual model. Procedia - Social and Behavioral Sciences, 15, 2299–2304. doi: 10.1016/j.sbspro.2011.04.097
2
Abd RashidN. Z.Tuan IsmailT. N. A. N.ThomasB. (2021). The correlation between Servqual dimensions and student satisfaction. Adv. Bus. Res. Int. J.7:7. doi: 10.24191/abrij.v7i2.14909
3
AbdullahF. (2006a). Measuring service quality in higher education: three instruments compared. Int. J. Res. Method Educ.29, 71–89. doi: 10.1080/01406720500537445
4
AbdullahF. (2006b). The development of HEdPERF: a new measuring instrument of service quality for the higher education sector. Int. J. Consum. Stud.30, 569–581. doi: 10.1111/j.1470-6431.2005.00480.x
5
AboubakrR. M.BayoumyH. M. M. (2022). Evaluating educational service quality among dentistry and nursing students with the SERVQUAL model: a cross-sectional study. J. Taibah Univ. Med. Sci.17, 648–657. doi: 10.1016/j.jtumed.2022.01.009
6
Abu-RummanA.QawasmehR. (2022). Assessing international students’ satisfaction of a Jordanian university using the service quality model. J. Appl. Res. Higher Educ.14, 1742–1760. doi: 10.1108/JARHE-05-2021-0166
7
AghamolaeiT.ZareS. (2008). Quality gap of educational services in viewpoints of students in Hormozgan university of medical sciences. BMC Med. Educ.8:34. doi: 10.1186/1472-6920-8-34
8
AlemuA. (2023). Assessing service quality in tertiary education using adapted SERVQUAL scale. Cogent Educ.10, 1–15. doi: 10.1080/2331186X.2023.2259733
9
AlhazmiF. A. (2020). Saudi university students’ perceptions of service quality in higher education. J. Educ. Learn.9, 151–169. doi: 10.5539/jel.v9n5p151
10
AlterkaitM. A.AlduaijM. Y. (2024). Impact of information quality on satisfaction with E-learning platforms: moderating role of instructor and learner quality. SAGE Open14, 1–13. doi: 10.1177/21582440241233400
11
AlvesH.RaposoM. (2007). Conceptual model of student satisfaction in higher education. Total Qual. Manag. Bus. Excell.18, 571–588. doi: 10.1080/14783360601074315
12
AmzatI. H.Mohd AliH.IbrahimM. B.OthmanA.Bin SallehM. J.Alade NajimdeenA. H. (2023). Internationalization of higher education, university quality service, and international students’ loyalty in Malaysia. SAGE Open13, 1–18. doi: 10.1177/21582440231210498
13
AngellR. J.HeffernanT. W.MegicksP. (2008). Service quality in postgraduate education. Qual. Assur. Educ.16, 236–254. doi: 10.1108/09684880810886259
14
AnnamdevulaS.BellamkondaR. S. (2016). Effect of student perceived service quality on student satisfaction, loyalty and motivation in Indian universities: development of HiEduQual. J. Model. Manag.11, 488–517. doi: 10.1108/JM2-01-2014-0010
15
AsaduzzamanM.Moyazzem HossainM.HossainM.RahmanM. (2013). Moyazzem Hossain, Mahabubur Rahman. Service quality and student satisfaction: a case study on private universities in Bangladesh. International. J. Econ.1, 128–135. doi: 10.11648/j.ijefm.20130103.11
16
AyazN.ArakayaA. (2019). Service quality measurement in higher education: the case of Registrar’s office. J. Higher Educ. Sci.9, 123–133. doi: 10.5961/jhes.2019.315
17
BahadurS. G. C.GurungS. K.PoudelR. L.YadavU. S.BhattacharjeeA.DhunganaB. R. (2024). The effect of higher education service quality on satisfaction among business students in India and Nepal. Cogent Educ.11, 1–12. doi: 10.1080/2331186X.2024.2393521
18
BanO. I.HatosR.BugnarN. G.SasuD.PopaA. L.ForaA. F. (2024). Evaluation of the quality of higher education services by revised IPA in the perspective of digitization. Sustainability16, 3017. doi: 10.3390/su16073017
19
BarnesB. R. (2007). Analysing service quality: the case of post-graduate Chinese students. Total Qual. Manag. Bus. Excell.18, 313–331. doi: 10.1080/14783360601152558
20
BhattacharjeeK.PritiC. (2020). Measuring service quality in higher education: an application of “SERVQUAL” model. Dogo Rangsang Res. J.10, 66–84.
21
BhuianS. N. (2016). Sustainability of Western branch campuses in the Gulf region: students’ perspectives of service quality. Int. J. Educ. Dev.49, 314–323. doi: 10.1016/j.ijedudev.2016.05.001
22
BorishadeT. T.OgunnaikeO. O.SalauO.MotilewaB. D.DirisuJ. I. (2021). Assessing the relationship among service quality, student satisfaction and loyalty: the NIGERIAN higher education experience. Heliyon7:e07590. doi: 10.1016/j.heliyon.2021.e07590
23
BosuL.AsareP. Y.AgormedahE. K. (2018). Service quality and students’ level of satisfaction in higher education. ICERI2018 Proceed.1, 9694–9701. doi: 10.21125/iceri.2018.0792
24
BrochadoA. (2009). Comparing alternative instruments to measure service quality in higher education. Qual. Assur. Educ.17, 174–190. doi: 10.1108/09684880910951381
25
BudiyantiH.PatiroS. P. S.DjajadiM.AstutyS. (2020). Does service quality in education and training process matters? Study of government’s human resource agencies in Indonesia. J. Effic. Respons. Educ. Sci.13, 41–55. doi: 10.7160/eriesj.2020.130104
26
BunceL.BairdA.JonesS. E. (2017). The student-as-consumer approach in higher education and its effects on academic performance. Stud. High. Educ.42, 1958–1978. doi: 10.1080/03075079.2015.1127908
27
BwacheleV. W.ChongY. L.KrishnapillaiG. (2023). Perceived service quality and student satisfaction in higher learning institutions in Tanzania. Humanities and social sciences. Communications10, 1–12. doi: 10.1057/s41599-023-01913-6
28
ÇerriS. (2012). Assessing the quality of higher education services using a modified Servqual scale. Ann. Univers. Apulensis2, 664–679. doi: 10.29302/oeconomica.2012.14.2.32
29
Chanaka UshanthaR. A.Samantha KumaraP. A. P. (2016). A quest for service quality in higher education: empirical evidence from Sri Lanka. Serv. Mark. Q.37, 98–108. doi: 10.1080/15332969.2016.1154731
30
ChenQ.ChenN.YangY. (2023). The impact of college students’ perceived service quality in the context of regional integration of education. SAGE Open13, 1–14. doi: 10.1177/21582440231197505
31
ChuaC. (2004). Perception of quality in higher education. Proceedings of the Australian Universities Quality Forum 2004, 181–187
32
ÇınkırŞ.YıldızS.KurumG. (2021). Development of service quality scale in higher education: a validity and reliability study. Yuksekogretim Dergisi11, 161–173. doi: 10.2399/yod.20.688862
33
CroninJ. J.TaylorS. A. (1992). Measuring service quality: a reexamination and extension. J. Mark.56, 55–68. doi: 10.2307/1252296
34
CroninJ. J.TaylorS. A. (1994). Servperf versus Servqual: reconciling performance-based and perceptions-minus-expectations measurement of service quality. J. Mark.58, 125–131. doi: 10.1177/002224299405800110
35
CuthbertP. F. (1996a). Managing service quality in HE: is SERVQUAL the answer? Part 1. Manag. Serv. Qual.6, 11–16. doi: 10.1108/09604529610109701
36
CuthbertP. F. (1996b). Managing service quality in HE: is SERVQUAL the answer? Part 2. Manag. Serv. Qual.6, 31–35. doi: 10.1108/09604529610115858
37
DadoJ.PetrovicovaJ. T.RiznicD.RajicT. (2011). An empirical investigation into the construct of higher education service quality. Int. Rev. Manag. Mark.1, 30–42.
38
DangaisoP.MakudzaF.HogoH. (2022). Modelling perceived e-learning service quality, student satisfaction and loyalty. A higher education perspective. Cogent. Education9, 1–20. doi: 10.1080/2331186X.2022.2145805
39
DarawongC.SandmaungM. (2019). Service quality enhancing student satisfaction in international programs of higher education institutions: a local student perspective. J. Mark. High. Educ.29, 268–283. doi: 10.1080/08841241.2019.1647483
40
DashG.PaulJ. (2021). CB-SEM vs PLS-SEM methods for research in social sciences and technology forecasting. Technol. Forecast. Soc. Chang.173, 121092–121011. doi: 10.1016/j.techfore.2021.121092
41
DavisF. D.BagozziR. P.WarshawP. R. (1989). User acceptance of computer technology: a comparison of two theoretical models. Manag. Sci.35, 982–1003. doi: 10.1287/mnsc.35.8.982
42
De JagerJ.GbadamosiG. (2010). Specific remedy for specific problem: measuring service quality in south African higher education. High. Educ.60, 251–267. doi: 10.1007/s10734-009-9298-6
43
De Oliveira SantiniF.LadeiraW.J.SampaioC.H.da Silva CostaG. (2017). Student satisfaction in higher education: a meta-analytic study. J. Mark. High. Educ., 27, 1–18. doi: 10.1080/08841241.2017.1311980
44
De SilvaR. D. (2023). Developing a measurement scale for perceived service quality in higher education: an empirical study. J. Account. Finance10, 47–63. doi: 10.57075/jaf1022304
45
DevebakanN.EgeliH. A.KoçakN. (2019). Evaluation of service quality based on student expectations and perceptions in higher education institutions with SERVQUAL scale: a research in Dokuz Eylul University Izmir vocational school. Yuksekogretim Dergisi9, 201–212. doi: 10.2399/yod.18.047
46
ĐonlagićS.FazlićS. (2015). Quality assessment in higher education using the SERVQUAL model. Management20, 39–57.
47
DouglasJ.DouglasA.BarnesB. (2006). Measuring student satisfaction at a UK university. Qual. Assur. Educ.14, 251–267. doi: 10.1108/09684880610678568
48
ElliottK. M.HealyM. A. (2001). Key factors influencing student satisfaction related to recruitment and retention. J. Mark. High. Educ.10, 1–11. doi: 10.1300/J050v10n04_01
49
ElmA.LiljestrandJ. (2024). Developing student teachers’ critical awareness of information and communications technology in primary teacher education. Eur. J. Teach. Educ., 1–16. doi: 10.1080/02619768.2024.2407540
50
EnakrireB.LubbeS.OheiK. N. (2022). Measuring service quality delivered to undergraduate students at a public university in South Africa. HOLISTICA J. Bus. Public Admin.13, 41–62. doi: 10.2478/hjbpa-2022-0014
51
ErtuğrulI.SarıG. (2019). Hizmet Kalitesi Ölçümünde Servqual Tekniği: Bir Üniversite Uygulaması. Organ. Yönetim Bilimleri Dergisi11, 21–35.
52
FarisA.HimawanI.SidikM. H.AshlyzanM.BinM. Z.HasanM.et al. (2023). The precedents of University’s parcel service quality towards student satisfaction in a higher education institution using SERVQUAL model: a conceptual framework. Innov. Res. J.4, 1–10. doi: 10.30587/innovation.v4i1.5441
53
FitriH.HasanA.IliasA.AbdR.MohdR.RazakZ. A. (2008). Service quality and student satisfaction: a case study at private higher education institutions. Int. Bus. Res.1, 163–175. doi: 10.5539/ibr.v1n3p163
54
FornellC.LarckerD. F. (1981). Structural equation models with unobservable variables and measurement error: algebra and statistics. J. Mark. Res.18, 382–388. doi: 10.2307/3150980
55
FuchsK.FangpongK. (2021). Using the SERVQUAL framework to examine the service quality in higher education in Thailand. Educ. Q. Rev.4, 363–370. doi: 10.31014/aior.1993.04.02.286
56
GaleevaR. B. (2016). SERVQUAL application and adaptation for educational service quality assessments in Russian higher education. Qual. Assur. Educ.24, 329–348. doi: 10.1108/QAE-06-2015-0024
57
GallowayJ. N. (1998). The global nitrogen cycle: changes and consequences. Environ. Pollut.102, 15–24. doi: 10.1016/S0269-7491(98)80010-9
58
GefenD.StraubD.BoudreauM.-C. (2000). Structural equation modeling and regression: guidelines for research practice. Commun. Assoc. Inf. Syst.4, 1–77. doi: 10.17705/1CAIS.00407
59
GerşilM.GüvenH. (2018). Üniversitelerde Hizmet Kalitesinin Servqual Analizi İle Ölçülmesi: Celal Bayar Üniversite’nde Bir Uygulama. Ömer Halisdemir Üniversitesi İktisadi İdari Bilimler Fakültesi Dergisi11, 111–125. doi: 10.25287/ohuiibf.310015
60
GiannakisM.BullivantN. (2016). The massification of higher education in the UK: aspects of service quality. J. Furth. High. Educ.40, 630–648. doi: 10.1080/0309877X.2014.1000280
61
GoumairiO.AoulaE. S.SoudaS. B. E. N. (2020). Application of the servqual model for the evaluation of the service quality in Moroccan higher education: public engineering school as a case study. Int. J. Higher Educ.9, 223–229. doi: 10.5430/ijhe.v9n5p223
62
GreenH. J.HoodM.NeumannD. L. (2015). Predictors of student satisfaction with university psychology courses: a review. Psychol. Learn. Teach.14, 131–146. doi: 10.1177/1475725715590959
63
GreenP. (2014). Measuring service quality in higher education: a south African case study. J. Int. Educ. Res.10, 131–142. doi: 10.19030/jier.v10i2.8515
64
Guillén-GámezF. D.Gómez-GarcíaM.Ruiz-PalmeroJ. (2024). Competencia digital en labores de Investigación: predictores que influyen en función del tipo de universidad y género del profesorado de Educación Superior. Pixel-Bit Revista Medios Educ.69, 7–34. doi: 10.12795/pixelbit.99992
65
HairJ. F.BabinB. J.KreyN. (2017a). Covariance-based structural equation modeling in the journal of advertising: review and recommendations. J. Advert.46, 163–177. doi: 10.1080/00913367.2017.1281777
66
HairJ. F.HowardM. C.NitzlC. (2020). Assessing measurement model quality in PLS-SEM using confirmatory composite analysis. J. Bus. Res.109, 101–110. doi: 10.1016/j.jbusres.2019.11.069
67
HairJ. F.MatthewsL. M.MatthewsR. L.SarstedtM. (2017b). PLS-SEM or CB-SEM: updated guidelines on which method to use. Int. J. Multivariate Data Analysis1, 107–123. doi: 10.1504/IJMDA.2017.087624
68
HanayshaJ.AbdullahH.WarokkaA. (2011). Service quality and students’ satisfaction at higher learning institutions: the competing dimensions of Malaysian universities’ competitiveness. J. Southeast Asian Res. 2011, 1–10. doi: 10.5171/2011.855931
69
HarveyL.WilliamsJ. (2010). Fifteen years of quality in higher education (part two). Qual. High. Educ.16, 81–113. doi: 10.1080/13538322.2010.485722
70
HelgesenØ.NessetE. (2007). What accounts for students’ loyalty? Some field study evidence. Int. J. Educ. Manag.21, 126–143. doi: 10.1108/09513540710729926
71
HenselerJ.RingleC. M.SarstedtM. (2015). A new criterion for assessing discriminant validity in variance-based structural equation modeling. J. Acad. Mark. Sci.43, 115–135. doi: 10.1007/s11747-014-0403-8
72
HillF. M. (1995). Managing service quality in higher education: the role of the student as primary consumer. Qual. Assur. Educ.3, 10–21. doi: 10.1108/09684889510093497
73
HoqueU. S.AkhterN.AbsarN.KhandakerM. U.Al-MamunA. (2023). Assessing service quality using SERVQUAL model: an empirical study on some private universities in Bangladesh. Trends Higher Educ.2, 255–269. doi: 10.3390/higheredu2010013
74
HwangY.-S.ChoiY. K. (2019). Higher education service quality and student satisfaction, institutional image, and behavioral intention. Soc. Behav. Personal. Int. J.47, 1–12. doi: 10.2224/sbp.7622
75
JabbarA.AnalouiB.KongK.MirzaM. (2018). Consumerisation in UK higher education business schools: higher fees, greater stress and debatable outcomes. High. Educ.76, 85–100. doi: 10.1007/s10734-017-0196-z
76
JongbloedB.EndersJ.SalernoC. (2008). Higher education and its communities: interconnections, interdependencies and a research agenda. High. Educ.56, 303–324. doi: 10.1007/s10734-008-9128-2
77
KajenthiranK.KarunanithyM. (2015). Service quality and student satisfaction: a case study of private external higher education institutions in Jaffna, Sri Lanka. J. Bus. Stud., 1, 46–64. Handle
78
KanwarA.SanjeevaM. (2022). Student satisfaction survey: a key for quality improvement in the higher education institution. Journal of Innovation and Entrepreneurship, 11, 1–10. doi: 10.1186/s13731-022-00196-6
79
KhodayariF.KhodayariB. (2011). Service quality in higher education. Interdisciplinary Journal of Research in Business, 1, 38–46. Available at: https://www.academia.edu/download/104641083/Quality_20in_20Higher_20Education.pdf
80
KolterP.ClarkeR. (1987). Marketing for Health Care Organisation. Englewood Cliffs: Prentice-Hall, Inc.
81
LeBlancG.NguyenN. (1997). Searching for excellence in business education: an exploratory study of customer impressions of service quality. Int. J. Educ. Manag.11, 72–79. doi: 10.1108/09513549710163961
82
LienC.-H.CaoY.ZhouX. (2017). Service quality, satisfaction, stickiness, and usage intentions: an exploratory evaluation in the context of WeChat services. Comput. Hum. Behav.68, 403–410. doi: 10.1016/j.chb.2016.11.061
83
LiR. Y.KayeM. (1998). A case study for comparing two service quality measurement approaches in the context of teaching in higher education. Qual. High. Educ.4, 103–113. doi: 10.1080/1353832980040202
84
LodessoS. L.Van NiekerkE. J.JansenC. A.MüllerH. (2019). Student satisfaction regarding service quality at Ethiopian public higher education institutions: a case study. J. Student Affairs Africa6, 51–64. doi: 10.24085/jsaa.v6i2.3309
85
LuM.-T.HuangJ.-C.WangM.-H. (2024). Evaluating the Mobile learning quality for promoting the user needs in Taiwanese higher education during COVID-19. Int. J. Inform. Technol. Decision Making23, 629–649. doi: 10.1142/S0219622023500232
86
MacCallumR. C.WidamanK. F.PreacherK. J.HongS. (2001). Sample size in factor analysis: the role of model error. Multivar. Behav. Res.36, 611–637. doi: 10.1207/S15327906MBR3604_06
87
MacCallumR. C.WidamanK. F.ZhangS.HongS. (1999). Sample size in factor analysis. Psychol. Methods4, 84–99. doi: 10.1037/1082-989X.4.1.84
88
MagasiC.MasheneneR. G.NdengenesaD. M. (2022). Service quality and students’ satisfaction in Tanzania’s higher education: a re-examination of SERVQUAL model. Int. Rev. Manag. Mark.12, 18–25. doi: 10.32479/irmm.13040
89
MalikM. E.NawabS.NaeemB.DanishR. (2010). Job satisfaction and organizational commitment of university teachers in public sector of Pakistan. Int. J. Bus. Manag.5, 17–26. doi: 10.5539/ijbm.v5n6p17
90
ManeaN. P. (2014). The analysis of perception of master students regarding the quality of educational Services of Bucharest Universities. Procedia Econ. Finance15, 746–751. doi: 10.1016/S2212-5671(14)00451-1
91
McAdamR.WelshW. (2000). A critical review of the business excellence quality model applied to further education colleges. Qual. Assur. Educ.8, 120–130. doi: 10.1108/09684880010372716
92
MestrovicD. (2017). Service quality, students’ satisfaction and Behavioural intentions in STEM and IC higher education institutions. Interdiscip. Descr. Complex Syst.15, 66–77. doi: 10.7906/indecs.15.1.5
93
MgeniM. S.HajiH. A.YunusS. A.AbdullaA. A. (2024). Adoption of mobile application for enhancing learning in higher education: students’ views from the State University of Zanzibar, Tanzania. Afr. J. Sci. Technol. Innov. Dev.16, 265–273. doi: 10.1080/20421338.2023.2289248
94
MohammadiA.MohammadiJ. (2014). Educational service quality in Zanjan University of Medical Sciences from students’ point of view. World J. Educ.4, 86–93. doi: 10.5430/wje.v4n5p86
95
MostafaM. M. (2006). A comparison of SERVQUAL and I-P analysis: measuring and improving service quality in Egyptian private universities. J. Mark. High. Educ.16, 83–104. doi: 10.1300/J050v16n02_04
96
NadiriH.KandampullyJ.HussainK. (2009). Students’ perceptions of service quality in higher education. Total Qual. Manag. Bus. Excell.20, 523–535. doi: 10.1080/14783360902863713
97
NikelJ.LoweJ. (2010). Talking of fabric: a multi-dimensional model of quality in education. Compare40, 589–605. doi: 10.1080/03057920902909477
98
O’NeillM. A.PalmerA. (2004). Importance-performance analysis: a useful tool for directing continuous quality improvement in higher education. Qual. Assur. Educ.12, 39–52. doi: 10.1108/09684880410517423
99
OkunoyeA.FrolickM.CrableE. (2008). Stakeholder influence and ERP implementation in higher education. J. Inf. Technol. Case Appl. Res.10, 9–38. doi: 10.1080/15228053.2008.10856139
100
OldfieldB. M.BaronS. (2000). Student perceptions of service quality in a UK university business and management faculty. Qual. Assur. Educ.8, 85–95. doi: 10.1108/09684880010325600
101
OlisoZ. Z.AlemuD. D. (2023). Investigating Academic Service Quality in Ethiopian Public Higher Education: Insights from Students’ Perspectives. The Arab Journal for Quality Assurance in Higher Education, 16, 66–79. doi: 10.20428/ajqahe.v16i55.2145
102
OliverR. L. (1981). Measurement and evaluation of satisfaction processes in retail settings. J. Retail.57, 25–48.
103
OliverR. L. (1999). Whence consumer loyalty?J. Mark.63, 33–44. doi: 10.1177/00222429990634s105
104
ParasuramanA.BerryL.ZeithamlV. (1990). An empirical examination of relationships in an extended service quality model. Marketing Science Institute research program series, 12, 90–122. Google Scholar
105
ParasuramanA.ZeithamlV. A.BerryL. L. (1985). A conceptual model of service quality and its implications for future research. J. Mark.49:41. doi: 10.2307/1251430
106
ParasuramanA.ZeithamlV. A.BerryL. L. (1988). SERVQUAL: a multiple-item scale for measuring consumer perceptions of service quality. J. Retail.64, 12–40.
107
PariseauS. E.McDanielJ. R. (1997). Assessing service quality in schools of business. Int. J. Quality Reliability Manag.14, 204–218. doi: 10.1108/02656719710165455
108
PazokiS.HajiahmadiM.SaffariehE. (2024). The measurement of the quality of educational services provided to medical students of Semnan University of medical sciences based on the SERQUAL model. J. Family Med. Prim. Care13, 1213–1218. doi: 10.4103/jfmpc.jfmpc_1007_23
109
PrakashG. (2018). Quality in higher education institutions: insights from the literature. TQM J.30, 732–748. doi: 10.1108/TQM-04-2017-0043
110
PrasadM.SinghS. P. (2022). Service quality in higher education: a review. IARJSET9, 38–46. doi: 10.17148/IARJSET.2022.9110
111
PrugsamatzS.HeaneyJ. G.AlpertF. (2007). Measuring and investigating pretrial multi-expectations of service quality within the higher education context. J. Mark. High. Educ.17, 17–47. doi: 10.1300/J050v17n01_04
112
RahmawatiS. W. (2013). Employee resiliencies and job satisfaction. J. Educ. Health Commun. Psychol.2, 30–37. doi: 10.12928/jehcp.v2i1.3742
113
RajehM. T.AbduljabbarF. H.AlqahtaniS. M.WalyF. J.AlnaamiI.AljurayyanA.et al. (2021). Students’ satisfaction and continued intention toward e-learning: a theory-based study. Medical education. Online26, 1–8. doi: 10.1080/10872981.2021.1961348
114
RoloA.AlvesR.SaraivaM.LeandroG. (2023). The SERVQUAL instrument to measure service quality in higher education – a case study. SHS Web Conf.160, 1. doi: 10.1051/shsconf/202316001011
115
RowleyJ. E. (1996). Customer compatibility management: an alternative perspective on student-to-student support in higher education. Int. J. Educ. Manag.10, 15–20. doi: 10.1108/09513549610122147
116
RozakL. A.Bahri ArifinM.RykovaI. N.GrishinaO. A.KomariahA.NurdinD.et al. (2022). Empirical evaluation of educational service quality in the current higher education system. Emerg. Sci. J.6, 55–77. doi: 10.28991/ESJ-2022-SIED-05
117
RubyC. A. (1998). Assessing satisfaction with selected student services using SERVQUAL, a market-driven model of service quality. NASPA J.35, 331–341. doi: 10.2202/1949-6605.1059
118
SahneyS.BanwetD. K.KarunesS. (2004). Conceptualizing total quality management in higher education. TQM Mag.16, 145–159. doi: 10.1108/09544780410523044
119
SalibaK.ZoranG. A. (2018). Measuring higher education services using the SERVQUAL model. J. Univ. Excell.4, 160–179.
120
SantosoR.MurdionoM.MuhsonA.NadyaL. (2024). The quality of anti-corruption education in Indonesian schools: adaptation of the Servqual method. Int. J. Eval. Res. Educ.13:2482. doi: 10.11591/ijere.v13i4.28150
121
SarstedtM.HairJ. F.RingleC. M.ThieleK. O.GuderganS. P. (2016). Estimation issues with PLS and CBSEM: where the bias lies!J. Bus. Res.69, 3998–4010. doi: 10.1016/j.jbusres.2016.06.007
122
SchijnsJ. M. C. (2021). Measuring service quality at an online university: using PLS-SEM with archival data. Tert. Educ. Manag.27, 161–185. doi: 10.1007/s11233-021-09071-7
123
SchreinerL. A.NelsonD. D. (2013). The contribution of student satisfaction to persistence. J. College Student Retention15, 73–111. doi: 10.2190/CS.15.1.f
124
SeoY. J.UmK. H. (2023). The role of service quality in fostering different types of perceived value for student blended learning satisfaction. J. Comput. High. Educ.35, 521–549. doi: 10.1007/s12528-022-09336-z
125
ȘerbanV.StoianE. (2019). Quality assessment in higher education based on Servqual model. Scientific Papers Series Management, Economic Engineering in Agriculture and Rural Development, 19, 427–436
126
ShahjalalM.AlamM. Z.ChowdhuryA. H. (2021). Analysis of perception and expectation gaps in higher education institutions: a SERVQUAL approach. J. Knowledge Global.13, 45–73.
127
SherryC.BhatR. B.BeaverB.LingA. (2004). Students as customers: the expectations and perceptions of local and international students. HERDSA Conf. 379. doi: 10.13140/RG.2.1.4984.6808
128
SibaiM. T.BayJrB.RosaR.dela. (2021). Service quality and student satisfaction using ServQual model: a study of a private medical College in Saudi Arabia. Int. Educ. Stud.14, 51–58. doi: 10.5539/ies.v14n6p51
129
SoaresM. C.NovaskiO.AnholonR. (2017). SERVQUAL model applied to higher education public administrative services. Brazil. J. Operat. Product. Manag.14, 338–349. doi: 10.14488/bjopm.2017.v14.n3.a7
130
SohailM. S.HasanM. (2021). Students’ perceptions of service quality in Saudi universities: the SERVPERF model. Learn. Teach. Higher Educ.17, 54–66. doi: 10.1108/LTHE-08-2020-0016
131
SohailM. S.RajaduraiJ.RahmanN. A. A. (2003). Managing quality in higher education: a Malaysian case study. Int. J. Educ. Manag.17, 141–146. doi: 10.1108/09513540310474365
132
StankovskaG.ZiberiF.DimitrovskiD. (2024). Service quality and student satisfaction in higher education. Educ. Develop. Emerg. Develop. Countries, 22, 153–160.
133
ŠtimacH.ŠimićM. L. (2012). Competitiveness in higher education: a need for marketing orientation and service quality. Econ. Soc.5, 23–34. doi: 10.14254/2071-789x.2012/5-2/2
134
SultanP.WongH. Y. (2010). Service quality in higher education – a review and research agenda. Int. J. Qual. Serv. Sci.2, 259–272. doi: 10.1108/17566691011057393
135
SumiR. S.KabirG. (2021). Satisfaction of e-learners with electronic learning service quality using the servqual model. J. Open Innov.: Technol. Mark. Complex.7:227. doi: 10.3390/joitmc7040227
136
SutingA.LalV.VaraprasadG. (2020). Higher education quality assessment using SERVQUAL in 2020 international conference on system, computation, automation and networking (ICSCAN), Pondicherry, India, 1–5. doi: 10.1109/ICSCAN49426.2020.9262310
137
TalanT.DoğanY.KalinkaraY. (2024). Digital natives’ Mobile learning adoption in terms of UTAUT-2 model: a structural equation model. Innoeduca. Int. J. Technol. Educ. Innov.10, 100–123. doi: 10.24310/ijtei.101.2024.17440
138
TanK. C.KekS. W. (2004). Service quality in higher education using an enhanced SERVQUAL approach. Qual. High. Educ.10, 17–24. doi: 10.1080/1353832242000195032
139
TarhiniA.AlHinaiM.Al-BusaidiA. S.GovindaluriS. M.ShaqsiJ. A. (2024). What drives the adoption of mobile learning services among college students: an application of SEM-neural network modeling. Int. J. Inform. Manag. Data Insights4:100235. doi: 10.1016/j.jjimei.2024.100235
140
ThapaM. (2022). Impact of Service Quality on Student Satisfaction: A Case Study of Public Sector Higher Secondary Institution. The Batuk, 8, 1–15. doi: 10.3126/batuk.v8i1.43500
141
Toscano-HernándezA. E.Álvarez-GonzálezL. I.Sanzo-PérezM. J.RodríguezS. A. E. (2024). Service quality in higher education: a systematic literature review, 2007–2023. Estudios Gerenciales40, 13–30. doi: 10.18046/j.estger.2024.170.6244
142
TwumF. O.PeprahW. K. (2020). The impact of service quality on students’ satisfaction. Int. J. Acad. Res. Bus. Soc. Sci.10, 169–181. doi: 10.6007/ijarbss/v10-i10/7923
143
WeerasingheS. I. M.LalithaR.FernandoS. (2017). Students’ satisfaction in higher education literature review. Am. J. Educ. Res.5, 533–539. doi: 10.12691/education-5-5-9
144
WiderW.TanF. P.TanY. P.LinJ.FauziM. A.WongL. S.et al. (2024). Service quality (SERVQUAL) model in private higher education institutions: a bibliometric analysis of past, present, and future prospects. Soc. Sci. Human. Open9, 100805–100810. doi: 10.1016/j.ssaho.2024.100805
145
WidiartoS. (2023). Increasing student satisfaction through improving service quality at tourism colleges in East Jakarta. Majalah Ilmiah Bijak20, 160–172. doi: 10.31334/bijak.v20i1.3232
146
WolfeK. (2020). Service design in higher education: a literature review. Perspect. Policy Pract. High. Educ.24, 121–125. doi: 10.1080/13603108.2020.1792573
147
WongW. H.ChapmanE. (2023). Student satisfaction and interaction in higher education. High. Educ.85, 957–978. doi: 10.1007/s10734-022-00874-0
148
YangZ.Yan-pingL.JieT. (2006). Study on quality indicators in higher education: an application of the SERVQUAL instrument. Int. Conf. Service Syst. Serv. Manag.2006, 1280–1286. doi: 10.1109/ICSSSM.2006.320693
149
YılmazV.FilizZ.YaprakB. (2007). Servqual Yöntemiyle Yüksekögretimde Hizmet Kalitesinin Ölçülmesi. Anadolu Üniversitesi Sosyal Bilimler Dergisi, 7, 299–316. Handle
150
YousapronpaiboonK. (2014). SERVQUAL: measuring higher education service quality in Thailand. Procedia. Soc. Behav. Sci.116, 1088–1095. doi: 10.1016/j.sbspro.2014.01.350
151
ZafiropoulosC.VranaV. (2008). Service quality assessment in a Greek higher education institute. J. Bus. Econ. Manag.9, 33–45. doi: 10.3846/1611-1699.2008.9.33-45
152
ZaidiS. F. H.KulakliA.OsmanajV.ZaidiS. A. H. (2023). Students’ perceived M-learning quality: an evaluation and directions to improve the quality for H-learning. Educ. Sci.13, 578. doi: 10.3390/educsci13060578
153
ZammutoR. F.KeaveneyS. M.O’ConnorE. J. (1996). Rethinking student services: assessing and improving service quality. J. Mark. High. Educ.7, 45–70. doi: 10.1300/J050v07n01_05
154
ZhangM. F.DawsonJ. F.KlineR. B. (2021). Evaluating the use of covariance-based structural equation modelling with reflective measurement in organizational and management research: a review and recommendations for best practice. Br. J. Manag.32, 257–272. doi: 10.1111/1467-8551.12415
155
ZhuX.SharpJ. G. (2022). ‘Service quality’ and higher education: investigating Chinese international student and academic perspectives at a UK university. J. Furth. High. Educ.46, 1–19. doi: 10.1080/0309877X.2021.1875202
Summary
Keywords
higher education, student satisfaction, SERVQUAL, CB-SEM, Kazakhstan
Citation
Seitova M, Temirbekova Z, Kazykhankyzy L, Khalmatova Z and Çelik HE (2024) Perceived service quality and student satisfaction: a case study at Khoja Akhmet Yassawi University, Kazakhstan. Front. Educ. 9:1492432. doi: 10.3389/feduc.2024.1492432
Received
06 September 2024
Accepted
18 October 2024
Published
07 November 2024
Volume
9 - 2024
Edited by
Luis Portales Derbez, Monterrey Institute of Technology and Higher Education (ITESM), Mexico
Reviewed by
Antonio Palacios-Rodríguez, University of Seville, Spain
Nicoleta Dospinescu, Alexandru Ioan Cuza University, Romania
Updates
Copyright
© 2024 Seitova, Temirbekova, Kazykhankyzy, Khalmatova and Çelik.
This is an open-access article distributed under the terms of the Creative Commons Attribution License (CC BY). The use, distribution or reproduction in other forums is permitted, provided the original author(s) and the copyright owner(s) are credited and that the original publication in this journal is cited, in accordance with accepted academic practice. No use, distribution or reproduction is permitted which does not comply with these terms.
*Correspondence: H. Eray Çelik, ecelik@yyu.edu.tr
Disclaimer
All claims expressed in this article are solely those of the authors and do not necessarily represent those of their affiliated organizations, or those of the publisher, the editors and the reviewers. Any product that may be evaluated in this article or claim that may be made by its manufacturer is not guaranteed or endorsed by the publisher.