 Milja Curcin
 Ming Wei Lee
- Office of Qualifications and Examinations Regulation (Ofqual), Coventry, United Kingdom
Traditional common-item or common-person statistical equating cannot always be used for standard maintaining or linking between test forms. In some contexts, comparative judgment (CJ) methods which capture expert judgment of quality of student work on different test forms have been trialed for this purpose. While plausibility, reliability and replicability of CJ outcomes has been shown to be high, little research has established the extent of CJ accuracy, that is, agreement between CJ outcomes and outcomes established by robust statistical equating. We report on the accuracy of outcomes from several trials and replications of different CJ methods and different associated analytical approaches, compared to operational IRT statistical equating, demonstrating largely close alignment between the two. We also compare different CJ methods (and different analytical approaches) in terms of outcome precision, replicability and evidence of bias in expert judgment (that is, a tendency to prefer student work on easier test forms). We discuss the advantages and disadvantages of different CJ methods and analytical approaches and their potential for informing standard maintaining in different contexts.
1 Introduction
In this paper, we evaluate whether test equating based on comparative judgment (CJ) can accurately identify equivalent marks on different test forms. We consider the quality of CJ-based equating outcomes against the outcomes of well-established statistical equating, and effects of different methods of collecting and analyzing CJ data on outcomes. We intend this evidence to inform consideration of the use of CJ in standard maintaining or linking contexts where traditional statistical equating cannot be used.
Standard maintaining or linking aims to ensure that students with the same level of ability1 get equivalent marks/grades irrespective of changes in test difficulty in different examination sessions. In some contexts, standard maintaining or linking can be achieved by statistical equating. Statistical equating methods identify equivalent marks on different parallel (i.e., largely similar) test forms, adjusting for differences in test difficulty so that a score on one form has the same meaning as the equivalent score on another form. There are many methods of statistical equating whose application requires particular data collection designs such as common-item non-equivalent group, single group, or random groups design linking candidate performances on the two test forms (Kolen and Brennan, 2014).
However, there are live testing situations where the common data collection designs cannot be implemented, making it impossible to use traditional statistical equating (Bramley and Vidal Rodeiro, 2014). For instance, re-use of items across test forms, required as anchor items in the common-item non-equivalent group design, may not be feasible or desirable for confidentiality reasons. There may typically be few, or no, genuine common candidates sitting the two test forms, rendering the single group design impossible. It may also be inappropriate to assume, as required in the random groups design, that the two test forms are taken by random groups from the same population. Therefore, when traditional statistical equating cannot apply, it may be necessary to involve an external link for equating/linking two tests. CJ methods have been explored as a way of providing such a link (e.g., Benton, 2021; Black and Bramley, 2008; Bramley, 2005; Gill and Bramley, 2013).
In CJ methods, judges (typically examiners or other subject experts) make many holistic comparisons of student work (scripts) from two different test forms that need to be equated and decide which script is better in each comparison, taking into account the relative difficulty of the test forms. Through statistical modeling of the judgment data, equivalent marks on the two test forms can be identified. This, like traditional statistical equating, allows us to adjust cut scores and account for group ability differences. Two distinct CJ methods for standard maintaining have emerged—which we shall refer to as the “scale-based” (Bramley, 2005, 2007) and “simplified” (Benton et al., 2020a; Benton, 2021) methods.
Research demonstrates that both CJ methods tend to derive plausible, reliable and replicable equating outcomes in the context of standard maintaining (Benton et al., 2020a,b; Benton et al., 2022; Black and Bramley, 2008; Curcin et al., 2019; Humphry and McGrane, 2015; Leech et al., 2022). Only one study explicitly compared the outcomes of different CJ methods, demonstrating little difference between them (Benton et al., 2022). However, probably because CJ is called for only when the context is not amenable to statistical equating and existing research was conducted in such contexts, little research has so far evaluated the accuracy and precision of CJ equating, or compared the efficacy of different CJ methods, by benchmarking against robust statistical equating. This is problematic from the perspective of potentially using CJ operationally for standard maintaining, especially in high-stakes contexts where the methods used would require solid justification.
A few experimental studies that did involve evaluation of CJ outcomes against statistical equating gave somewhat mixed results, with CJ outcomes sometimes closely aligning with and sometimes significantly departing from statistical equating outcomes (Benton et al., 2020a,b; Leech et al., 2022). In some cases, the discrepancies might be due to less-than-optimal statistical equating approaches used as comparators for CJ outcomes. For instance, in Leech et al. (2022), the statistical equating used as comparator for CJ was conducted between science test forms which are not parallel, having largely different content. This might explain the discrepancy observed between the CJ and statistical equating outcomes, with perhaps neither being a true reflection of the difficulty relationship between the test forms in question, and with content differences additionally making CJ more complex. Leaving aside the issue of benchmarking against potentially questionable statistical equating comparators, the evidence base from these three studies is too small to be helpful in forming a more general view about the extent of accuracy and precision of CJ equating outcomes.
Furthermore, the paucity of CJ accuracy evidence makes it hard to judge whether expert judges can indeed implicitly allow for the differences in difficulty between different test forms when judging relative script quality, which is an assumption of CJ methods when used for equating. This assumption can be challenged, considering the literature which suggests that judges have difficulty making precise estimates of empirical question difficulty in the first place (Attali et al., 2014; Benton, 2020; Brandon, 2004; Curcin et al., 2010; Goodwin, 1999; Gorin and Embretson, 2006; Holmes et al., 2018; Impara and Plake, 1998). It can be further challenged by evidence in the literature suggesting that judges may not be able to adequately compensate for known differences in test form difficulty, judging performances on more difficult forms more severely than those on easier ones, in a pattern we shall refer to as judgment bias.2 Such biased judgments would result in inaccurate equating and cut scores, leading to students getting lower grades than they should on more difficult test forms, and higher grades than they should on easier test forms despite their performances being objectively equivalent. For instance, research by Good and Cresswell (1988; see also Baird, 2007; Cresswell, 2000; Wheadon and Béguin, 2010) in the context of linking tiered exams,3 reported evidence of judgment bias. In the study, judges tended to award lower grades than would have been predicted statistically to students who took more demanding higher tier papers, and higher grades to those who took less demanding lower tier ones.
However, in studies that reported existence of judgment bias, the judgmental outcome was again benchmarked against potentially questionable comparators, namely, statistical predictions of grade distribution, which may or may not have represented the “true” distribution. Therefore, it is impossible to be certain whether the observed patterns did constitute judgment bias. In addition, the outcomes of these studies are all based on absolute judgments of grade worthiness rather than CJs, and on relatively small samples of judgments, leaving a possibility that any genuine bias might be related to the method of eliciting expert judgments. Indeed, a CJ study by Black and Gill (2006), also in the context of between-tier linking, did not observe this bias in the results. Furthermore, the context of tiered exams requires judges to compensate for a large difference in difficulty, as well as for differences in content domain, possible context effects on performance on common items, etc. This context is equally problematic for statistical equating. The studies that failed to find judgment bias tended to involve more straightforward standard maintaining scenarios, with smaller differences in difficulty between test forms (e.g., Benton et al., 2020a; Jones et al., 2016; Ofqual, 2019), and they involved comparative rather than absolute judgments.
The current study used student scripts completed as part of the National Reference Test (NRT) in English language and mathematics as input for CJ exercises. The NRT is used in England for annual monitoring of student attainment in these subjects. CJ is not necessary in the context of the NRT because the NRT is designed to enable IRT-based statistical equating to be used for linking different test forms and linking different student cohorts. It is the robust statistical estimation of item and test difficulty carried out during the operation of the NRT that we hoped to capitalize on in this study of CJ. By using student scripts from NRT test booklets with known difficulties as input for CJ exercises, we can compare estimates of relative booklet difficulty derived from CJs against the corresponding IRT-based estimates. As a high degree of confidence can be placed on the difficulty relationship between NRT test booklets established through IRT equating representing the “true” difficulty relationship, the comparator for CJ outcomes in our study was arguably the least questionable, compared to the studies reviewed above. Furthermore, this study used parallel test forms (rather than tiered exams) and comparative (rather than absolute) judgment to investigate judges’ ability to adjust for difficulty differences. All this allowed our study to provide a more robust assessment of CJ outcome accuracy and a more direct test of whether CJ methods are indeed beset with judgment bias, than is currently available in the literature.
In addition, given that the study reported here involved 17 individual CJ exercises on two different subjects and trialing different CJ methods, it adds a significant amount of evidence about the quality of CJ-based equating outcomes and the efficacy of different CJ methods to a limited existing evidence base. Overall, the findings should usefully inform consideration of operational use of CJ methods in standard maintaining or linking contexts where traditional statistical equating cannot apply.
In the following sections, we first describe the CJ methods trialed in the study followed by some key information about the NRT as a comparator for CJ and a description of the study design. We then describe the data analysis approaches and the basis of the metrics we used for evaluating CJ outcomes. The results are then presented, including the evaluation of judgment plausibility and CJ outcome accuracy, precision, replicability and bias. This is followed by a comparison of equating outcomes obtained by applying different analytical approaches to the data. Finally, we provide a summary and a discussion of the results and offer some concluding remarks.
2 Methods
2.1 CJ methods trialed in this study
The scale-based method (Bramley, 2005, 2007) involves collecting many script quality judgments about a relatively small sample of scripts from two tests (typically one script per mark point), and extrapolating from the judgments a common script quality scale which can be used to map the original marks from one test onto equivalent marks on the other test. In this method, it is crucial that each script is directly or indirectly compared with other scripts in the sample, with larger numbers of comparisons per script increasing the overall reliability of the result (Verhavert et al., 2019). This method can have different variants depending on the data collection design (see Bramley, 2005, 2007). In paired comparisons (henceforth, PCJ), the judges are each allocated a few dozen pairs of scripts, and asked to select the better script in each pair, with no ties allowed. In rank ordering (henceforth, RO), the judges are each allocated several sets of scripts, each set containing three to ten scripts, and asked to rank order the scripts in each set from best to worst.
The simplified pairs method (SP) (Benton et al., 2020a; Benton, 2021) also involves paired comparisons. SP and PCJ are similar from the judge’s perspective, except for a small amount of script repetition experienced by judges under PCJ. The key difference between the two methods is in script sampling. The analytical approach developed for SP dispenses with the creation of a quality scale common to both tests and the requirement of multiple comparisons per script. As only one comparison is required per script, more scripts (with multiple ones per mark point) can be included in the exercise. This should increase outcome accuracy and precision without increasing judging time (Benton, 2021), making this method potentially of great interest for operational use compared to the scale-based method.
More details on the specifics of the judging designs as implemented in each method in our CJ trials are provided in section 2.3.
2.2 The NRT in English language and mathematics as the CJ comparator
The scripts used in our trials of CJ methods came from the NRT. In this section, we provide some high-level information about the NRT as it pertains to how it was used in our study. For a detailed account of its development, delivery and equating procedures, we refer the reader to the published background report (Ofqual and NFER, 2018) and annual Results Digests (Burge and Benson, 2020; Ofqual, 2017; Whetton et al., 2018; Whetton et al., 2019). We assume the NRT has received sufficient scrutiny by assessment industry experts for us to have confidence in the defensibility of its design and robustness of its statistical estimation of item and test booklet difficulty, which we used as a comparator for CJ outcomes in this study.
The annual NRT started in 2017. It was constructed based on two years’ worth of trial data. The majority of items have remained unchanged since 2017. It tests the same constructs, and uses the same style of questions, as the General Certificate of Secondary Education (GCSE)4 exams in English language and math. It is administered to a nationally representative sample, for each subject, of over 6,000 16-year-old year 11 students a couple of months before they take their GCSE exams in the summer. The test was introduced to monitor changes in cohort-level attainment in these subjects year on year thereby informing standard-maintaining decisions in each summer’s live exams.
The NRT is made up of eight test booklets in each subject. Test questions are grouped into blocks, and each booklet contains two blocks of questions. The blocks are organized in an overlapping design such that each block, and therefore each question, appears in two booklets. As in many large-scale sample tests like the Programme for International Student Assessment (PISA), the overlapping booklets enable the common-item non-equivalent group data collection design, which is required for IRT analysis to be used to link and equate all booklets (Berezner and Adams, 2017). The NRT focuses on providing most precise information about cohort-level attainment at the 7/6, 5/4, and 4/3 grade boundaries on the 9-to-1 GCSE grade scale.
Each test booklet in English contains a reading block and a writing block, each with a maximum mark of 25. In math, each booklet tests all five content areas (number, algebra, geometry, probability and statistics, and ratio and proportion) in 13 or 14 questions, and has a maximum mark of 50.
The NRT is a one-hour test administered in schools by trained test administrators. Each student takes either an English or a math booklet. Each booklet is completed by over 800 students every year. Test scripts are marked on screen by trained markers. Quality assurance procedures are in place to ensure high quality marking, including the use of blind double marking for high-tariff items in English, and of pre-marked “seed responses” to monitor marking performance continuously in both subjects.
IRT analysis links the overlapping booklets and the current year’s as well as all previous years’ test-takers together by estimating all item difficulties and all test-taker abilities on a common scale. The IRT model used is an adaptation of the Nominal Response Model called the Extended Nominal Response Model (ENORM), which defaults to the Rasch model for dichotomous items and the Partial Credit Model for polytomous items (Maris et al., 2022; Partchev et al., 2023). From the second NRT in 2018, concurrent item parameter calibration is used for linking between years. The annual data analysis also includes evaluating whether model assumptions such as unidimensionality are met, and whether there has been any item parameter drift or evidence of item exposure warranting exclusion of particular items in year-to-year linking.
Following model fitting, the cumulative distribution of each year’s students’ abilities on the IRT scale is plotted. Benchmarking against the national outcomes of the summer 2017 GCSE exams, the percentages of students achieving grade 7 and above, grade 5 and above, and grade 4 and above at GCSE in summer 2017 are mapped to the NRT 2017 ability distribution to establish the ability thresholds (on the IRT scale) for the three key grade boundaries. Percentages of students in successive years reaching each threshold give a picture of any change over time in cohort-level attainment at each grade boundary.
2.3 NRT booklet selection and trial design
The results reported in the NRT 2020 Results Digest (Burge and Benson, 2020) were based on the above-mentioned IRT model in each subject fitted to four years (2017–2020) of data from a total of 26,653 and 26,894 NRT takers in English and math, respectively. We used the same model to estimate test characteristic curves (TCCs) for all eight booklets in each subject used in NRT 2019. (Only test scripts from 2019 were available for use in this study, which took place in 2020).
The TCCs give the marks (on the booklet mark scale) that students with different levels of ability are modeled to get on each booklet. Mapping the ability thresholds for the key grade boundaries to the TCCs allows derivation of notional grade boundary marks for individual booklets. These notional grade boundary marks provide a metric for comparing the booklets’ difficulties: a booklet with a higher grade boundary mark is easier at that grade boundary.
We carried out three CJ trials in math and one in English. In each trial, scripts from two NRT booklets were compared by experts using different CJ methods. For each trial, we selected a different pair of NRT booklets which had no common item, to mimic the operational context of maintaining standard between two tests which had no common item. While for math, we used complete booklets, for English, we used only the writing blocks, excluding the reading blocks. We focused on the writing tasks as they provided a greater contrast to math in terms of paper structure, helping to establish the generality of our findings about CJ methods. Unlike math (and reading), which largely require short responses, the writing tasks require an extended response. In the following, we shall use “English” to denote the writing task of an English booklet.
We designated one booklet in each CJ trial as form A (i.e., the “old” test, assumed to have known grade boundary marks established in a former series), and the other as form B (i.e., the “new” test in the latest series, for which we need to determine the grade boundary marks which correspond to the same ability level as in form A). The form A/B designation was done to mimic what standard maintaining involves, and to facilitate data analysis. The judges were not told about the designation.
Table 1 shows the difficulty relationship between the NRT booklets selected for the study. This is illustrated via the notional grade boundary marks, which are the expected marks obtained from the relevant TCCs and rounded to whole numbers. It can be seen that the difficulty differences between pairs of booklets are not the same across the entire ability range—in some cases, one booklet is easier for one part of the ability range but more difficult for another part. The maximum difference for math booklets is around 4% of the maximum mark, while the English booklets were identical in terms of difficulty.
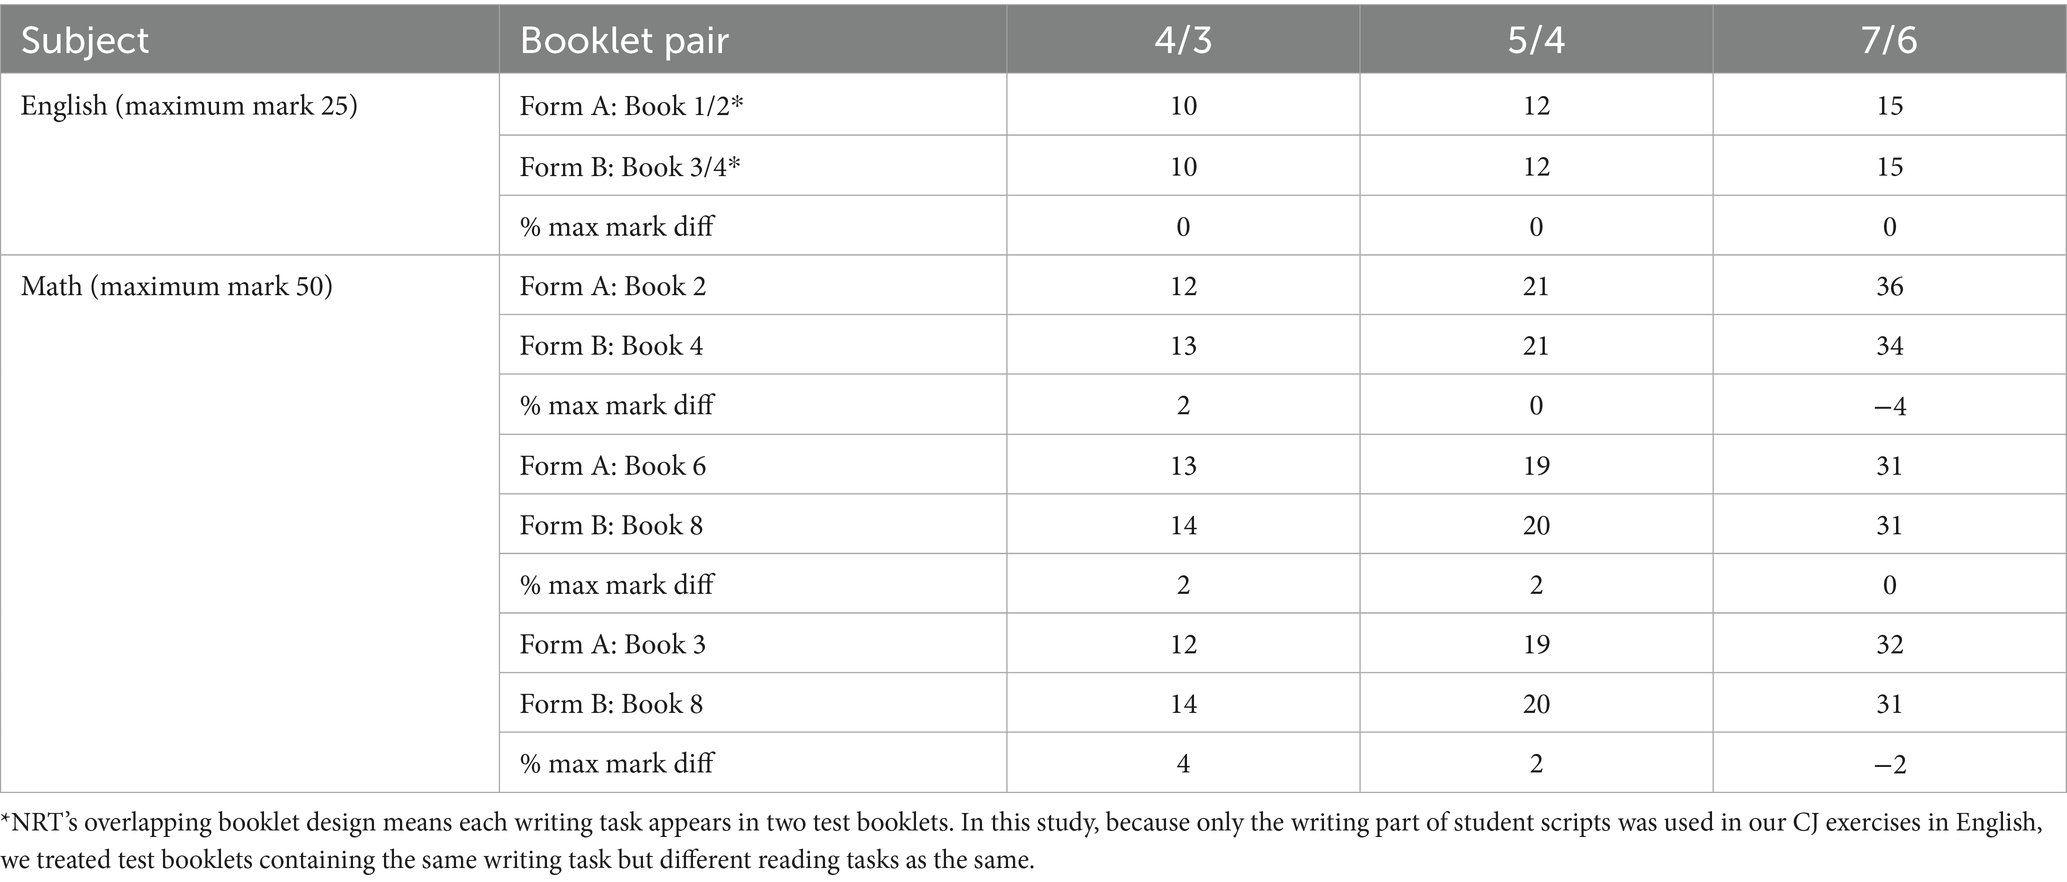
Table 1. Rounded grade boundary marks for English and math booklets used in the study and mark differences as percentages of maximum mark.
Table 2 shows the overall design of the study for each subject and the booklet pair and CJ methods used in each trial. 17 individual CJ exercises were conducted. SP and PCJ methods were used in math trials. The English trial used RO as well as SP and PCJ methods. Within each trial, we ran each CJ method twice (replications a and b), except for PCJ in trial 1 in math, to test the replicability of aggregated outcomes. In each case, replications a and b involved different judge groups and script samples and/or different script combinations from the same booklet pair.
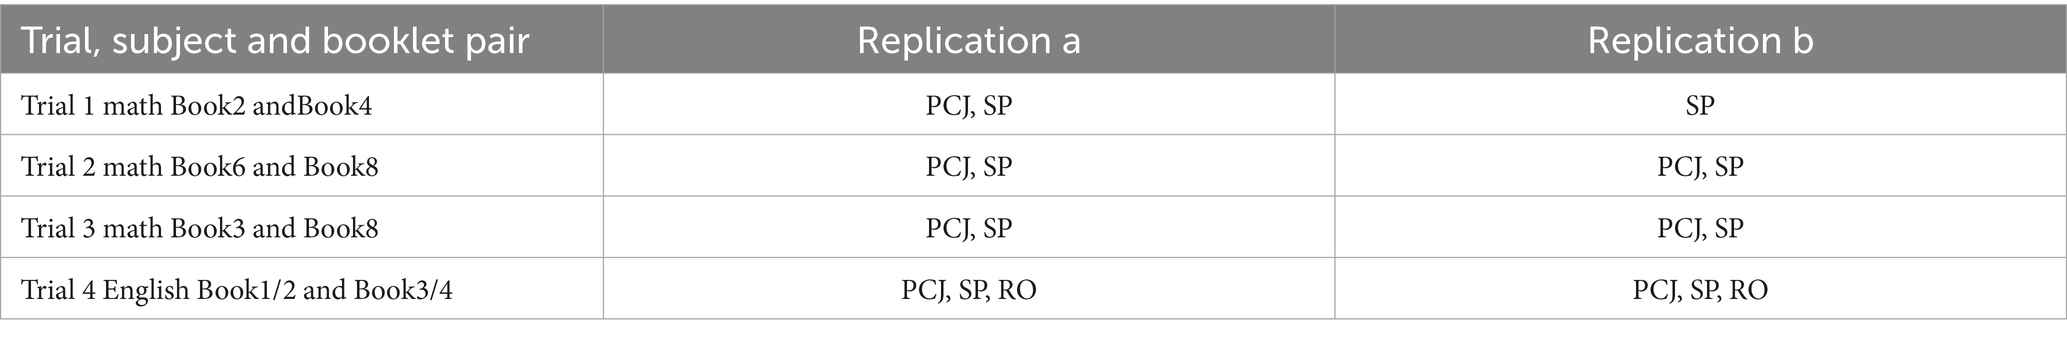
Table 2. Trials, methods, and replications.
2.4 Judges, script selection, judging allocation designs, and procedure
To ensure confidentiality of the NRT materials, we selected judges from among examiners who operationally marked the NRT tests and were already familiar with all the materials. We selected 24 English writing examiners and 24 math examiners from the wider pool based on operational data on their live marking performance. All judges were paid for their work.
Judges were randomly allocated to different exercises, with the constraint that the same judge would not be allocated to both replications within a trial. In English, each judge completed two exercises, one using PCJ and one using either SP or RO method. In math, each judge completed four exercises, using each of PCJ and SP methods at least once. The order in which the exercises were presented to judges was randomized.
Table 3 summarizes the key features of the judging designs for each individual CJ exercise and method. Exemplifying the principles discussed in 2.1, the number of comparisons per script was maximized in PCJ and RO exercises, while the number of scripts per mark was maximized for SP exercises. Across all methods, we selected scripts on most marks excluding the extreme marks. For math, all marks between 5 and 44 (out of 50) were included. For English, all marks between 4 and 23 (out of 25) were included, and scripts which elicited disagreement during operational double marking were excluded. Each sample included equal numbers of boys and girls, which approximated the gender split in the NRT population. For SP, up to 300 scripts were sampled with an approximately uniform distribution of marks within the above-mentioned ranges for each booklet, giving sample mean marks of 22.4–23.9 (SD 10.7–11.2) for math and 12.2–12.4 (SD 4.5–4.8) for English across booklets. For PCJ/RO, one script per mark point was selected, resulting in the same mean and standard deviation for every booklet’s script sample (mean 24.5, SD 11.7 for math; mean 13.5, SD 5.9 for English).
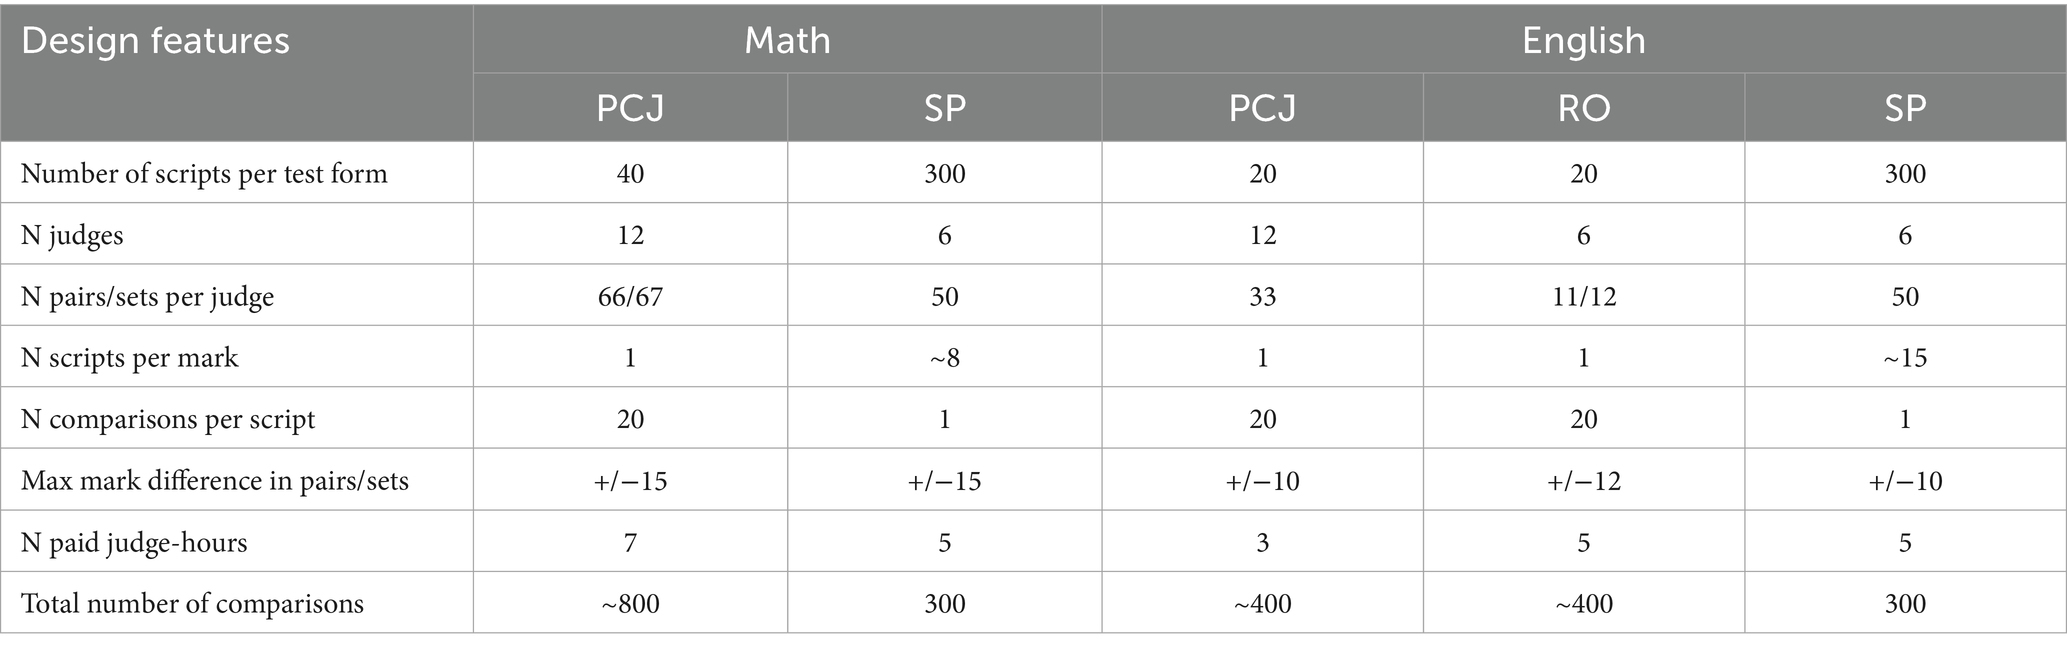
Table 3. Features of math and English judging allocation designs in each individual CJ exercise and each method.
In SP and PCJ exercises, the scrips were randomly assigned to pairs with the constraint that the largest mark difference in a script pair was 15 marks in math and 10 marks in English. In PCJ, some script pairs contained scripts from the same booklet and some from different booklets, while in SP all script pairs contained scripts from different booklets. In RO exercises in English, each set contained four scripts, two from one booklet and two from the other, with maximum allowed mark difference of 12. No script pair/set was repeated for the same judge or between judges in any exercise. In most cases, each judge saw each script a maximum of two times across pairs/sets, and three times only in a small number of instances.
For all exercises, the judgments were made on-screen using the Cambridge University Press and Assessment Comparative Judgment Tool.5 Before starting each exercise, the judges were asked to consider the relevant booklet pair, decide on and keep in mind the relative booklet difficulty, and take it into account when making holistic judgments of script quality (they did not know the statistical difficulty relationship between booklets). They were reminded to take into consideration all the work present in each script and not focus on a subset of questions only. No student identifiers, marks or other annotations were visible on any script. Mark schemes were provided for reference.
The judges were asked to answer the following question for each script pair in the PCJ and SP exercises:
“Which of these two scripts is better, based on a holistic judgment of overall quality?”
The following instruction was given for each script set in the RO exercises:
“Rank order these scripts from best to worst in terms of overall quality.”
2.5 Data analysis
There are different ways to analyze CJ data, some of which depend on the data collection method. The “direct approach” (Benton, 2021) can be applied to data from different CJ methods, including SP, PCJ and RO, thereby allowing comparisons of their outcomes on a common basis. For this reason, we shall present results of the “direct approach” analyses (including their “single” and “nonlinear” (NL) adjustment variants—see below) as the main results.
The more commonly used scale-based approach is compatible with scale-based methods (PCJ and RO) only. We ran scale-based analyses on the PCJ and RO data and compared the outcomes with the main analysis outcomes (see section 3.3). Below we describe the different analytical approaches and their variants used in our analysis.
2.5.1 Direct approach
The basic idea behind the direct approach is to extract from the judgment data an answer to the following question: if a form A script has x marks, how many marks would a form B script need in order to have a 50% chance of being judged as showing a better performance than the form A script? The approach is “direct” in the sense that in answering the above question, there is no need for an intermediate step of creating a script quality scale, which characterizes the alternative scale-based approach.
2.5.1.1 Direct approach applied to SP method
In the direct approach, the analysis of data from a CJ exercise using the SP method involves modeling the relationship between the script pair’s marks or mark difference and the probability of one test form’s script being judged as better, and then extrapolating from the relationship the marks or mark difference corresponding to a 50% probability of either test form’s script being judged as better (see Benton et al., 2020a; Benton, 2021).
The use of marks or mark difference in the modeling corresponds to the two variants of this approach, which differ in whether any difference in difficulty between two test forms is assumed to be constant or variable along the mark scale. Figure 1 provides a graphical illustration of the equating outcomes obtained by applying the two variants to the same CJ data. The single adjustment outcome is a horizontal straight line exhibiting a constant difference between equivalent form B and form A marks along the mark scale (in this example, the difference is barely different from zero). The nonlinear adjustment outcome allows for variable difference between equivalent form B and form A marks along the mark scale. (Note that Figure 1 also shows the IRT equating outcome for the two test forms established from operational NRT data.)
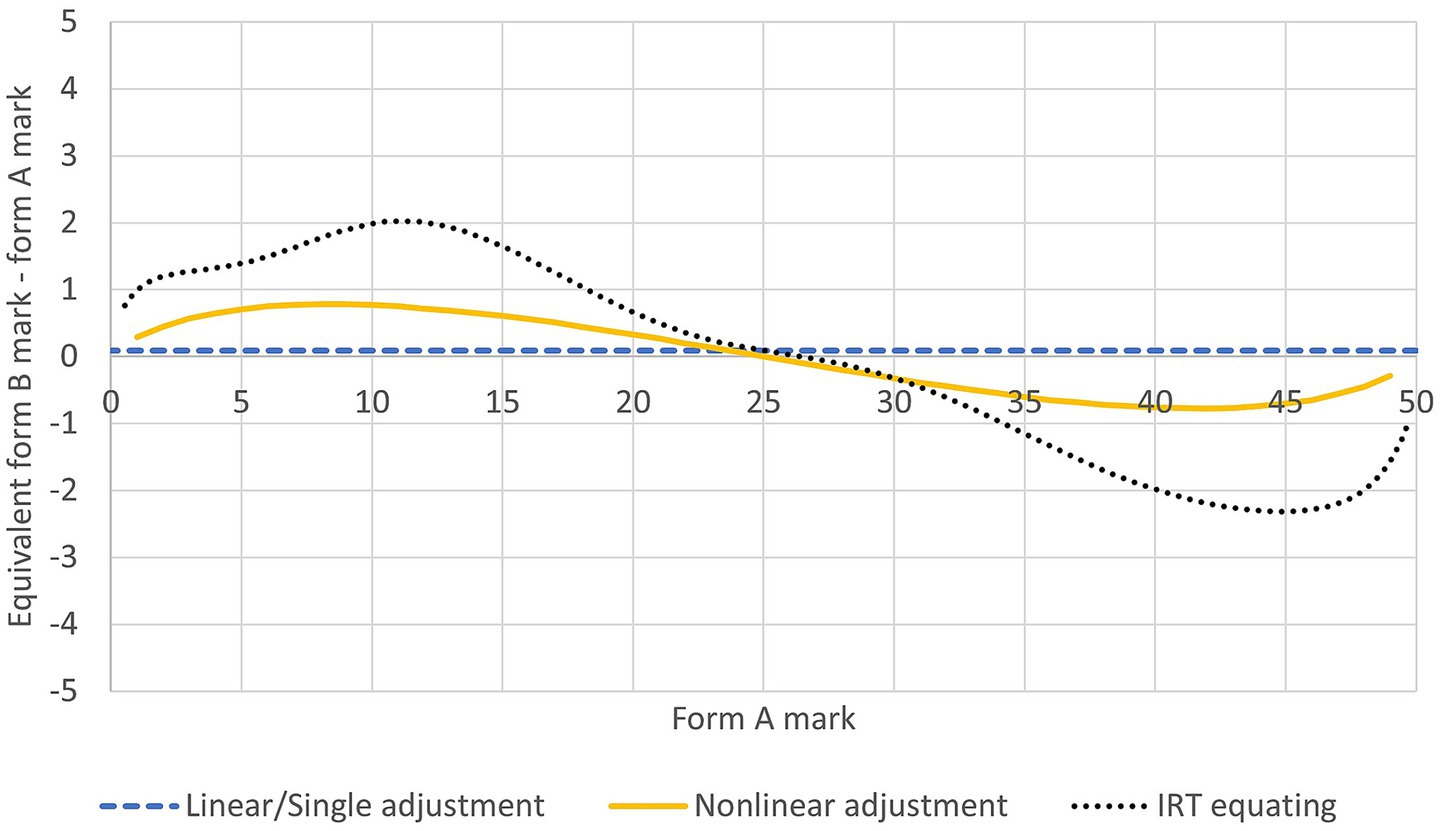
Figure 1. Example equating outcomes from applying the single adjustment and nonlinear adjustment variants of the direct approach to CJ data and from IRT analysis.
With the simpler single adjustment variant, logistic regression is used to model the relationship between the difference in script marks from two test forms (A and B) and the probability, given that difference, of scripts from one form being judged as better than scripts from the other form:
where xAij and xBij are the script marks of the script pair i seen by judge j and P(yij = 1) is the probability of the form A script of the script pair i being judged as better by judge j. Fitting the regression model (1) to the CJ data yields the regression coefficients β0 and β1. Then, the script mark difference obtained when P(yij = 1) = 0.5 can be computed as d = −β0/β1, and the standard error (SE) of d derived using the multivariate delta method.6 d quantifies the difference (assumed to be constant along the mark scale) between form A and form B marks, and the SE can be used to construct confidence intervals (CIs) around the equated marks.
With the more complex nonlinear adjustment variant, logistic regression is used to model the relationship between script marks from two test forms (A and B) and the probability, given those script marks, of scripts from one form being judged as better than scripts from the other form. More formally, following Benton et al. (2020a), marks of the two test forms are first transformed as in (2a, b):
where maxA and maxB are the maximum available marks, xA and xB the original non-zero marks that are not maxA and maxB, x*A and x*B the transformed marks, on test forms A and B, respectively. The logistic regression works on the transformed marks:
where x*Aij and x*Bij are the transformed marks for the script pair i seen by judge j and P(yij = 1) is the probability of the form A script of the script pair i being judged as better by judge j. Fitting the regression model to the CJ data yields the regression coefficients β0, β1, β2. Then for each possible value of x*A, the value of x*B when P(yij = 1) = 0.5 can be computed, and the SE of the computed x*B value can be derived using the multivariate delta method. The triplets of transformed marks and SE [x*A, x*B, SE(x*B)] are then back-transformed onto the respective mark scales [xA, xB, SE(xB)]. The xA-xB correspondences capture the difficulty relationship between the two test forms, and the SEs can be used to construct CIs around the equated marks.
For both variants of the direct approach, the CIs around the equating results quantify the variability in results due to script sampling variation and possibly inconsistency in the judgments made, but not necessarily other factors that can be seen as incidental (for instance, number and profile of judges, number of scripts to use, range and scale of script mark differences, criteria for selecting or excluding scripts from an exercise, the range of marks on the raw test mark scale to cover, etc., see Bramley and Gill, 2010).
2.5.1.2 Direct approach applied to PCJ and RO methods
For data from a CJ exercise using the PCJ method, models (1) and (3) above for the two variants of the direct approach can be expanded with random effects of form A and form B scripts to take account of script repetition in the PCJ method:
The same models can be used to analyze data from a CJ exercise using the RO method. Models (4) and (5) can be fitted to the paired comparisons into which all rank order judgments in the RO data can be converted (for example, the rank ordering of four scripts, 4 > 2 > 1 > 3 is equivalent to six paired comparisons, 4 > 2, 4 > 1, 4 > 3, 2 > 1, 2 > 3, 1 > 3).
Fitting the regression model to the PCJ or RO data yields the regression coefficients, which in turn allow xA-xB correspondences and their SEs to be computed.7
2.5.1.3 Check on judgment plausibility under direct approach
A key check on judgment plausibility is based on the idea that the more positive the mark difference (A-B) between the form A and form B scripts in a pair, the higher the probability of the form A script being judged as better, and the more negative the difference, the lower the probability. This predicts a good correlation between mark difference and binary decision in every judge’s judgments. Following Benton et al. (2020a), the relationship, averaging across all comparisons made by each judge, between mark difference and binary decision, is quantified using the point biserial correlation. The average of the correlations of the judges in each exercise is calculated and a 95% CI for it computed using Fisher’s R to Z transformation. Any judge whose correlation is below the lower limit of the CI is excluded from further analysis as their normatively low correlation is taken to indicate relatively implausible judgments resulting from misunderstanding the task requirement or insufficient care in making judgments.8
As a further check on the plausibility of these judgments, we calculated the average judging times in each exercise (recorded by the CJ platform) and evaluated these against our expectations, based on prior research evidence, of the plausible amount of time that might be required.9
2.5.2 Scale-based approach
2.5.2.1 Script quality scale
The scale-based approach is characterized by the creation of a scale of script quality that is common to the two test forms being equated. To illustrate, PCJ data (or RO data broken down into paired comparisons) can be analyzed with the Bradley-Terry model (BTM) (Bradley and Terry, 1952)10:
where θ1 and θ2 denote the script quality measures for the two scripts in a paired comparison and P12 the probability of script 1 being judged as better in the comparison. Fitting the model (6) to the data yields a script quality measure θ for every script used in the PCJ (or RO) exercise.
2.5.2.2 Regression: mark-on-measure and measure-on-mark
To link the scripts’ quality measures and original marks, the scripts’ original marks are regressed onto their script quality measures in an ordinary least squares linear regression (“mark-on-measure” regression), separately for each test form, as in models (7a, b):
where the subscripts A and B denote test forms A and B, x the original script mark, θ the script quality measure on the scale created with the BTM, m and c the regression coefficients (the slope and y-intercept of the linear regression line).
Alternatively, the script quality measures can be regressed onto the scripts’ original marks (“measure-on-mark” regression) as in models (8a, b):
There has been some discussion in the literature about the relative merits of the two regression specifications (see Benton, 2021; Bramley and Gill, 2010). We therefore ran both sets of analyses and present a comparison of their outcomes in Results (see section 3.3).
Either way, the regression analysis yields two sets of regression coefficients, one for each test form. For each possible xA value, the form A regression line is used to compute a corresponding θA value, and then by using the form B regression line and setting its θB to the computed θA value, a corresponding xB value can be computed. The xA-xB correspondences provide the equating relationship between form A and form B marks.
The SEs of the computed xB values are hard to determine as each step involved in arriving at the values introduces some error: the original test B marks contain measurement error; the θ estimates used in the regressions carry errors from the BTM; the regression coefficients carry errors and therefore the values computed by applying the regression lines also carry errors. What these accumulated errors quantify is unclear. To sidestep the issue of accumulated errors, previous research attempted to obtain SEs by bootstrapping (Curcin et al., 2019), but given the multiple steps involved in deriving the xB values, how the bootstrapping should be conducted is open to debate. Because of these unresolved issues, in this study, we did not compute SEs, and are not presenting CIs, of the equating outcomes from scale-based analyses.
2.5.2.3 Check on judgment plausibility under scale-based approach
As with the direct approach, some checks on the plausibility and consistency of judges’ judgments were performed. In addition to evaluating average judging times, we used Rasch model fit statistics to identify misfitting observations. After the initial BTM run, any observations with standardized residuals greater than 4 were removed, as they were taken to indicate judgments that substantially depart from what could be expected from the fitted model. The BTM was then re-run to re-estimate the script quality measures. Removing misfitting observations only rather than all observations from a judge (or a script) helped preserve most of the data.
Global model fit was checked by examining the overall proportion of misfitting judgments. Usually, this should be at or below what would be expected by chance, that is, less than about 5% of standardized residuals with an absolute value greater than 2, and less than about 1% with an absolute value greater than 3 (cf. Linacre, 2011). Another check was on the script quality scale created by the BTM (cf. Bond and Fox, 2007). This involved investigating scale separation reliability, separation and the correlation between original marks and BTM-based script quality measures.
2.5.3 Evaluating CJ equating outcomes
For each of the 17 CJ exercises shown in Table 2, the modeling using each variant of the applicable approach(es) described above allowed a CJ-based equating relationship between the relevant test forms to be produced across the mark range. In view of the standard maintaining context this research has been conducted in, we focused on comparing CJ- and IRT-based equating outcomes at the key grade boundaries, namely, 4/3, 5/4, and 7/6, instead of across the entire mark range.11
Therefore, from the CJ-based equating outcomes obtained from the modeling, for each CJ exercise and each IRT-based grade boundary mark in test form A (see Table 1), we worked out the CJ-based equated form B mark and, where applicable, its SE and CI. We then aggregated the CJ- and IRT-based equated form B marks in various ways to examine CJ outcomes’ accuracy and precision (see subsection 3.2.1), replicability (3.2.2), susceptibility to judgment bias (3.2.3) and compare the direct approach and scale-based approach outcomes (3.3). The aggregation method differed depending on the issue under examination. Details of the aggregation methods will be given in individual subsections in Results.
3 Results
3.1 Judgment plausibility
First, we performed a check on the plausibility of individual judges’ judgments in each exercise by examining judges’ point biserial correlations between binary decision and script mark difference. Following the criterion set out in 2.5.1.3, 10 of the 17 CJ exercises had no judge removed and the others each had one removed due to a normatively low correlation. Across judges that were retained in the different exercises, the point biserial correlations ranged from 0.51 to 0.95. We observed that in some exercises, removing a normatively misfitting judge improved the accuracy of the CJ outcomes, while in others it made no difference. Our judge removal decisions were based on a pre-defined criterion and not affected by their effects on the quality of CJ outcomes.
We also monitored how long judges took to make individual judgments. Despite variation in the time individual judges took to make individual judgments, the “robust” mean judgment time ranged from 2.41 to 4.56 min per script pair in PCJ and SP exercises, and 12.45–14.78 min per set in RO exercises, which was consistent with the times observed in previous research (Benton et al., 2020b; Benton et al., 2022; Curcin et al., 2019).
More details about the correlations and judgment time are presented in Supplementary Appendix 1.
3.2 Quality of CJ-based equating: main results based on direct approach
3.2.1 CJ accuracy and precision benchmarked against IRT equating
In this section, we examine the accuracy and precision of CJ equating outcomes. Figures 2, 3 present, for all grade boundaries in all exercises in each subject, on the x-axis, the difference between equivalent form A and IRT-equated form B marks, and on the y-axis, the difference between equivalent form A and CJ-equated form B marks. The horizontal spread of the data points gives an idea of how different the test forms used in our CJ exercises are in terms of difficulty. The proximity of the data points to the identity line represents the accuracy of CJ equating benchmarked against IRT equating. If CJ equating faithfully replicates IRT equating, all data points should lie on the identity line.

Figure 2. CJ- against IRT-equated marks at key grade boundaries in six combinations of CJ method (SP/PCJ/RO) and analytical variant (single/nonlinear adjustment under direct approach) in English (aggregating across exercises).

Figure 3. CJ- against IRT-equated marks at key grade boundaries in four combinations of CJ method (SP/PCJ) and analytical variant (single/nonlinear adjustment under direct approach) in math (aggregating across exercises).
Aggregating across exercises and grade boundaries, we calculated, separately for each subject and each combination of CJ method and direct approach variant, the average/mean and standard deviation of the raw differences, and the average absolute difference, between CJ- and IRT-equated marks. These measures quantify the degree of exact agreement between CJ and IRT equating outcomes. We calculated the average SE of the CJ-equated marks, to quantify the precision of CJ equating.
However, exact agreement may be too high a bar in comparing CJ- and IRT-based equating outcomes, because both CJ- and IRT-based equating involve modeling and to the extent that their model specifications are different, they are unlikely to produce identical results. We therefore also assessed whether the CJ and IRT equating outcomes were close enough by examining whether the relevant IRT-equated form B mark fell within the 95% CI of the CJ-equated form B mark. For this purpose, we calculated the average raw and absolute standardized differences (z scores) between the CJ- and IRT-equated mark, that is, the difference of the IRT-equated mark from the CJ-equated mark, expressed as a multiple of the SE of the CJ-equated mark. We took a z score beyond ±1.96 as indicating the IRT-equated mark lying outside the 95% CI of the corresponding CJ-equated mark.12 All calculated results are presented in Tables 4, 5.
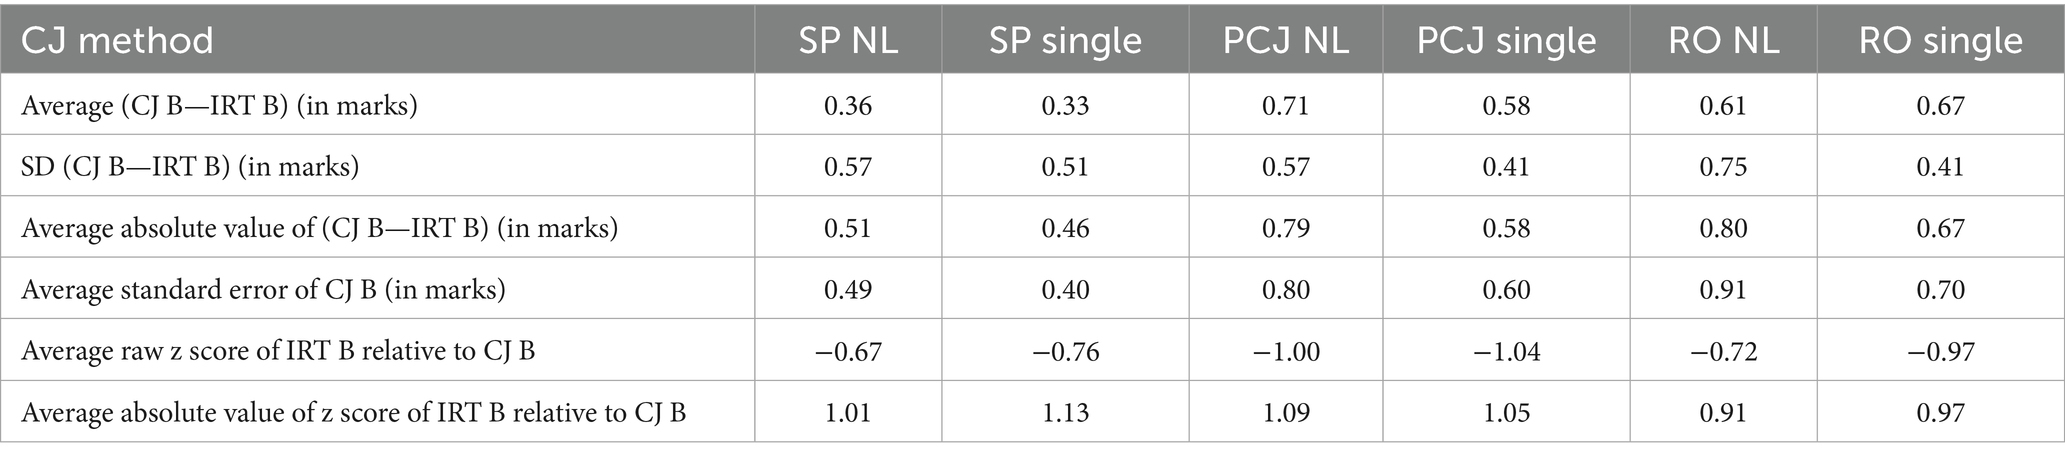
Table 4. CJ equating outcomes in six combinations of CJ method (SP/PCJ/RO) and analytical variant (single/nonlinear adjustment under direct approach) in English (aggregating across exercises and key grade boundaries).
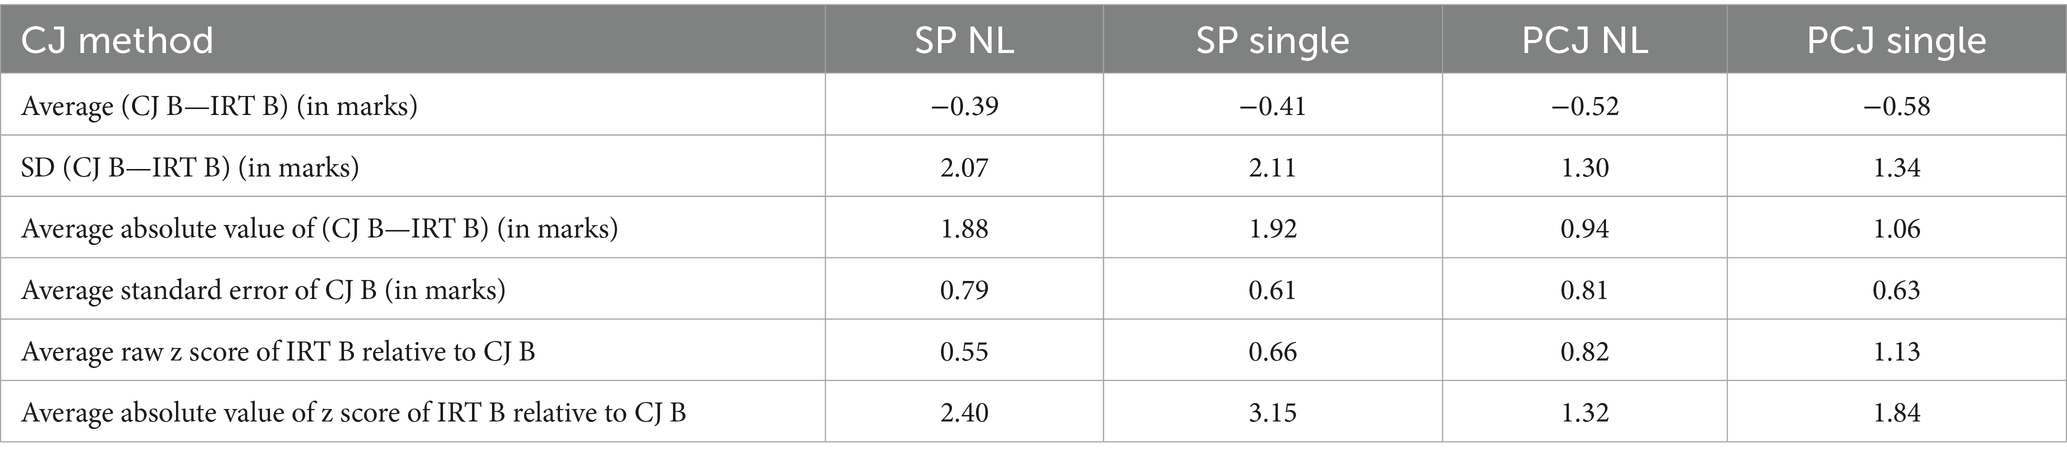
Table 5. CJ equating outcomes in four combinations of CJ method (SP/PCJ) and analytical variant (single/nonlinear adjustment under direct approach) in math (aggregating across exercises and key grade boundaries).
In Figure 2, the very limited horizontal spread of the data points follows from the observation above that the English test forms used in our study barely differ in difficulty. The data points are very close to the identity line, indicating close alignment between CJ and IRT equating outcomes. As can be seen in the average raw and absolute difference rows of Table 4, in English, under all combinations of CJ method and direct approach variant, the average difference between CJ- and corresponding IRT-equated marks was small, at under 1 mark (4% of the maximum mark of 25).
The average SE row in Table 4 suggests that the SP method and the single adjustment variant produced more precise CJ-equated marks than other CJ methods and the nonlinear adjustment variant, respectively. The two z score rows indicate that in English, under all combinations of CJ method and analytical variant, the IRT-equated mark was on average well within the 95% CI of the CJ-equated mark, with all values within ±1.96.
In Figure 3, the wider horizontal spread of the data points reflects the fact that some math booklet pairs used in our study have mark differences of up to 2 marks at some key grade boundaries. Unlike in English, here some data points are some way off the identity line, reflecting more discrepancies between CJ and IRT equating outcomes in math. It can be observed in Table 5 that the single adjustment variant produced more precise CJ-equated marks than the nonlinear adjustment variant (as in English), but the difference in CJ outcome precision between the SP and PCJ methods was less pronounced in math than in English.
Under all combinations of CJ method and analytical variant, there was some canceling out of differences in opposite directions leading to small average raw differences of around half a mark between CJ- and IRT-equated marks. The raw z score row in Table 5 suggests that on average, the IRT-equated marks were well within the 95% CIs of the CJ-equated marks.
The absolute differences between CJ- and IRT-equated marks were nearly 2 marks (4% of the maximum mark of 50) under the SP method and around 1 mark under the PCJ method. The absolute z score row indicates that after removing the canceling out of differences in opposite directions, the IRT-equated marks were within the 95% CIs of the CJ-equated marks under PCJ method only, suggesting greater overall accuracy under PCJ.
3.2.2 CJ replicability
For most trial/method combinations, we had two replications that made use of different script samples and different judges (see Table 2). Examining how similar the two replications’ outcomes are can tell us about CJ outcomes’ replicability.
Figures 4, 5 present, for all grade boundaries in all exercises in each subject, on the x-axis, the CJ-equated form B mark in one replication and on the y-axis, the CJ-equated form B mark in the other replication, both with the same corresponding IRT-equated form B mark subtracted. For any combination of CJ method and analytical variant, the further away the data points are from the identity line on either side, the more different, and hence the less replicable its CJ outcomes are.
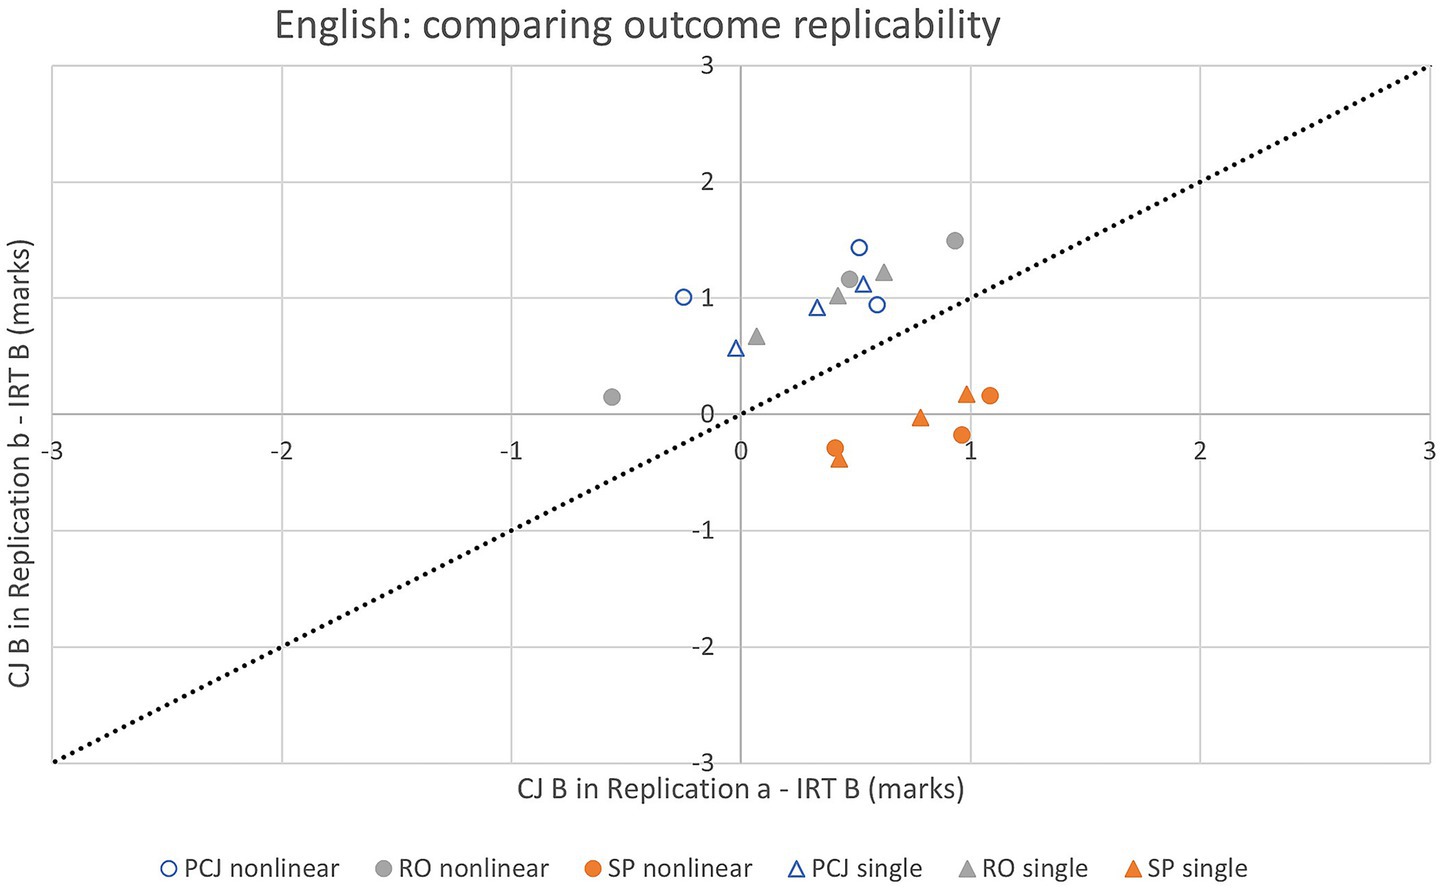
Figure 4. CJ replication outcomes at key grade boundaries in six combinations of CJ method (SP/PCJ/RO) and analytical variant (single/nonlinear adjustment under direct approach) in English (aggregating across exercises).
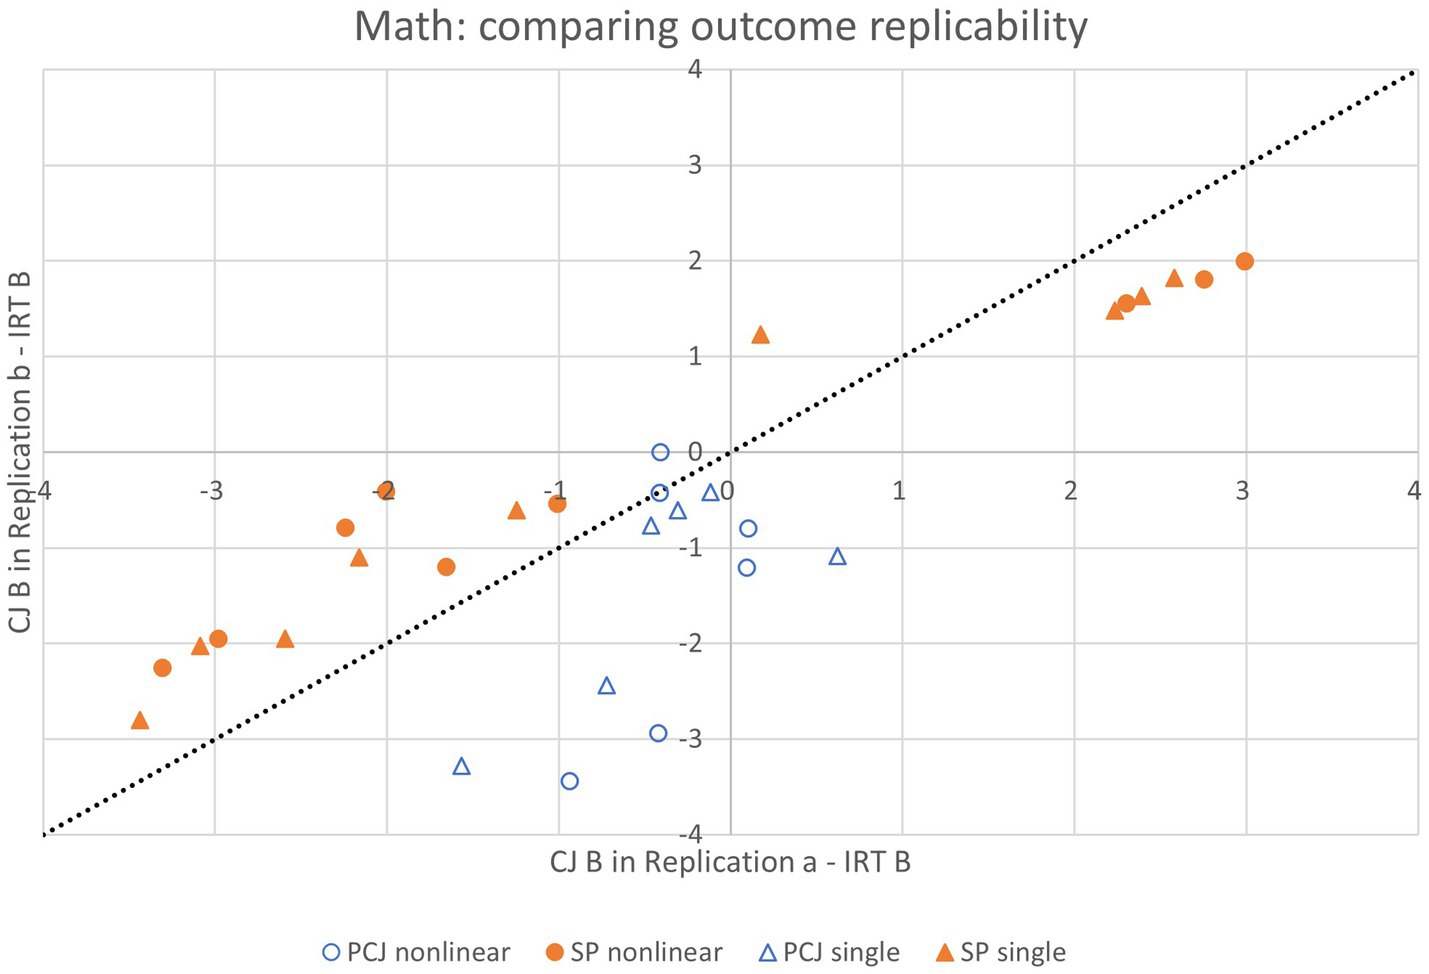
Figure 5. CJ replication outcomes at key grade boundaries in four combinations of CJ method (SP/PCJ) and analytical variant (single/nonlinear adjustment under direct approach) in math (aggregating across exercises).
In addition, aggregating across exercises and grade boundaries, we calculated, separately for each subject and each combination of CJ method and analytical variant, two measures of replicability: the average absolute difference between the CJ-equated marks from the two replications, and the average absolute standardized difference (z score) between the CJ-equated form B marks from the two replications, that is, the absolute difference between the two CJ-equated marks, expressed as a multiple of their pooled SE. A z score beyond 1.96 indicates CJ equating outcomes lying outside each other’s 95% CI. The results are presented in Table 6.
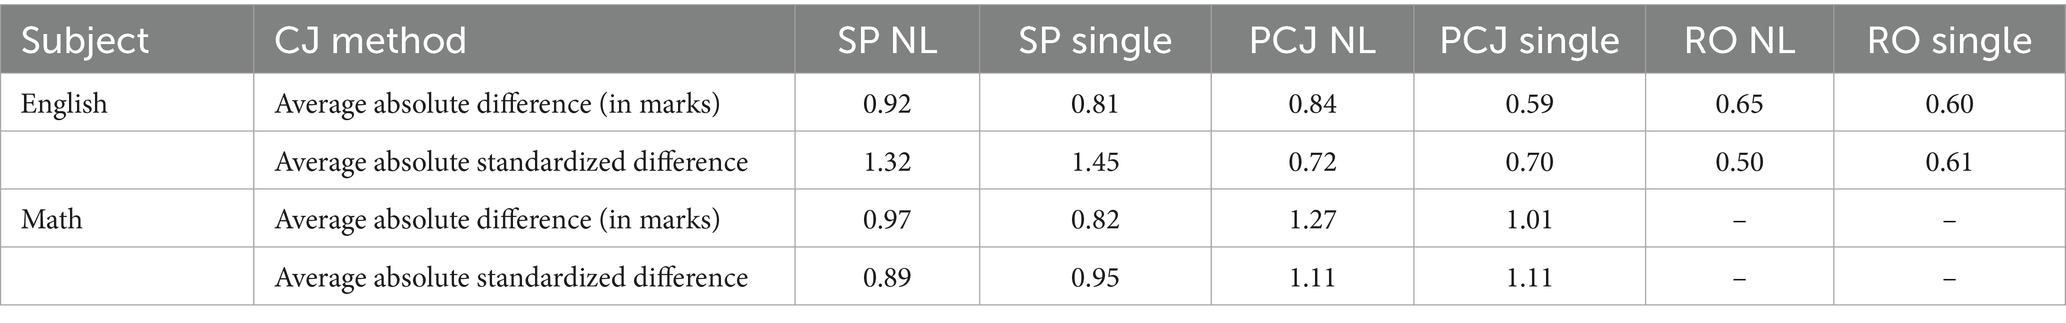
Table 6. Difference between CJ equating outcomes of two replications in four combinations of CJ method (SP/PCJ/RO) and analytical variant (single/nonlinear adjustment under direct approach) in English and math (aggregating across exercises and key grade boundaries).
Table 6 shows that the average absolute difference between replications ranged from 0.60 to 0.92 mark (out of 25) in English, and from 0.82 to 1.27 (out of 50) in math. The average absolute standardized differences indicate that under all combinations of CJ method and analytical variant, the replications produced CJ equating outcomes that were within each other’s 95% CI. Some small differences in replicability can be observed: more replicable CJ outcomes were found under the single adjustment variant than the nonlinear adjustment variant in both subjects while the SP method produced more replicable outcomes than the PCJ method in math, and vice versa in English.
3.2.3 Judgment bias in CJ outcomes
Recall that in the present context, judgment bias refers to judges not being able to sufficiently compensate for difficulty differences between two test forms when comparing performances on them. In the cases where, according to the IRT equating, form B is easier than form A (that is, the IRT-equated grade boundary mark is higher for form B than for form A), bias manifests itself as the CJ-equated grade boundary mark being lower than the corresponding IRT-equated mark for form B, allowing more form B candidates than there should be to achieve the relevant grade. Conversely, where form B is more difficult than form A (that is, the IRT-equated grade boundary mark is lower for form B than for form A), bias is present when the CJ-equated grade boundary mark is higher than the corresponding IRT-equated mark for form B, reducing the number of form B candidates achieving the relevant grade.
To assess whether our CJ outcomes reflect judgment bias, we focused on the few key grade boundaries in math where the IRT equating suggests the equivalent form A and form B marks differ by more than 1.5 marks. We divided these “bias test cases” into “form B easier” cases and “form B harder” cases (note that judges did not know which form was which while judging). Then, for each case type and each combination of CJ method and analytical variant, we calculated the average difference between the equivalent form A and CJ-equated form B marks and the average standardized difference (z score) between the CJ- and IRT-equated marks, aggregating across exercises and, where applicable, grade boundaries (see Table 7). Heuristically, if we go by point estimate comparison alone, the presence of judgment bias is indicated by the difference between the CJ-equated form B and form A marks carrying a different +/− sign than the difference between the IRT-equated form B and form A marks, or by the two differences carrying the same +/− sign and the CJ-based difference being not as large as the IRT-based difference in absolute value.
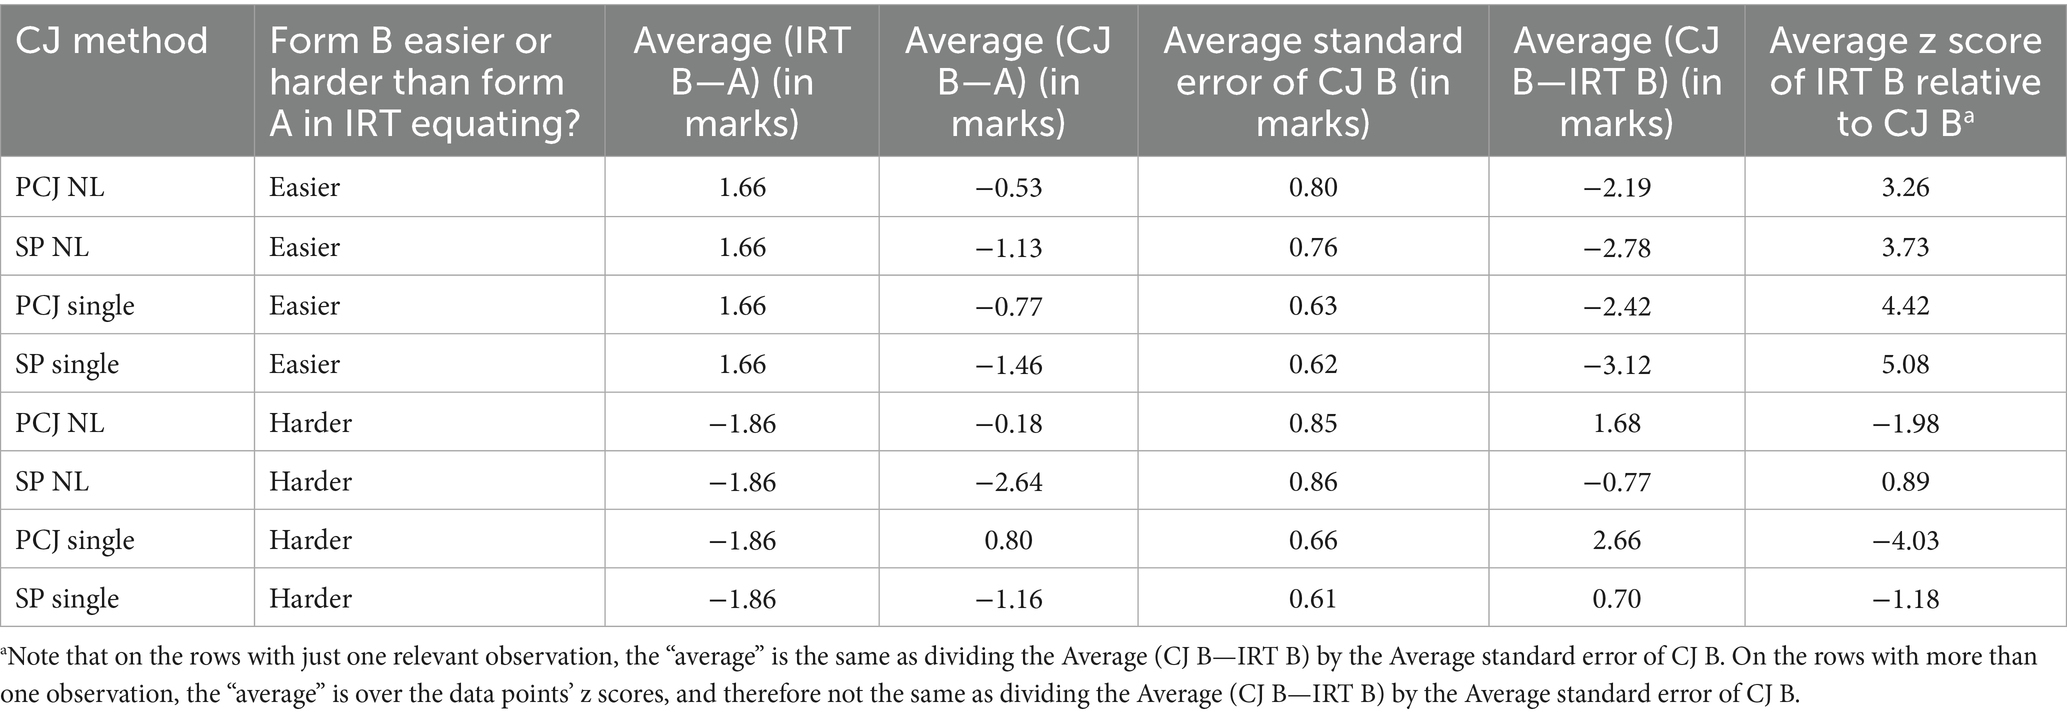
Table 7. CJ equating outcomes in bias test cases in four combinations of CJ method (SP/PCJ) and analytical variant (single/nonlinear adjustment under direct approach) in math (aggregating across exercises and key grade boundaries).
On the first four rows of Table 7, the z scores (in the rightmost column) are well beyond ±1.96, indicating that the IRT-equated mark was not within the 95% CI of the CJ-equated mark, and the average CJ-equated mark was lower, while the average IRT-equated mark was higher, than the equivalent form A mark (as can be seen in the Average (CJ B—A) and Average (IRT B—A) columns). This indicates that in the “form B easier” cases, under all combinations of CJ method and analytical variant, the CJ equating outcomes were very different from the IRT equating outcomes, and the difference was consistent with judgment bias.
In the “form B harder” cases (bottom four rows of Table 7), the results were more variable. In the combinations involving the SP method, the IRT-equated mark was within the 95% CI of the CJ-equated mark, suggesting little difference between the IRT and CJ equating outcomes. This can be interpreted as CJ equating outcomes containing no judgment bias (that is, the judges correctly adjusting for the greater difficulty of form B in their judgments) under the SP method. In the combinations involving the PCJ method, the IRT-equated mark was outside the 95% CI of the CJ-equated mark, and the differences between the equivalent form A and CJ-equated form B marks suggest that the CJ outcomes were consistent with judgment bias, with insufficient compensation for the difficulty difference between the test forms.
In sum, judgment bias was found more often than not. Evidence for bias was more consistent under the PCJ method, and the single vs. nonlinear adjustment variant did not seem to affect whether evidence for bias was found.
3.3 Comparing CJ equating outcomes from direct approach vs. scale-based approach
As noted in 2.5.2, data from the nine CJ exercises using the PCJ and RO methods can be subjected to a scaled-based analysis, which involves scale creation via the BTM (and for RO data only, PLM) and equating using different linear regression specifications (measure-on-mark and mark-on-measure). For each of the nine exercises, the model fitted, and the script quality scale created, after removal of misfitting observations, were evaluated in terms of Rasch model fit and scale properties (see Supplementary Appendix 4). The evaluation shows very high reliability (including as indicated by a high correlation between quality measures obtained from different replications) and mark-measure correlations (each of above 0.9) in all exercises. Supplementary Appendix 3 presents the equated form B marks for the key grade boundaries extracted from the equating relationship derived from the regressions produced by applying the different variants of the scale-based approach.
In this section, comparisons of outcomes from the direct and scale-based approaches are based on point estimates only. As noted in 2.5.2.2, we did not compute SEs or CIs of the equating outcomes in the scale-based analyses of PCJ and RO data, so comparisons in terms of standardized difference (i.e., z score) were not possible.
As can be seen from Table 8, for every combination of CJ method and subject, the difference in average absolute mark difference between any direct approach variant and any scale-based approach variant was well under 1 mark, and there was little difference between the results of alternative regression specifications. The RO method produced slightly more accurate results on average compared to PCJ in English under the scale-based approach. Further analyses suggest that the direct and scale-based approaches were comparable in their results’ replicability (Table 9) and presence of judgment bias (Table 10).
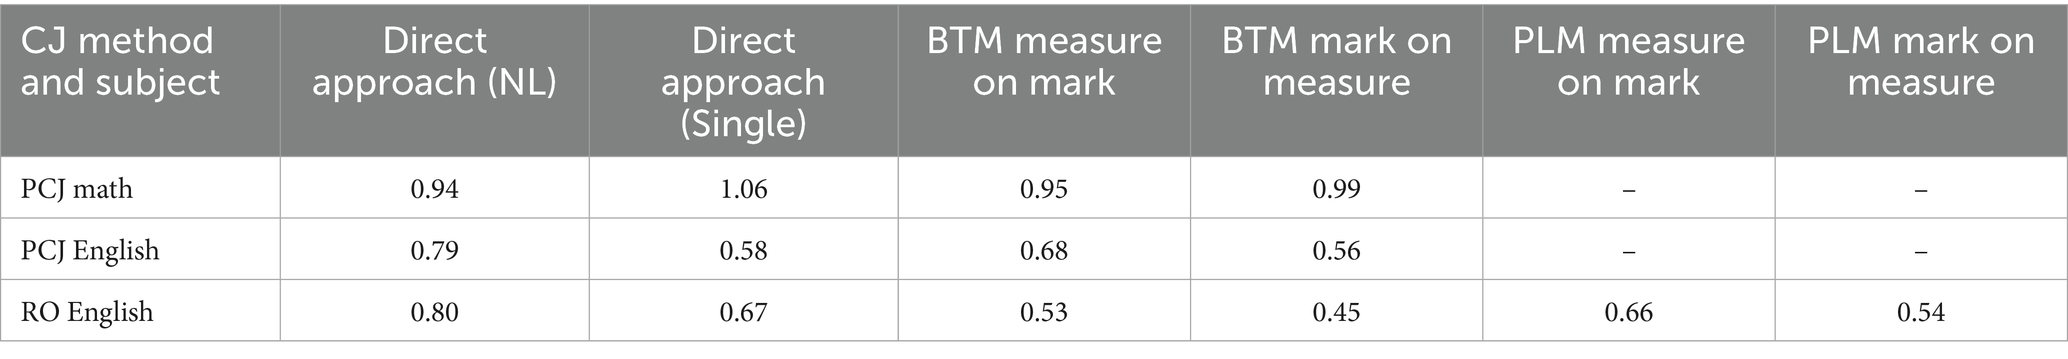
Table 8. Average absolute difference (in marks) between CJ- and IRT-equated marks.
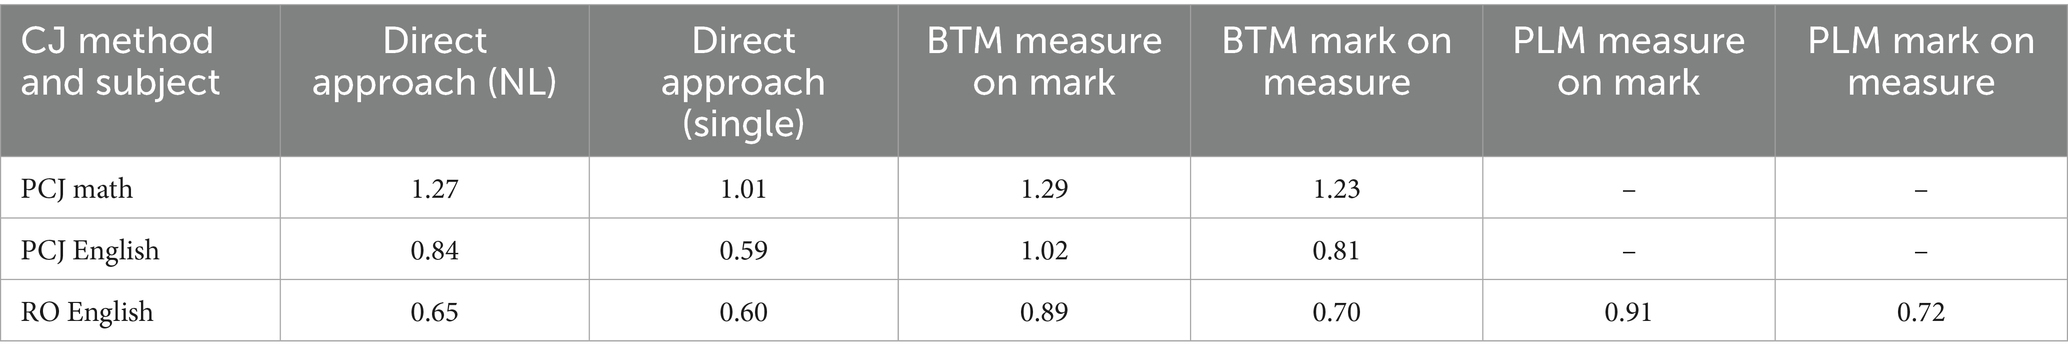
Table 9. Average absolute difference (in marks) between two replications’ CJ-equated marks.
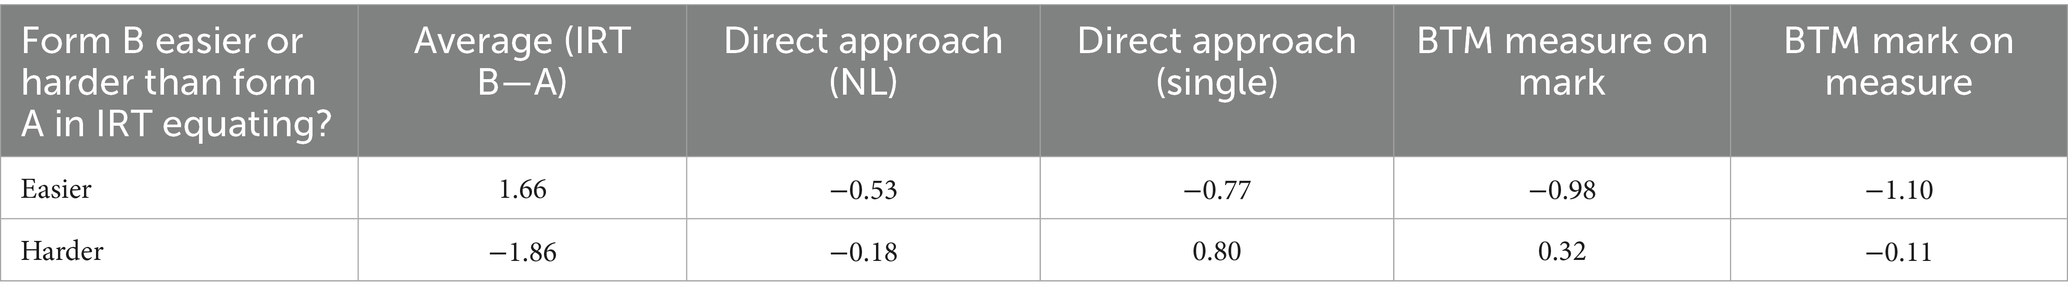
Table 10. Average difference between form A and CJ-equated form B mark in bias test cases under PCJ method in math.
4 Summary and discussion
4.1 Main findings
In English, all CJ methods produced broadly accurate equating outcomes. Aggregating across exercises and key grade boundaries, the CJ methods produced equated marks which on average differed from the corresponding IRT-equated marks by no more than 4% of the maximum available mark (1 mark out of 25), and whose CI always encompassed the IRT-equated marks.
The CJ equating outcomes were somewhat less accurate in math, where the CIs of the CJ-equated marks did not always encompass the IRT-equated marks, even though, similarly to English, the CJ-equated marks differed from the IRT-equated marks by no more than 2–4% of maximum mark on average (that is, 1–2 marks out of 50).
This difference in accuracy between the two subjects might reflect the effect of paper structure and predominant question type. English writing papers involve extended response questions, whereas math papers are more structured, involving a mix of short-response questions, calculations and working out, drawings or diagrams, labeling or graphing. Extended responses have been suggested to lend themselves better to holistic judgments required in CJ (e.g., Humphry and McGrane, 2015), which might explain slightly higher CJ outcome accuracy in our English trial. Research exploring CJ accuracy in highly structured papers similar to our math papers gave somewhat mixed results (Leech et al., 2022), with a high degree of accuracy in math, but less in science. Other studies, where CJ was applied to papers with mixed question types typically found CJ outcomes to be plausible and reliable, though did not have a way of establishing their accuracy compared to statistical equating (e.g., Benton et al., 2022; Curcin et al., 2019). Of course, another possible explanation for slightly higher accuracy in English in our study might be that there was no need to adjust for difficulty difference between English booklets unlike in math. Further research is required into accuracy of CJ methods when applied to different paper formats.
There was a high degree of outcome replicability within CJ methods across different script samples and judge groups in both subjects. The average absolute difference between replications ranged from 0.60 to 0.92 (out of 25) in English, and from 0.82 to 1.27 (out of 50) in math, with the CJ equating outcomes from different replications always within each other’s 95% CI. As for judgment bias, overall, from the limited cases in which this issue could be examined, there was evidence of errors consistent with judgment bias under both variants of the direct analytical approach and with both SP and PCJ methods, although evidence was not equally strong in every instance.
4.2 Method and analytical approach comparisons
Comparisons between different methods and analytical approaches show small advantages for individual methods/approaches/variants in relation to one or more of outcome accuracy, precision, replicability and bias, but no overwhelming advantage for any one method/approach/variant, similarly to Benton et al. (2022) findings. Briefly:
1. In math, under direct approach, PCJ produced more accurate but, perhaps, less replicable results than SP. PCJ outcomes’ lower replicability may reflect the use of one script per mark point and hence greater opportunity for two replications’ scripts not to be equally representative of the relevant mark point, thereby causing greater variation in results.
2. The single adjustment variant of the direct approach produced more precise CJ-equated marks (with smaller average SEs) than the nonlinear adjustment variant, perhaps reflecting more data points contributing to the estimation of a single adjustment. The SP method’s outcomes were more precise than other methods. These differences in precision were less pronounced in math than in English.
3. The single adjustment variant also produced more replicable equating results than the nonlinear adjustment variant. Our replicability measures, which were calculated from only two replications, thus parallel the analytical SEs which can be thought of as a measure of theoretical replicability.
4. In terms of exact agreement between CJ and IRT-equated marks, the single adjustment variant produced smaller average differences in English, while the nonlinear adjustment variant produced smaller differences in math. This might reflect the greater ability of the nonlinear variant to capture judges’ sensitivity to any true variation of difficulty along the mark range, perhaps especially where the differences in difficulty are larger and highly nonlinear.
5. Evidence of judgment bias was more consistent under the PCJ than the SP method, and the single vs. nonlinear adjustment variant did not seem to affect whether bias was found.
6. Scale-based analytical approach gave either very similar or, in some cases, more accurate results compared to the direct approach in terms of exact agreement between CJ and IRT-equated marks.
7. The equating outcomes based on different linear regression specifications showed little difference, with a slight accuracy advantage for mark-on-measure specification for English and for measure-on-mark for math, and a slight replicability advantage for mark-on-measure in both subjects.
8. The RO method produced slightly more accurate results on average compared to PCJ in English under the scale-based analytical approach, but the opposite was true under the direct approach.
Overall, there appears to be no consistent pattern in which CJ method or which analytical approach/variant produces more accurate outcomes. This may suggest that the differences observed may fall within the variability expected of the use of any of these methods and approaches/variants to capture expert judgments and analyze the data.
Several broader observations can be made about the relative advantages or disadvantages of CJ methods and analytical approaches in light of our findings. It can be noted that the accuracy of the outcomes produced from the scale-based analysis of our full PCJ and RO datasets was similar or slightly higher than that obtained from the SP method. However, the scale of accuracy advantage does not in itself recommend these method/approach combinations given the lack of a credible means to calculate meaningful CIs around their equating outcomes and the cost and resource involved. Note that PCJ and RO exercises designed to enable script quality scale creation necessarily take longer and require more judges than SP exercises.
Nevertheless, coupled with other considerations, such as a desire to maintain a linking scale between different examination sessions, resource investment in implementing the scale-based CJ method and analytical approach may be justified. Furthermore, scale-based CJ methods have potential uses in wider comparability contexts, especially for comparing performances from examinations which are directly graded rather than marked, where the SP method and the direct approach to data analysis may not be applicable. Therefore, the finding regarding their similar or better accuracy compared to other CJ methods or analytical approaches, despite relative resource-intensiveness, is reassuring. The less resource-intensive RO method, in particular, may be useful in the latter contexts.
The direct approach analyses of the PCJ and RO data were carried out on the between-booklet comparisons only, which we may suppose would have taken about half as much time to collect as the original design, which contained similar numbers of between- and within-booklet comparisons. The observed pattern of results suggests similar or slightly higher accuracy for the PCJ and RO methods compared to SP. This is a useful finding as it suggests that having multiple scripts per mark in SP exercises does not in itself necessarily increase accuracy (that is, the extent of exact agreement with the statistical equating outcomes), though it may have contributed to better precision (that is, smaller SEs) and outcome replicability. Therefore, in contexts where many scripts per mark might not be available, our findings suggest that having a single script per mark and multiple comparisons per script can yield similarly accurate outcomes under the direct approach as using multiple scripts per mark and no script repetition. A hybrid approach, combining multiple comparisons per script and multiple scripts per mark where possible, might be a reasonable compromise in some situations (see Benton et al., 2022).
In relation to the potential benefits of assuming single vs. nonlinear adjustment along the mark scale in modeling, there was some evidence that the nonlinear variant may produce more accurate outcomes when the true difficulty relationship between two test forms is in fact nonlinear, as was the case in two of our math trials. While the nonlinear variant produced larger SEs and slightly less replicable outcomes, this might be related to the fact that the script sample size, which appeared appropriate for the single adjustment variant, should have been somewhat larger for the more complex nonlinear model to achieve the same level of precision. This may be a useful avenue for further research.
5 Conclusion
The CJ trials in this study involved the most straightforward standard maintaining scenarios in the sense that the difficulty differences between the test forms are very small, and their content highly similar. Thus, they should present a minimal challenge for expert judges in terms of having to compensate for either test difficulty or content differences when judging script quality. Of course, despite this, the judging task complexity should not be underestimated and can explain some of the discrepancies between the judgment- and IRT-based equating outcomes.
Overall, the scale of discrepancies observed between CJ- and IRT-equated marks suggests that, while the true equating relationship was clearly not exactly replicated, particularly in math, the CJ outcomes were highly similar, tending to encompass the true equating results in their CIs. The results were fairly closely replicable across different judge and script samples. The fact that there was evidence of bias suggests additional caution, however. Further research will be needed to help us understand and develop ways to potentially correct for bias. Further research should also explore whether a similar level of accuracy, replicability and bias would be achieved when the difficulty differences between the test forms are larger.
Given that the CJ results do not appear to wildly depart from the results of a reliable statistical equating approach (at least when difficulty differences between test forms are small), as demonstrated in our trials, this might provide enough confidence for using CJ methods instead of, or as a check on, statistical equating or other statistical standard-maintaining methods, in situations where there is not a great deal of confidence in the accuracy of the statistical outcomes. The results are also encouraging for using CJ methods for linking in comparability contexts where less precise comparisons of standards are required or where direct grading rather than marking is used. In live standard-maintaining in high-stakes exams, where a high level of precision is required, the costs and operational complexities of running large CJ exercises may be seen as prohibitive. However, the increased reliability of collecting expert judgment on a larger scale using CJ methods might justify the investment in some contexts.
Data availability statement
The raw CJ data supporting the conclusions of this article will be made available by the authors, without undue reservation.
Ethics statement
Ethical review and approval was not required for the study with human participants in accordance with the local legislation and institutional requirements. The participants provided their written informed consent to participate in this study.
Author contributions
MC: Conceptualization, Methodology, Investigation, Project administration, Writing – original draft, Writing – review & editing. MWL: Methodology, Resources, Formal analysis, Writing – original draft, Writing – review & editing.
Funding
The author(s) declare that no financial support was received for the research and/or publication of this article.
Acknowledgments
We would like to thank Tom Benton of Cambridge University Press and Assessment for providing advice and the R code for analyzing data under the direct approach. We are also grateful to Cambridge University Press and Assessment for giving us access to their Comparative Judgment Tool.
Conflict of interest
The authors declare that the research was conducted in the absence of any commercial or financial relationships that could be construed as a potential conflict of interest.
Generative AI statement
The authors declare that no Gen AI was used in the creation of this manuscript.
Any alternative text (alt text) provided alongside figures in this article has been generated by Frontiers with the support of artificial intelligence and reasonable efforts have been made to ensure accuracy, including review by the authors wherever possible. If you identify any issues, please contact us.
Publisher’s note
All claims expressed in this article are solely those of the authors and do not necessarily represent those of their affiliated organizations, or those of the publisher, the editors and the reviewers. Any product that may be evaluated in this article, or claim that may be made by its manufacturer, is not guaranteed or endorsed by the publisher.
Supplementary material
The Supplementary material for this article can be found online at: https://www.frontiersin.org/articles/10.3389/feduc.2025.1538486/full#supplementary-material
Abbreviations
BTM, Bradley-Terry model; CJ, comparative judgment; GCSE, General Certificate of Secondary Education; NL, nonlinear adjustment; NRT, National Reference Test; PCJ, paired comparisons method; PLM, Plackett-Luce model; RO, rank-ordering method; SP, simplified pairs method.
Footnotes
1. ^We use “ability” throughout in a neutral psychometric sense to refer to student position on the latent trait of interest, e.g., the extent of their attainment in a subject.
2. ^Note that we do not intend to suggest any intentional bias on the part of the judges.
3. ^Tiered exams involve different versions of exams in the same subjects, targeted for less able (foundation tier) and more able (higher tier) students, with some common grades and questions. The common grades are intended to reflect the same standard, irrespective of which paper they were achieved on.
4. ^These are public exams taken by 16-year-olds at the end of compulsory schooling in England.
5. ^https://cjscaling.cambridgeassessment.org.uk/
6. ^As Benton (2021) demonstrated using simulated data, SEs of equating outcomes calculated using the direct approach are a good match for the true SEs (i.e., the SD of the theoretical sampling distribution of the equivalent form B mark, or the SD of estimated equivalent form B marks across simulations).
7. ^Note that with the PCJ and RO methods, the design may be such that judges compare scripts from the same form as well as from different forms. The models above are only suitable for analyzing data from different-form comparisons, and their use entails discarding data from within-form comparisons. In the current study, this meant that the original PCJ and RO datasets (shown in the “Total comparisons” row of Table 3) were halved to make them amenable to analysis under the direct approach. Full datasets were used in scale-based analyses of PCJ and RO data.
8. ^The practice of removing a small number of normatively misfitting judges aligns with the aim of CJ methods in the context of standard maintaining, which is to arrive at the most plausible and defensible consensus outcome (see also Black and Bramley, 2008; Leech et al., 2022; Pollitt, 2012). Furthermore, in this study we sought to compare CJ outcomes with operational IRT equating outcomes based on the most robust and defensible version of the procedures for the context in which they were obtained. Therefore, it seemed fair that the CJ outcomes should also be as plausible and defensible as they could be given the context in which they were arrived at. Of course, if it turned out that many judges were misfitting and required removal, this would bring into question the success of a CJ exercise and, in that case, it would not be appropriate to report results based on a small subset of the data. This, however, was not the case in the present study.
9. ^Following Benton et al. (2022), to avoid potential distortion of results caused by outliers among judging times, we fitted an intercept-only robust linear regression model to each judge’s judging times and took the intercept as the judge’s “robust” mean judging time.
10. ^The RO data was additionally analyzed with the Plackett-Luce model (PLM) for rank ordered data (Plackett, 1975).
11. ^A graphical representation of the equating outcomes obtained from the direct approach analyses, alongside the corresponding IRT-based equating outcomes, is presented for each exercise in Supplementary Appendix 2. The plots allow a visual comparison of the CJ- and IRT-based equating outcomes across the entire mark range.
12. ^A pitfall in using SEs in assessing the accuracy of equating outcomes is that it is easier for the true (IRT-equated) mark to fall within the CI of a less precise outcome that has a larger SE, thereby making it the seemingly more accurate outcome.
References
Attali, Y., Saldivia, L., Jackson, C., Schuppan, F., and Wanamaker, W. (2014). Estimating item difficulty with comparative judgments. (ETS Research Report No. RR-14-39). Princeton, NJ: Educational Testing Service.
Baird, J.-A. (2007). “Alternative conceptions of comparability” in Techniques for monitoring the comparability of examination standards. eds. P. E. Newton, J. Baird, H. Goldstein, H. Patrick, and P. Tymms (London: Qualifications and Curriculum Authority), 124–156.
Benton, T. (2020). How useful is comparative judgement of item difficulty for standard maintaining? Res. Matters 29, 27–35.
Benton, T. (2021). Comparative judgement for linking two existing scales. Front. Educ. 6:775203. doi: 10.3389/feduc.2021.775203
Benton, T., Cunningham, E., Hughes, S., and Leech, T. (2020a). Comparing the simplified pairs method of standard maintaining to statistical equating. Cambridge assessment research report. Cambridge: Cambridge Assessment.
Benton, T., Gill, T., Hughes, S., and Leech, T. (2022). A summary of OCR’S pilots of the use of comparative judgement in setting grade boundaries. Res. Matters: Cambridge assess. Publication 33. Cambridge: Cambridge Assessment, 10–29.
Benton, T., Leech, T., and Hughes, S. (2020b). Does comparative judgement of scripts provide an effective means of maintaining standards in mathematics? Cambridge assessment research report. Cambridge: Cambridge Assessment.
Berezner, A., and Adams, R. J. (2017). “Why large-scale assessments use scaling and item response theory”, in Implementation of large-scale education assessments, eds. P. Lietz, J. C. Cresswell, K. F. Rust, and R. J. Adams. (Hoboken, NJ: John Wiley & Sons Ltd), 323–356. Available at: https://www.wiley.com/en-gb/publish/book/prepare-your-manuscript/house-style
Black, B., and Bramley, T. (2008). Investigating a judgemental rank-ordering method for maintaining standards in UK examinations. Res. Pap. Educ. 23, 357–373. doi: 10.1080/02671520701755440
Black, B., and Gill, T. (2006). An investigation of standard maintaining and equating using expert judgement in GCSE English between years and across tiers using a rank-ordering method. Cambridge assessment research report. Cambridge: Cambridge Assessment.
Bond, T. G., and Fox, C. M. (2007). Applying the Rasch model: fundamental measurement in the human sciences. 2nd Edn. London: Lawrence Erlbaum.
Bradley, R. A., and Terry, M. E. (1952). Rank analysis of incomplete block designs I: the method of paired comparisons. Biometrika 39, 324–345. doi: 10.2307/2334029
Bramley, T. (2005). A rank-ordering method for equating tests by expert judgement. J. Appl. Meas. 6, 202–223.
Bramley, T. (2007). “Paired comparisons methods” in Techniques for monitoring the comparability of examination standards. eds. P. E. Newton, J. Baird, H. Goldstein, H. Patrick, and P. Tymms (London: Qualifications and Curriculum Authority), 246–294.
Bramley, T., and Gill, T. (2010). Evaluating the rank-ordering method for standard maintaining. Res. Pap. Educ. 25, 293–317. doi: 10.1080/02671522.2010.498147
Bramley, T., and Vidal Rodeiro, C. L. (2014). Using statistical equating for standard maintaining in GCSEs and a levels. Cambridge assessment research report. Cambridge: Cambridge Assessment.
Brandon, P. R. (2004). Conclusions about frequently studied modified Angoff standard setting topics. Appl. Meas. Educ. 17, 59–88. doi: 10.1207/s15324818ame1701_4
Cresswell, M. J. (2000). “The role of public examinations in defining and monitoring standards” in Educational standards. Proceedings of the British Academy 102. eds. H. Goldstein and A. Heath (Oxford: Oxford University Press), 69–120.
Curcin, M., Black, B., and Bramley, T.. (2010). Towards a suitable method for standard-maintaining in multiple-choice tests: capturing expert judgment of test difficulty through rank-ordering. Paper presented at the Association for Educational Assessment-Europe (AEA-Europe) Annual Conference, Oslo.
Curcin, M., Howard, E., Sully, K., and Black, B. (2019). Improving awarding: 2018/2019 pilots. (report no. Ofqual/19/6575). Coventry: Ofqual.
Gill, T., and Bramley, T. (2013). How accurate are examiners’ holistic judgements of script quality? Assess. Educ.: Princ. Policy Pract. 20, 308–324. doi: 10.1080/0969594X.2013.779229
Good, F. J., and Cresswell, M. (1988). Grade awarding judgements in differentiated examinations. Br. Educ. Res. J. 14, 263–281. doi: 10.1080/0141192880140304
Goodwin, L. (1999). Relations between observed item difficulty levels and Angoff minimum passing levels for a group of borderline examinees. Appl. Meas. Educ. 12, 13–28. doi: 10.1207/s15324818ame1201_2
Gorin, J. S., and Embretson, S. E. (2006). Item difficulty modeling of paragraph comprehension items. Appl. Psychol. Meas. 30, 394–411. doi: 10.1177/0146621606288554
Holmes, S. D., Meadows, M., Stockford, I., and He, Q. (2018). Investigating the comparability of examination difficulty using comparative judgement and Rasch modelling. Int. J. Test. 18, 366–391. doi: 10.1080/15305058.2018.1486316
Humphry, S., and McGrane, J. (2015). Equating a large-scale writing assessment using pairwise comparisons of performances. Aust. Educ. Res. 42, 443–460. doi: 10.1007/s13384-014-0168-6
Impara, J. C., and Plake, B. S. (1998). Teachers' ability to estimate item difficulty: a test of the assumptions in the Angoff standard setting method. J. Educ. Meas. 35, 69–81. doi: 10.1111/j.1745-3984.1998.tb00528.x
Jones, I., Wheadon, C., Humphries, S., and Inglis, M. (2016). Fifty years of A-level mathematics: have standards changed? Br. Educ. Res. J. 42, 543–560. doi: 10.1002/berj.3224
Kolen, M. J., and Brennan, R. L. (2014). Test equating, scaling, and linking: methods and practices. 3rd Edn. New York, NY: Springer.
Leech, T., Gill, T., Hughes, S., and Benton, T. (2022). The accuracy and validity of the simplified pairs method of comparative judgement in highly structured papers. Front. Educ. 7:803040. doi: 10.3389/feduc.2022.803040
Linacre, J. M. (2011). A user's guide to FACETS Rasch-model computer programs. Program manual 3.68.1. Chicago, IL: Winsteps.com.
Maris, G., Bechger, T., Koops, J., and Partchev, I. (2022). Dexter: data management and analysis of tests. R package version 1.1.5. Available online at: https://dexter-psychometrics.github.io/dexter/
Ofqual (2019). A level maths maintenance of standards investigation technical report: investigation of the appropriateness of grading standards in a level maths 2018. (report no. Ofqual/19/6567/1). Coventry: Ofqual.
Ofqual and NFER (2018). National Reference Test information: Background report. (report no. Ofqual/19/6527/3). Coventry, UK: Ofqual.
Partchev, I., Koops, J., Bechger, T., Feskens, R., and Maris, G. (2023). Dexter: an R package to manage and analyze test data. Psych 5, 350–375. doi: 10.3390/psych5020024
Pollitt, A. (2012). The method of adaptive comparative judgement. Assess. Educ. Princ. Policy Pract. 19, 281–300. doi: 10.1080/0969594X.2012.665354
Verhavert, S., Bouwer, R., Donche, V., and De Maeyer, S. (2019). A meta-analysis on the reliability of comparative judgement. Assess. Educ. Princ. Policy Pract. 26, 541–562. doi: 10.1080/0969594X.2019.1602027
Wheadon, C., and Béguin, A. (2010). Fears for tiers: are candidates being appropriately rewarded for their performance in tiered examinations? Assess. Educ. Princ. Policy Pract. 17, 287–300. doi: 10.1080/0969594X.2010.496239
Whetton, C., Hopkins, A., and Benson, L. (2018). National Reference Test results digest 2018. Slough: NFER.
Keywords: comparative judgment, standard maintaining, equating, linking, comparability, performance standards, assessment, judgment bias
Citation: Curcin M and Lee MW (2025) Evaluating accuracy and bias of different comparative judgment equating methods against traditional statistical equating. Front. Educ. 10:1538486. doi: 10.3389/feduc.2025.1538486
Edited by:
Raona Williams, Ministry of Education, United Arab EmiratesReviewed by:
Ranjit Konrad Singh, GESIS Leibniz Institute for the Social Sciences, GermanyEduardo Hernández-Padilla, Autonomous University of the State of Morelos, Mexico
Copyright © 2025 Curcin and Lee. This is an open-access article distributed under the terms of the Creative Commons Attribution License (CC BY). The use, distribution or reproduction in other forums is permitted, provided the original author(s) and the copyright owner(s) are credited and that the original publication in this journal is cited, in accordance with accepted academic practice. No use, distribution or reproduction is permitted which does not comply with these terms.
*Correspondence: Milja Curcin, bWlsamEuY3VyY2luQG9mcXVhbC5nb3YudWs=
†The authors have contributed equally to this work and share first authorship