 Kristine Kampmane
 Surette van Staden
 Antra Ozola
- 1Faculty of Education Sciences and Psychology, Education Research Institute, University of Latvia, Riga, Latvia
- 2Faculty of Teacher Education, Institute for Teacher Education and School Research, University of Innsbruck, Innsbruck, Austria
Large-scale international education studies rely on controlled sampling designs and required response rates to ensure reliable and valid data. However, participant refusal threatens data quality. This study investigates factors that facilitate or discourage respondent participation in such surveys. A mixed-methods design was applied to the OECD TALIS 2024 Latvian dataset. The sample included schools, principals, study coordinators, and teachers. Quantitative analysis explored correlations between participation patterns and response behavior, while qualitative interviews with principals and coordinators provided deeper insights. Correlation analysis revealed that voluntary participation was strongly associated with early survey completion. When teachers completed the survey simultaneously during meetings, refusal rates fell below 1%. Most coordinators (79%) noted survey overload, and 73% suggested financial incentives for teachers. In contrast, only 30% of non-participating teachers considered payment motivating. Teachers emphasized that desirable survey features included relevance to work, completion during working hours, mobile compatibility, and accessible links. Across groups, brevity (≤10 minutes) and clarity were the most valued qualities. Principals highlighted openness to surveys when they were purposeful, relevant, aligned with school goals, and offered meaningful feedback. Findings show that participation in large-scale surveys can be enhanced through organizational support, relevance, brevity, and convenient formats, while monetary incentives appear less influential for teachers. Coordinators and principals stress the importance of purposeful design and clear benefits to respondents, suggesting strategies to reduce non-response and improve data quality in future studies.
1 Introduction
Non-response is a growing problem in international survey data collection, raising issues about overall survey quality and response bias (Roberts, 2013; Rudžionienė et al., 2018; Reisinger et al., 2023; Grönemann, 2024). By their very nature, the international large-scale assessments (ILSAs) utilise questionnaires to gather large amounts of data from participating countries at the student, classroom, and/or teacher and school levels to provide contextual background information on factors that likely shape and affect the education system and the quality of any given participating country.
When it comes to data collection in social sciences with human beings as data sources, it is always related to the free will and the individual’s right to refuse participation. ILSAs of education have requirements regarding sample size and composition, which are derived from the minimum response rate and reliability calculations. As a result, free will and the right to refuse participation come into conflict if the sample is controlled. This consideration is specifically the case for studies carried out by the International Association for the Evaluation of Educational Achievement (IEA) and Organisation for Economic Co-operation and Development (OECD), as well as other similar studies that use stratified samples at the school level.
Before the barriers to non-responses are discussed, the approaches to understanding survey non-responses will be explained. Porter and Whitcomb (2005) describe four research approaches in an attempt to understand non-responses and to effectively increase response rates. These include the following:
1. Time of response analysis, where researchers analyse participants based on when the questionnaire was completed (i.e., early vs. late). These groups are then compared, with no additional data collection, to ascertain differing levels of non-response. The point at which participants are classified as non-responders may, however, be arbitrary and threaten the validity of this approach.
2. Non-response follow-up surveys, where non-respondents are administered a second follow-up survey with intense measures to ensure responses. Data from the follow-up survey are then compared to those from the original base survey.
3. Panel survey, where participants in the base survey are administered one or more follow-up surveys. Non-respondent participants in these surveys are compared to those in the base survey.
4. Record linkage, where both respondents and non-respondents are linked to database records that are available for the full sample (e.g., demographics or financial information). These data are used to analyse non-respondents, but the amount of data available for analysis is limited.
What do studies that use these approaches tell us about non-responses? According to Porter and Whitcomb (2005), findings from these four approaches converge regarding the characteristics of participants who are more likely to complete survey questionnaires: they tend to be female, more affluent and have higher levels of academic achievement. While personality traits have also been identified as possible predictors of survey responses or non-responses, characteristics such as social engagement and investigative personalities are more likely to respond to surveys.
Literature is rich with reasons as to why participants who are invited to complete questionnaires often fail to do so. Among others, Roberts (2013) refers to the problem of maintaining continued contact with participants through modes other than email or the web (such as telephone calls). The social exchange between the individual and the organisation responsible for administering the survey makes it much more likely that individuals will respond to surveys. However, time, budget constraints, and large sample sizes make ongoing social exchanges challenging.
Webber et al. (2013) report the danger of decreased reliability due to low response rates, especially when non-responders may have considerably different attitudes and experiences compared to responding participants. Due to stringent sampling requirements, it must be noted that non-responses in ILSAs do not necessarily result in non-response bias or invalidate survey findings. Webber et al. (2013) cite additional reasons for non-response rates, including participants not knowing what the survey is for and what the results will be used for. These authors found that a limited understanding of the survey was highly associated with non-responses, independent of other potential correlates. In this regard, Webber et al. (2013) refer to reciprocation wariness as a predictor of non-response, which means that when participants believe that their data will not be used productively, they may be hesitant to spend any amount of time completing a survey. Nair et al. (2008) highlight that concerns about the confidentiality of data contribute to non-response patterns.
Downes Le-Guin et al. (2012) mention the fact that when the optimal length for a questionnaire is exceeded, participants may become less responsive, put less cognitive effort into answering questions and may skip questions altogether. This issue may be more prevalent in self-administered surveys, where no interviewer is present to maintain engagement and momentum. In addition, response patterns may be affected when questionnaires become too long and effortful. The tendency to ‘straight line’ large numbers of consecutive items on the same scale was already identified by Herzog and Bachman (1981), while acquiescent responding, a more frequent selection of non-substantive responses (e.g., ‘do not know’ or ‘no opinion’), choosing the first listed response and random responding may also occur. According to Downes Le-Guin et al. (2012), the overall general concept that underlies these response patterns can be referred to as response burden or survey fatigue (Nair et al., 2008)—a combination of four factors, namely the length of the questionnaire, the amount of cognitive effort expected from the participant, the amount of emotional stress that a participant may feel while completing the questionnaire, and the frequency with which the participant is asked to participate in surveys.
Webber et al. (2013) state that categorising participants into two groups of responders and non-responders may be misleading. The authors make a distinction between passive non-responders, who may not have found the time yet to respond or who are likely to be attracted to the neutral position on the questionnaire, and active non-responders, who deliberately choose not to respond.
1.1 Problem statement
The administration of large-scale international surveys (ILSAs) such as the TALIS 2024 in Latvia presents complexities regarding participation. While voluntary participation is theoretically valued, school-level participation requirements can exert pressure on individual teachers. This study seeks to determine whether there are differences in the views of school management teams and teachers on how surveys should be designed to be completed voluntarily by teachers, depending on whether the school had a high or low response rate to the survey and whether the teacher agreed or declined to participate in the TALIS 2024.
1.2 Research questions
For purposes of the current study, we asked the following questions:
• What properties should surveys have for teachers to be willing to take part?
• How do the opinions of teachers and coordinators change depending on their participation in the TALIS 2024?
• What are the principal perceptions of participation in international large-scale studies (ILSAs) and studies in general?
2 Materials and methods
This study employed a convergent parallel mixed methods design (Creswell and Creswell, 2018; Coe et al., 2025; Dawadi et al., 2021; Creswell, 2021), where quantitative questionnaire data and qualitative interview data were collected and analysed concurrently with equal priority. Integration occurred during interpretation to facilitate complementarity and triangulation of findings (Teddlie and Tashakkori, 2009; Zhou et al., 2024). This approach enabled a systematic comparison of the perspectives of principals, coordinators, and teachers.
The data for this study were collected in three phases as a follow-up to the TALIS 2024 in Latvia during the spring of 2025. The general population was the TALIS 2024 sample in Latvia. In the first phase, all school coordinators from the 216 TALIS 2024 schools were invited to complete an online survey, to which 119 coordinators responded.
In the second phase, the schools from the TALIS 2024 sample were ranked by teacher participation rates. To capture variation, 10 schools with the lowest rates (≤75%) and 10 with the highest rates (100%) were invited. Where more than 10 schools met the maximum threshold, selection was based on the chronological completion of the survey. Invitations were distributed using a standardised protocol (an email, one reminder and a follow-up phone call). Of the 20 schools approached, 11 principals consented to participate via an institutional email, while nine declined or did not respond. Semi-structured interviews (60–90 min) were conducted with the participating principals, mostly in person (90%) and, when necessary, online (10%), following a common interview guide to ensure consistency and confidentiality.
In the third stage, teachers from the 11 selected schools were purposely selected to represent both the TALIS 2024 respondents and non-respondents. From low-response schools, five survey participants and five non-participants were invited, while from high-response schools, 10 survey participants were selected. This yielded a potential sample of 110 teachers (75 respondents and 35 non-respondents), of whom 93 agreed to participate (66 respondents, 27 non-respondents). Participation was entirely voluntary and confidential, and informed consent was implied through questionnaire completion. Surveys, administered in both printed and online formats, mirrored the coordinator instruments and included both closed- and open-ended questions.
Interview recordings were transcribed using an online tool and subsequently verified. Qualitative data (principal interviews and open-ended question items) were analysed thematically following Mayring’s (2014) qualitative content analysis, with codes developed directly from the data. Coding was performed manually and reviewed by two researchers, with discrepancies resolved through discussion. Quantitative data were analysed using descriptive statistics, correlation analyses and the Mann–Whitney U test for subgroup comparisons. Cases with missing values were excluded pairwise.
3 Results
By analysing the TALIS 2024 system report for the Latvian sample, it was found that 17% of the teachers responded to the questionnaire during the first week of the survey (early birds), 4% responded during the last week of the survey (late comers), and 10% did not log into the survey system (non-respondents). More than two-thirds (69%) of the teachers participated in the survey between the first and the last week of the study. From the school coordinator’s point of view, these latecomers were those who received the most reminders to complete the questionnaire. The Latvian TALIS 2024 sample demonstrates that by constantly reminding participants about the survey, one can increase the response rate by up to 4%.
3.1 Coordinators
After the TALIS 2024 in Latvia was completed, the school coordinators were asked to complete a follow-up questionnaire online. As many as 62% of the coordinators reported that more than half of the sampled teachers from their schools responded voluntarily. Furthermore, 41% of the coordinators reported that more than half of the sampled teachers responded immediately, meaning without a reminder. Only 5% of the coordinators reported that 10–50% of the teachers from their school refused to participate in the TALIS 2024 (see Table 1). Based on these numbers, the correlation between voluntary and immediate participation was 0.6 (p < 0.001), but the correlation between voluntary participation and participation after several reminders was −0.6 (p < 0.001) (see Table 2). These results demonstrated that if participation was voluntary, the respondents did not postpone their participation, while postponement (with an increasing number of reminders) decreased a participant’s voluntary participation.
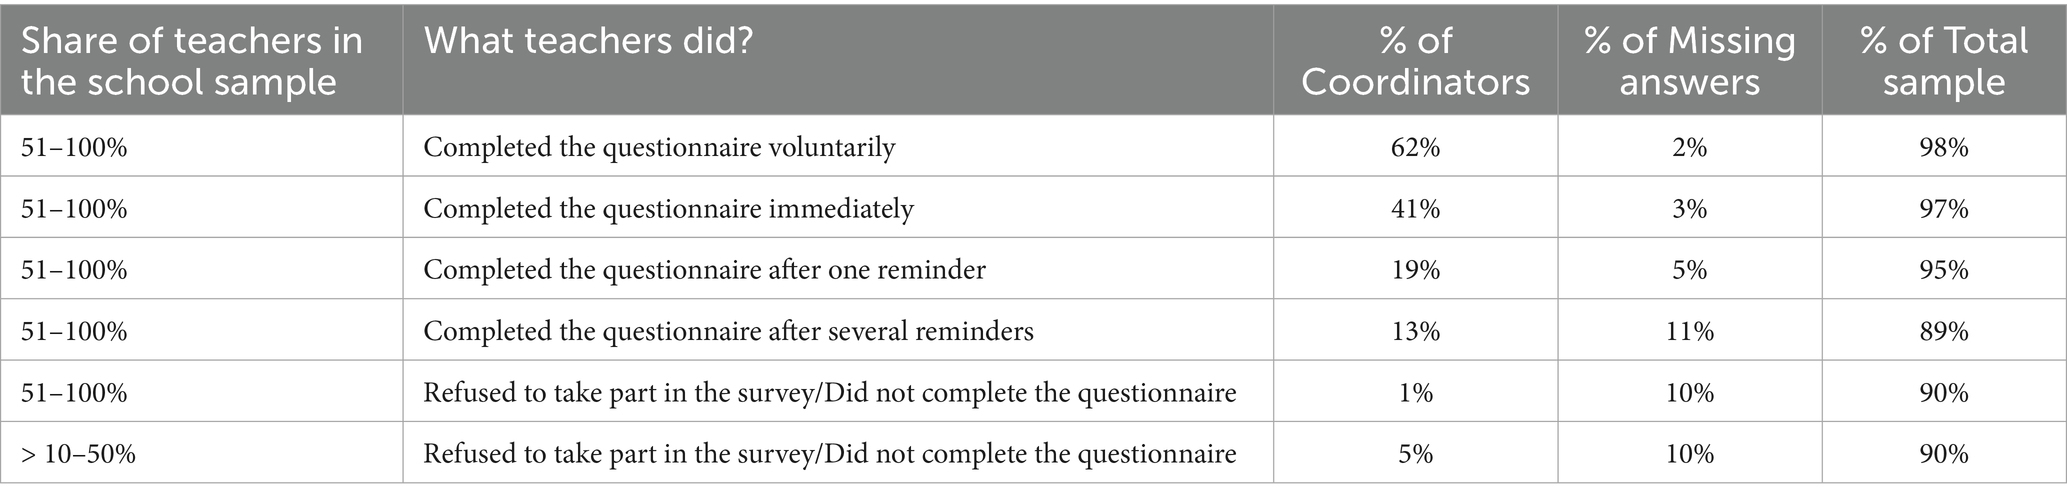
Table 1. Proportion of coordinators who indicated that their schools had the following relative proportions of teachers in each of the participation categories.
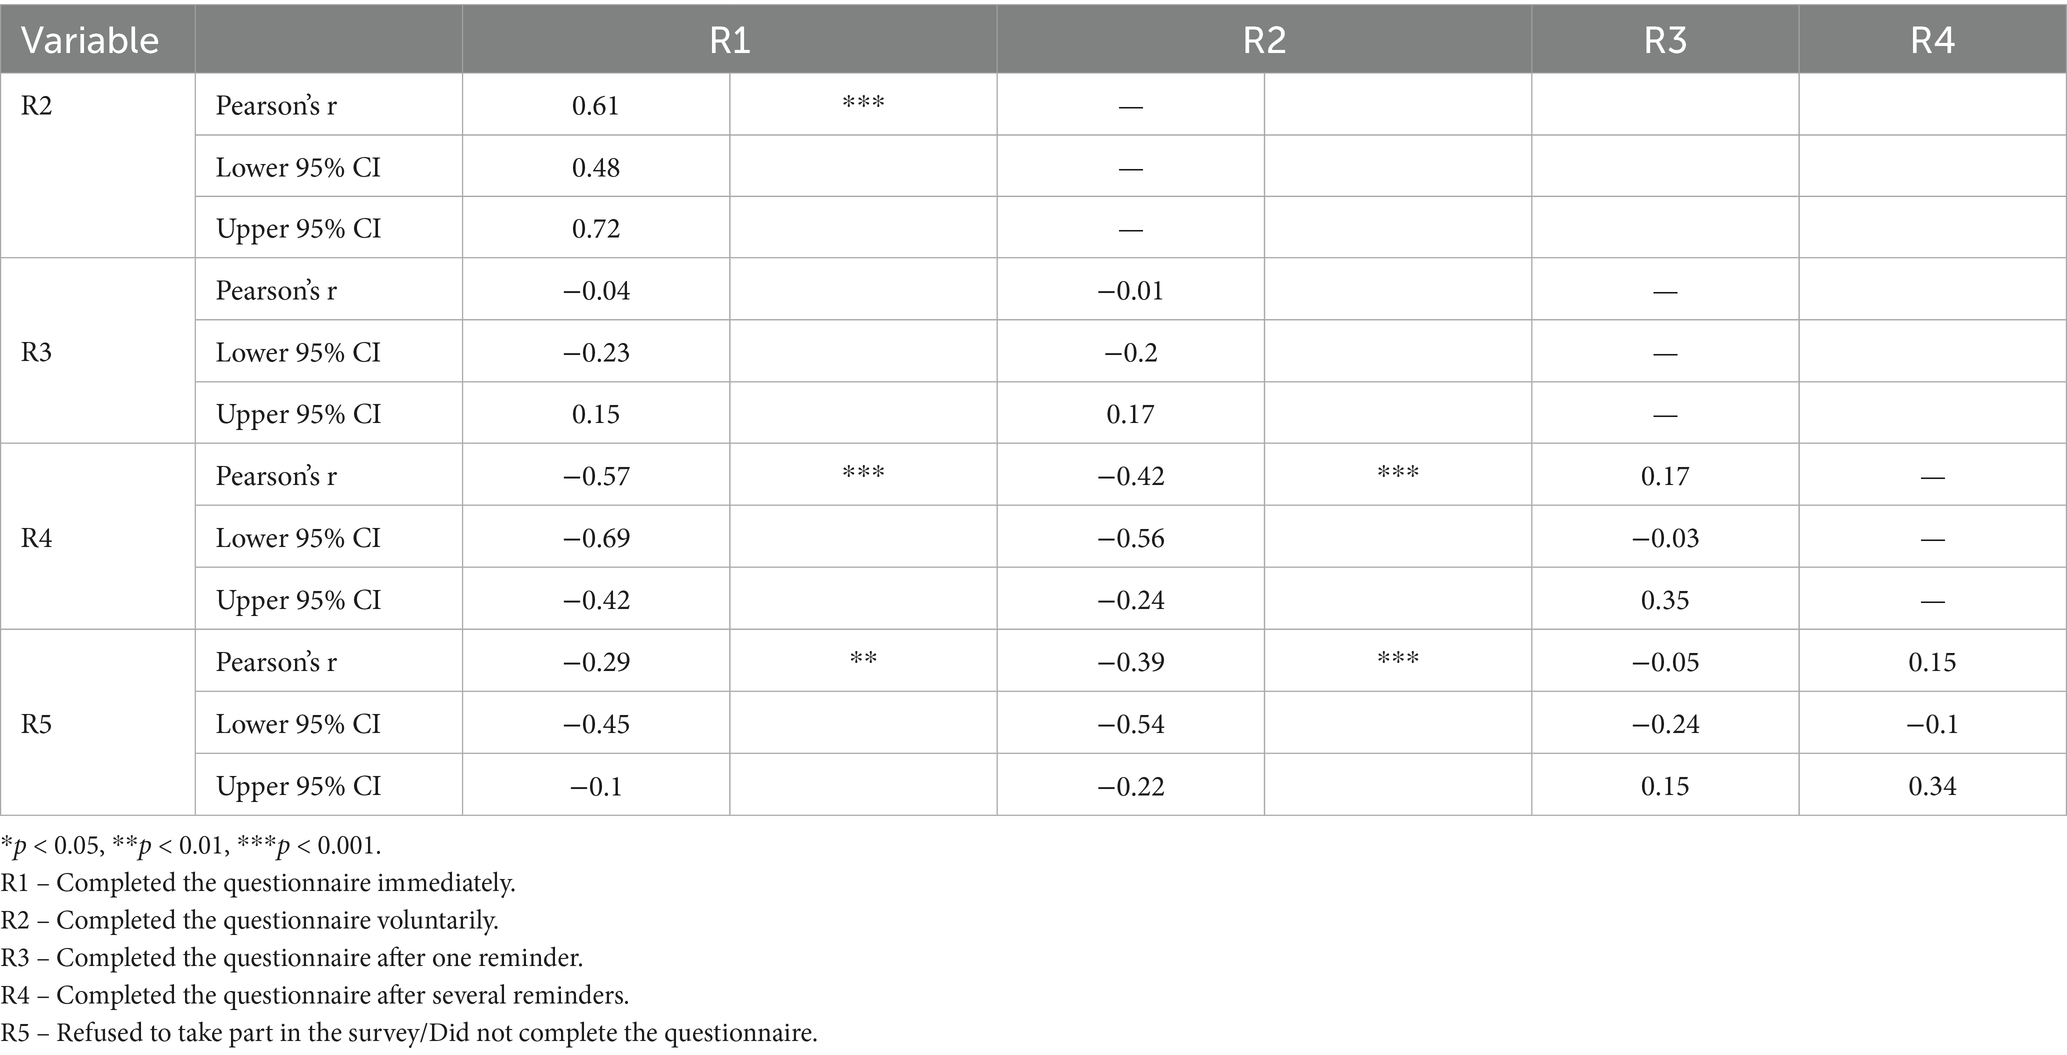
Table 2. Correlation between the coordinators’ reported teacher participation rates in the TALIS.
Schools implemented one of three methods of participation—completely voluntary (no control over teacher participation), set as a priority (controlled participation), and joint participation (all teachers complete the survey together at the same time and place). In total, 80% of the schools that selected joint participation had more than 50% of their school’s sample participate immediately and voluntarily, with less than 1% refusal. In addition, 65% of the schools that chose no control and 63% of the schools that had controlled participation experienced more than 50% voluntary participation (see Table 3).
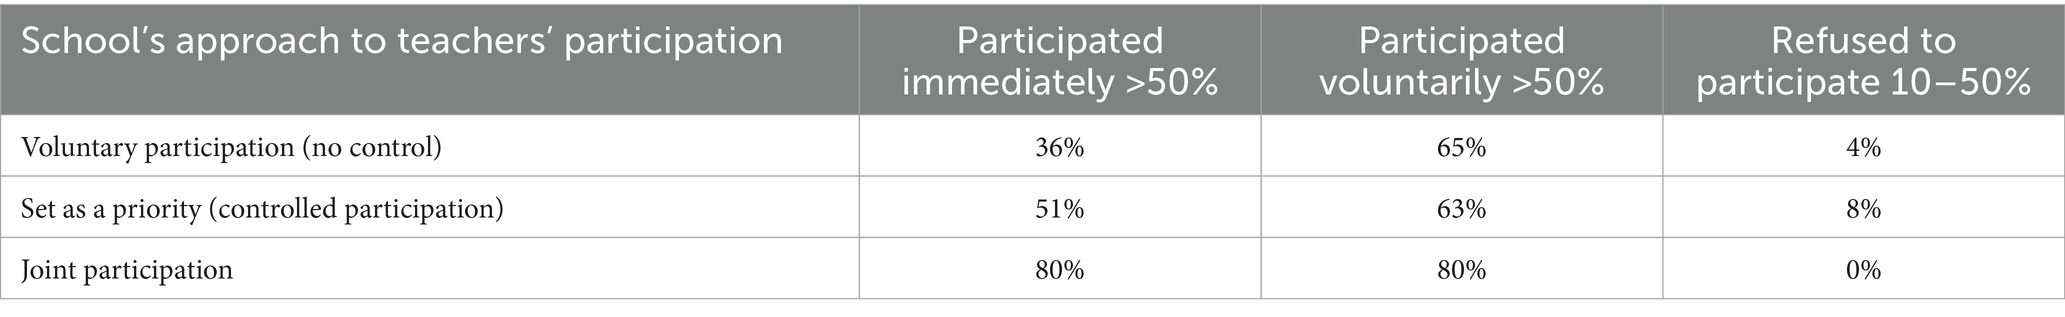
Table 3. Teacher participation in the TALIS depending on the school’s implementation approach.
When comparing the coordinators’ answers from the high-response rate schools with those from the low-response rate schools, two statements showed a statistically significant difference. A total of 65% of the coordinators from the low-response schools and 39% of the coordinators from the high-response schools completely agreed with the statement “The number of studies/surveys that schools can participate in should be limited at the national level.” More coordinators from the low-response schools (60%) than from the high-response schools (34%) completely agreed with the statement “A school should not have studies/surveys that require a certain participation rate (a certain number of respondents)” (see Tables 4, 5).
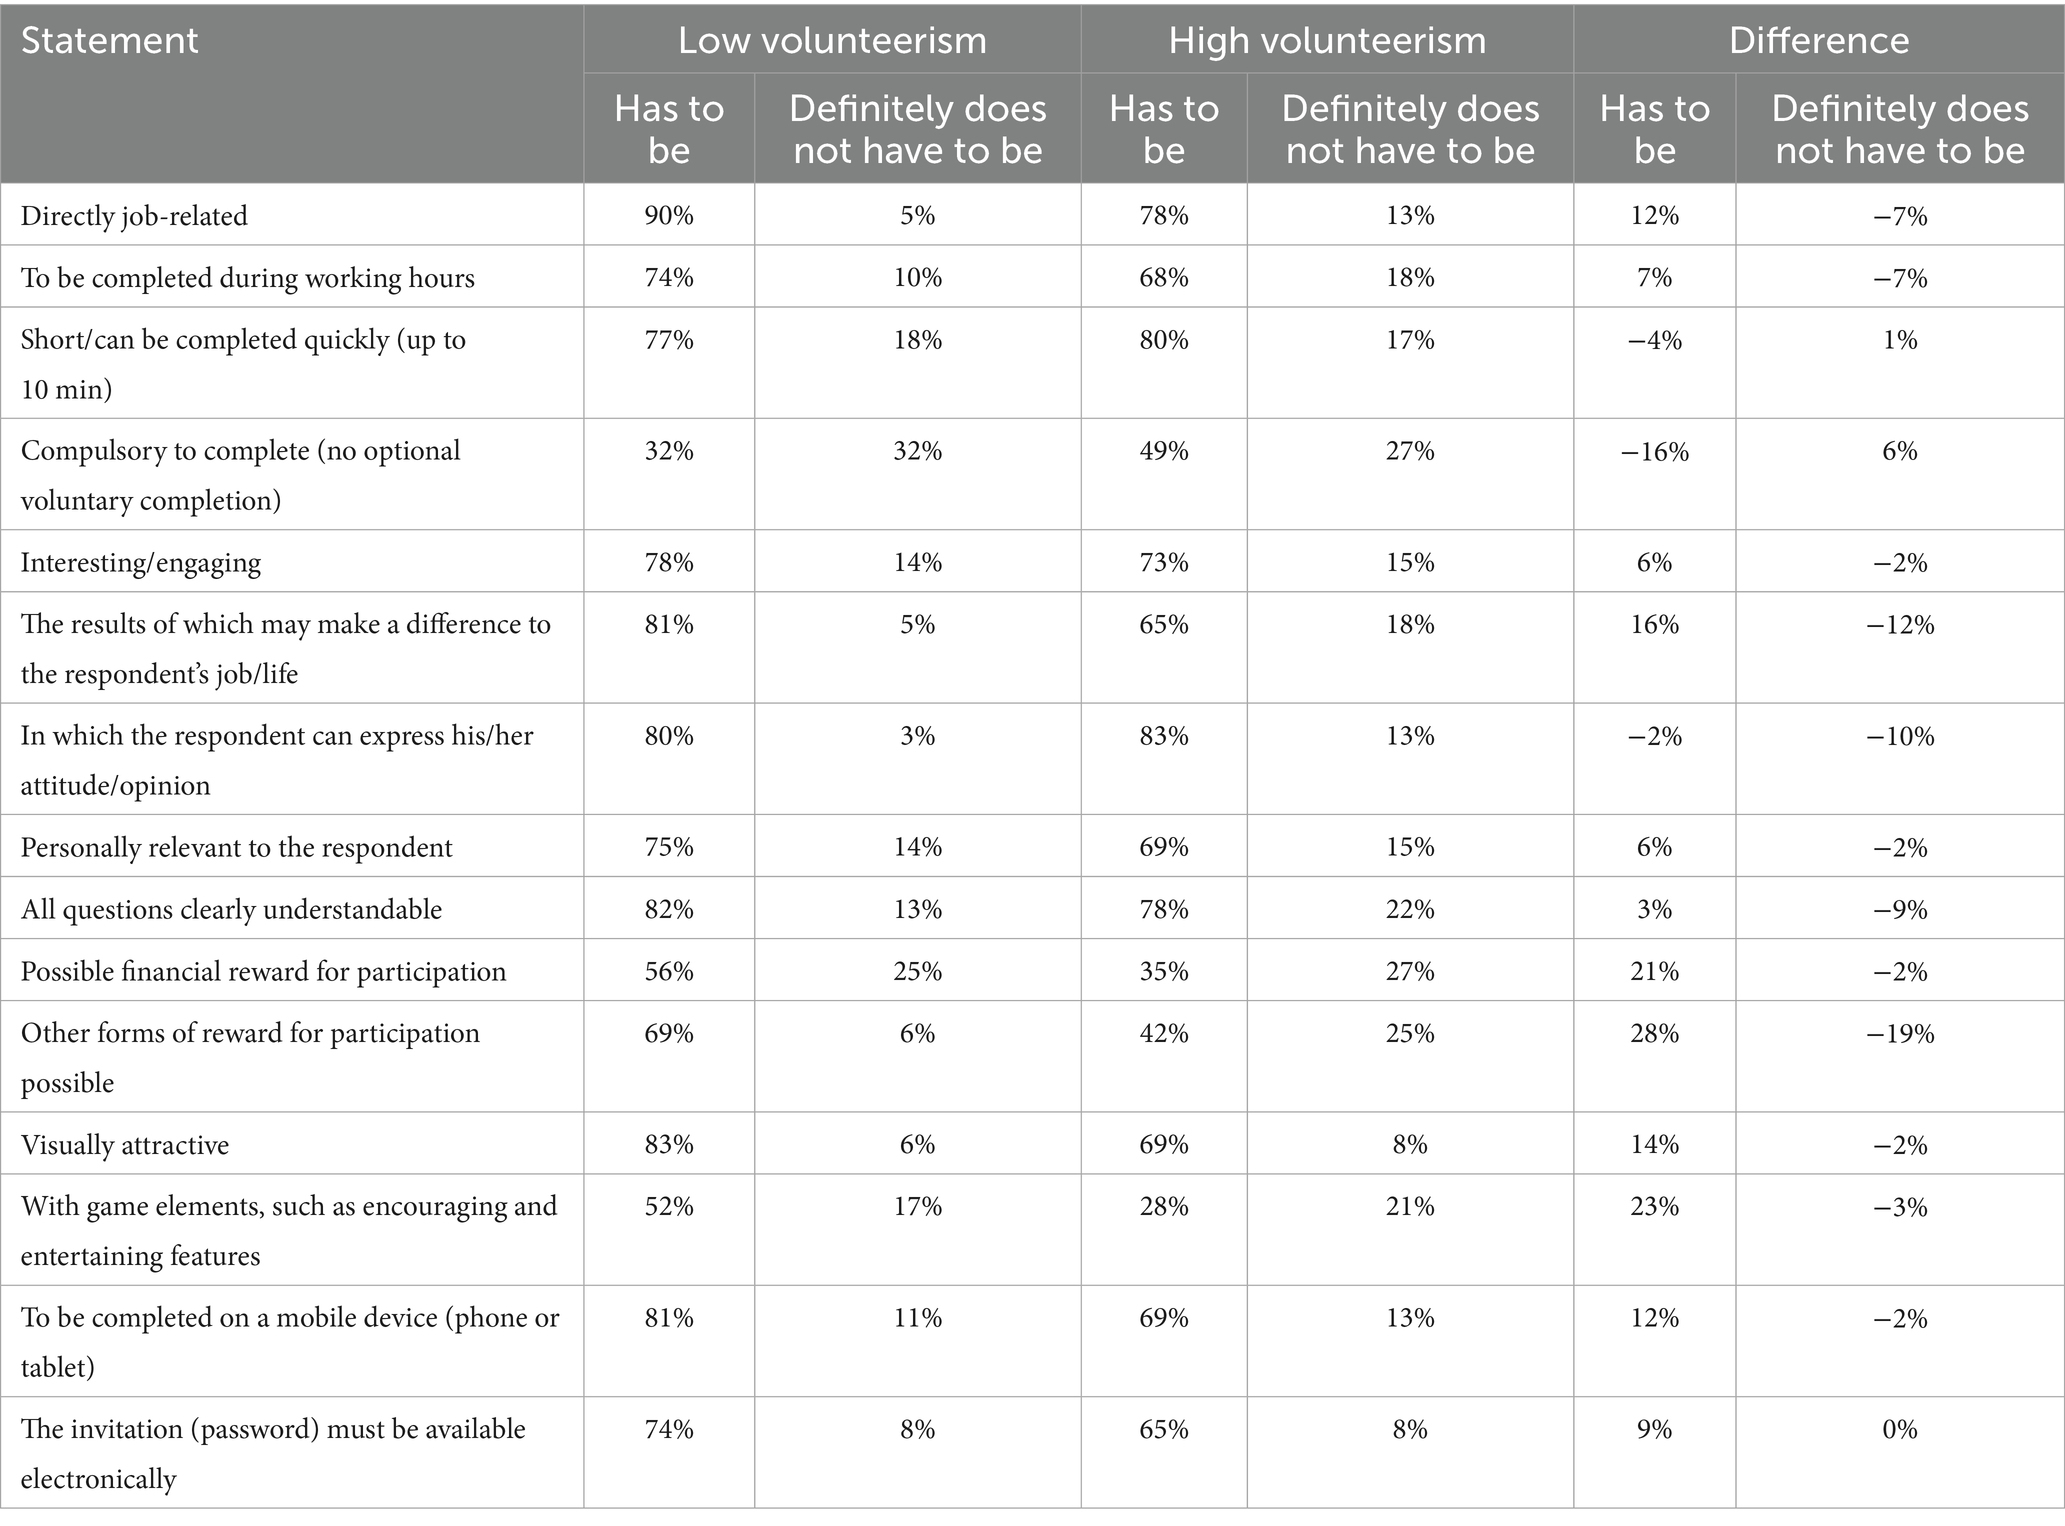
Table 4. Distribution of the coordinators’ statements on questions about what the survey should be like, depending on how many teachers in their school voluntarily participated in the TALIS.
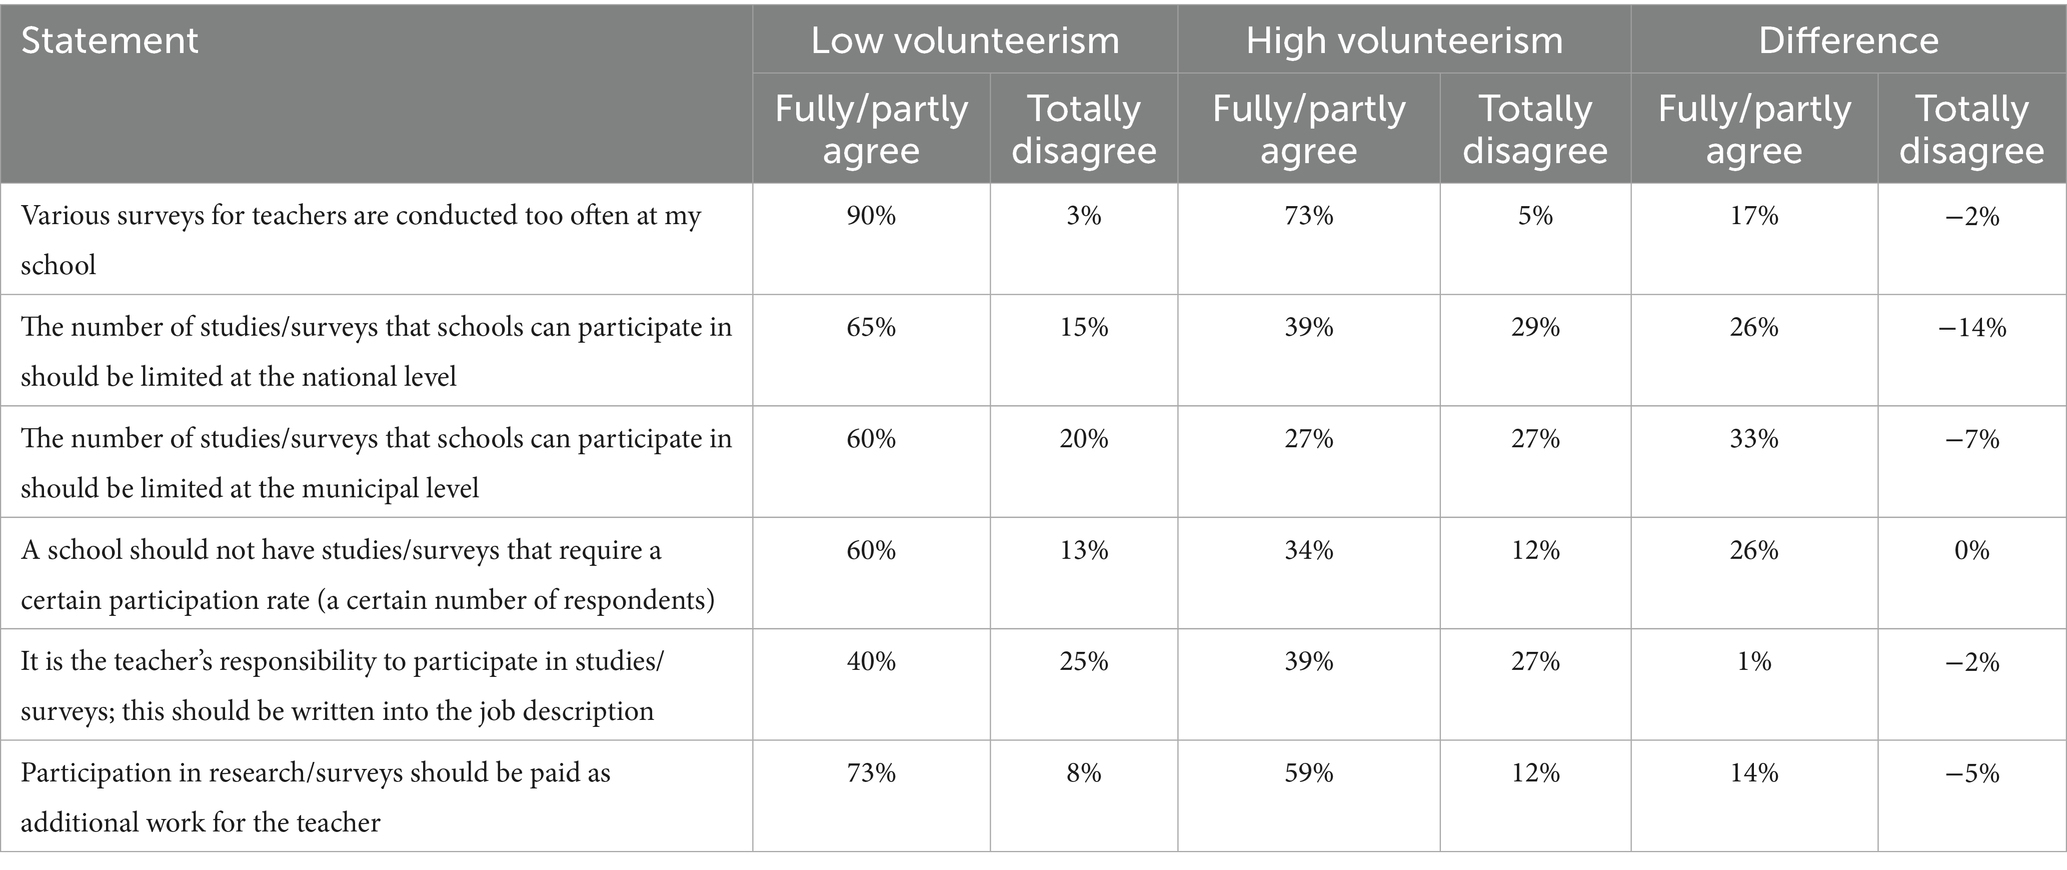
Table 5. Distribution of the coordinators’ statements on survey administration questions, depending on how many teachers in their school voluntarily participated in the TALIS.
After the analysis of the open-ended answers, the coordinators’ perceptions indicated that the most important reason for teachers’ motivation to participate was the impact of the survey—32% of the coordinators replied that if teachers could experience a real impact on their everyday school life from their answers, they would be motivated to participate in such or similar studies in the future, while 22% of the coordinators emphasised incentive as the main motivation source (see Table 6). The coordinators reported the workload that teachers have during their working hours (59%), teachers’ unwillingness to postpone their duties (33%), teachers’ sense of responsibility to their classwork (23%) and teachers’ conscientiousness (16%) as the main reasons for non-participation. Furthermore, one in five (20%) of the school coordinators reported that these types of surveys were too long and too complicated. Studies would benefit if they were shorter and more easily comprehensible.
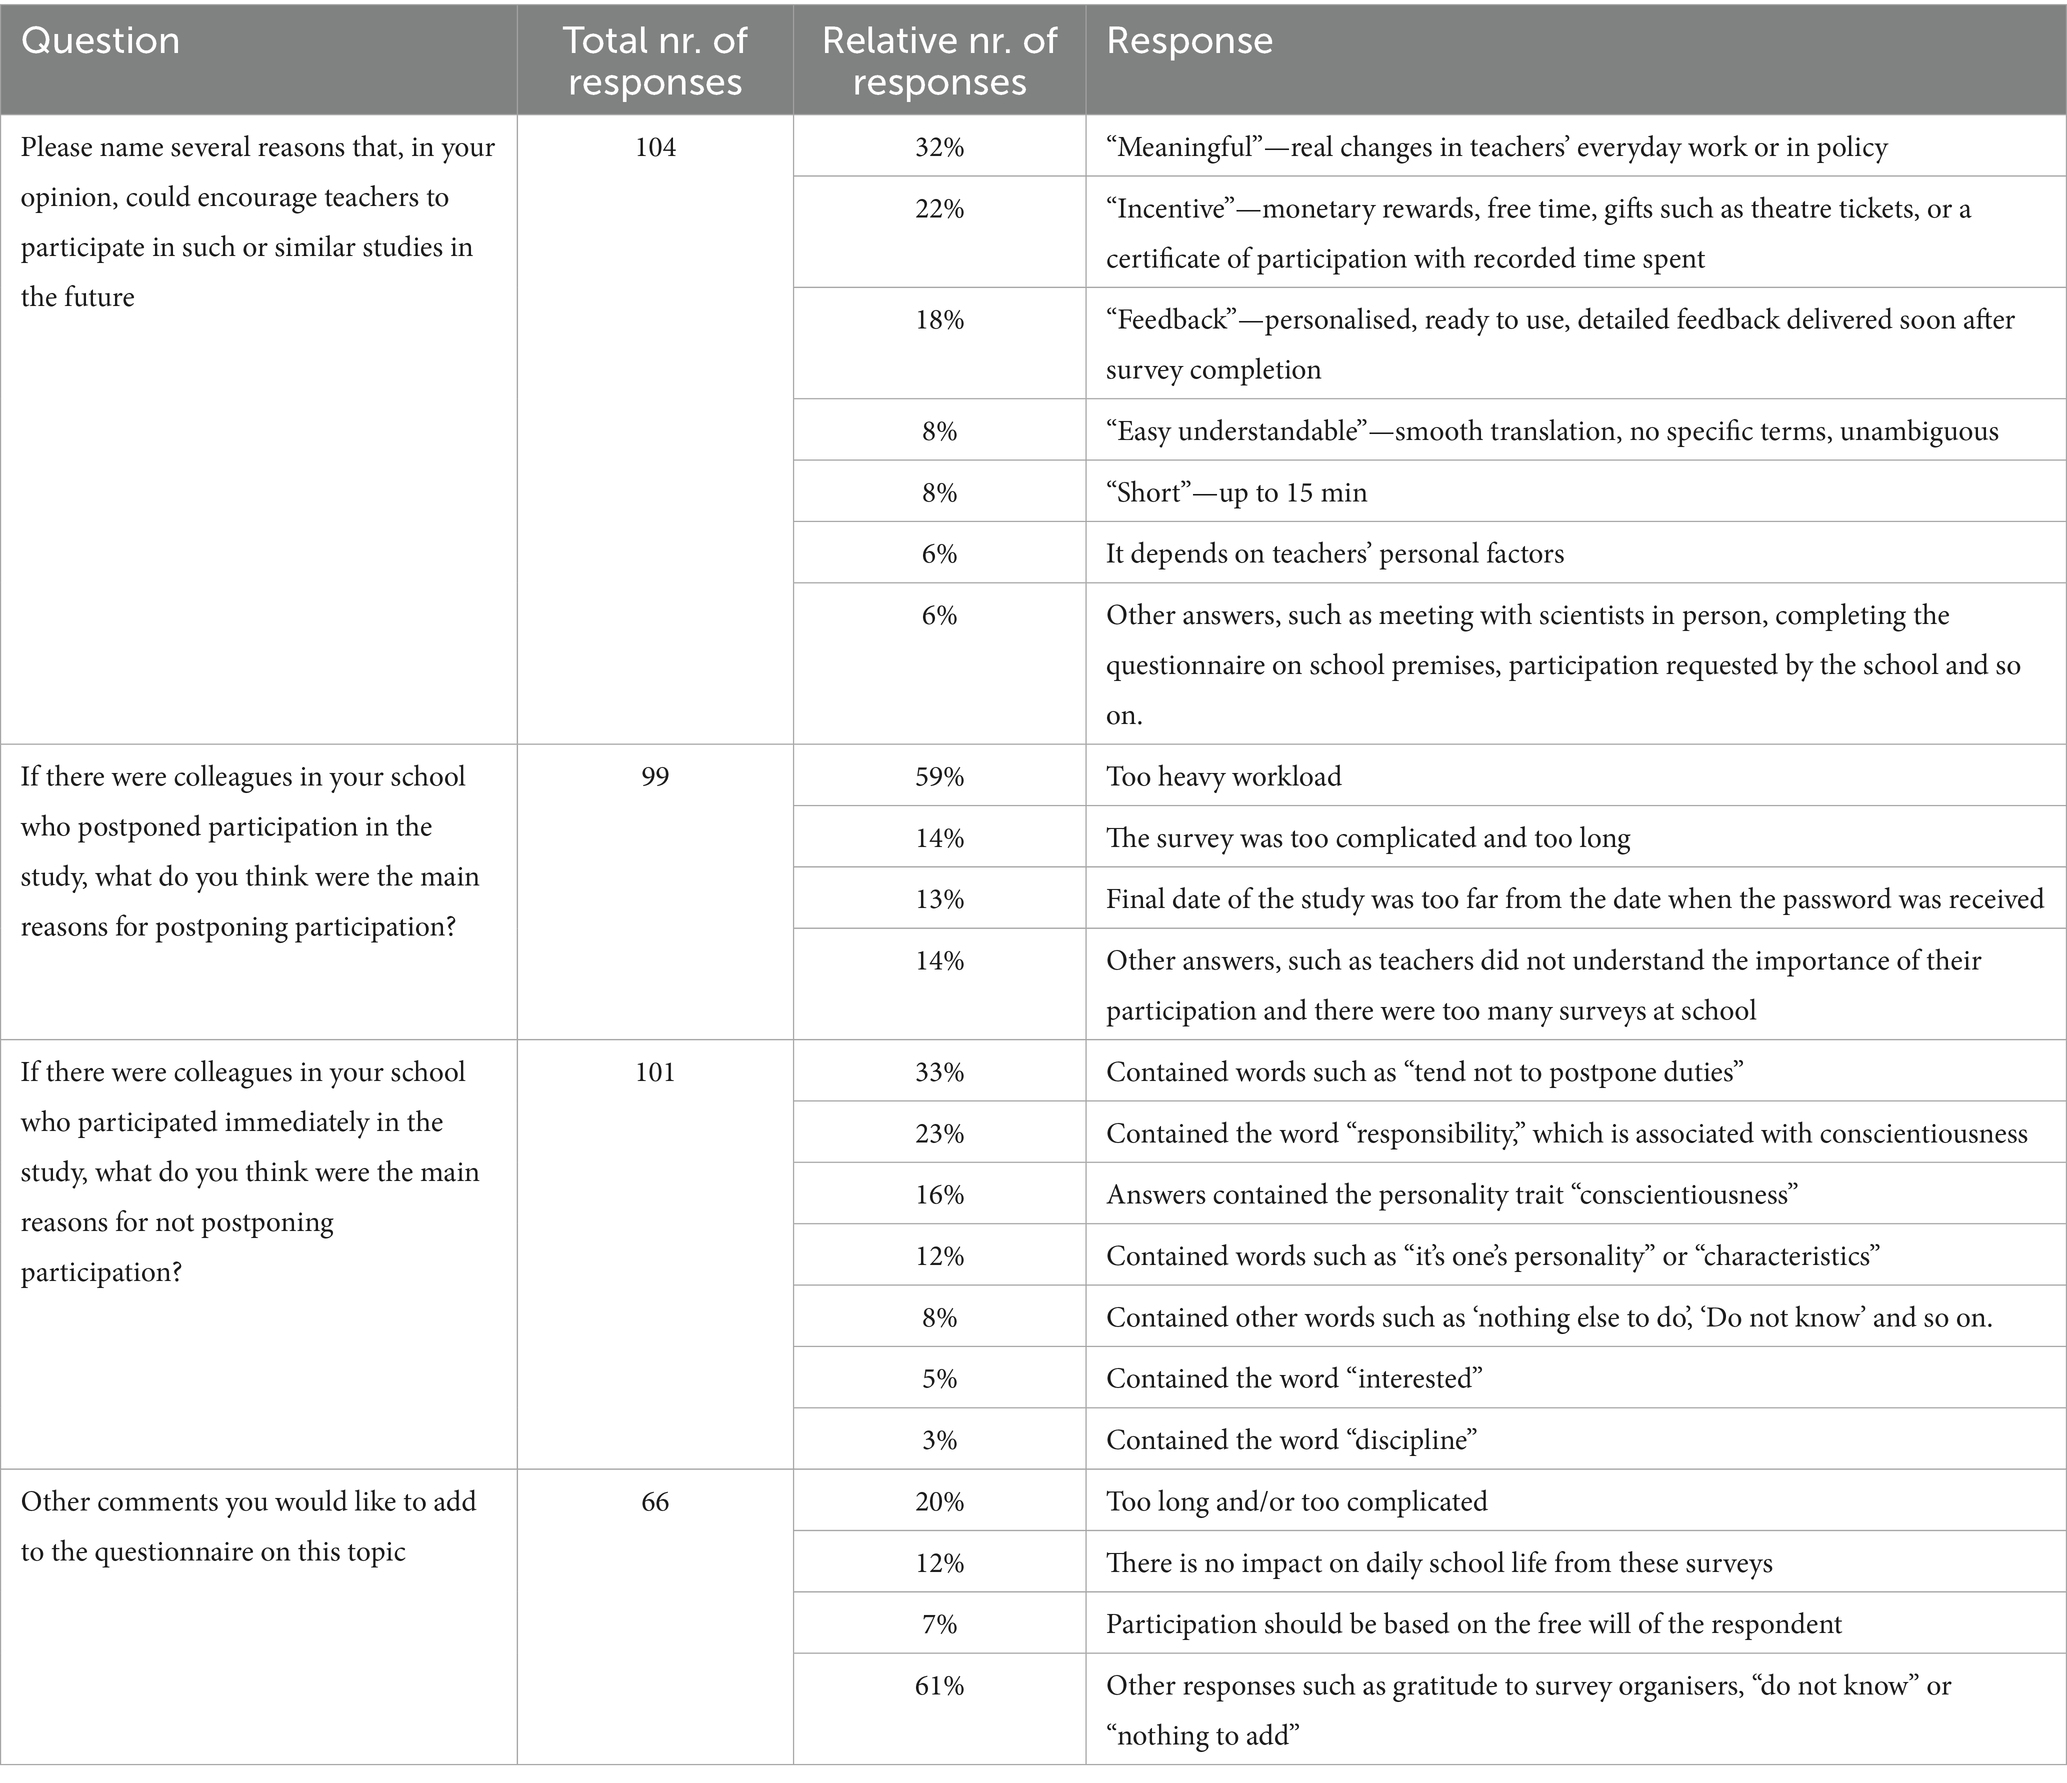
Table 6. Coordinators’ answers to questions about teachers’ reasons for participating in various studies.
3.2 Teachers
When comparing the group of teachers who participated in the TALIS 2024 to those who chose not to respond to the TALIS 2024 (non-respondents), statistically significant differences were found between the groups for two statements. Only 35% of non-respondents, but as many as 65% of respondents, agreed that “the invitation (password) must be available electronically,” thereby indicating that ease of responding to surveys is an important consideration. A total of 33% of the non-respondents and as few as 11% of the respondents did not agree that “various surveys for teachers are too often at my school” [sic] (see Tables 7, 8).
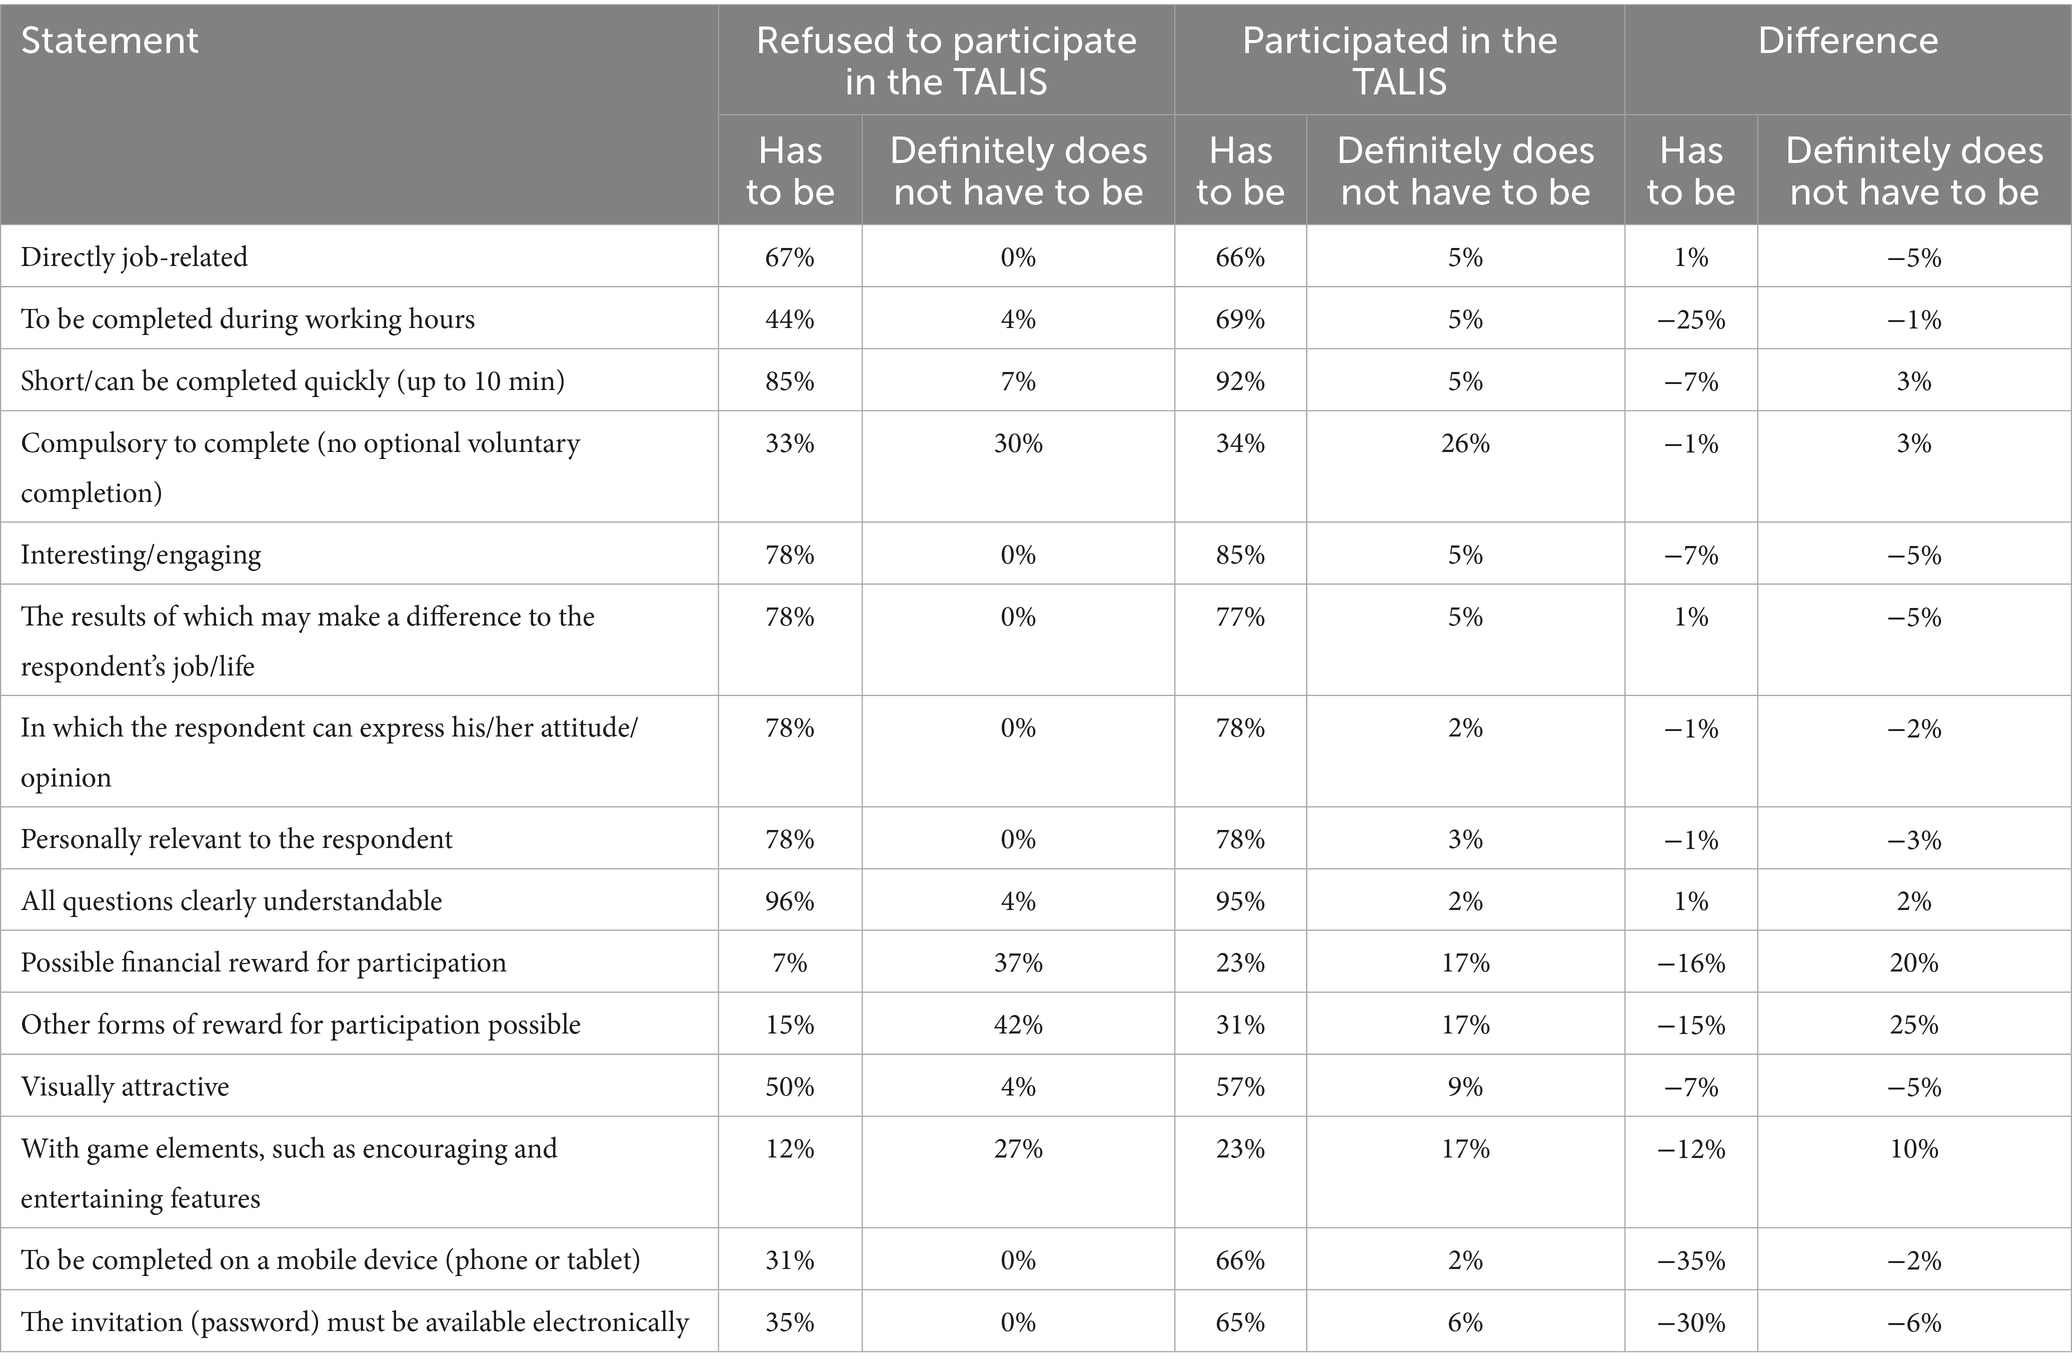
Table 7. Distribution of the teachers’ statements on questions about what a survey should be like, depending on whether they participated in the TALIS or not.
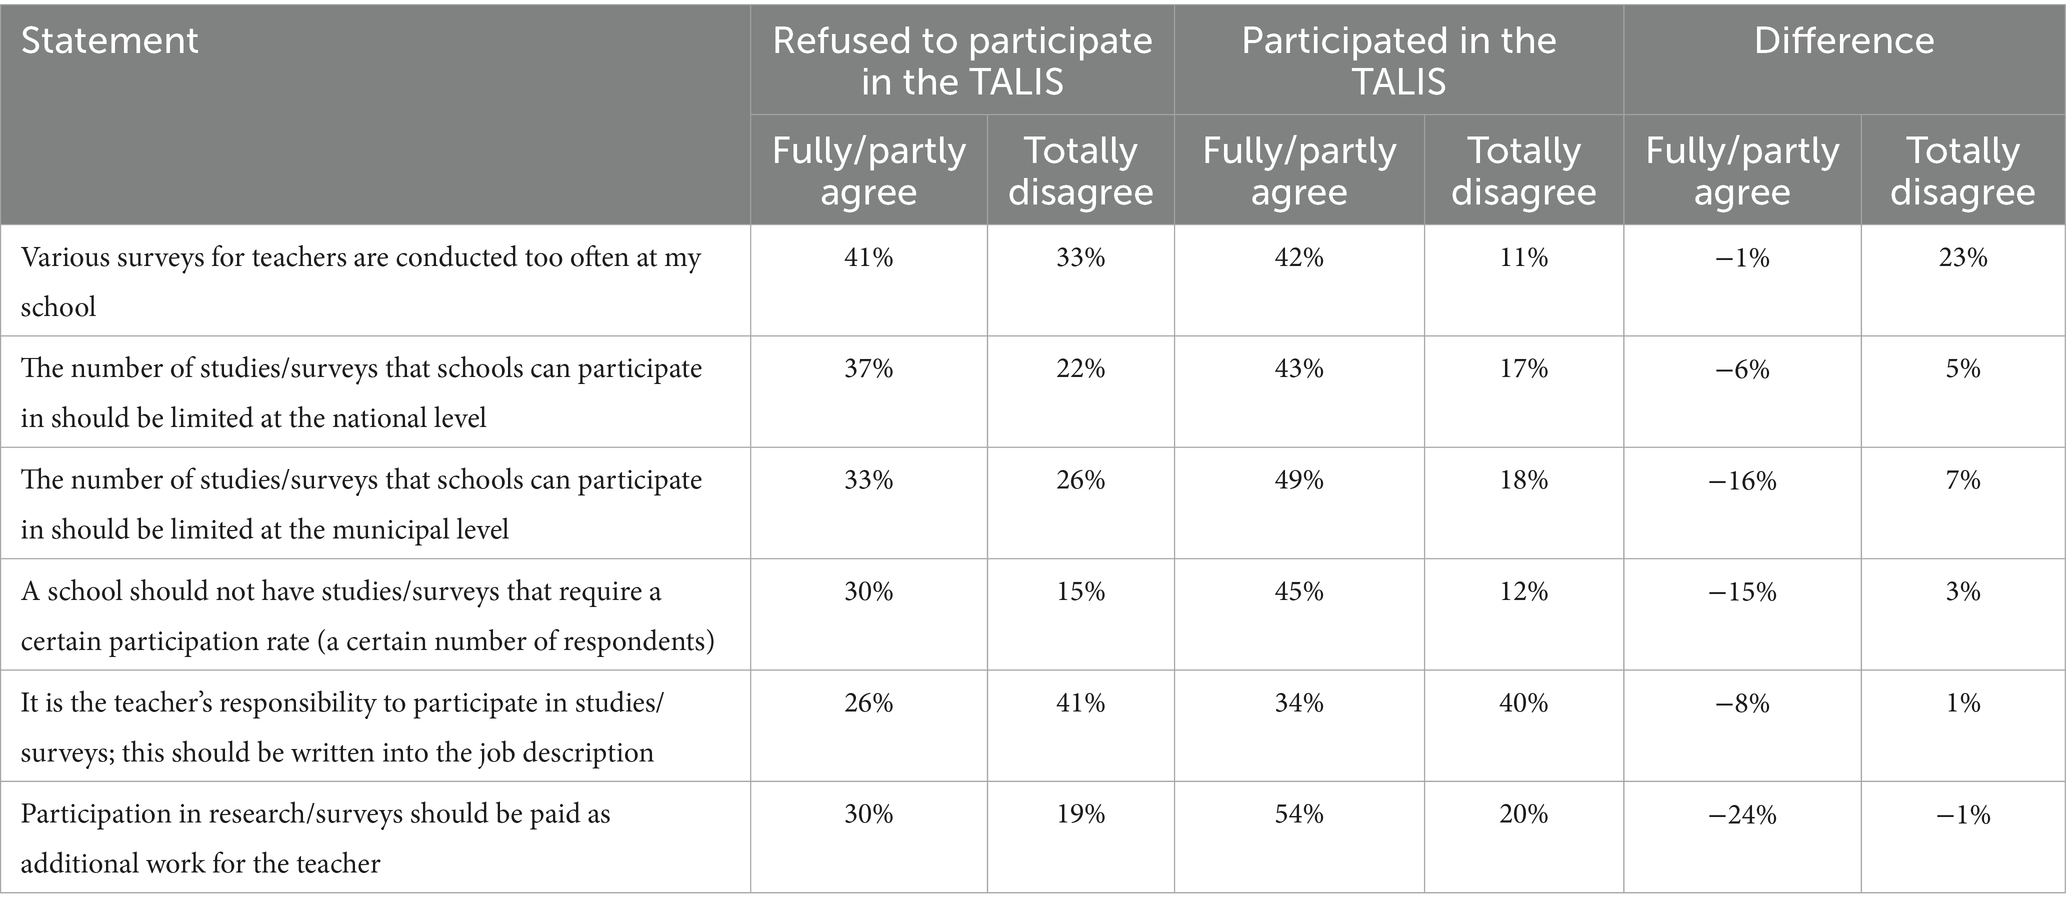
Table 8. Distribution of the teachers’ statements on survey administration questions, depending on whether they participated or not in the TALIS.
Less than 50% of the teachers answered free-response questions. When asked about ways surveys could be improved, the non-respondents highlighted that the purpose of studies was often vague or irrelevant to participants and that there was no direct benefit to participation. The respondents emphasised in the open-ended questions that surveys should not be as long as an hour or more and participation should not be forced in any way. Concerning motivation, the non-respondents usually reported that time management was the main reason for not participating, as well as concerns about anonymity. They also indicated that if a survey took up to 10 min and its purpose was relevant, they would participate. As reasons for refusal, the respondents reported the same concerns about anonymity and data usage, as well as the overall purpose of the survey. However, collegial attitude was mentioned as a reason for participation—that is, they would participate if the school’s administration supported participation and encouraged them to do so. Other comments included a need for feedback while they could still remember the survey they participated in.
The teachers’ and coordinators’ responses to the same questions were compared. In total, 66% of the teachers and 73% of the school coordinators agreed that surveys should be job-related and completed during working hours (61 and 66%, respectively). Only 18% of the teachers agreed that there must be a monetary reward for participation, while 36% of the coordinators thought the same. Other forms of reward were mentioned by 26% of the teachers and 47% of the coordinators. It was also common to report that there were too many different surveys—stated by 41% of the teachers and 79% of the coordinators (for details, see Table 9).
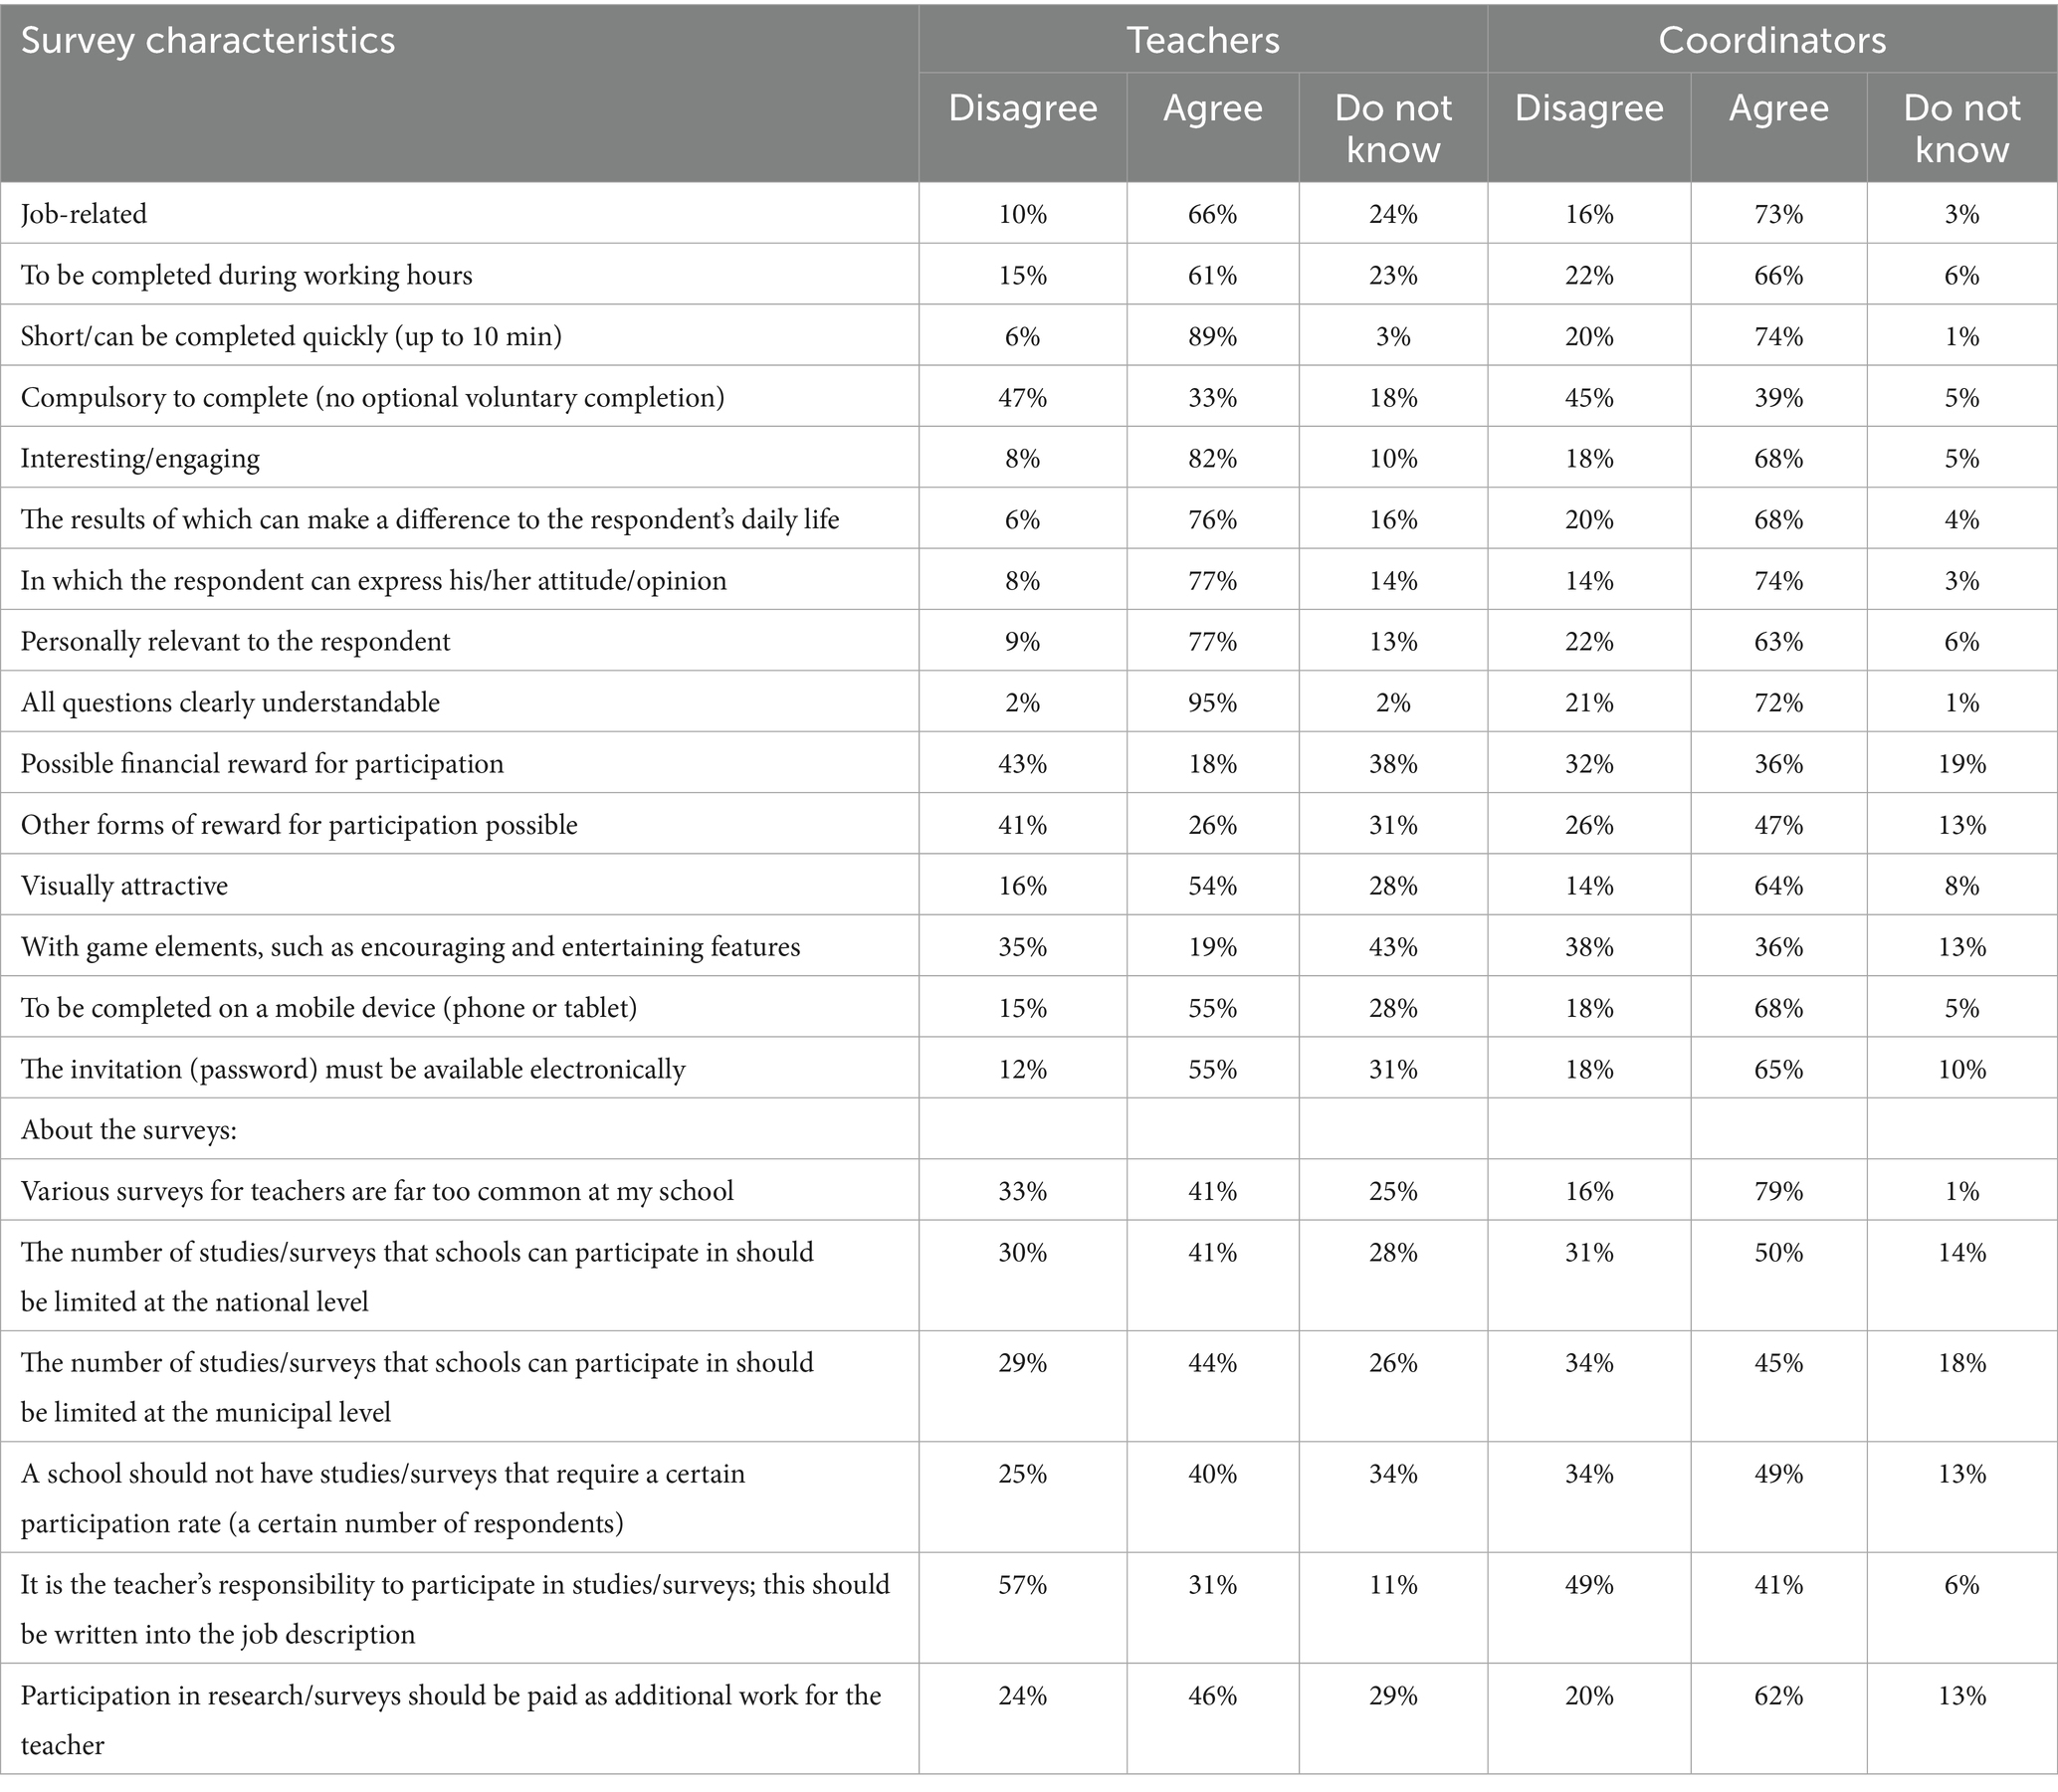
Table 9. Comparison of the teachers’ and coordinators’ responses on what a survey should be like.
3.3 Principals
During interviews, 90% of the principals indicated that they made the decision to participate in studies together with the school’s management team, while 10% did it individually based on previous knowledge about the study. A majority of 90% pointed out that their school had a tradition of participating in international large-scale studies, while 10% participated only if they had resources for participation. Only 30% of the schools had a special staff position for research projects and international cooperation coordination. All principals responded that participation in any study was not compulsory, while 20% acknowledged that the size and location of their school made them the best choice for any study. One third of the principals responded that the local government showed a high interest in the results of comparative international studies, which provided motivation to participate.
All interviewed principals agreed that they had no way of requesting parents to participate. One principal said:
“Only 17% parents are interested to look into (the) school management system to see how their child is doing at school”. The principal said that: “parents think that there is a free choice for them to choose to participate in child's education or not, but actually they have misunderstood that, they do not have a free choice not to be involved. All parents should be involved but only 17% understand that”. [sic]
If a survey was conducted through a web-based survey system where schools’ management teams could see the participants, all principals reported that the minimum participation rates were achieved. However, if a survey is conducted through a system outside of the school’s control, the management team cannot monitor participation as effectively. A total of 20% of principals responded that:
“Having agreed to participate, it is our obligation to do so for everyone involved”.
These schools were the ones whose participation rate in the TALIS 2024 was 100%, while 10% of the principals acknowledged that they never control participation. Interestingly, this 10% of schools recorded the lowest participation rates in the TALIS 2024. Others reported that they sent regular reminders for participation and trusted teachers’ words. All principals emphasised that no one is pushed against his/her will to participate, but voluntary participation meant completing questionnaires as best as possible:
“However, quality is important, not quantity”.
A total of 80% of the principals pointed to incentives teachers can get by participating—representation of the school at the local or national level is awarded extra points in the annual evaluation report—while 20% of the principals emphasised the need to pay for participation as a form of additional work. Another 20% of the principals organised for teachers to participate during school vacations, if possible, as there would be more free time to do so.
By verbally rating statements from 1 (not at all) to 5 (completely agree), 40% of the principals gave ratings higher than 3 to the statement: “Participation in educational research should be made compulsory for school staff,” while 30% disagreed with the statement, rating it lower than 3 points. A total of 80% of the principals completely agreed with the statement: “The school is an adequate place for conducting educational research in which a random sample of participants is selected,” as there are no other places where this type of research could be conducted. The same number of principals gave ratings of more than 3 points to the statement: “My school is often asked to participate in studies or surveys,” while the number of actual emails asking for participation varied from two emails per month to more than 10 emails per week (see Table 10). Overall, all principals were open to surveys at their school, and keywords that featured regularly during the interviews to characterise surveys positively included: “purposefully targeted,” “meaningful,” “in alignment with school’s goals,” “relevant topic,” “personalised, understandable feedback in foreseeable future,” and “clear benefit for a respondent.” A few keywords that characterised surveys more negatively also appeared, such as “strange questions,” “unclear purpose,” “consumes too much resources,” “educational process is not the main target,” and “too vague.”
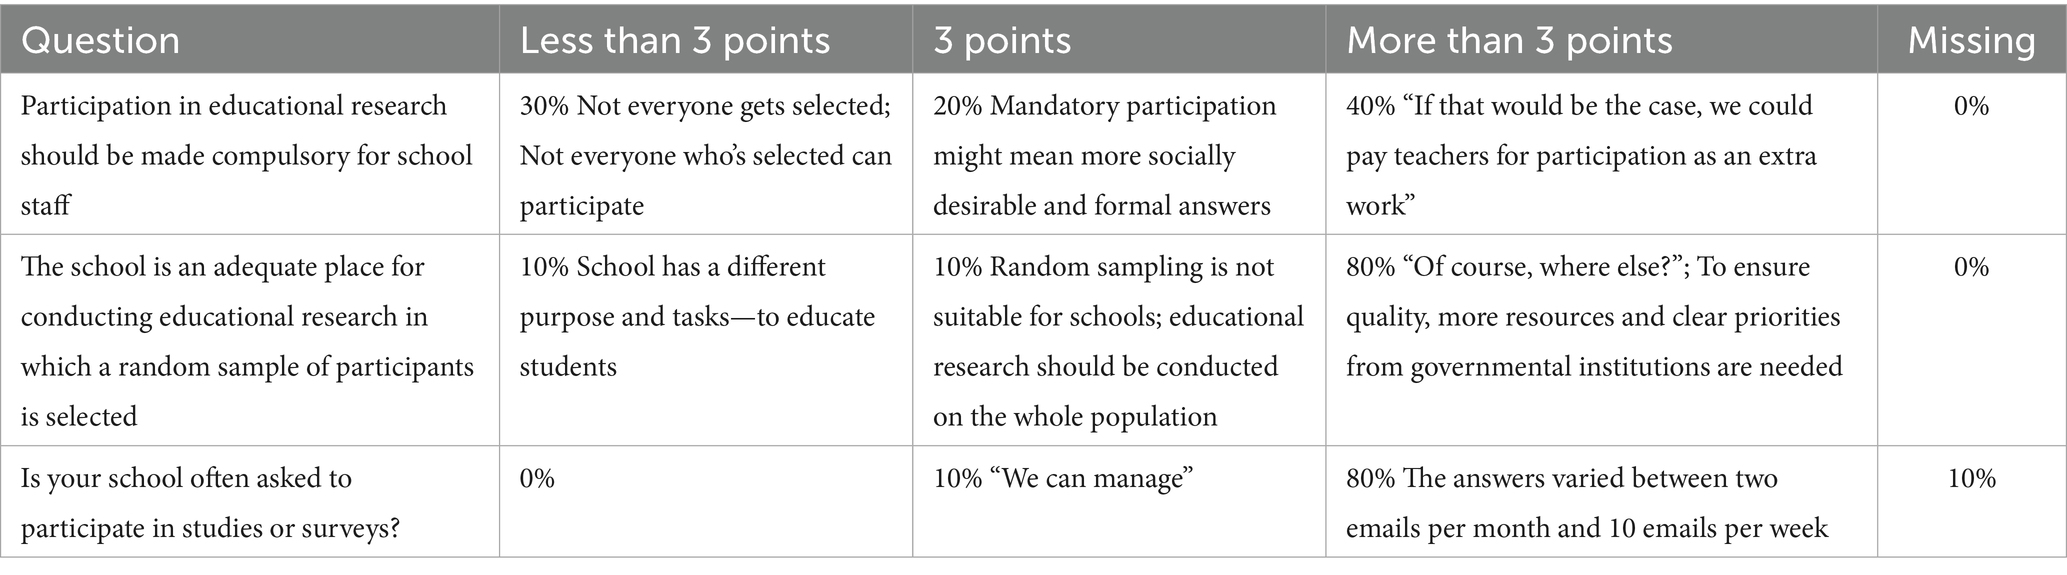
Table 10. Principals’ ratings on a Likert-type scale from 1 (completely disagree/very rarely) to 5 (completely agree/very often) on three questions about participation in studies/surveys and their frequency, with an example of a typical response to an open-ended question.
4 Discussion and conclusion
Porter and Whitcomb (2005) stated that there are people who never participate in surveys, which means that their opinions are never represented. This study showed that even when requested to participate, the teachers often did not participate in the TALIS 2024 and needed to be reminded more often to complete the survey of the follow-up study. The teachers who participated in the TALIS were more likely to complete the survey immediately. Both Porter and Whitcomb (2005) found that participants were more likely to have investigative personalities, while in this study, most TALIS 2024 school coordinators described immediate participants as responsible, conscientious, or as those who do not put off work until later.
Adding to the reasons for non-participation outlined by Roberts (2013), Reisinger et al. (2023,) and Grönemann (2024), this study observed that printed questionnaires handed directly to respondents were more frequently completed than online questionnaires. A plausible explanation is that the format reduced uncertainty about survey length and effort, thereby lowering the perceived cost of participation. Moreover, the immediate social context—such as a teacher’s reluctance to refuse a researcher face-to-face—may have reinforced compliance. These findings suggest that participation decisions are shaped not only by technological format, as Roberts (2013) emphasised, but also by situational and relational dynamics. Therefore, the data imply that strategies to increase online survey completion should address both the convenience of access (e.g., providing login information electronically) and the interpersonal dynamics that may encourage or discourage participation.
Consistent with Webber et al. (2013), the respondents in this study identified a lack of understanding of the research purpose as a barrier to participation, underscoring the importance of communication in survey recruitment. As noted by Nair et al. (2008), concerns about confidentiality were also raised. It suggests that data protection measures are insufficiently credible to potential participants. In line with Downes Le-Guin et al. (2012) and Rudžionienė et al. (2018), survey length and time constraints emerged as deterrents, with almost all teachers and most coordinators expressing that surveys should be short (≤10 min). In addition, the perception of being surveyed too often, reported by approximately half of the teachers and most school coordinators and principals, reflects what Nair et al. (2008) described as participation fatigue. Together, these findings suggest that non-participation is driven by a combination of factors: workload, communication, and perceptual (relevance, trust) barriers, highlighting the need for survey designs that minimise burden while enhancing perceived legitimacy.
This follow-up study showed that non-responders in the TALIS 2024 could be divided into two groups, as indicated by Webber et al. (2013): some refused to participate straight away, while the others’ refusal was passive—they forgot to complete it, did not prioritise completing the questionnaires or simply did not have time for it.
The data analysis of this study revealed that the teachers’ voluntary and immediate participation in the study was strongly positively associated with response rates, while multiple reminders were strongly associated with a 4% increase in completed questionnaires. If the entire sample completed the survey simultaneously in the school computer lab, almost no respondent refused to do so. In addition, in the teachers’ open-ended responses, the most common reason for participation was the collegial attitude and the fact that the coordinator asked them to do so. These patterns suggest that social influence and collective norms can override individual reluctance, underscoring the role of school culture and interpersonal accountability in shaping survey compliance.
The most common keyword in the opinions expressed by the teachers, coordinators, and principals about what a survey should be like was “meaningful”—something that respondents see as useful and important.
Findings from this study indicate that when school coordinators monitor participation within the survey system, response rates are more guaranteed. Reliance on individual volunteerism appears insufficient for achieving the participation thresholds required by ILSAs. This highlights the structural importance of oversight and facilitation, suggesting that institutional mechanisms—rather than individual motivation alone—are critical to ensuring representative participation.
Data availability statement
The raw data supporting the conclusions of this article will be made available by the authors without undue reservation.
Ethics statement
The studies involving humans were approved by University of Latvia Research Ethics Committee In Humanities And Social Sciences. The studies were conducted in accordance with the local legislation and institutional requirements. Written informed consent for participation was not required from the participants or the participants’ legal guardians/next of kin because consent to participate in the study was given verbally or written in the e-mail. The data obtained as a result of the study were an anonymously completed survey or a summary of interviews. Before participating in the study, the study participants were informed about the purpose of the study and the publication. The potential participants were approached in person. If the participant did not agree to participate in the study, he or she refused verbally. If the participant agreed, he or she was given an anonymous survey. The interviewed participants of this research expressed their consent via email.
Author contributions
KK: Writing – review & editing, Writing – original draft. VS: Writing – review & editing, Writing – original draft. OA: Writing – original draft, Writing – review & editing.
Funding
The author(s) declare that no financial support was received for the research and/or publication of this article.
Conflict of interest
The authors declare that the research was conducted in the absence of any commercial or financial relationships that could be construed as a potential conflict of interest.
Generative AI statement
The authors declare that no Gen AI was used in the creation of this manuscript.
Any alternative text (alt text) provided alongside figures in this article has been generated by Frontiers with the support of artificial intelligence and reasonable efforts have been made to ensure accuracy, including review by the authors wherever possible. If you identify any issues, please contact us.
Publisher’s note
All claims expressed in this article are solely those of the authors and do not necessarily represent those of their affiliated organizations, or those of the publisher, the editors and the reviewers. Any product that may be evaluated in this article, or claim that may be made by its manufacturer, is not guaranteed or endorsed by the publisher.
References
Coe, R., Waring, M., Hedges, L. V., and Ashley, L. D. (Eds.) (2025). Research methods and methodologies in education. London: SAGE Publications.
Creswell, J. W. (2021). A concise introduction to mixed methods research. Thousand Oaks California: SAGE Publications.
Creswell, J. W., and Creswell, J. D. (2018). Research design: qualitative, quantitative, and mixed methods approaches. Thousand Oaks California: SAGE Publications.
Dawadi, S., Shrestha, S., and Giri, R. A. (2021). Mixed-methods research: a discussion on its types, challenges, and criticisms. J. Pract. Stud. Educ. 2, 25–36. doi: 10.46809/jpse.v2i2.20
Downes Le-Guin, T. D. L., Baker, R., Mechling, J., and Ruyle, E. (2012). Myths and realities of respondent engagement in online surveys. Int. J. Market. Res. 54, 613–633. doi: 10.2501/IJMR-54-5-613-633
Grönemann, M. (2024). How to reduce item nonresponse in face-to-face surveys? A review and evidence from the European social survey. Methods Data Anal. J. Quant. Methods Surv. Methodol. (mda) 18, 165–184. doi: 10.12758/mda.2024.02
Herzog, A. R., and Bachman, J. G. (1981). Effects of questionnaire length on response quality. Public Opin. Q. 45, 549–559. doi: 10.1086/268687
Mayring, P. (2014). Qualitative content analysis: theoretical foundation, basic procedures and software solution. SSOAR. Available online at: http://nbn-resolving.de/urn:nbn:de:0168-ssoar-395173
Nair, C. S., Adams, P., and Mertova, P. (2008). Student engagement: the key to improving survey response rates. Qual. High. Educ. 14, 225–232. doi: 10.1080/13538320802507505
Porter, S. R., and Whitcomb, M. E. (2005). Non-response in student surveys: the role of demographics, engagement and personality. Res. High. Educ. 46, 127–152. doi: 10.1007/s11162-004-1597-2
Reisinger, W. M., Zaloznaya, M., and Woo, B. D. (2023). Fear of punishment as a driver of survey misreporting and item non-response in Russia and its neighbors. Post-Sov. Aff. 39, 49–59. doi: 10.1080/1060586X.2022.2150490
Roberts, C. (2013). Participation and engagement in web surveys of the general population: an overview of challenges and opportunities. Paper presented at the Opening Conference of the NMI “Web Surveys for the General Population. Londo: How, Why and When?”, (Accessed February 25–26, 2013).
Rudžionienė, J., Grigas, V., Enwald, H., and Kortelainen, T. (2018). Drop out factors in data literacy and research data management survey: experiences from Lithuania and Finland. Inf. Moksl. 82, 115–130.
Teddlie, C., and Tashakkori, A. (2009). Foundations of mixed methods research: integrating quantitative and qualitative approaches in the social and behavioral sciences. Los Angeles, CA: SAGE Publications.
Webber, M., Lynch, S., and Oluku, J. (2013). Enhancing student engagement in student experience surveys: a mixed methods study. Educ. Res. 55, 71–86. doi: 10.1080/00131881.2013.767026
Keywords: non-respondents, teacher surveys, data collection, voluntary participation, online surveys
Citation: Kampmane K, van Staden S and Ozola A (2025) How to square the circle of voluntary participation in controlled samples? Front. Educ. 10:1649324. doi: 10.3389/feduc.2025.1649324
Edited by:
Yousef Wardat, Yarmouk University, JordanReviewed by:
Miryan Cruz Debiasi, University of Southern Santa Catarina, BrazilDaniela Semião, Universidade de Lisboa Unidade de Investigacao e Desenvolvimento em Educacao e Formacao, Portugal
Copyright © 2025 Kampmane, van Staden and Ozola. This is an open-access article distributed under the terms of the Creative Commons Attribution License (CC BY). The use, distribution or reproduction in other forums is permitted, provided the original author(s) and the copyright owner(s) are credited and that the original publication in this journal is cited, in accordance with accepted academic practice. No use, distribution or reproduction is permitted which does not comply with these terms.
*Correspondence: Kristine Kampmane, a3Jpc3RpbmUua2FtcG1hbmVAbHUubHY=