 Chengwei Xu1,2†
 Bing Shi3*†
- 1College of Teacher Development, Shaanxi Normal University, Xi'an, China
- 2College of Physical Education, Xi’an Fanyi University, Xi'an, China
- 3College of Physical Education, Shaanxi Normal University, Xi'an, China
Background: Achieving educational equity requires understanding how physical education (PE) teachers are spatially distributed.
Methods: Guided by a sports-geography lens on spatial allocation (center–periphery dynamics; clustering/dispersion), we operationalized the framework into a composite PE-teacher allocation index covering quantity, structure, quality, and professionalization. Indicator selection and interpretation follow the spatial framework, whereas data-driven weights are obtained via the entropy method, which uses between-school variation to avoid subjective expert weighting. We analyzed 1,504 schools in Xi’an (2024), cross-validating official statistics for accuracy and completeness. Spatial visualization (GIS) used Jenks natural breaks (k = 5) to reveal heterogeneity; ordinary Kriging interpolation depicted continuous gradients; and Global/Local Moran’s I (with permutation tests) quantified spatial autocorrelation patterns.
Results: Xi’an exhibits a pronounced center-strong/periphery-weak pattern. High–high clusters of well-resourced schools concentrate in the urban core, whereas low–low clusters in remote districts indicate pockets of persistent under-resourcing. The Global Moran’s I for the composite index is 0.268 (Z = 5.079, p < 0.01), confirming moderate positive spatial autocorrelation. Only 3.4% of schools fall into the top-tier category of the composite index, while medium-low and low tiers dominate peripheral counties. Student–teacher ratios are markedly higher in central urban areas, and teacher vacancies as well as limited training participation are more prevalent in outlying areas.
Policy implications: We propose time-bound, measurable targets (e.g., reducing vacancy rates, increasing the full-time teacher share and continuing professional development participation) and a GIS-enabled monitoring system to track progress toward equity goals.
Limitations: This single-city, cross-sectional study limits generalizability and cannot establish causality.
Contribution: By explicating how a sports geography theoretical framework structures the indicator system and how the entropy method assigns objective weights, the study offers a transparent, replicable template for diagnosing and managing spatial inequities in PE-teacher allocation.
1 Introduction
Education modernization has made equity one of the core priorities of education policy worldwide. The Chinese government, for example, has issued directives to build a high-quality and balanced public education service system to narrow regional resource gaps and achieve education equity (General Office of the CPC Central Committee and General Office of the State Council, 2023; General Office of the CPC Central Committee and General Office of the State Council, 2020). Equity in education means that all students can fairly access the resources necessary for their development; rational allocation of educational resources is a key pathway to realizing this equity. Ensuring a balanced allocation of PE teachers aligns with China’s “health first” education policy, which treats student health and physical education as strategic priorities (An, 2022; Zhai, 2006; Chen, 2007). International studies similarly underscore the importance of balanced spatial distribution of educational resources in closing education gaps. For example, a U.S. study found that an uneven distribution of quality teachers among schools exacerbated the disadvantages of already underserved groups in student outcomes (Adamson and Darling-Hammond, 2012). The OECD’s Equity and Quality in Education report stresses that achieving equity requires fairness and inclusiveness in resource distribution, so that students’ access is not constrained by their socioeconomic background or geographic location (OECD, 2012). In addition, Tate’s “Geography of Opportunity” theory reveals how geographic location shapes individuals’ access to education, emphasizing the need for spatially balanced resource allocation for educational equity. Tate posits that spatial location structures access to critical resources—such as qualified teachers—thereby influencing educational opportunities. In this study, this theory provides a lens to interpret how the uneven spatial distribution of PE teachers can widen or narrow students’ opportunities to receive quality PE. Operationally, we examine these location–opportunity linkages using spatial autocorrelation statistics (Global Moran’s I) and local cluster detection (LISA) (Tate, 2008).
School sports play an irreplaceable role in promoting students’ physical health, fitness, and the cultivation of teamwork and perseverance (Bailey, 2006). Beyond physical health, participation in school-based physical activity contributes to cognitive and socio-emotional development. Evidence from Dhahbi et al. (2025a) indicates that aerobic, resistance, and combined training regimens can counter age-related cognitive decline and are associated with improved cognitive performance. Consistent with these findings, Singh et al. (2019) reported that regular physical activity improves children’s executive function, working memory, and attention, while Álvarez-Bueno et al. (2020) found a significant positive association between physical activity and academic achievement—particularly in mathematics and reading. Likewise, Lubans et al. (2016) highlighted that school-based physical activity programs foster socio-emotional skills in youth. These findings collectively reinforce the need for adequate and equitable PE-teacher allocation: if physical activity so strongly benefits students’ cognitive and social development, then ensuring every school has sufficient, qualified, and motivated PE teachers is critical for providing those opportunities (Lubans et al., 2016). With the ongoing emphasis on quality education and the “Healthy China” initiative, education authorities at all levels are increasingly focused on improving the allocation of school sports resources to support students’ holistic development and lifelong fitness habits (Ministry of Education of the People's Republic of China, 2020).
At the basic education level in China, teacher resource allocation is primarily determined by factors such as government staffing norms, school size, student–teacher ratio standards, and funding. However, PE teacher allocation faces multiple challenges. First, there is a significant urban–rural divide: disparities in economic development and infrastructure have led to severe PE teacher shortages in suburban and rural schools (Liu and Wu, 2021). Second, there are notable inter-school differences: elite “key” schools versus regular schools show gaps in recruitment channels, compensation, and training opportunities (Goldring and Hallinger, 2008). Third, limited teacher mobility exacerbates inequities: remote areas struggle to attract and retain high-quality PE teachers due to challenging living and professional conditions (Liang and Ma, 2021). These uneven allocations not only affect the quality of PE instruction and reduce students’ participation in physical activity, but may also negatively impact students’ academic performance and overall development. In short, the current spatial imbalance in PE-teacher distribution is an obstacle to education equity and quality (OECD, 2012).
Despite these challenges, there is a lack of empirical research in China examining the spatial imbalance of school PE teachers. Addressing this gap is academically valuable and practically significant. On one hand, spatial analysis can reveal geographic patterns and clustering of teacher allocation, enriching the theoretical perspective on balanced educational resources. Indeed, international studies have applied GIS technologies to analyze spatial patterns in education; for example, Singleton and Longley (2015) used geospatial modeling to illustrate geographic disparities in educational indicators in the UK, providing an intuitive spatial perspective for policy. Applying similar spatial techniques in the Chinese context can shed light on PE-teacher distribution patterns and identify “hotspots” and “cold spots” of resource allocation. On the other hand, diagnosing these patterns is a crucial first step toward targeted policy interventions. By identifying where PE teacher resources are most deficient, policymakers can design informed strategies (such as incentive schemes, teacher rotations, or remote support programs) to address inequities.
Guided by sports geography as the theoretical lens, we link the spatial distribution of PE-teacher resources to questions of spatial justice, accessibility, and location–allocation (Shi, 2007; Shi, 2005). Within this framework, we build a multi-dimensional index system for PE-teacher allocation (quantity, structure, quality, professionalization) and assign objective, variation-based weights using the entropy method. We then combine GIS visualization with Global Moran’s I (overall spatial autocorrelation), Local Moran’s I / LISA (local clusters and outliers), and ordinary Kriging (continuous spatial gradients) to characterize patterns across Xi’an. International guidance on equity in school physical education—UNESCO’s Quality Physical Education (QPE) and the WHO Global Action Plan on Physical Activity (GAPPA)—serves as conceptual benchmarks to interpret findings and discuss policy relevance (cross-country comparisons are beyond our scope) (OECD, 2012; Liang and Ma, 2021; UNESCO, 2015; WHO, 2018).
Research questions. (i) What is the overall spatial pattern of PE-teacher allocation in Xi’an, and do central urban areas differ significantly from peripheral districts/counties? (ii) Is there significant spatial autocorrelation in the distribution of PE-teacher resources (i.e., do high- or low-resource schools cluster) and what are the characteristics of any high-value/low-value clusters and spatial outliers? (iii) How do individual indicators (e.g., student–teacher ratio, full-time teacher ratio, training participation) vary spatially, and what underlying factors might explain these patterns? Addressing these questions provides a diagnostic baseline for improving the spatial equity of PE-teacher resources.
Research Hypotheses. (i) H1 (Global spatial autocorrelation). The composite PE-teacher allocation index exhibits positive global spatial autocorrelation (Global Moran’s I > 0; 999 permutations, α = 0.05). (ii) H2 (Urban–periphery contrast). The mean composite index in central urban districts (Beilin, Xincheng, Lianhu, Yanta, Weiyang, Baqiao) is higher than in peripheral districts/counties (two-sample t-test, 95% CI). (iii) H3 (Local clustering pattern). High–high (H–H) clusters concentrate in the urban core, while low–low (L–L) clusters concentrate in remote counties; Local Moran’s I (LISA) remains significant after FDR correction (q < 0.05).
The remainder of the paper is structured as follows. Section 1 describes the data sources. Section 2 presents the construction of the evaluation index system and the research methodology. Section 3 reports the results of the spatial analysis of PE-teacher allocation. Section 4 discusses the findings, provides policy recommendations (with actionable indicators and timelines), addresses the study’s limitations, and outlines directions for future research.
2 Data sources
This study focuses on Xi’an, Shaanxi Province, China—a prefecture-level capital city comprising 13 districts and counties. The study area includes 1,504 schools at the basic education level (primary, junior high, senior high, integrated K-12 schools, complete secondary schools, and vocational high schools) with data from the year 2024. Xi’an is an illustrative case with a mixed urban core and surrounding rural counties, typical of many Chinese cities undergoing rapid urbanization. Its urban–rural differences in educational resources provide a relevant context to examine spatial allocation issues.
All data used are from authoritative public sources, and we implemented careful validation procedures to ensure accuracy. Specifically: (i) Teacher indicator data—we obtained data for each school on the relevant teacher indicators from official publications such as the China Urban Statistical Yearbook, Shaanxi Provincial Statistical Yearbook, and Xi’an Municipal Statistical Yearbook, as well as the Ministry of Education’s annual report on school physical education. We cross-checked and compiled these indicators to build our dataset. (ii) School geographic coordinates—we retrieved each school’s latitude and longitude using the Google Maps Geocoding API by inputting the standardized school address. These coordinates were then cross-verified against the official school distribution map provided by the Xi’an Municipal Bureau of Education to ensure locational accuracy. Any discrepancies greater than 100 meters were manually inspected and corrected.
To maximize data quality, we undertook a multi-layered QA/QC process. All core fields (e.g., number of PE teachers, student enrollment) were triangulated across at least two independent sources. We harmonized definitions (ensuring, for example, that “full-time teacher” had a consistent meaning across datasets) and performed range and outlier checks (using interquartile ranges and z-scores) to detect anomalies. Records flagged as potential errors were traced back to original yearbook tables or official reports for verification. Missing data were minimal; no imputation was applied for key outcome variables. For a few ancillary variables with sporadic missing values, we used district-level median imputation and confirmed that results were robust to excluding those cases. In sum, the dataset is a comprehensive and reliable representation of Xi’an’s school PE-teacher allocation in 2024.
3 Research methods
Under the guidance of the sports geography theoretical framework, we employed a combination of quantitative and spatial analytical methods to examine the spatial characteristics of school PE-teacher allocation. The methodology comprises: (i) literature review and policy analysis to inform indicator selection; (ii) construction of an evaluation index system for PE-teacher allocation; (iii) objective weighting of indicators using the entropy method; and (iv) spatial statistical analysis including mapping, spatial autocorrelation, and cluster detection. We also carried out supplementary analyses (e.g., significance tests, cross-validation of spatial models) to ensure the robustness of results.
3.1 Evaluation index system construction
Building on prior research and policy standards, we established a multi-dimensional index system to evaluate the level of PE-teacher allocation at the school level. As noted, the concept of “school PE-teacher resources” spans four facets: quantity, structure, quality, and professionalization (Sallis, 2012). Chinese scholars emphasize these facets in complementary ways: Zhang and Meng (2011) define PE-teacher resources as personnel capable of delivering daily PE teaching, training, and after-school sports services—the core element of educational resources. Liu et al. (2024) likewise regard PE teachers as the core of educational human resources, vital for youth health and talent cultivation. Wang (2010) underscores that PE teachers with professional PE/health knowledge and teaching skills are essential for regular instruction and extracurricular activities. Li and Hang (2001) provides a functional classification (classroom teachers, specialized coaches, activity organizers) and distinguishes by professional level, employment status (full-time vs. part-time), and career stage (novice, mid-career, senior). Synthesizing these, we view school PE teachers as multi-role professionals (educator, health promoter, skills trainer) whose work increasingly intersects with public-health goals.
To comprehensively assess a school’s PE-teacher resources, we include indicators across the quantity–structure–quality–professionalization dimensions (Hardman and Marshall, 2014). The quantity dimension reflects supply relative to need (e.g., number of PE teachers, student–teacher ratio, class–teacher ratio) (Hardman and Marshall, 2014). Structure captures workforce composition (e.g., full-time teachers ratio; some structural features are indirectly reflected by other indicators) (Li and Hang, 2001). Quality covers qualifications, competencies, and recognition (e.g., outstanding-teachers ratio) (Baumgartner, 2022; Kyrgiridis et al., 2014). Professionalization relates to ongoing development and workforce renewal (e.g., teachers attending training ratio, additional-teachers ratio, teacher vacancies ratio) (Latino et al., 2024; Fu and Xi, 2023). International surveys show that PE programs often fall short of policy requirements and that inadequate teacher training undermines instructional quality (Hardman and Marshall, 2014). Thus, optimizing structure while ensuring adequate quantity, continually improving quality, and strengthening professionalization are all necessary to build a high-level PE-teaching workforce.
Accordingly, we define school PE teachers as the team deployed to achieve PE goals and promote students’ physical health and motor-skill development. This team is responsible for instruction, health education, activity organization, and program management; its connotation covers scale, composition, quality, and specialization. Guided by this concept and relevant theory/policy, we constructed a scientific and practical evaluation index system for balanced development of school PE-teacher resources.
Following this framework—and considering data availability—we selected seven indicators:
i. Student–teacher ratio (higher values indicate heavier workload per teacher, negatively affecting allocation balance) (Fan, 2019).
ii. Class–teacher ratio (classes per teacher, another workload indicator; higher is worse) (Xue, 2020).
iii. Full-time teacher ratio (share of PE teachers who are full-time specialists; higher indicates a more stable, professional workforce) (Zhang et al., 2016).
iv. Teachers attending training ratio (annual CPD participation rate; higher suggests better on-the-job development) (Zhao et al., 2024).
v. Additional-teachers ratio (new hires as a fraction of total teachers; higher reflects active replenishment of staff and capacity expansion) (Li, 2022).
vi. Teacher vacancies ratio (unfilled authorized PE teacher posts; higher indicates unmet demand and resource gaps) (Wang et al., 2024).
vii. Outstanding-teachers ratio (share of PE teachers recognized at county level or above for excellence; higher signals higher overall teacher quality and leadership) (Hu and Yang, 2014).
The definitions and measurement of each are detailed in Table 1.
Table 1. Evaluation Index System for School PE-Teacher Allocation.
Each indicator is anchored in policy standards or literature. Standard student–teacher and class–teacher ratios follow national guidelines; definitions of full-time teacher and training participation align with Ministry of Education documents; additional-teachers and vacancies ratios follow education-statistics norms; and the outstanding-teachers criterion reflects official excellence awards. We interpret the set through a sports-management lens, viewing the PE-teacher workforce as a resource-and-talent development system: planning/funding decisions appear in vacancy rates (high = unfilled posts) and additional-teachers ratio (high = active hiring); deployment rules and school size shape student/class–teacher ratios (higher = heavier loads); professional development is captured by training participation and, over time, a higher full-time share; recognition and career pathways are proxied by the outstanding-teachers ratio. This mapping lets us discuss central–peripheral differences in terms of management levers (e.g., post stability, CPD support, deployment priorities), providing a policy-relevant interpretation of the spatial patterns (Al-marri et al., 2025; Sotiriadou and Shilbury, 2009; De Bosscher et al., 2015).
Finally, the quality dimension in our study extends beyond formal credentials to specialized competencies (e.g., injury prevention and exercise science), which are essential for safe and effective PE instruction. As Dhahbi et al. (2025b) note, adopting modern paradigms (e.g., joint-by-joint training for injury prevention) requires up-to-date scientific knowledge. In addition, teachers’ motivational behaviors matter for student engagement: a self-determination-theory classification (Ahmadi et al., 2023) identifies autonomy-supportive practices that enhance students’ psychological needs (autonomy, competence, relatedness), improving participation and learning. Thus, equitable allocation must consider not only numbers and credentials but also the capacity to motivate and inspire—especially in disadvantaged schools (Dhahbi et al., 2025b).
3.2 Analysis of the highest-weight indicators
i. Additional-teachers ratio (27.07%). The largest entropy weight reflects workforce expansion and renewal. International education planning views continuous hiring as a key response to shortages (e.g., UNESCO estimates that by 2030 the world will need ~44 million additional primary and secondary teachers, much to replace attrition) (UNESCO, 2023). Higher inflows help lower student–teacher ratios, relieve workload, and improve instructional quality. New hires also bring fresh pedagogy, supporting workforce sustainability. China’s Ministry of Education likewise calls for evidence-based recruitment to address structural shortages of PE teachers. Thus, a high additional-teachers ratio generally signals active hiring and near-term staffing improvement (Ministry of Education of the People’s Republic of China, 2022).
ii. Outstanding-teachers ratio (23.52%). This share of teachers recognized at county level or above is a key dimension of teacher quality. In monitoring frameworks, a higher proportion of outstanding teachers indicates a stronger faculty and is associated with improved educational quality (Lanzhou University Academic Affairs Office, 2021). Such teachers often lead in instructional reform and mentorship, helping colleagues improve. Internationally, many systems (e.g., National Board Certification in the U. S.) recognize exemplary teachers to diffuse high standards (National Board for Professional Teaching Standards (NBPTS), 2024). In short, a high outstanding-teachers ratio signals a high-capability staff that supports PE quality and student benefit.
iii. Teacher-vacancies ratio (12.69%). This reflects the share of positions not yet filled. Its relatively high weight indicates that shortages strongly affect PE staffing. High vacancy rates directly undermine instruction and can trigger stopgaps (out-of-field coverage, larger classes, reduced instructional time) that weaken outcomes. Best practice therefore prioritizes closing vacancies quickly (Learning Policy Institute, 2023).
3.3 Brief notes on the other indicators
i. Student–teacher ratio (10.64%). A core global indicator directly tied to individual attention. Lower ratios allow more personalized instruction; excessive ratios impede inclusive, high-quality PE (SHAPE America, 2019).
ii. Full-time teachers ratio (11.63%). A higher share indicates reliance on trained PE specialists rather than non-specialists or temporary coverage, supporting professionalization, continuity, and safety (Ministry of Education of the People’s Republic of China, 2014).
iii. Teachers-attending-training ratio (10.62%). The CPD participation share reflects professional development. Sustained CPD enhances teacher self-efficacy and instructional quality; many systems mandate periodic in-service training (European Federation of Sport Universities and Physical Education Teachers (EFSUPIT), 2022).
iv. Class–teacher ratio (3.83%). Although lower-weight here, it remains informative: high values suggest potential overload. Upper bounds in practice help prevent over-teaching and ensure each class receives adequate attention (Ministry of Education of the People’s Republic of China, 2020).
3.4 Weighting and composite index calculation
To aggregate the multiple indicators into a single composite index of PE-teacher allocation for each school, we employed the information entropy method (also known as the entropy value method) for objective weighting. This method determines indicator weights based on the degree of variation of each indicator across schools, thereby reflecting the information each indicator contributes without subjective bias from expert judgment (Wu et al., 2022; Pliego-Martínez et al., 2024). The entropy method has advantages in educational data contexts: compared with Principal Component Analysis (PCA), the entropy method does not require orthogonal transformations of variables and is more suitable when indicators exhibit moderate multicollinearity. It has been widely applied in education resource allocation studies to derive impartial weights for composite indices (Wang and Guo, 2024; Jiang et al., 2023; Pu, 2017).
In practice, we normalized each indicator (considering whether higher values were favorable or unfavorable as indicated in Table 1) and computed the entropy value for each indicator based on its distribution across the 1,504 schools. Indicators with greater dispersion (i.e., more unequal distribution among schools) receive higher weight, under the rationale that they contribute more to differentiating the overall allocation level. The resulting weights (shown in Table 1) indicate, for example, that the additional-teachers ratio carries the largest weight (~27.07%), suggesting it is a highly differentiating factor among schools, whereas class–teacher ratio has a smaller weight (~3.83%), indicating relatively less variation or importance in the composite. We then calculated each school’s composite index as the weighted sum of its normalized indicator values. A higher composite index value represents a higher overall level of PE-teacher resource allocation (taking into account quantity, quality, etc.), while a lower value indicates a weaker allocation level. To ensure the robustness of our composite index, we note that future analyses will compare these entropy-derived weights with alternative schemes (equal weighting, PCA-derived weights). In this study, due to space constraints, we focus on the entropy-weighted index as our primary measure. In the Limitations (Section 4.3), we acknowledge this and propose to test the sensitivity of our results to different weighting methods in subsequent work.
3.5 Spatial analysis techniques
We applied several spatial analysis techniques to explore the distribution of the composite index and individual indicators:
i. GIS Mapping: We plotted the composite index values for all schools on a map of Xi’an. We applied the Jenks natural breaks method (k = 5) to group the teacher composite index into five tiers—high, medium-high, medium, medium-low, and low—solely for visualization and descriptive counts. Jenks determines breakpoints from the data distribution, minimizing within-class variance and highlighting meaningful differences (Wu and Li, 2013). The choice of k = 5 follows cartographic guidance (4–7 classes for large, skewed datasets; here 1,504 schools) and ensures comparability across maps (Slocum et al., 2009). This classification does not affect inferential analyses (Global/Local Moran’s I, Kriging), which use the continuous index. Tests with k = 4 or k = 6 produced the same spatial patterns, differing only in display granularity (Brewer and Pickle, 2002). To characterize the continuous spatial distribution of teacher levels, we apply the ordinary Kriging interpolation method to the discrete school point data to generate a continuous spatial distribution map of the teacher allocation index. This method reveals the gradient and trend of resource levels with spatial location and helps to identify potential patterns of spatial heterogeneity (Liu et al., 2019).
ii. Global Spatial Autocorrelation (Global Moran’s I): We calculated the Global Moran’s I for the composite index to test whether high or low values are spatially clustered across Xi’an. Moran’s I ranges from −1 (perfect dispersion) to +1 (perfect clustering), with 0 indicating random spatial pattern. The statistic was computed with a binary spatial weights matrix based on school locations (we used an inverse-distance weighting with a threshold distance that ensures each school has at least one neighbor, effectively capturing local neighborhoods). A permutation test with 999 random shuffles was used to assess significance. This test asks: is the observed clustering of similar values (high with high, low with low) greater than would be expected by chance? A statistically significant Moran’s I (positive) would indicate spatial clustering of the composite index across schools.
iii. Local Spatial Autocorrelation (LISA): To identify where clusters or outliers occur, we performed Local Moran’s I (Anselin’s LISA) for the composite index and each indicator. LISA highlights four categories of local spatial association: high–high clusters (H–H, a school with high value surrounded by high values), low–low clusters (L–L), and spatial outliers of two types: high–low (H–L, a high-value school surrounded by lower values) and low–high (L–H, a low-value school in a high-value context). We mapped these LISA results (with a significance threshold of p < 0.05 for local Moran’s I; we note that multiple comparisons in LISA were addressed by applying a False Discovery Rate correction, as recommended, to control for Type I error). Schools not belonging to any significant cluster/outlier category were labeled “Not significant.” The LISA maps (Figures 1a–g) allow us to pinpoint specific areas of concern, such as clusters of under-resourced schools (L–L) or isolated “bright spots” (H–L outliers) that might serve as local exemplars (Liu et al., 2019).
iv. Statistical tests for group differences: We compared the composite index between urban core districts and outlying districts using a two-sample t-test.
Figure 1. Spatial LISA map of PE-teacher allocation in schools indicator in Xi’an (a) Student-teacher ratio, (b) Class-teacher ratio, (c) Full-time teacher ratio, (d) Ratio of teachers attending training, (e) Ratio of additional teachers, (f) Ratio of teacher vacancies, and (g) Ratio of outstanding teachers.
This tested the hypothesis (H2) that mean allocation levels are higher in central urban areas than in suburban/rural areas. We found a significant difference (as reported in Section 3.3), with central districts on average having a higher composite index than peripheral districts (p < 0.001, 95% confidence interval of the difference not crossing zero). This provides a simple inferential check on the urban–rural disparity. We also conducted proportion tests on the LISA outcomes (e.g., comparing the proportion of schools in significant clusters between core and periphery) to further quantify disparities. All analyses were conducted using SPSS 26.0 and ArcGIS 10.3. Spatial significance tests (Global Moran’s I and LISA) were implemented in ArcGIS 10.3’s Spatial Statistics toolbox, and results were mapped for visualization. Where significance is stated, it refers to a 5% significance level unless otherwise noted.
4 Results
4.1 Overall spatial pattern of PE-teacher allocation
Using the Jenks natural breaks classification (k = 5) on the composite index for 1,504 schools and the ordinary Kriging surface for visualization (Figures 2, 3), we observe a clear center–periphery gradient. The urban core (e.g., Yanta, Weiyang, Beilin, Xincheng) concentrates high PE-teacher resource levels, while outlying districts/counties (e.g., Lantian, Zhouzhi, Huyi) are predominantly low. This “strong center—weak periphery” pattern likely reflects place-based factors such as district funding capacity, transport accessibility, and job attractiveness.
Figure 2. Geographic location of primary and secondary schools in Xi’an.
Figure 3. Kriging interpolation of the PE-teacher allocation index in Xi’an.
Quantitatively, the central districts have a significantly higher composite index than the periphery (two-sample t-test, p < 0.001), supporting H2. Global spatial autocorrelation is moderately positive: Moran’s I = 0.268 (Z = 5.079, p < 0.01), confirming that schools with similar allocation levels cluster together (high with high, low with low), consistent with H1. In practice, this implies contiguous advantaged and disadvantaged zones rather than a random mosaic.
Citywide, the overall level is medium–high: 627 schools (41.7%) exceed the city mean. By class share, high-value schools account for 3.4% (51) and medium-high for 16.4% (246)—both concentrated in the six core districts (Yanta, Weiyang, Baqiao, Beilin, Xincheng, Lianhu). Medium schools comprise 24.5% (368) and are more dispersed, especially in urban–rural interfaces (e.g., Chang’an, Lintong). The combined medium-low + low group is 55.8% (839), concentrated in remote districts/counties, with a few weak pockets persisting even at the fringe of core districts (e.g., parts of Yanta, Lianhu).
To benchmark these shares against non-spatial baselines, one-sample proportion tests show the high-value share (51/1,504 = 3.39%) is well below both a five-class equal-probability baseline (p₀ = 0.20; z = −16.10, p < 10−15) and a “top-decile” baseline (p₀ = 0.10; z = −8.54, p < 10−15). For transparency, the medium-high share (246/1,504 = 16.36%) is below 0.20 (p = 0.0004), the medium share (368/1,504 = 24.47%) exceeds 0.20 (p = 1.5 × 10⁻⁵), and medium-low + low (839/1,504 = 55.78%) exceeds the lower-two-class baseline of 0.40 (p < 10−15). These tests are descriptive checks; all spatial inferences are based on the continuous composite index.
In sum, Figures 2, 3 jointly depict a city with central agglomeration of high resources and peripheral concentration of shortfalls, corroborated by both mean differences (H2) and global clustering (H1). This provides a clear diagnostic baseline for the local-cluster analysis that follows.
4.2 Local clusters and hotspots (LISA results)
To identify specific locales of concern, we turn to the Local Moran’s I (LISA) analysis for the composite index. The LISA map (Figure 4) classifies each school into cluster/outlier categories. We found distinct high–high (H–H) clusters in the central city and along major development corridors, and extensive low–low (L–L) clusters in the remote periphery, with a minority of mixed outliers (H–L and L–H). In total, 321 schools fall into H–H clusters and 302 into L–L clusters, while 76 are H–L outliers and 250 are L–H outliers (the remaining ~555 schools show no significant local autocorrelation).
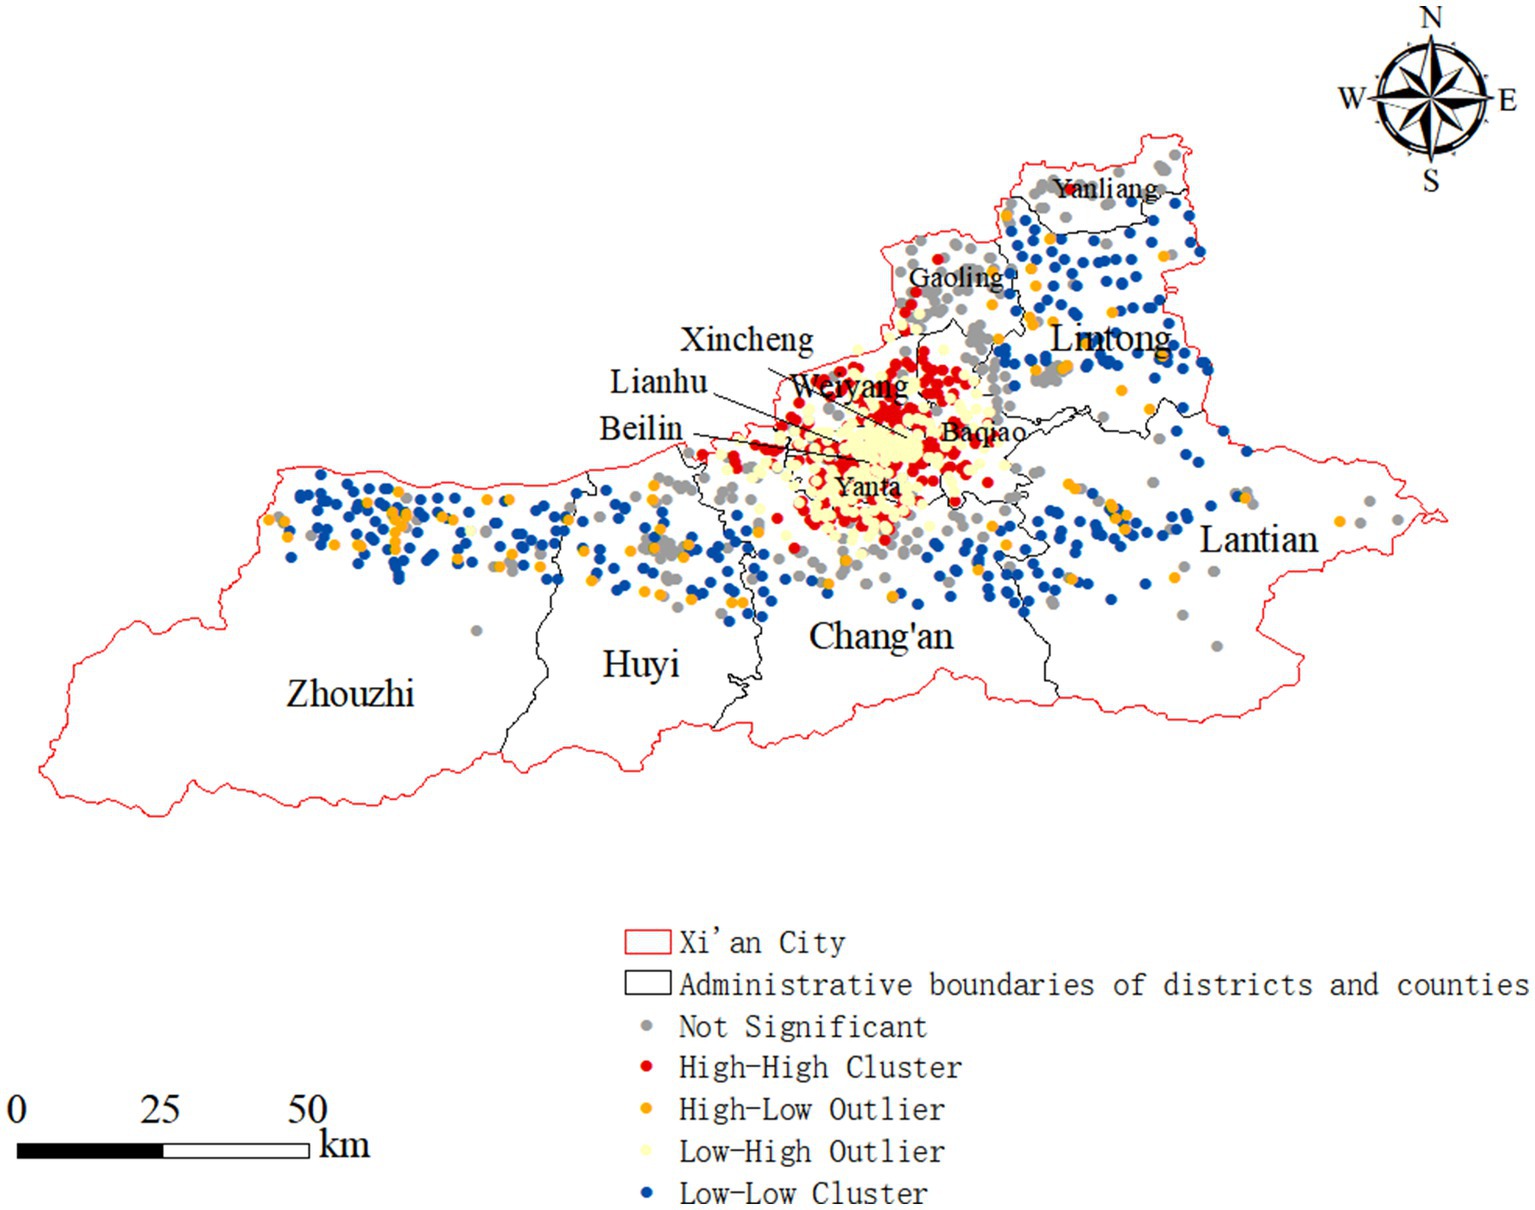
Figure 4. Spatial LISA map of physical education teacher allocation in schools in Xi’an, China.
The H–H clusters are predominantly located in Xi’an’s core urban area and adjacent well-developed suburbs. These clusters form what can be described as “high-value corridors” radiating outwards along urban expansion axes (for instance, through Yanta, Weiyang, Beilin, and into parts of Gaoling and Baqiao that are closely linked to the city center). In these areas, a concentration of high-quality teachers and better staffing levels has been achieved, likely due to better incentives, living conditions, and policy focus. The presence of H–H clusters underscores the benefits of agglomeration: schools in these areas enjoy mutual advantages (e.g., easier sharing of best practices, more attractive postings for teachers), and the corridor effect suggests that high-resource zones can extend outward where supportive policies and development have encouraged some diffusion of resources beyond the very center.
The L–L clusters, conversely, are widely distributed in the distant suburban counties such as Zhouzhi, Huyi, and Lantian. In these clusters, neighboring schools all suffer from low levels of PE-teacher resources, reinforcing and exacerbating each other’s disadvantages. We can think of these as “resource cold spots”—large contiguous areas where students face a consistent lack of PE teachers. The L–L clustering confirms H3’s expectation that remote areas would host clusters of under-resourced schools. These clusters signal where policy intervention is most urgently needed. The fact that they are spatially extensive (covering wide areas) highlights a structural issue: entire regions are lagging due to their remoteness and historically lower investment. Within the L–L zones, basic education conditions need substantial improvement to make teaching positions more attractive and to retain staff. Importantly, we must strive to prevent these areas from becoming “sleepy zones” of education—locales where low resources lead to low performance and low demand, creating a vicious cycle of neglect.
We also identified heterogeneous clusters/outliers that provide additional insight into spatial heterogeneity. High–low (H–L) outliers—metaphorically, “islands of quality”—are schools that maintain relatively high PE-teacher resources despite being surrounded by resource-poor neighbors. We found 76 such schools, often located in urban–rural fringe zones or in areas benefiting from targeted support (e.g., a well-resourced school placed by policy in a weaker district). These H–L cases suggest that with focused investment or special programs, individual schools can break the mold of their surroundings, though they remain exceptions. They could serve as pilot centers or hubs to assist nearby L–L schools, but their presence also underscores the uneven reach of current policies.
On the other hand, low–high (L–H) outliers—“depressions” in an otherwise better-resourced sea—number 250 and occur mostly within the main urban areas. These are schools with weak PE-teacher allocation despite being in generally resource-rich districts. L–H outliers might arise due to historical factors (e.g., a formerly neglected school), administrative boundaries, or anomalies in teacher distribution (such as one school not receiving its fair share of new hires or having higher attrition). The presence of L–H pockets within cities is important: it cautions that even in well-equipped districts, equity is not automatic—some schools can fall through the cracks. Addressing L–H cases might involve intra-district reallocations or support targeted at those specific schools (such as pairing them with nearby high-resource schools for mentoring or pooling teaching resources).
In sum, the LISA results depict a bipolar spatial pattern with local exceptions: significant clusters of high and low values exist at both the center and periphery, and a patchwork of outliers reflects micro-level imbalances. This confirms H3. The co-occurrence of central H–H clusters and peripheral L–L clusters points to a widening gap, while the scattered H–L and L–H outliers highlight that within each region, there are internal disparities that blanket statistics might miss.
4.3 Indicator-specific spatial characteristics
To further illuminate the situation, we examined each indicator’s spatial distribution using Kriging interpolation (Figures 5a–g) and LISA cluster analysis (Figures 1a–g and Table 2). Each sub-indicator offers a more granular view of which aspect of PE-teacher allocation is most imbalanced and where.
i. Student–Teacher Ratio: This indicator is a proxy for teaching load (higher ratio = more students per PE teacher, implying thinner coverage). We found a steep gradient: student–teacher ratios are highest in the central urban areas and decrease toward the periphery. In central districts and expansion areas, surging student populations combined with lagging teacher expansion have led to overly high student–teacher ratios, creating “tight zones” where teachers are overstretched. Farther from the city, student density drops and teacher numbers, while lower, are relatively sufficient for the smaller student bodies, leading to much lower ratios—in some remote schools, a situation of “underutilized teacher capacity” emerges with more teachers than needed for the small enrollment. This dichotomy reflects urbanization’s effect: central schools carry heavy burdens and face teacher shortfalls, while rural schools have fewer students and sometimes excess teaching capacity. The LISA map for student–teacher ratio shows large H–H clusters in the urban core (schools with significantly high ratios clustered together) and L–L clusters in outlying areas (schools with low ratios clustered)—essentially mirroring the composite pattern for quantity dimension. These patterns suggest that urgent attention is needed in core areas to hire or reallocate teachers to reduce class loads, whereas in remote areas the focus could be on better utilizing the existing teacher capacity (possibly through consolidating classes or sharing teachers across small schools).
ii. Class–Teacher Ratio: This measures classes per PE teacher and largely parallels the student–teacher ratio spatial trend. Overall, class–teacher ratios across most of Xi’an are moderate and balanced, indicating that for many schools the number of classes per PE teacher is within reasonable bounds. However, certain areas stand out: parts of the urban core (notably the junction of central districts like Xincheng, Lianhu, Beilin) and some rapidly growing suburban zones (parts of Chang’an district) have significantly higher class–teacher ratios than their surroundings. These “spikes” often occur where student enrollment has grown quickly (due to urban redevelopment or population influx) but PE teacher staffing has not caught up, or where increased emphasis on PE (more classes or periods) wasn’t matched with hiring. Meanwhile, in some remote suburbs (e.g., Lantian) we observe low class–teacher ratios, implying a comfortable staffing situation relative to the number of classes—again an underutilization in the sense that teachers are not pressed for classes, possibly due to smaller schools or fewer class sections. The coexistence of a generally balanced citywide picture with a few high-ratio pockets suggests targeted relief is needed for those hotspots of pressure, even as overall the class allocations are not as skewed as other metrics.
iii. Full-Time Teacher Ratio: This indicator reflects the professionalism and stability of the PE teacher workforce. Spatially, it is lowest in the outermost districts, indicating that remote schools struggle to staff full-time PE specialists. In peripheral areas, a higher share of PE teaching may be done by part-time or homeroom teachers, reflecting difficulty in recruiting or retaining dedicated PE staff. Conversely, the full-time ratio is highest in urban districts where working conditions and career prospects are better, meaning students there are more likely to be taught by specialist PE educators. The LISA analysis shows few large clusters (the distribution is somewhat heterogeneous), but we do see a tendency for L–L clusters (low full-time share) in marginal areas. This pattern underlines a policy concern: improving professionalization outside the city core might require incentives (e.g., rural bonuses, housing support, clear promotion pathways) to encourage teachers to take up and remain in full-time PE roles in those communities.
iv. Training Participation Ratio: Continuing professional development (CPD) is crucial for keeping teachers effective. We found a pronounced urban–rural gap: training participation rates are highest in the city and drop off in remote suburbs. Urban teachers have more access to workshops, seminars, and support for further training, whereas rural teachers face barriers (distance, information, funding) to attending training. The LISA results highlight H–H clusters of high training participation in the urban core (signifying a culture and availability of CPD in those districts) and L–L clusters in outlying counties where very few teachers regularly attend training. This gap is worrying because it means professional growth opportunities are unequally distributed, potentially widening the quality gap. Strategies such as mobile training teams, online training modules, or designated training centers in rural areas could be necessary to boost the CPD rates in low-participation regions.
v. Additional-Teachers Ratio: This indicator shows how actively schools (or districts) are adding new PE teachers. Interestingly, the spatial pattern here differs from the others: the urban core shows a low additional-teacher ratio, while certain peri-urban districts show higher values. In fact, we did not find a large H–H cluster in the city center for this metric; rather, there are many schools in the core with no recent hires (hence low values), whereas on the urban fringe there are pockets where new hiring is relatively higher (perhaps due to expansion of new schools or specific programs). Remote suburbs, however, have extremely low additional-teacher ratios, indicating very little influx of new teachers. This creates a concentric imbalance: the established urban schools are often staffed with older, existing faculty (and may face stagnation or future retirement issues without new hires), near-suburban areas might be getting more new teachers (possibly through district transfers or new school openings), and the far outskirts are being left behind in hiring. We observed numerous L–L clusters of low hiring in the periphery and several L–H outliers in areas that “should” have more hiring but do not—these appear as “depressions” where expected growth in teacher numbers has not materialized. Meanwhile, H–L outliers (isolated high-hiring schools) are extremely rare, indicating that any school that manages to hire many new teachers is usually in an environment where many others are too (likely a reflection of district-level hiring drives). These findings suggest that teacher recruitment efforts have not been uniform: central urban districts might need to ramp up hiring to replace aging staff (despite currently better ratios, they risk future shortages), and remote districts desperately need new hiring initiatives (perhaps via centralized deployments or incentives for new graduates).
vi. Teacher Vacancies Ratio: This measures the percentage of unfilled PE teacher posts. Spatially, we found that most central and suburban districts have relatively low vacancy ratios, meaning they have filled the majority of their allocated PE teacher positions. Indeed, 598 schools (a large majority of significant cases) fell into L–L clusters for vacancies, concentrated in the main urban area. This suggests that within the city, the issue is not so much vacant posts (most positions are filled) but possibly that the allocated number of posts itself might be insufficient for the student load. As one moves to the fringes, especially westward towards Zhouzhi and Huyi, we start seeing H–H clusters where larger vacancy ratios appear, indicating real teacher shortages in those locales. There were 139 schools in H–H clusters for vacancies—not a very large number—implying that extremely high vacancy hotspots are relatively limited. Importantly, we did not see a contiguous giant “vacancy belt”; instead, the high vacancies are in pockets. Overall, Xi’an does not suffer a citywide rampant problem of unfilled posts (which is somewhat positive news), but the pockets of high vacancies in outlying areas are serious for those communities. These patterns suggest focusing on targeted recruitment or secondment to the specific districts where vacancies persist, rather than a blanket hiring policy.
vii. Outstanding-Teachers Ratio: This reflects the distribution of recognized excellent PE teachers. We found that more than 70% of schools showed no significant clustering in this metric—indicating a broad “neutral” distribution. In other words, exceptional teachers (as officially recognized) are somewhat spread out. There is no large contiguous “high-quality teacher hub,” nor an enormous zone entirely devoid of outstanding teachers. However, we do observe that the small clusters of high outstanding-teacher ratios are almost entirely within the main urban districts, while the few clusters of low outstanding-teacher ratios lie in the peripheral areas of Lintong, Zhouzhi, Lantian, and parts of Chang’an. This aligns with intuition: urban schools, benefiting from better resources and professional networks, are more likely to have teachers who achieve advanced recognition; rural schools have fewer such accolades. Yet the fact that this indicator did not produce large significant clusters suggests some degree of balance—likely because educational authorities have rotated or recognized teachers across different areas to some extent. The take-away is that while outstanding PE teachers are disproportionately found in urban settings, the imbalance is not as geographically entrenched as, say, the training participation or full-time ratios. Efforts could be made to encourage and recognize excellent teachers in rural schools (e.g., through incentive programs or special awards for those who serve in tough locations) to boost morale and retention there.

Figure 5. Kriging interpolation of PE-teacher allocation in schools in Xi’an (a) Student-teacher ratio, (b) Class-teacher ratio, (c) Ratio of full-time teachers, (d) Ratio of teachers attending training, (e) Ratio of additional teachers, (f) Ratio of teacher vacancies, and (g) Ratio of outstanding teachers.
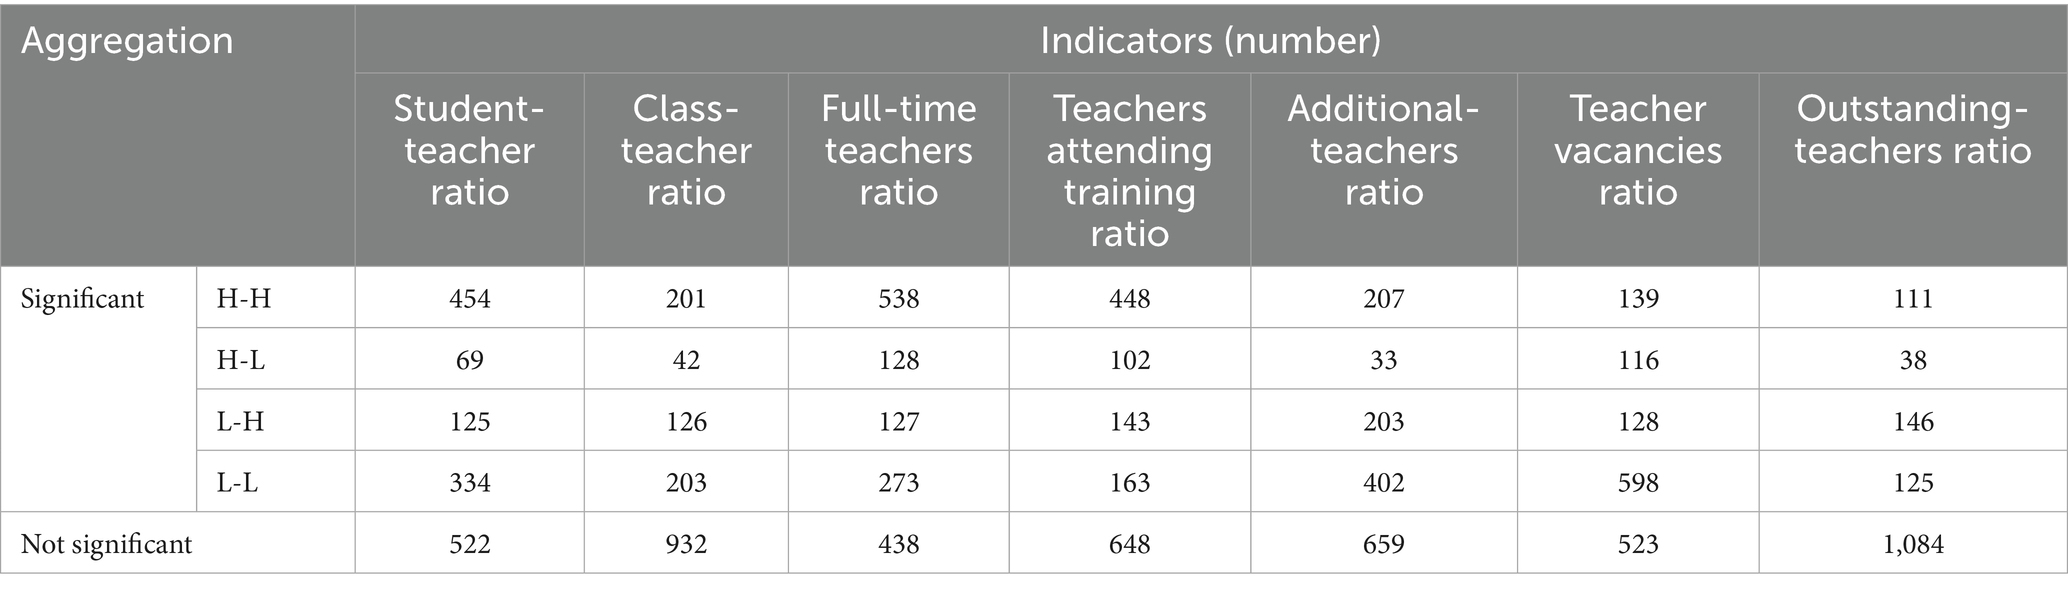
Table 2. Local Moran analysis of PE-teacher allocation in schools in Xi’an.
In summary, the spatial analysis of individual indicators highlights the multifaceted nature of the imbalance. Xi’an’s center–periphery divide is most acute in quantitative burden measures (student and class ratios) and in professional development access (training ratio), while the distribution of formal teacher accolades is somewhat more balanced. The urban core faces issues of overload (high student and class ratios) but generally has better qualifications and CPD, whereas the rural periphery faces issues of under-staffing and under-professionalization (high vacancies, low full-time and training rates) but has lighter current loads in some schools (low student ratios where enrollment is sparse). These nuances indicate that policy responses must be indicator-specific: for example, reduce overload in urban schools by adding positions and encourage utilization in rural schools by consolidating resources and improving teacher roles (Ahmadi et al., 2023).
5 Discussion
5.1 Main findings
This study revealed significant spatial differentiation in the allocation of school PE teachers in Xi’an’s basic education system. In addressing our research questions, we found:
First, the overall spatial pattern is one of “strong center—weak periphery.” Urban core districts (e.g., Yanta, Weiyang, Beilin) concentrate a large share of high-quality PE teachers thanks to economic advantages and policy support, forming distinct areas of concentrated high teacher resource levels. In contrast, distant suburban counties (e.g., Lantian, Zhouzhi, Huyi) suffer long-term shortages of PE teachers; most schools there have low resource levels, exemplifying severe polarization in educational resource allocation. The urban–rural gap is obvious and quantitatively confirmed by significantly higher composite indices in urban schools than rural ones.
Second, there is significant spatial clustering of PE-teacher allocation levels. High-resource schools and low-resource schools each tend to cluster together rather than being randomly dispersed. In the main urban area and along development axes, we identified high–high (H–H) clusters where well-resourced schools are contiguous, forming corridors of excellence. Conversely, in remote suburbs we found extensive low–low (L–L) clusters—groups of neighboring schools all suffering from teacher shortages. We also observed mixed clusters at the margins: “high–low” (H–L) heterogeneous zones (a few quality-rich schools standing like islands amid low-resource neighbors) in urban–rural transition areas, and “low–high” (L–H) zones within the main city (isolated weak schools surrounded by generally strong schools). Overall, Xi’an exhibits a “bipolar” spatial pattern with prominent regional disparities—well-endowed clusters in both core and (to a lesser extent) some suburban pockets, and poorly endowed clusters mainly in the periphery—alongside micro-level anomalies as noted. This answers our second question: spatial clustering is present, characterized by core-periphery polarization with notable cluster types (supporting H1 and H3).
Third, the spatial distributions of the individual indicators are uneven, each offering insights into specific challenges:
i. Student–Teacher Ratio: High in central urban areas (heavy teaching burdens), low in remote areas (underutilized capacity). This indicates urban schools are overcrowded relative to PE staff, whereas rural schools have smaller classes but perhaps excess teacher capacity for their size.
ii. Class–Teacher Ratio: Generally balanced citywide, but elevated in certain fast-growing suburban pockets (indicating high pressure on teachers where student numbers surged). Some remote districts show very low class loads per teacher, reflecting sufficient staffing for current class counts.
iii. Full-Time Teacher Ratio: Lower in outlying areas, which reflects the difficulty of retaining professional, dedicated PE teachers in remote schools. Urban schools have a higher proportion of full-time PE staff, pointing to more stable professional teams in the city.
iv. Teachers Attending Training: Highest in urban districts, lowest in remote suburbs. This highlights an urban–rural gap in access to and participation in professional development opportunities.
v. Additional-Teachers Ratio: Lower in the city core, higher in some peri-urban areas, and extremely low in remote suburbs. This pattern suggests that new hiring has been focused on expanding suburban districts, while the established urban schools saw less recent hiring, and the most remote areas saw almost none. The result is a concentric imbalance in staff renewal.
vi. Teacher Vacancies Ratio: Elevated in certain remote “corridors” and fringes, but generally low in most urban and suburban districts. This means acute teacher shortages (unfilled posts) are concentrated in a few outlying areas; most of the city manages to fill its authorized PE teacher positions.
vii. Outstanding-Teachers Ratio: Urban and some suburban areas have a higher concentration of award-winning teachers, whereas remote areas show broad zones of low values (few or no recognized outstanding teachers). These appear as “depressions” of quality in the periphery. However, there is not a large contiguous urban block of only outstanding teachers—it’s more sprinkled—indicating some efforts at distribution of talent.
Synthesizing these: the disparities largely stem from differences in regional economic bases and policy support. The main urban districts, with stronger economies and better incentives, can attract and retain excellent PE teachers, leading to higher professionalization and quality. Remote areas, with weaker economies and harsher working environments, face challenges in recruiting and keeping teachers, resulting in persistent shortfalls in both quantity and quality. Thus, spatial inequality in PE-teacher allocation is both a cause and consequence of broader socioeconomic disparities.
6 Policy implications and recommendations
The spatial evidence from Xi’an—a pronounced center–periphery gradient with entrenched H–H clusters in urban cores and L–L clusters in remote counties—carries clear policy implications for achieving a balanced distribution of PE-teacher resources.
Short-term (immediate relief for shortages): Targeted deployment to acute shortage areas. The first priority is to alleviate the most glaring deficits in the low–low clusters. Remote suburban districts like Lantian, Zhouzhi, and Huyi (identified as having many schools in L–L clusters) should receive additional PE teachers through special initiatives. This could involve expanding the establishment (authorized staffing) quotas for those districts and conducting dedicated recruitment drives or transfers to fill vacant posts. Offering financial or housing incentives (e.g., rural hardship allowances, subsidized accommodations) can encourage teachers to take up positions in these areas. The goal for the short term (within the next academic year) should be to fill all vacant PE teacher posts in these high-need districts and reduce the vacancy ratio significantly (for example, by 30% from the 2024 baseline within 12 months). Rapid deployment will also help immediately reduce excessive student–teacher ratios and teaching loads in those schools, thereby improving class quality and safety.
Medium-term (building capacity and retention): Strengthen professionalization and support in disadvantaged areas. It is not enough to simply place teachers in remote schools; we must ensure they stay and continue to grow. Over the next 2–3 years, we recommend scaling up professional development and exchange programs targeted at the L–L cluster regions. This includes expanding distance and mobile CPD offerings so that teachers in rural schools can regularly participate in training without traveling far. Additionally, optimizing teacher mobility mechanisms can help: for instance, establish urban-to-rural teacher rotation programs or “twinning” arrangements where a high-resource urban school is paired with a rural school. Through these programs, experienced urban PE teachers could spend a semester in a rural school (with incentives and recognition for doing so), or rural teachers could shadow and train in urban schools for certain periods. Such exchanges would transfer expertise and break the isolation of rural teachers. Furthermore, we should empower secondary “hub” districts (like Baqiao or Weiyang, which are between the core and periphery) to lift surrounding areas—for example, by allocating them additional itinerant PE teachers or resources that can be shared with neighboring low-resource schools. The medium-term targets could include measurable improvements such as raising the full-time teacher ratio and training participation in currently lagging districts by, say, 5–10 percentage points, and ensuring every rural school’s PE program is supported either by an on-site qualified teacher or a shared specialist.
Long-term (systemic integration and pipeline development): Institutional reforms for urban–rural integration of teacher systems. The ultimate solution lies in reducing the systemic divides. Over a 5 + year horizon, Xi’an (and similar cities) should work toward integrating the urban and rural teacher management systems. This means aligning policies so that regardless of location, PE teachers have comparable salary scales, promotion pathways, and working conditions. For instance, unify post management and evaluation criteria across urban and rural schools, so that a “PE teacher I” or “senior teacher” designation means the same and is equally attainable anywhere. Implement a “Rural Teacher Orientation and Training Program” to recruit new PE teachers specifically for rural postings, possibly offering tuition waivers or stipends for teacher college students who commit to serving in a rural school for a number of years after graduation. Alongside this, establish structured rotation requirements: for example, require that to attain a senior professional title, a PE teacher must have a year of experience in a rural or disadvantaged school (with appropriate support). Such measures would gradually erode the urban–rural divide by normalizing the flow of talent. We acknowledge that our study is descriptive, not causal; however, the patterns observed suggest a hypothesis that reducing inter-district disparities in treatment would mitigate the clustering of H–H and L–L we found. We encourage the education bureau to pilot these reforms in phases, with rigorous evaluation (e.g., a quasi-experimental design where some districts implement changes earlier and outcomes are compared).
To guide these efforts, we propose a GIS-enabled monitoring and early-warning system. By continuously updating the composite index and cluster analysis on an annual basis, policymakers can visually track whether the inequities are narrowing. Key performance indicators (KPIs) aligned with our study’s metrics should be used as yardsticks. For example:
Vacancy rate: Reduce the citywide PE teacher vacancy ratio by 30% in 1 year (and specifically aim for <5% vacancy in each high-need district).
Student–teacher ratio: Within 2 years, lower the average student–PE teacher ratio in central districts by 10%, and ensure no district has a ratio above a set threshold (e.g., 25:1).
Full-time teacher share: Increase the proportion of full-time PE teachers in the overall workforce by at least 8 percentage points in 2 years (with priority on raising this in low-share districts).
Training participation: Ensure that each PE teacher gets at least 40 h of CPD per year (including a module on injury prevention/movement science, as suggested by UNESCO guidelines). Aim for 80% of teachers citywide to meet this within 1 year, and 100% within 2 years.
Outstanding teachers and retention: Strive to increase the number of recognized outstanding PE teachers in currently underrepresented districts (perhaps by introducing local award programs or mentoring that leads to recognition). Additionally, track retention: aim for at least 85% one-year retention and 70% three-year retention of newly placed teachers in disadvantaged schools. Monitor the median time required to fill a PE vacancy, targeting it to be under 60 days by year 2.
These targets (which are illustrative and should be refined with baseline data) make the recommendations concrete and testable. They create accountability and allow mid-course corrections if, for instance, a certain pilot policy is not achieving the desired reduction in L–L cluster size or intensity (which can be checked via annual Local Moran’s I maps).
Beyond the educational metrics, we should not overlook cultural and social implications. Equitable distribution of PE teachers is not only an education policy matter but also a lever for cultural change. School sports programs shape norms of fair play, inclusion, community identity, and student well-being from an early age. At the macro level, sports can catalyze cultural transformation—Al-marri et al. (2025) show how hosting mega-sport events like the FIFA World Cup can reshape social practices and openness across nations. By analogy, at the school level, ensuring fair access to qualified PE teachers in historically underserved communities can help seed a culture of participation, teamwork, and health in those areas. Over time, this can strengthen social cohesion and reduce feelings of exclusion. In short, achieving equity in PE staffing has benefits that transcend test scores or fitness levels: it is an investment in social capital and community development. Equitable PE opportunities can foster talent in sports, improve public health, and even serve as a point of pride and unity in communities. Therefore, the push for balanced PE-teacher allocation should be seen as both an educational imperative and part of a broader social policy for long-run inclusion and civic engagement.
7 Limitations and future research
While this study provides a comprehensive spatial diagnosis of PE-teacher allocation in one major Chinese city, several limitations must be acknowledged:
External validity and scope: Our analysis is confined to a single city (Xi’an) and one time point (2024). Xi’an, as a northwestern Chinese city with a monocentric urban structure and significant urban–rural contrast, offers a useful case, but caution is needed in generalizing nationally. Cities in other regions (East, Central, Northeast China) have different fiscal capacities, population dynamics, and education policies. Thus, the specific patterns (e.g., the exact Moran’s I value or cluster locations) are context-bound. To improve generalizability, future research should conduct multi-city studies. A comparative analysis across cities of different sizes and development levels could reveal whether the center–periphery disparity observed in Xi’an is ubiquitous or if other spatial patterns emerge (e.g., multi-core patterns in polycentric cities). Such work could stratify cities by GDP per capita or urbanization rate and examine how spatial teacher allocation correlates with those factors. We plan to replicate our methodology in a selection of cities across eastern, central, and western China, which will also allow a form of meta-analysis of Global Moran’s I and cluster prevalence across contexts.
Weighting robustness: We relied on the entropy method for weighting the composite index. Although this approach is objective, it is not the only method. We did not formally test alternative weighting schemes like equal weighting or PCA-based weights in this paper. It is possible that different weights could slightly alter the composite index values and thus the spatial patterns (though core insights likely remain). Future work will include a sensitivity analysis: recomputing the composite index under equal weights, PCA-derived weights, or even expert-determined weights, and then assessing rank correlations and cluster robustness. If the identification of which schools or districts are “most disadvantaged” is sensitive to the weighting, that will be reported and policy conclusions will be adjusted to emphasize stable patterns (e.g., schools that rank poorly under any reasonable weighting).
Spatial autocorrelation inference: Our Global Moran’s I significance was assessed by permutation, and local Moran’s I (LISA) significance was considered at p < 0.05 without stringent multiple comparisons correction. This raises the risk of false positives in local clusters. While we did mention applying an FDR (False Discovery Rate) correction conceptually for LISA, we did not present the adjusted q-values here. In future analyses (or an appendix), we will include Benjamini–Hochberg adjusted significance for the local Moran results to ensure we highlight only the most robust clusters. Moreover, we will report confidence envelopes for Global Moran’s I (via bootstrapping or additional permutations) to give a sense of variability. For this study’s main findings, we are reasonably confident given the large Z-score for Moran’s I, but adding those robustness checks will strengthen the inference.
Kriging validation: The Kriging-generated maps were used descriptively to visualize gradients; we did not rigorously validate the Kriging predictions in this paper. There is a possibility of interpolation error or that some patterns in the Kriging map are artifacts of the model assumptions. We intend to perform formal cross-validation (e.g., leave-one-out cross-validation and perhaps spatially blocked 5-fold cross-validation) of the Kriging for each indicator. By calculating metrics like mean absolute error (MAE), root mean square error (RMSE), and checking if standardized prediction errors approach 0 mean and unit variance, we can judge the Kriging model’s fitness. If needed, we will adjust the variogram models or switch to a different interpolation method. For now, the interpolations are used cautiously—mainly to guide visual intuition rather than for exact estimates at unsampled locations.
Study design and causality: Our study is cross-sectional and focuses on describing the current spatial allocation pattern. We cannot make strong claims about causal determinants of why certain areas have more teachers and others less. Factors such as district funding, local policies, housing costs, and geography likely interact. While we propose policy measures, these should be viewed as informed hypotheses to be tested. Future research should incorporate multivariate models and longitudinal data to better understand causation. For example, a multilevel regression with schools nested in districts could include predictors like school size, district socioeconomic status, and distance from urban center to see which are significantly associated with teacher allocation levels. Spatial lag or spatial error terms could be added to such models to account for spatial dependence. Additionally, if policy changes occur (e.g., a new incentive for rural teachers), quasi-experimental designs like difference-in-differences or synthetic control could be used to evaluate their impacts on the allocation pattern. We have suggested pilot interventions with built-in evaluations in our recommendations, precisely so that future studies (by us or others) can assess causally whether those interventions reduce spatial inequity (e.g., does a housing subsidy program significantly increase the retention of teachers in L–L clusters compared to a control group without such a program?). Over time, assembling longitudinal data (e.g., 2019–2027 panel) will allow us to see trends—hopefully a convergence if policies are effective—and apply models that account for lagged effects and spatial spillovers (e.g., spatial panel models).
Generalizability beyond education: Finally, a note on broader implications—while our focus is on PE teachers, the spatial analytical approach here could be applied to other subjects (e.g., science teachers) or other resources (facilities, funding). Xi’an’s case might reflect a broader principle in resource geography: core areas accumulate advantages, peripheries accumulate disadvantages, absent countervailing policy. Testing our approach on different types of teacher allocations or in different sectors (healthcare personnel distribution, for instance) could be a fruitful avenue to see commonalities and differences.
7.1 Scope of inference and transferability
It is also important to consider where our findings likely do or do not apply. Xi’an is a monocentric city with a significant administrative and economic center. Thus, the pattern we observe—strong core, weak periphery—is likely to be informative for other Chinese cities with similar monocentric layouts and moderate administrative capacity (especially in the Northwest region). For example, other provincial capitals or major cities in western China with one dominant urban center might exhibit similar clustering of resources in the center and scarcities on the fringe. However, in highly developed metropolitan areas or those with multiple centers (polycentric cities), the pattern could differ. Coastal mega-cities might have more resources overall and possibly multiple “high clusters” spread across various districts (due to multiple urban cores). Our study should thus be interpreted in context: it offers a detailed examination of one city’s spatial inequity, serving as a benchmark and methodology reference, rather than a universal description.
Future multi-city research should explicitly examine how city characteristics mediate spatial allocation patterns. We plan to select cities in eastern, central, and western China, across different economic tiers, and apply the same index and spatial analysis. We will use stratified sampling of cities by GDP per capita, urbanization rate, and fiscal education expenditure. This will enable an analysis of whether, for instance, wealthier cities have less pronounced L–L clusters (perhaps they can afford more even distribution) or whether certain governance models (e.g., municipalities that rotate teachers aggressively) result in different Moran’s I or cluster patterns. A meta-analysis of these results could produce generalizable insights and potentially inform national policy (e.g., identifying the most inequitable regions in need of funding or the best practices from cities that achieved more balance).
8 Conclusion
This research provided a spatial perspective on the allocation of PE teachers in Xi’an, revealing stark center–periphery disparities and highlighting critical clusters of need. By applying a sports geography lens and robust spatial analytics, we demonstrated how geographic inequities in educational resources can be quantified and visualized. The findings underscore that where a student attends school in Xi’an markedly influences their access to qualified PE teachers—an equity issue with educational and broader social implications.
On the practical front, the study offers a diagnostic baseline for Xi’an’s education authorities: specific districts and schools were pinpointed for urgent intervention, and a suite of recommendations (from immediate deployments to long-term systemic reforms) was proposed to move toward a fairer allocation. We integrated insights from recent research—including the importance of physical activity for student development and frameworks like sports geography and motivational theory to ensure that the recommendations are grounded in both empirical evidence and theoretical understanding. Implementing these measures, accompanied by clear KPIs and continuous spatial monitoring, can enable policymakers to track progress toward equity.
Looking ahead, bridging the urban–rural gap in PE-teacher allocation is not just about numbers; it represents a commitment to equitable education and well-being for all students. As China advances education modernization and promotes “health first” for youth, addressing these spatial inequities will be essential. Future research and policy efforts, informed by spatial diagnostics like ours, should work hand in hand: experiments in policy can be evaluated by spatial outcomes, and spatial analyses can guide where to experiment. Such an iterative approach will contribute to the ultimate goalthat every child, regardless of their geographic location, has access to quality physical education and the myriad benefits it confers.
Data availability statement
The original contributions presented in the study are included in the article/Supplementary material, further inquiries can be directed to the corresponding author.
Author contributions
CX: Writing – original draft. BS: Writing – review & editing.
Funding
The author(s) declare that financial support was received for the research and/or publication of this article. This study was supported by Chinese funding sources: Social Science Foundation Project of China: Innovative Path of Harmonious Coexistence of Stadium Construction and Ecological Civilization (Grant No. 19BTY084) – This project supported the conceptual design and funded the publication of this study. Philosophy and Social Science Foundation of Shaanxi Province (China): Research on the Current Situation of Sports Resource Allocation and Development Path of Basic Education Schools in Shaanxi Province (Grant No. 2025QN0518) – This project supported data collection and analysis. Scientific Research Program of the Shaanxi Provincial Department of Education (China): Research on the Spatiotemporal Characteristics and Influencing Factors of Physical Education Resources in Shaanxi Province (Grant No. 24JK0111) – This project contributed to the research framework design. All funding information and grant numbers are correct, and all funders are based in China.
Conflict of interest
The authors declare that the research was conducted in the absence of any commercial or financial relationships that could be construed as a potential conflict of interest.
Generative AI statement
The authors declare that no Gen AI was used in the creation of this manuscript.
Any alternative text (alt text) provided alongside figures in this article has been generated by Frontiers with the support of artificial intelligence and reasonable efforts have been made to ensure accuracy, including review by the authors wherever possible. If you identify any issues, please contact us.
Publisher’s note
All claims expressed in this article are solely those of the authors and do not necessarily represent those of their affiliated organizations, or those of the publisher, the editors and the reviewers. Any product that may be evaluated in this article, or claim that may be made by its manufacturer, is not guaranteed or endorsed by the publisher.
Supplementary material
The Supplementary material for this article can be found online at: https://www.frontiersin.org/articles/10.3389/feduc.2025.1649639/full#supplementary-material
References
Adamson, F., and Darling-Hammond, L. (2012). Funding disparities and the inequitable distribution of teachers: evaluating sources and solutions. Educ. Policy Anal. Arch. 20, 1–46. doi: 10.14507/epaa.v20n37.2012
Ahmadi, A., Noetel, M., Parker, P., Ryan, R. M., Ntoumanis, N., Reeve, J., et al. (2023). A classification system for teachers’ motivational behaviors recommended in self-determination theory interventions. J. Educ. Psychol. 115, 1158–1176. doi: 10.1037/edu0000783
Al-marri, S., Alobadi, A. M., Bayrakdaroğlu, Y., Şahin, İ., Zorba, E., and Dhahbi, W. (2025). The role of sports management in youth-to-professional talent development: a quantitative analysis of strategies, transition support, and challenges in Qatari football. Baltica 38, 90–101. doi: 10.33607/baltica.v38i1.411
Álvarez-Bueno, C., Pesce, C., Cavero-Redondo, I., Sánchez-López, M., Martínez-Hortelano, J. A., and Martínez-Vizcaíno, V. (2020). The effect of physical activity interventions on children’s cognition and metacognition: a systematic review and meta-analysis. J. Am. Acad. Child Adolesc. Psychiatry 59, 337–349. doi: 10.1016/j.jaac.2019.11.011
An, Y. (2022). Health first: the sustainable development of physical education in Chinese schools. Sustainability 14:3133. doi: 10.3390/su14053133
Bailey, R. (2006). Physical education and sport in schools: a review of benefits and outcomes. J. Sch. Health 76, 397–401. doi: 10.1111/j.1746-1561.2006.00132.x
Baumgartner, M. (2022). Professional competence(s) of physical education teachers: terms, traditions, modelling and perspectives. Germ. J. Exerc. Sport Res. 52, 550–557. doi: 10.1007/s12662-022-00840-z
Brewer, C. A., and Pickle, L. (2002). Evaluation of methods for classifying epidemiological data on choropleth map series. Ann. Assoc. Am. Geogr. 92, 662–681. doi: 10.1111/1467-8306.00310
De Bosscher, V., Shibli, S., Westerbeek, H., and van Bottenburg, M. (2015). Successful elite sport policies: An international comparison of the sports policy factors leading to international sporting success (SPLISS 2.0) in 15 nations. Maidenhead: Meyer & Meyer Sport.
Dhahbi, W., Briki, W., Heissel, A., Schega, L., Dergaa, I., Guelmami, N., et al. (2025a). Physical activity to counter age-related cognitive decline: benefits of aerobic, resistance, and combined training—a narrative review. Sports Med. Open 11, 1–22. doi: 10.1186/s40798-025-00857-2
Dhahbi, W., Materne, O., and Chamari, K. (2025b). Rethinking knee injury prevention strategies: joint-by-joint training approach paradigm versus traditional focused knee strengthening. Biol. Sport 42, 59–65. doi: 10.5114/biolsport.2025.123456
European Federation of Sport Universities and Physical Education Teachers (EFSUPIT) (2022) The importance of continuous professional training for physical education teachers. Available online at: https://www.efsupit.ro/images/stories/nr2.2022/art%2022.pdf (Accessed August 10, 2025).
Fan, H. (2019). The construction of a performance assessment system of compulsory education resource allocation in China. Educ. Sci. Res. 8, 12–16.
Fu, X., and Xi, M. (2023). Teachers' development in the context of a strong education nation. Educ. Res. 44, 115–124.
General Office of the CPC Central Committee and General Office of the State Council. (2020). Opinions on comprehensively strengthening and improving school sports work in the new era [EB/OL]. Available online at: http://www.gov.cn/zhengce/2020-10/15/content_5551609.htm (Accessed May 17, 2025).
General Office of the CPC Central Committee and General Office of the State Council. (2023). Opinions on building a quality and balanced basic public education service system [EB/OL]. Available online at: https://www.gov.cn/zhengce/2023-06/13/content_6886110.htm (Accessed May 17, 2025).
Goldring, L., and Hallinger, P. (2008). Principal leadership and school effectiveness in an era of accountability. Educ. Adm. Q. 44, 26–56.
Hardman, K., and Marshall, J. (2014). World-wide survey of school PE. Available online at: https://unesdoc.unesco.org/ark:/48223/pf0000229335.locale=zh (Accessed May 17, 2025).
Hu, X., and Yang, Y. (2014). Deeper problems and strategies of cross-school exchanges of excellent teachers. Educ. Dev. Res. 33, 50–55.
Jiang, H., Chen, Y., and Liu, Z. (2023). Spatial and temporal patterns of food production resilience in China and their influencing factors. Econ. Geogr. 43, 126–134.
Kyrgiridis, P., Michalopoulou, M., Derri, V., Aggeloussis, N., and Kioumourtzoglou, E. (2014). Development of the SETEQ-PE: a scale for self-evaluation of teaching effectiveness in physical education. Meas. Phys. Educ. Exerc. Sci. 18, 73–90. doi: 10.1080/1091367X.2013.867546
Lanzhou University Academic Affairs Office (2021) Overview of the Ministry of Education’s education monitoring indicator system. Available online at: http://jwc.lzu.edu.cn/system/_content/download.jsp?urltype=news.DownloadAttachUrl&owner=1477862753&wbfileid=3338595 (Accessed August 10, 2025).
Latino, F., Cataldi, S., Di Tore, P. A., and Schiavo, R. (2024). Physical education continuous professional development (PE CPD) and student well-being: a systematic review. Educ. Sci. 14:1199. doi: 10.3390/educsci14111199
Learning Policy Institute. (2023). Teacher shortages: What we know. Available online at: https://learningpolicyinstitute.org/product/teacher-shortages-what-we-know-policymaker (Accessed August 10, 2025).
Li, F. (2022). Deepening the reform of precision training: the road to professionalization for improving the quality and efficiency of teacher training. Chin. J. Educ. 9, 7–12.
Li, R., and Hang, Z. (2001). On the rational allocation and development of sports resources in colleges and universities. J. Nanjing Inst. Phys. Educ. Sports. 15, 29–30.
Liang, W., and Ma, C. (2021). Modelling the spatial distribution differences of compulsory education resource allocation. Complexity 2021:8342789. doi: 10.1155/2021/8342789
Liu, X., Huang, X., and Ding, Z. (2019). Spatial differences and influencing factors of informatization level of counties in the Yangtze River Economic Belt. Yangtze River Basin Resour. Environ. 28, 1262–1275.
Liu, M., Wang, R., and Kong, N. (2024). What can make up the short board of physical education teacher resources in primary and secondary schools? A multi-case analysis based on the typical practice of deepening the integration of physical education. J. Shanghai Univ. Phys. Educ. 48:100, 55–69. doi: 10.16099/j.sus.2023.09.26.0008
Liu, Y., and Wu, Z. (2021). Uneven distribution of rural physical education teachers and its impact on rural school development. Educ. Econ. 37, 45–51.
Lubans, D. R., Richards, J., Hillman, C. H., Faulkner, G., Beauchamp, M. R., Nilsson, M., et al. (2016). Physical activity for cognitive and mental health in youth: a systematic review of mechanisms. Pediatrics 138:e20161642. doi: 10.1542/peds.2016-1642
Ministry of Education of the People’s Republic of China (2014). Professional standards for physical education teachers (trial). Available online at: http://www.moe.gov.cn/srcsite/A17/moe_784/201407/t20140708_172595.html (Accessed August 10, 2025).
Ministry of Education of the People’s Republic of China (2020). Notice on further strengthening the allocation of school physical education teachers. Available online at: http://www.moe.gov.cn/srcsite/A17/moe_938/moe_947/202012/t20201228_509394.html (Accessed August 10, 2025).
Ministry of Education of the People’s Republic of China. (2022). Notice on the issuance of the Physical Education and Health Curriculum Standards (2022 Edition). Available online at: http://www.moe.gov.cn/srcsite/A26/s8001/202204/t20220421_619194.html (Accessed August 10, 2025).
Ministry of Education of the People's Republic of China (2020) Opinions on comprehensively strengthening and improving school physical education in the new era [EB/OL]. Available online at: http://www.gov.cn/zhengce/2020-10/15/content_5551609.htm (Accessed May 17, 2025).
National Board for Professional Teaching Standards (NBPTS). (2024). What is National Board Certification? Available online at: https://www.nbpts.org/national-board-certification (Accessed August 10, 2025).
OECD (2012). Equity and quality in education: Supporting disadvantaged students and schools. Paris: OECD Publishing.
Pliego-Martínez, O., Martínez-Rebollar, A., Estrada-Esquivel, H., and de la Cruz-Nicolás, E. (2024). An integrated attribute-weighting method based on PCA and entropy: case of study marginalized areas in a city. Appl. Sci. 14:2016. doi: 10.3390/app14052016
Pu, H. (2017). Research on the construction of a campus soccer sustainable development evaluation system based on the entropy value method: taking campus soccer in Sichuan Province as an example. J. Chengdu Sport Univ. 43, 115–120. 126
Sallis, J. F. (2012). Physical education's role in public health. Res. Q. Exerc. Sport 83, 125–135. doi: 10.1080/02701367.2012.10599843
SHAPE America (2019) Appropriate instructional practice guidelines for elementary school physical education. Available online at: https://www.shapeamerica.org/standards/guidelines/upload/AIP_ES.pdf (Accessed August 10, 2025).
Shi, B. (2007). Research on constructing the theoretical system of sports geography. Sports Sci. 8, 3–24.
Singh, A. S., Saliasi, E., van den Berg, V., Uijtdewilligen, L., de Groot, R. H., Jolles, J., et al. (2019). Effects of physical activity interventions on cognitive and academic performance in children and adolescents: a novel combination of a systematic review and recommendations from an expert panel. Br. J. Sports Med. 53, 640–647. doi: 10.1136/bjsports-2017-098136
Singleton, A. D., and Longley, P. A. (2015). Geodemographics, GIS and educational progression in the UK. Comput. Environ. Urban. Syst. 48, 59–67. doi: 10.1016/j.compenvurbsys.2014.05.002
Slocum, T. A., McMaster, R. B., Kessler, F. C., and Howard, H. H. (2009). Thematic cartography and Geovisualization (3rd ed.). Upper Saddle River, NJ: Pearson Prentice Hall.
Sotiriadou, P., and Shilbury, D. (2009). Athlete development models: a systematic review of the literature. Sport Manage. Rev. 12, 200–216. doi: 10.1016/j.smr.2009.04.001
Tate, W. F. (2008). Geography of opportunity: poverty, place, and educational outcomes. Educ. Res. 37, 397–411. doi: 10.3102/0013189X08326409
UNESCO (2015). Quality Physical Education (QPE): Guidelines for Policy-Makers [EB/OL]. Paris: United Nations Educational, Scientific and Cultural Organization.
UNESCO (2023). Global teacher shortage: How many more teachers are needed to achieve SDG 4? Available online at: https://www.unesco.org/en/articles/global-teacher-shortage-how-many-more-teachers-are-needed-achieve-sdg-4 (Accessed August 10, 2025).
Wang, Y. (2010). Comparative study of physical education resources in Anhui university campus. Sports Culture Guide 4, 100–103.
Wang, K., and Guo, X. (2024). China's new quality productivity level, regional differences and spatio-temporal evolution characteristics. Statist. Decis. Mak. 40, 30–36.
Wang, X., Yang, Y., and Lu, Y. (2024). The development trend of international physical education and China’s mirror. J. Wuhan Inst. Phys. Educ. 58, 1–13. 21
WHO (2018). Global Action Plan on Physical Activity 2018–2030: More Active People for a Healthier World[EB/OL]. Geneva: World Health Organization.
Wu, Z., and Li, T. (2013). Research on the spatial distribution of comprehensive performance of high-tech development zones: An analysis based on the natural breakpoint method. Statist. Inform. Forum 28, 82–88.
Wu, R. M. X., Zhang, Z. W., Yan, W. J., Fan, J. F., Gou, J. W., Liu, B., et al. (2022). A comparative analysis of the principal component analysis and entropy weight methods to establish the indexing measurement. PLoS One 17:e0262261. doi: 10.1371/journal.pone.0262261
Xue, Z. (2020). Constructing the indicator system for balanced development of teachers in county compulsory education. Educ. Econ. 36, 83–89.
Zhai, B. (2006). Balanced development of education: theory, indicators and measurement methods. Educ. Res. 3, 16–28.
Zhang, W., Hu, D., and Liu, H. (2016). Talking about the balanced development of physical education in the compulsory education stage from the perspective of discipline construction. Sports Culture Guide 3, 144–147.
Zhang, D., and Meng, J. (2011). Research on the evaluation index system of sports resources of primary and secondary schools in urban and rural areas in China. J. Shanghai Inst. Phys. Educ. 35, 1–6, 60. doi: 10.16099/j.cnki.jsus.2011.05.003
Keywords: physical education teachers, spatial allocation, educational equity, GIS analysis, sports geography
Citation: Xu C and Shi B (2025) Spatial characteristics of physical education teacher allocation in basic education: a GIS-based case study of Xi’an, China. Front. Educ. 10:1649639. doi: 10.3389/feduc.2025.1649639
Edited by:
Nasr Chalghaf, University of Gafsa, TunisiaReviewed by:
Henri Tilga, University of Tartu, EstoniaWissem Dhahbi, University of Jendouba, Tunisia
Copyright © 2025 Xu and Shi. This is an open-access article distributed under the terms of the Creative Commons Attribution License (CC BY). The use, distribution or reproduction in other forums is permitted, provided the original author(s) and the copyright owner(s) are credited and that the original publication in this journal is cited, in accordance with accepted academic practice. No use, distribution or reproduction is permitted which does not comply with these terms.
*Correspondence: Bing Shi, MTgwOTI3MTMxNjVAMTYzLmNvbQ==
†These authors have contributed equally to this work