 Xizhen Fan
 Minqiang Zhang2,3,4
- 1School of Preschool Education, Changsha Normal University, Changsha, China
- 2School of Psychology, South China Normal University, Guangzhou, China
- 3Center for Studies of Psychological Application, South China Normal University, Guangzhou, China
- 4Guangdong Key Laboratory of Mental Health and Cognitive Science, South China Normal University, Guangzhou, China
- 5School of Linguistics and Language Resources (Institute of Linguistic Sciences), Beijing Language and Culture University, Beijing, China
The traditional way to linking different forms of test typically uses common (or randomly equivalent) examinees or items. When common examinees or items are unavailable due to test properties or administrative restrictions, equating with pseudo-equivalent groups (PEG) using background information of the subjects to perform adjustment via minimum discriminant information on the non-equivalent groups has been proposed. To investigate the effectiveness of PEG equating, this study compared the results of PEG equating with those of traditional NEAT equating, using both simulated and real test data. The results indicated that the RMSE and bias generated by PEG equating were slightly larger than those of NEAT equating, while the SEE was smaller under certain simulated conditions. When the correlation between the background information used in PEG equating and the scores to be equated reached approximately 0.75, difference that matters between PEG and NEAT equating did not exceed half of a score unit. This suggests that the equating differences between PEG and NEAT would not have a significant impact, indicating that PEG equating can serve as an alternative to traditional equating designs.
1 Introduction
Equating is a statistical process that is used to adjust scores on test forms so that scores on the forms can be used interchangeably (Kolen and Brennan, 2014). The primary goal of equating for a test program is to eliminate the effects of differences in test form difficulty or examinee ability to provide score users with scores that have the same meaning (Angoff, 1971), so examinees taking different test forms will be treated equally, and scores from different forms will be interpreted properly. Therefore, equating is not only a statistical process but also a fairness concern in test practice. As an instrumental practice for many testing programs, equating plays a very important role in promoting fairness and in facilitating more accurate score reporting to stakeholders (Angoff, 1971; Chulu and Sireci, 2011).
In practice, score equating is generally accomplished by setting common (or randomly equivalent) items or examinees across different test forms, such as commonly used single group (SG) design, random groups (RG) design, or nonequivalent groups with anchor test (NEAT) design (Kolen and Brennan, 2014). However, in some cases, common items or examinees may not be possible due to the properties of the test or administrative restrictions. In such instances, other connectives that approximate the three conventional equating designs mentioned above could serve as alternatives (Baldwin and Clauser, 2022).
Linking via pseudo-equivalent groups (PEG) was one of the potential alternatives to traditional equating proposed by Haberman (2015). Instead of setting common items or examinees in different test forms, the PEG approach collects examinees’ background information such as gender, learning experience statistically related to total test scores to adjust for group difference in ability via minimum discriminant information adjustment (MDIA; Haberman, 1984; Haberman and Shelby, 2014). The basic assumption in PEG equating is that if the distribution of background information variables among different groups is the same, then the distribution of their ability scores would also be the same (Lu and Guo, 2018). Under this assumption, there are three steps to equate test scores with pseudo-equivalent groups through MDIA (Haberman, 2015).
The first step is to carry out the minimum discrimination information weighting for different groups based on the background information variables. The background information variable distribution of old Form Y will serve as the background information variable distribution for the target group. If there are only two test forms to be equated, the background means of the old form can be treated as the target background mean. That is:
where is the number of test takers on Form Y.
Each test taker on new form X is assigned a weight wiX by using the adjustment through minimum discrimination information method (MDIA; Haberman, 1984), so that weighted background vector will equal to Z. That is:
where wiX > 0 and 1.
The second step is to form test score distribution using the weights obtained from the first step and create pseudo-equivalent groups.
The third step is to conduct equating process using the traditional equivalent group linking method such as equipercentile or linear equating.
How does PEG equating work, can it be an effective alternative to traditional equating designs such as NEAT? In the pilot study of Haberman (2015), pseudo-equivalent groups were constructed through MDIA by using 16 categorical background variables and equating was performed on 29 different test forms. Results showed that PEG equating produced similar but not identical results to that of NEAT. It is suggested that when anchor test was not sufficient, PEG could be a powerful supplement to enhance the validity of linking.
After Haberman (2015), several studies explored the performance of PEG equating under different test conditions using simulation and real test data (Kim and Lu, 2018; Kim and Walker, 2022; Lu and Guo, 2015; Xi et al., 2015). Xi et al. (2015) compared PEG linking with only background variables, PEG linking with both background variables and the anchor test scores, and NEAT equating using real test data. The results indicated that PEG linking with only background variables did not yield results comparable to those of NEAT equating. However, when PEG linking was combined with both background variables and anchor test scores, it could produce results comparable to those of NEAT equating. The study concluded that the anchor test was the single effective matching variable during the PEG weighting procedure when limited background variables are available. Lu and Guo (2015) conducted a simulation study by manipulating the correlation of a single background variable with latent ability and compared the results of PEG linking with those of NEAT. They found that the PEG linking can outperform the NEAT equating when anchor tests are insufficient. However, the overly idealized simulation scenarios limited the generalizability of the results to practical applications. Kim and Lu (2018) compared PEG linking and NEAT equating using real test forms derived from a common operational assessment, with single-group equating as the criterion. Their results showed PEG outperformed NEAT in accuracy when anchor tests were short, supporting PEG as a practical alternative under anchor-deficient conditions. Lu and Guo (2018) compared PEG linking with only background variables, PEG linking with both background variables and the anchor test scores (noted as PEGAT), and NEAT equating using simulation in two equating scenarios: small and large group differences in ability. Results showed: (1) NEAT outperformed PEG in large-difference scenarios, yet PEGAT enhanced NEAT’s precision through background variable integration, PEG linking produced comparable results to NEAT in small-difference scenarios, which justifies the use of PEG linking when a good anchor test is not available, as well as the use of PEGAT when a good anchor is available but needs to be strengthened by background variables; (2) stronger background variable-test score correlations enhanced the equating efficacy of PEG and PEGAT in scenarios with small or large group ability differences.
While existing literature has provided substantial examination of the effectiveness of PEG equating, the following two deficiencies remain unresolved: (1) results from real test data studies revealed that PEG equating fails to achieve comparable performance to traditional NEAT equating (Haberman, 2015; Kim and Lu, 2018; Xi et al., 2015). From the aforementioned research findings and the fundamental assumptions of PEG linking, it is evident that the efficacy of PEG equating hinges on the correlation between the background information of examinees and the test being equated. However, it remains unclear to what extent the correlation between examinees’ background information and test scores to be equated for PEG linking with only background variables, to produce results comparable to those of conventional equating designs such as NEAT. (2) The simulation study of Lu and Guo (2018) reported equivalent results of PEG and NEAT under a scenario of small group ability difference with abilities of two groups generated from the same distribution. Such idealized conditions lack practical relevance and offer limited guidance for real test equating practices. Additionally, the simulation study employed identical test forms with no difficulty differences, which deviates from actual testing conditions. (3) Existing studies have solely adopted either empirical research or simulation research methods. None have collected evidence from both simulation and empirical perspectives simultaneously to conduct an in-depth investigation into the performance of PEG equating.
It has become increasingly common for testing programs to fail to achieve fair and reasonable comparisons of test scores because they cannot meet the equating design requirements for common items or examinees, due to test properties, administrative restrictions, or test delivery issues (Baldwin and Clauser, 2022). As an innovation that requires neither common people nor items, PEG equating with only background variables is appealing to such testing programs. Therefore, further and deeper investigations into the effectiveness of PEG equating with only background variables are necessary and urgent to provide useful and practical suggestions for application. The current study aims to explore relevant evidence on the effectiveness of PEG equating with only background variables from simulation and real data by comparing the results of PEG equating with those of NEAT design.
2 Simulation
2.1 Simulation design
Many factors may affect the outcome of PEG equating. In this study, we focused on the three most important ones: (1) the correlation between test-takers’ background information and their total test scores (ρ); (2) the difference in group abilities (Δθ); (3) the sample size (N). The three factors were manipulated as follows:
2.1.1 Correlation of test takers’ background information to total test score (ρ)
The correlation between test takers’ background information variables and test scores is one of the most critical factors influencing the results of PEG equating (Haberman, 2015; Lu and Guo, 2018). In the study by Lu and Guo (2018), the correlations of two background information variables, C and S, with the total test score were approximately 0.22 and 0.36, respectively. PEG equating that included C, S, or both C and S in the MDIA weighting resulted in larger equating errors than NEAT equating, suggesting that the correlation between background information variables and test scores should exceed 0.4 for PEG equating to yield comparable results to NEAT equating.
On the other hand, the background information variables of test takers act as a surrogate for traditional anchor tests, which, as representatives of the overall test, should have a correlation of over 0.7 to be deemed sufficient. Therefore, in this study, we set two background information variables, C and S, with correlations of 0.40 and 0.75, respectively, with test scores. By incorporating C, S, and both C and S into the MDIA weighting, we formed three PEG equating designs: PEG_C, PEG_S, and PEG_CS. These designs represent varying degrees of correlation between background information variables and the scores of tests to be equated.
2.1.2 Difference of group ability (Δθ)
Difference of group ability in this simulation was set to have two levels, 0.25 and 0.50, representing moderate and large ability differences (Sunnassee, 2011; Wang et al., 2008).
2.1.3 Sample size (N)
It is proposed that a sample size of 400 is typically required for mean equating, linear equating under the framework of Classical Test Theory (CTT) (Kolen and Brennan, 2014). Since PEG equating is typically conducted by using linear equating method (Haberman, 2015; Lu and Guo, 2018), sample size started by 400 and added two higher levels of 800 and 1,600 to explore the effect of sample size on PEG equating in this simulation. In summary, the sample sizes of participants in simulation are set at three levels: 400, 800, and 1,600.
Differences in difficulty of the forms were fixed at 0.05 (Δb = 0.05) according to real test data from a national language proficiency assessment in China. The test length for both forms X and Y was fixed at 30 (Kolen and Brennan, 2014), and the ratio of the number of common items to the total test length was simulated to be 20% in the NEAT design, so each form had 6 internal anchor items (Lord, 1980).
In summary, three simulation variables were manipulated: (1) sample size (N = 400, 800, 1,600), (2) group difference in ability (Δθ = 0.25, 0.50), and (3) correlation between background information variables and total scores of the tests to be equated (i.e., PEG_C, PEG_S, PEG_CS). Additionally, the traditional NEAT equating was used as a point of comparison, resulting in a total of four equating designs. Consequently, the simulation comprised 3 × 2 × 4 = 24 distinct simulation conditions.
2.2 Simulation process
Steps for simulation in this study were as follows:
First, the IRT latent ability (θ) distribution of population P responding to the base form Y was fixed as a normal distribution with mean 0 and standard 1, denoted as N (0, 1). For population Q responding to the new form X, two distributions were considered: N (0.25, 1) and N (0.50, 1). Item parameters for the base form Y were simulated to fit the 3PL IRT model from the following distributions: a ~ N (1.0, 0.25)[0.2, 1.8], b ~ N (0, 1.0)[−3, 3], and c ~ N (0.25, 0.02)[0, 0.4]. As for form X, the a and c parameters were generated from the same distributions as Form Y, while the b parameter was generated from N (0.05, 1.0)[−3, 3], representing the difficulty difference of the test forms.
Second, according to real test data from a national language proficiency assessment in China, the two background variables C and S of test takers were generated from N (1.69, 0.46)[1, 2] and N (24.05, 11.72)[1, 50] respectively. A covariance matrix was used to maintain the correlations of C and S with the ability parameter at 0.4 and 0.75.
Finally, response data for the two forms were generated using the 3PL IRT model with draws of θ and the a-, b-, c-parameters as mentioned above. For each item-by-simulee interaction, dichotomous responses were created by comparing the probability of a correct response to a random draw from a uniform (0, 1) distribution for three sample sizes (N = 400, 800, 1,600). All simulations were conducted using R version 3.6.1 (R Core Team, 2019). Data sets were replicated 1,000 times per condition, with true person and item parameters fixed across replications.
2.3 Evaluation criteria and indices
As a relatively reliable evaluation criterion for equating results, IRT true score equating is frequently used in simulation studies on equating to compare and evaluate the equating methods under investigation (Hou, 2007; Wang et al., 2008). In this study, results of IRT true score equating were served as the baseline to evaluate the performance of PEG and NEAT.
Three measures were computed to evaluate the bias and accuracy of PEG and NEAT equating: standard error of equating (SEE), bias and root mean squared error (RMSE), which were calculated as follows:
where N is sample size, R is the number of replications, is the test score, is the equated score, is the true value, i.e., the equated score of the baseline.
To further explore the real difference between equated scores of PEG and NEAT designs, the difference that matters (DTM) was also used as one of the evaluation indices (Brossman, 2010). The value of DTM is obtained by subtracting the equated score of NEAT from that of PEG equating. DTM represents a half unit of reported score unit (Puhan, 2010), which is equal to 0.5 according to the scoring based on the number of correct items in this study.
2.4 Equating
Scores of both PEG and NEAT designs were equated using the “equate” R package (Albano, 2016) using linear equating methods, following the practices of existing research (Haberman, 2015; Lu and Guo, 2018). As for the comparison baseline, IRT true score equating was also performed in R. IRT calibration was conducted with BILOG-MG (Zimowski et al., 2003), and then parameters were transformed to scale score using the R package “plink” (Weeks, 2010).
2.5 Results
2.5.1 Equating error between PEG and NEAT equating
As can be seen from Table 1, with a moderate group ability difference (Δθ=0.25), PEG_C produced bigger SEE, RMSE and absolute value of bias than the other three equating designs, PEG_S and PEG_CS produced equating errors that were very similar to those of NEAT. SEE decreased with an increase in sample size among the four equating designs, and PEG_CS resulted in a smaller SEE than NEAT when N = 800. RMSE and absolute value of bias of the four linking designs all decreased as the correlation between test scores and background information increased, with PEG_S and PEG_CS producing very similar RMSE and absolute bias results.
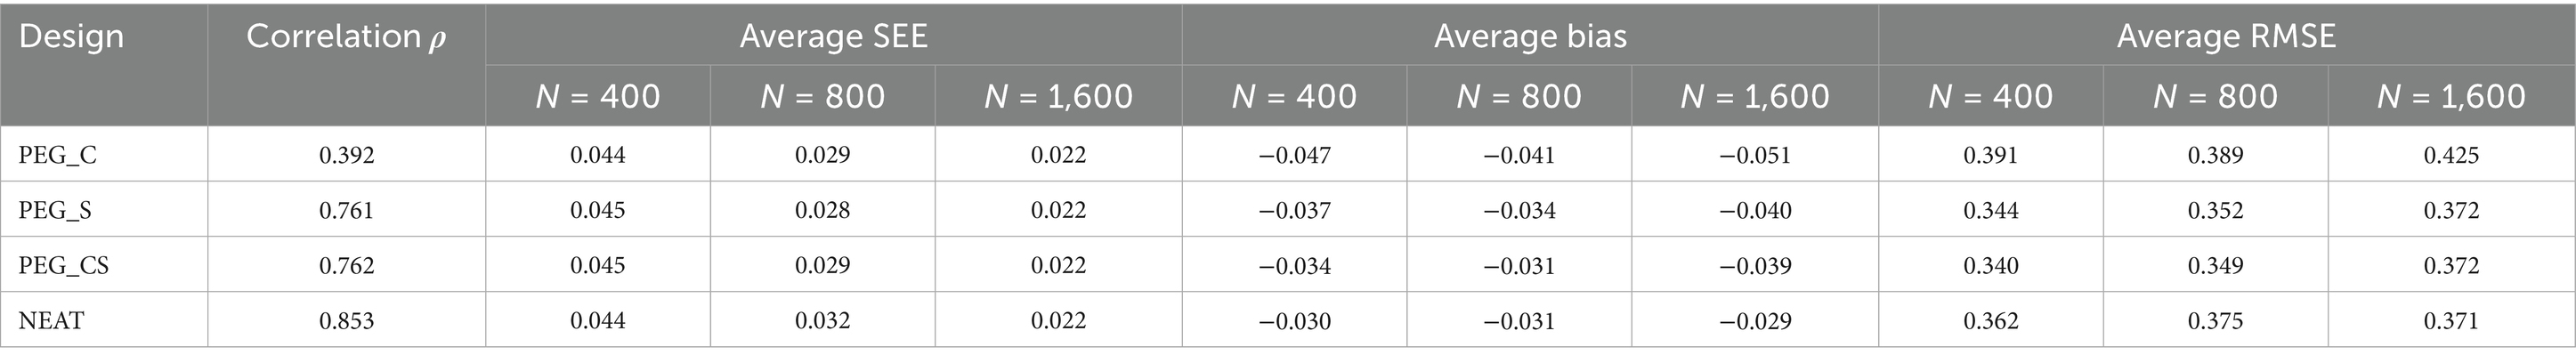
Table 1. Average SEE, Bias, and RMSE of PEG and NEAT equating for the scenario of moderate group difference in ability (Δθ = 0.25) from the simulation study.
Table 2 showed the average SEE, bias and RMSE of four equating designs when group difference in ability is large (Δθ=0.50). The trends of SEE, bias and RMSE under different conditions were consistent with those observed for a moderate group ability difference. A comparison of the results in Tables 1, 2 clearly indicated that the equating errors for the four linking designs all increased as the group ability difference became larger.
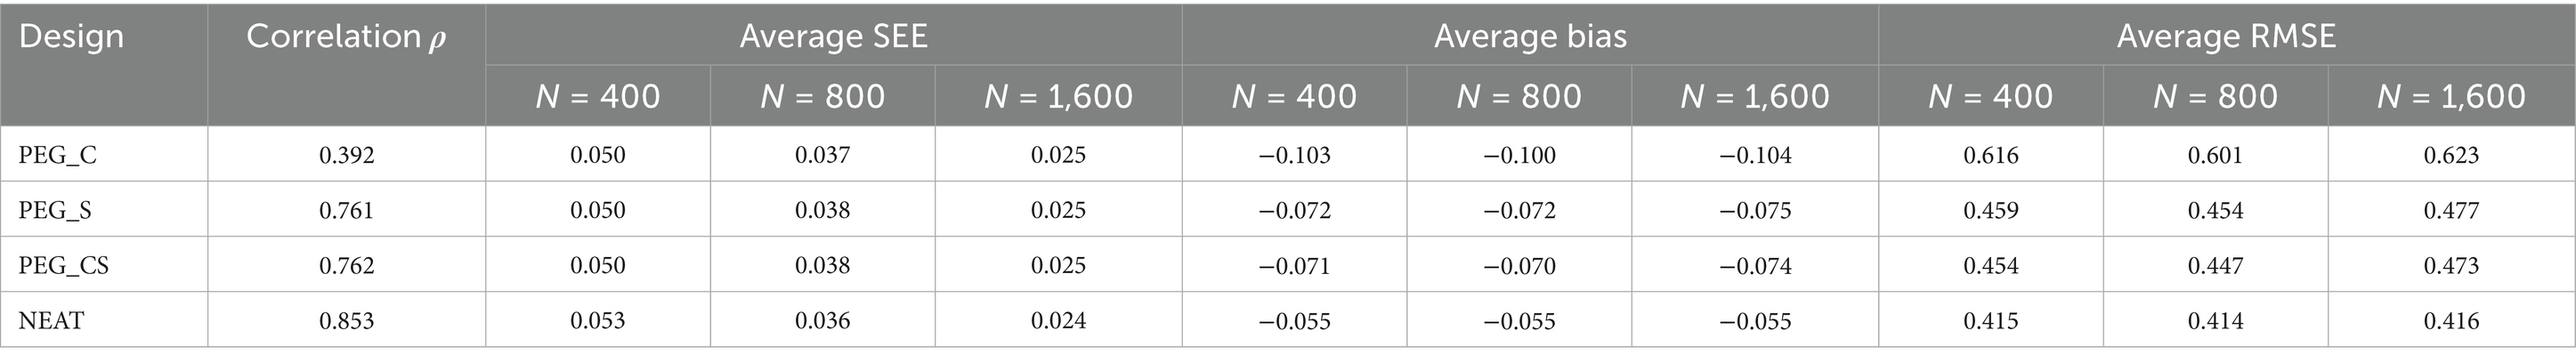
Table 2. Average SEE, bias and RMSE of PEG and NEAT equating for the scenario of large group difference in ability (Δθ = 0.50) from simulation study.
2.5.2 DTM between PEG and NEAT equating
As illustrated in Figure 1, under different conditions, the DTM values of equated scores at each raw score point between PEG_S and PEG_CS and NEAT were less than 0.5, with the exception of the low score range (0–5), which is generally excluded when comparing and evaluating equating effects of different equating designs due to large SEE from small sample size (Brossman, 2010). In contrast, the DTM values of equated scores at each raw score point between PEG_C and NEAT were greater than 0.5 across almost all score ranges. The DTM values of four equating designs all increased with the increase of group ability differences, yet they maintained a consistent pattern regardless of the sample size.
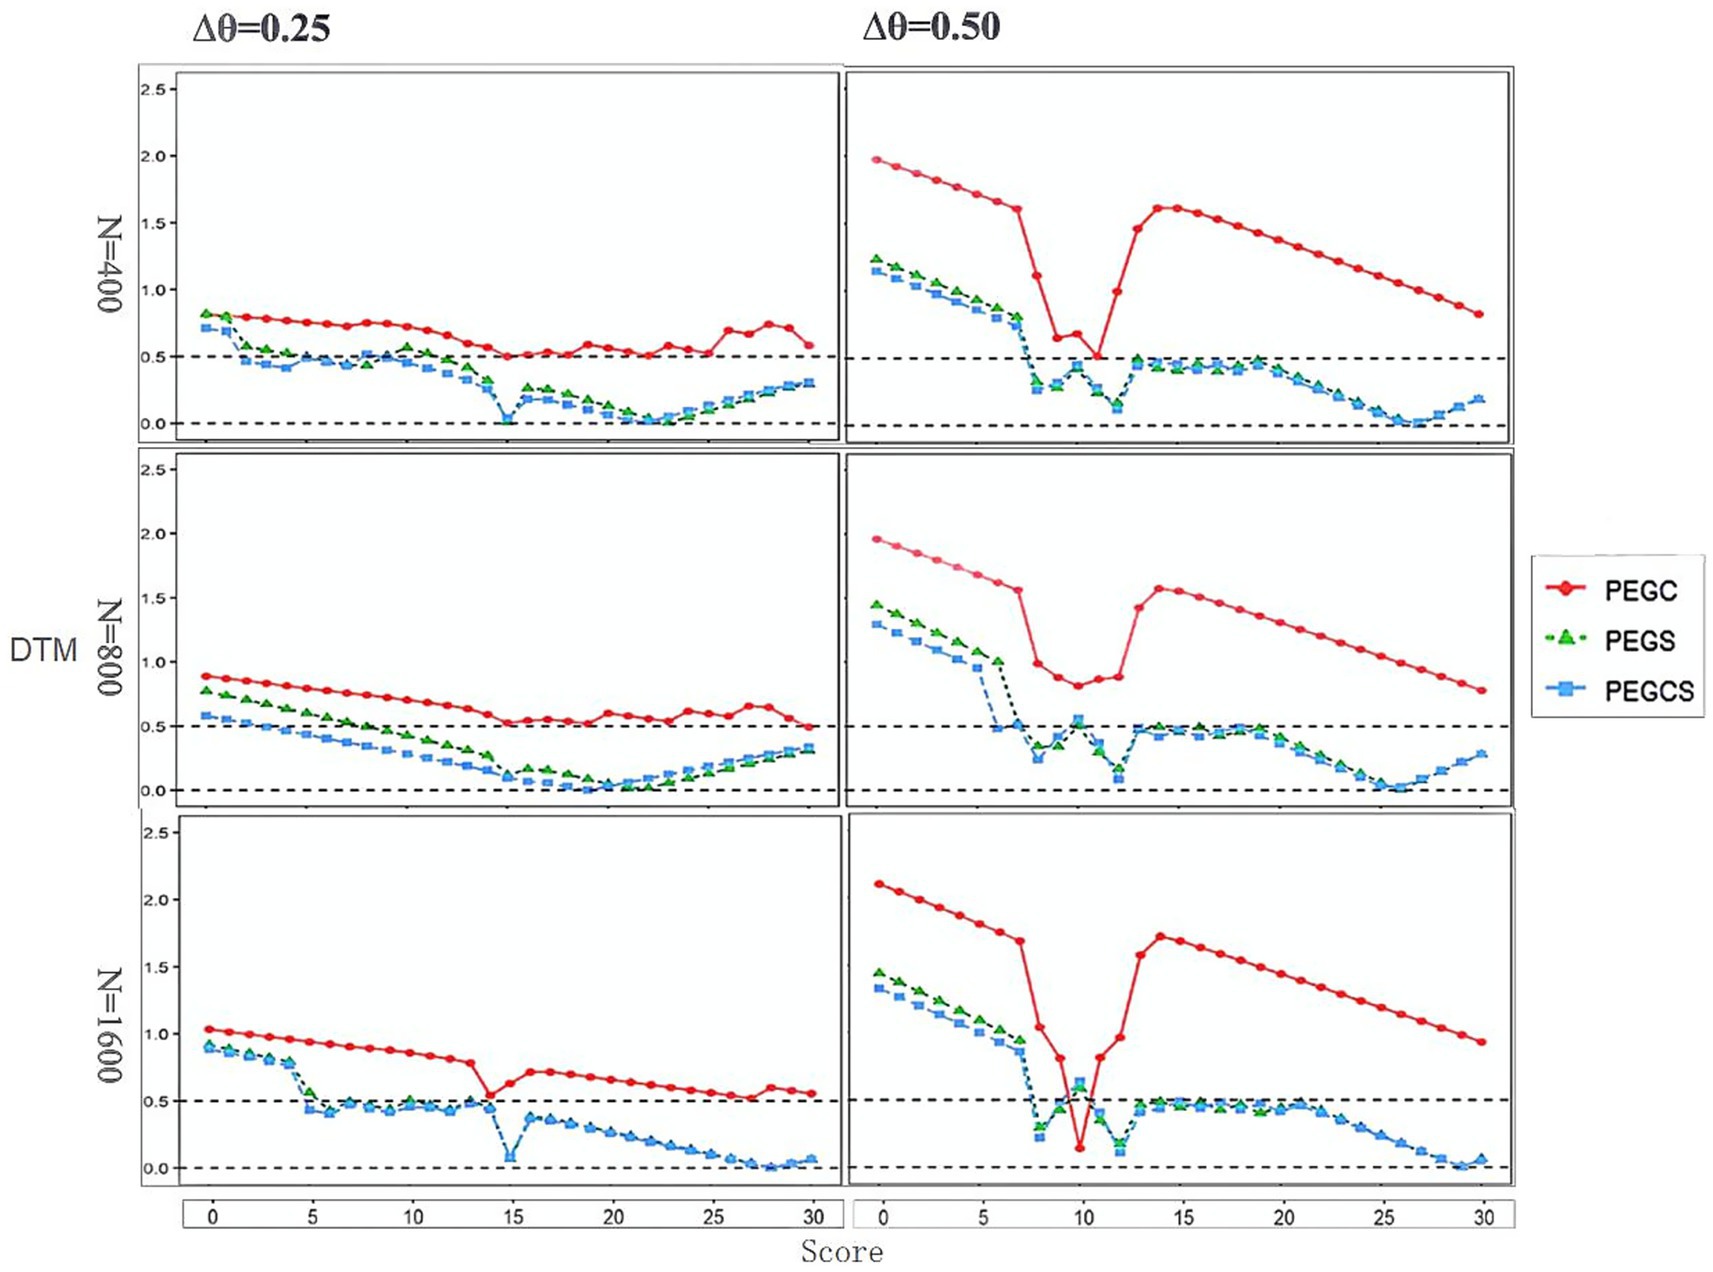
Figure 1. DTM of PEG and NEAT at each raw score point under different conditions from simulation study.
3 Empirical illustration
3.1 Data
To further verify the effectiveness of PEG equating, real test data from a nationwide Chinese language assessment in China was used (Peng, 2021). The test contained 55 dichotomously scored items, and had 3,640 valid cases as its population. Background information from test takers, including variables such as gender, class teaching mode, and previous Chinese exam scores from a year ago, were also collected. The correlation of these three variables with the total test score were 0.119, 0.388 and 0.769, respectively.
A practical challenge frequently encountered when conducting test equating research with real test data is that the collected data may not fully meet the study’s requirements. A common practice is to create pseudo forms and pseudo groups based on the research objectives and requirements (Kolen and Brennan, 2014). This method is often utilized to compare and examine various equating methods, especially those that are newly developed (Hagge and Kolen, 2012; Liu and Kolen, 2011a,b; Petersen et al., 1982; Powers and Kolen, 2011; von Davier et al., 2006).
One advantage of creating pseudo forms and pseudo groups is that the overall group of test-takers before division can serve as a traditional single-group equating design, allowing equating procedures to be applied to the split test forms. The results derived therefrom can act as an evaluation criterion for equating outcomes, facilitating the comparison and assessment of the equating methods under study (Kolen and Brennan, 2014).
Therefore, in the current study, pseudo forms and pseudo groups were created to explore the effectiveness of PEG equating. Gender was used as a grouping variable, while class teaching mode (denoted as C) and previous Chinese exam score from a year ago (denoted as S) were utilized in PEG equating to weight group differences. Consequently, three types of PEG equating designs could be established: PEG_C (including only variable C), PEG_S (including only variable S), and PEG_CS (including both variables C and S). Traditional NEAT equating was also employed as a point of comparison in this real data illustration.
The two pseudo forms, X and Y, were constructed by randomly selecting 31 items from the entire test without replacement, with 7 items serving as internal anchors. The pseudo groups were obtained by dividing the 3,640 cases into two based on gender. The mean and standard deviation (SD) of pseudo forms, as well as the sample size of the two pseudo groups, the correlation of background information variables and anchor test to test score in each form, were described in Table 3.
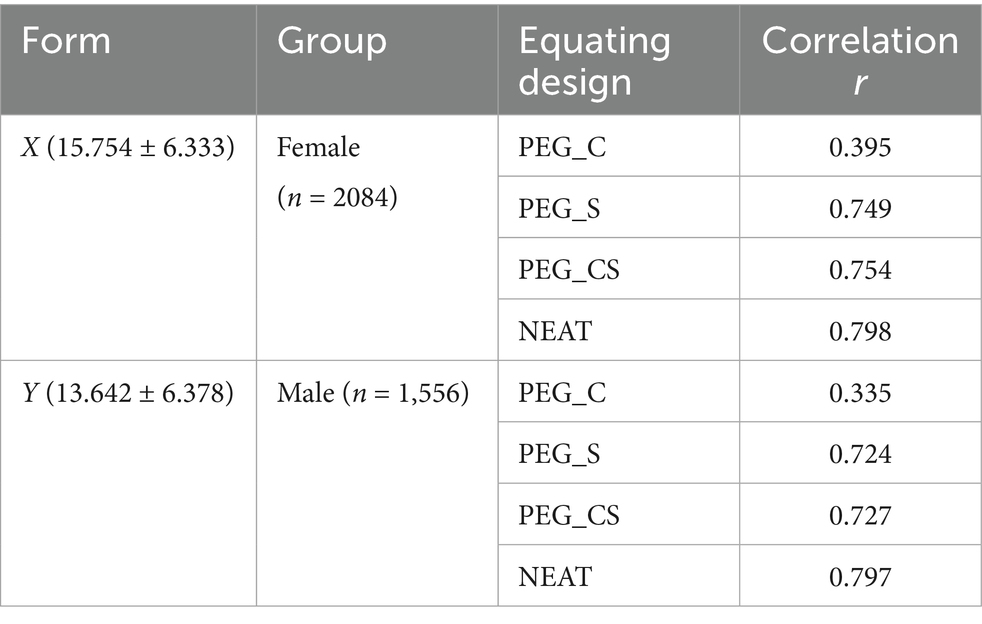
Table 3. Description of pseudo forms and pseudo groups from application study.
As can be seen from Table 3, the female group, comprising 2084 participants, responded to the new Form X, while the male group, with 1,556 participants, responded to the old form Y. The NEAT design, featuring 7 items as internal anchors, exhibited the highest correlation with test scores across both forms. Subsequently, PEG_CS followed with a correlation ranging from approximately 0.72 to 0.75. PEG_C had the lowest correlation, at approximately 0.35.
NEAT equating and three types of PEG equating were performed on the two pseudo forms. The 3,640 cases before grouping constructed a single group design, and IRT true score equating was applied to equate the scores of this single group on the two pseudo forms X and Y, with the results serving as the evaluation criteria for PEG equating and NEAT equating. Bias, RMSE and DTM for both PEG and NEAT equating were computed and compared. Equating designs and procedures were identical to those used in the simulation.
3.2 Results
3.2.1 Equating error
As can be seen from Table 4, PEG_C resulted in a higher RMSE and absolute value of bias compared to the other three equating designs. PEG_S and PEG_CS yielded very similar outcomes, which were close to those of NEAT. The equating error decreased as the correlation between linking connectives and test scores increased, showing the same trend observed in simulations.
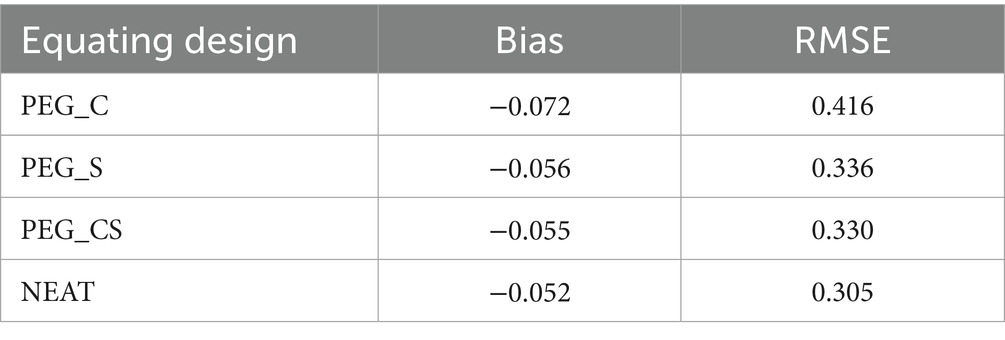
Table 4. Bias and RMSE of PEG and NEAT equating from application study.
3.2.2 DTM
As illustrated in Figure 2, the DTM values for equated scores at each raw score point of PEG_C were greater than 0.5 across nearly the entire score range, whereas those of PEG_S and PEG_CS were below 0.5, except for the low score range (0–5), suggesting that the differences between PEG_S and PEG_CS compared to NEAT would not have a significant impact.
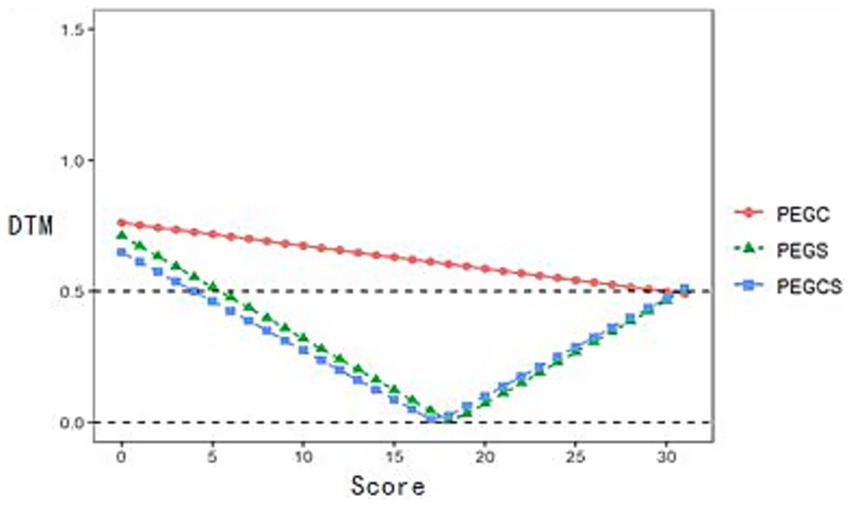
Figure 2. DTM of PEG and NEAT at each raw score point from application study.
4 Summary and discussion
PEG equating employs test takers’ background information variables to create pseudo equivalent groups via adjustment by minimum discrimination information (Haberman, 1984) and then conducts equating process on the pseudo equivalent groups using the traditional equivalent group linking designs such as equipercentile or linear equating. As a newly proposed design, PEG equating does not rely on common items or common people, thereby avoiding the threats to test security posed by issues such as anchor item exposure in traditional NEAT equating. To explore the effectiveness of this new design, this study compared the performance of PEG equating with NEAT equating in terms of equating errors and differences that matter in equated scores using simulation and real test data.
The results of equating error from both simulation and real data indicated that all three PEG equating designs produced larger RMSE and absolute bias values than NEAT. This occurs because the correlation of the background information variables included in PEG equating with the total test score is lower than that of the anchor test in NEAT design with the total test score (Kim and Lu, 2018; Lu and Guo, 2018). However, the differences in RMSE and bias between PEG_S and PEG_CS compared to NEAT were very small. PEG_S and PEG_CS yielded a very close or even smaller SEE than NEAT. The reason for this is that PEG is essentially an equivalent group design, which requires a smaller sample size than NEAT (Kolen and Brennan, 2014).
Results of difference between the equated scores of PEG and NEAT showed that the DTM values for PEG_S and PEG_CS were below 0.5, except for the low score range 0–5, which is typically excluded due to the small sample size (Brossman, 2010). This suggests that the difference in equated scores between PEG_S and PEG_CS, and NEAT, is negligible, with PEG_S and PEG_CS yielding results equivalent to those of NEAT. It can be concluded that when the correlation between background information variables and the scores to be equated is approximately 0.75, PEG can serve as an effective substitute for NEAT.
By comparing the outcomes of the three PEG linking designs, it became evident that the correlation of background information variables included in MDIA weighting to the total test score significantly impacted PEG linking. Higher correlations resulted in greater PEG equating accuracy. This finding aligns with the results of Lu and Guo’s (2018). With the robust capability of MIDA in handling variables, a high correlation of 0.75 can be achieved through a single variable or a combination of several variables (Haberman, 1984, 2015), which facilitates the practical application of PEG equating in testing.
Equating error and DTM of PEG equating all increased when group differences increased, which is the same trend observed in conventional equating designs and easy to explain (Kolen and Brennan, 2014). However, the DTM values of both PEG_S and PEG_CS were below 0.5, regardless of whether the scenario involved moderate or large group differences in ability, suggesting that when the correlation between background information and test score approaches approximately 0.75, PEG can yield results comparable to NEAT, regardless of whether the group differences in ability are moderate or large.
Although this study provides some supplementary insights to existing research, it also has certain limitations. First, the results of this study are based on the assumption that the difficulty difference between the two test forms is small (Δb = 0.05). Research indicates that larger differences in test difficulty result in greater equating errors (Kolen and Brennan, 2014; Laukaityte et al., 2025). A deeper exploration into how varying levels of difficulty may influence the equating process could provide valuable insights and contribute to refining equating methodologies in scenarios with substantial difficulty differences between test forms. Secondly, as a distribution-based equating method, the specific impact of the distributional characteristics of test scores on the outcomes of PEG equating requires more thorough and rigorous investigation in future studies. Furthermore, it would be beneficial to explore how PEG performs in equating tests such as the Fall/Pass assessments, where different formats and scoring systems may pose unique challenges (Bolsinova and Maris, 2016). Understanding PEG’s handling of these specific test types could aid in determining its robustness across various testing conditions. Third, the study primarily focused on two background variables related to the adjustment process; however, it raises the question of how the equating results might change when multiple variables are considered simultaneously. The inclusion of additional variables in the equating process introduces the need for a weighting mechanism that accounts for the interaction between different factors. Although Haberman (2015) emphasized that MIDA is capable of managing complex variable interactions, a more detailed investigation into how multiple variables influence the equating process is needed to fully assess the method’s robustness in real-data applications.
In recent years, several innovative equating designs have emerged that do not rely on traditional anchor items. Instead, these methods utilize background information variables to construct pseudo-equivalent groups for equating non-equivalent groups of test takers (Baldwin and Clauser, 2022; Wallin and Wiberg, 2019). While this study did not explore a comparison between PEG and other alternative methods, this could be an important area for future research. A thorough comparative analysis could provide a deeper understanding of the strengths and limitations of PEG relative to other methods, thereby advancing the field of test equating.
Data availability statement
The original contributions presented in the study are included in the article/Supplementary material, further inquiries can be directed to the corresponding author.
Author contributions
XF: Data curation, Project administration, Visualization, Software, Conceptualization, Methodology, Writing – original draft, Funding acquisition, Resources, Investigation, Validation, Formal analysis, Writing – review & editing. MZ: Supervision, Writing – review & editing. HP: Data curation, Project administration, Writing – review & editing.
Funding
The author(s) declare that financial support was received for the research and/or publication of this article. We thank the support from HanKao International Scientific Research Fund (Grant No. CTI2022B04), Hunan Provincial Philosophy and Social Science Planning Project Fund (Grant No. 21YBA259), and 2023 Hunan Provincial Educational Science Planning Project Fund (Grant No. XJK23AKS003) to Dr. Xizhen Fan.
Conflict of interest
The authors declare that the research was conducted in the absence of any commercial or financial relationships that could be construed as a potential conflict of interest.
Generative AI statement
The authors declare that no Gen AI was used in the creation of this manuscript.
Any alternative text (alt text) provided alongside figures in this article has been generated by Frontiers with the support of artificial intelligence and reasonable efforts have been made to ensure accuracy, including review by the authors wherever possible. If you identify any issues, please contact us.
Publisher’s note
All claims expressed in this article are solely those of the authors and do not necessarily represent those of their affiliated organizations, or those of the publisher, the editors and the reviewers. Any product that may be evaluated in this article, or claim that may be made by its manufacturer, is not guaranteed or endorsed by the publisher.
Supplementary material
The Supplementary material for this article can be found online at: https://www.frontiersin.org/articles/10.3389/feduc.2025.1667220/full#supplementary-material
References
Albano, A. D. (2016). Equate: an R package for observed-score linking and equating. J. Stat. Softw. 74, 1–36. doi: 10.18637/jss.v074.i08
Angoff, W. H. (1971). “Scales, norms, and equivalent scores” in Educational measurement. ed. R. L. Thorndike (Washington, DC: American Council on Education), 508–600.
Baldwin, P., and Clauser, B. E. (2022). Historical perspectives on score comparability issues raised by innovations in testing. J. Educ. Meas. 59, 140–160. doi: 10.1111/jedm.12318
Bolsinova, M., and Maris, G. (2016). Can IRT solve the missing data problem in test equating? Front. Psychol. 6, 1–13. doi: 10.3389/fpsyg.2015.01956
Brossman, B. G. (2010). Observed score and true score equating procedures for multidimensional item response theory. (unpublished doctoral dissertation). University of Iowa, Iowa City, IA.
Chulu, B. W., and Sireci, S. G. (2011). Importance of equating high-stakes educational measurements. Int. J. Test. 11, 38–52. doi: 10.1080/15305058.2010.528096
Haberman, S. J. (1984). Adjustment by minimum discriminant information. Ann. Stat. 12, 971–988. doi: 10.1214/aos/1176346715
Haberman, S. J. (2015). Pseudo-equivalent groups and linking. J. Educ. Behav. Stat. 40, 254–273. doi: 10.3102/1076998615574772
Haberman, S. J., and Shelby, J. (2014). A program for adjustment by minimum discriminant information (report no. RM-14-01). Princeton, NJ: Educational Testing Service.
Hagge, S. L., and Kolen, M. J. (2012). “Effects of group differences on equating using operational and pseudo-tests” in Mixed-format tests: psychometric properties with a primary focus on equating. eds. M. J. Kolen and W. Lee, vol. 2 (Iowa City, IA: CASMA, University of Iowa), 45–86.
Hou, J. (2007). Effectiveness of the hybrid Levine equipercentile and modified frequency estimation equating methods under the common-item nonequivalent groups design. (unpublished doctorial dissertation). University of Iowa, Iowa City, IA
Kim, S., and Lu, R. (2018). The pseudo-equivalent groups approach as an alternative to common-item equating. ETS Res. Rep. Ser. 2018, 1–13. doi: 10.1002/ets2.12195
Kim, S., and Walker, M. E. (2022). Adjusting for ability differences of equating samples when randomization is suboptimal. Educ. Meas. Issues Pract. 41, 26–37. doi: 10.1111/emip.12506
Kolen, M. J., and Brennan, R. L. (2014). Test equating, scaling and linking: methods and practice. 3rd Edn. New York: Springer.
Laukaityte, I., Wallin, G., and Wiberg, M. (2025). Combining propensity scores and common items for test score equating. Appl. Psychol. Meas. 1–30. doi: 10.1177/01466216251363240
Liu, C., and Kolen, M. J. (2011a). “Automated selection of smoothing parameters in equipercentile equating” in Mixed-format tests: psychometric properties with a primary focus on equating. eds. M. J. Kolen and W. Lee, vol. 1 (Iowa City, IA: CASMA, University of Iowa), 237–261.
Liu, C., and Kolen, M. J. (2011b). “Evaluating smoothing in equipercentile equating using fixed smoothing parameters” in Mixed-format tests: psychometric properties with a primary focus on equating. eds. M. J. Kolen and W. Lee, vol. 1 (Iowa City, IA: CASMA, University of Iowa), 213–236.
Lord, F. M. (1980). Applications of item response theory to practical testing problems. Mahwah, NJ: Lawrence Erlbaum Associate.
Lu, R., and Guo, H. (2015) Comparison of PEG linking with NEAT equating. Paper presented at the annual meeting of the National Council on measurement in education, Chicago, IL.
Lu, R., and Guo, H. (2018). A simulation study to compare nonequivalent groups with anchor test equating and pseudo-equivalent group linking. ETS Res. Rep. Ser. 2018, 1–16. doi: 10.1002/ets2.12196
Peng, H. (2021). The historical evolution and mission of the Chinese language proficiency test for ethnic minorities. Journal of China Examinations, 7, 56–62. doi: 10.19360/j.cnki.11-3303/g4.2021.07.008
Petersen, N. S., Marco, G. L., and Stewart, E. E. (1982). “A test of the adequacy of linear score equating models” in Test equating. eds. P. W. Holland and D. B. Rubin (New York: Academic Press Inc), 71–135.
Powers, S. J., and Kolen, M. J. (2011). “Evaluating equating accuracy and assumptions for groups that differ in performance” in Mixed-format tests: Psychometric properties with a primary focus on equating. eds. M. J. Kolen and W. Lee, vol. 1 (Iowa City, IA: CASMA, University of Iowa), 137–175.
Puhan, G. (2010). A comparison of chained linear and poststratification linear equating under different testing conditions. J. Educ. Meas. 47, 54–75. doi: 10.1111/j.1745-3984.2009.00099.x
R Core Team (2019). R: a language and environment for statistical computing. Vienna, Austria: R Foundation for Statistical Computing.
Sunnassee, D. (2011). Conditions affecting the accuracy of classical equating methods for small samples under the NEAT design: a simulation study. (unpublished doctoral dissertation). University of North Carolina at Greensboro, Greensboro, NC.
von Davier, A. A., Holland, P. W., Livingston, S. A., Casabianca, J., Grant, M. C., and Martin, K. (2006). An evaluation of the kernel equating method: A special study with pseudo tests constructed from real test data (report no. RR-06-02). Princeton, NJ: Educational Testing Service.
Wallin, G., and Wiberg, M. (2019). Kernel equating using propensity scores for nonequivalent groups. J. Educ. Behav. Stat. 44, 390–414. doi: 10.3102/1076998619838226
Wang, T., Lee, W. C., Brennan, R. L., and Kolen, M. J. (2008). A comparison of the frequency estimation and chained equipercentile methods under the common-item nonequivalent groups design. Appl. Psychol. Meas. 32, 632–651. doi: 10.1177/0146621608314943
Weeks, J. P. (2010). Plink: an R package for linking mixed-format tests using IRT based methods. J. Stat. Softw. 35, 1–33. doi: 10.18637/jss.v035.i12
Xi, N., Guo, H., and Oh, H. (2015). A PEG linking study of matching variables. Paper presented at the annual meeting of the National Council on measurement in education, Chicago, Illinois.
Keywords: pseudo-equivalent groups, test equating, equating with pseudo-equivalent groups, adjustment by minimum discriminant information, weighting
Citation: Fan X, Zhang M and Peng H (2025) Is pseudo-equivalent groups equating via minimum discriminant information adjustment effective? Evidence from simulation and real data. Front. Educ. 10:1667220. doi: 10.3389/feduc.2025.1667220
Edited by:
Leslie Rutkowski, Indiana University, United StatesReviewed by:
Diego Carrasco, Pontificia Universidad Católica de Chile, ChileDavid Kaplan, University of Wisconsin-Madison, United States
Copyright © 2025 Fan, Zhang and Peng. This is an open-access article distributed under the terms of the Creative Commons Attribution License (CC BY). The use, distribution or reproduction in other forums is permitted, provided the original author(s) and the copyright owner(s) are credited and that the original publication in this journal is cited, in accordance with accepted academic practice. No use, distribution or reproduction is permitted which does not comply with these terms.
*Correspondence: Xizhen Fan, Znh6aDEyNkBtLnNjbnUuZWR1LmNu