 Gang Dou
 Yilin Feng
- Faculty of Education, Yunnan University, Kunming, China
This study aimed to examine the psychometric properties of the Information Technology Acceptance Scale for High School Teachers, developed in Chinese and grounded in the Technology Acceptance Model (TAM). The scale measured four key constructs: perceived usefulness, perceived ease of use, attitude toward technology use, and intention to use. A total of 682 Chinese high school teachers participated by completing a paper-based questionnaire. Confirmatory factor analysis supported a refined 16-item version with a stable four-factor structure and satisfactory model fit. Internal consistency was acceptable to strong across all factors (Cronbach’s α > 0.799, McDonald’s ω > 0.801, construct reliability H > 0.801). Evidence for convergent and discriminant validity was obtained through analyses of average variance extracted, Heterotrait-Monotrait Ratio, and inter-construct correlations. Measurement invariance across gender was established at configural, metric, scalar, and strict levels, and latent mean differences were minimal. Structural equation modeling supported all hypothesized relationships within the TAM framework. Attitude toward use emerged as the strongest predictor of intention to use and also mediated the effects of perceived usefulness and perceived ease of use. The model explained 57.5% of the variance in intention to use. These results provide preliminary but robust psychometric support for the scale and suggest its utility in assessing Chinese high school teachers’ acceptance of educational technology.
1 Introduction
Since the 2010s, the global digital transformation of education has accelerated, shifting from device-center investment toward systemic reconstruction of pedagogical paradigms (WEF, 2020; Schleicher, 2022; UNESCO, 2022). China has adopted a pragmatic policy approach through initiatives such as the “New Infrastructure for Education,” acceleration of educational digitalization, and digital empowerment programs for teachers’ professional development (Ministry of Education of the People’s Republic of China, 2021, 2025a, 2025b). These policies aim to enhance teachers’ digital literacy and promote the integration of technology into daily teaching practices. However, effective technology adoption in schools depends not only on the availability of resources or technical proficiency but also on teachers’ epistemological beliefs, pedagogical orientations, and psychological readiness to use information technology. Among these factors, psychological acceptance plays a particularly central role in actual usage behaviors, underscoring the relevance of theoretically grounded models such as the Technology Acceptance Model (TAM).
Originally proposed by Davis (1989) and Davis et al. (1989), TAM, initially explains individuals’ computer technology acceptance through four core constructs: Perceived Ease of Use (PEOU), Perceived Usefulness (PU), Attitude toward Use (ATT), and Behavioral Intention (BI). According to the model, external factors such as system characteristics, or epistemological and pedagogical beliefs influence PEOU and PU, which in turn affect ATT and ultimately BI. Subsequent extensions to TAM—such as TAM2 (Venkatesh and Davis, 2000), UTAUT (Venkatesh et al., 2003), and TAM3 (Venkatesh and Bala, 2008)—introduced additional constructs, including social influence, effort expectancy, and emotional factors such as computer anxiety. Nonetheless, the core PU–PEOU–ATT–BI pathway remains theoretically robust and widely supported. Meta-analyses indicate that TAM-based models explain between 40 and 66% of the variance in technology usage intention (Al-Emran and Granić, 2021; Venkatesh et al., 2016; Rad et al., 2022).
In parallel with theoretical advances, TAM measurement instruments have undergone substantial refinement. Early measures were technology-specific. For instance, Davis et al. (1989) designed items such as “I would find CHART-MASTER useful in my job,” whereas later studies developed more generalized expressions suitable for broader contexts. Wording has evolved from concrete technological references to functional phrasing (e.g., “Using e-service would be easy,” Taherdoost, 2018) and finally to generalized categories (e.g., “Digital tools make it easier to keep in contact with parents,” Oinas et al., 2022). The four-factor structure (PU, PEOU, ATT, BI) continues to anchor nearly 80% of TAM-based studies (Scherer et al., 2019; Granić and Marangunić, 2019).
To examine how Chinese high school teachers’ epistemological and pedagogical beliefs affect their acceptance of educational technology, we developed a customized TAM-based instrument. A meta-analysis of 114 studies confirmed the centrality of PU, PEU, ATT, and BI in explaining teacher-related technology acceptance (Scherer et al., 2019). Accordingly, we adapted and synthesized items from Davis’s original scale, and Venkatesh’s UTAUT and TAM3 models. Insights from widely cited and recent studies (Teo, 2010a, 2010b; Teo et al., 2008; Teo and Noyes, 2011; Hong et al., 2021; Hsieh et al., 2017; Huang et al., 2021; Özbek et al., 2024; Scherer et al., 2020) in educational contexts also informed our design. Consequently, our instrument focuses on four constructs: Perceived Usefulness (PU), Perceived Ease of Use (PEOU), Attitude Toward Using Information Technology (ATT), and Intention to Use (IU), drafting five items per construct, written in active voice and referring to “information technology” in generalized terms. Item phrasing was contextualized to reflect the educational realities of Chinese high schools and current digital transformation of education policy initiative. An exploratory factor analysis conducted on pilot data led to the removal of four items due to low communalities and cross-loadings. The resulting 16-item scale served as the basis for the subsequent psychometric validation presented in this study.
2 Aim
This study aimed to examine the psychometric properties of a measurement instrument grounded in the core constructs of the TAM, developed to assess Chinese high school teachers’ acceptance of information technology. Specifically, the objectives were to: (1) evaluate the construct validity of the scale, including its structural, convergent, and discriminant validity; (2) examine measurement invariance across gender and compare latent means at the construct level; (3) assess the structural model of TAM, test structural invariance across gender, and compare latent means within the structural framework; and (4) investigate the model’s explanatory capacity, including the mediating role of attitude and the proportion of variance accounted for in intention to use.
3 Methods
3.1 Participants
Data collection took place in October 2022. A total of 682 in-service high school teachers from several urban public high schools in Shijiazhuang City, Hebei Province, China, participated in the study. Participants were recruited using a convenience sampling approach and were invited directly by the researcher to complete a self-administered paper-based questionnaire during scheduled teaching research activities. A total of 720 questionnaires were distributed, of which 706 responses were collected. After excluding those with missing or invalid data, a final total of 682 valid responses were retained for analysis. Although there was a section in the questionnaire for reporting age, many female teachers did not provide this information. Due to this, the subsequent analysis could not use age data. Participants reported a wide range of teaching experience, with a substantial portion of the sample (62.4%) had 6 years of teaching experience or less, suggesting an overrepresentation of early-career teachers. Participants taught a variety of subjects, including Chinese, science, humanities, and other disciplines. Notably, only 10 respondents reported specializing in information technology, indicating that IT teachers comprised a very small proportion of the sample. Prior to participation, all respondents were informed about the purpose and procedures of the study and provided voluntary consent. Detailed demographic characteristics are summarized in Table 1.
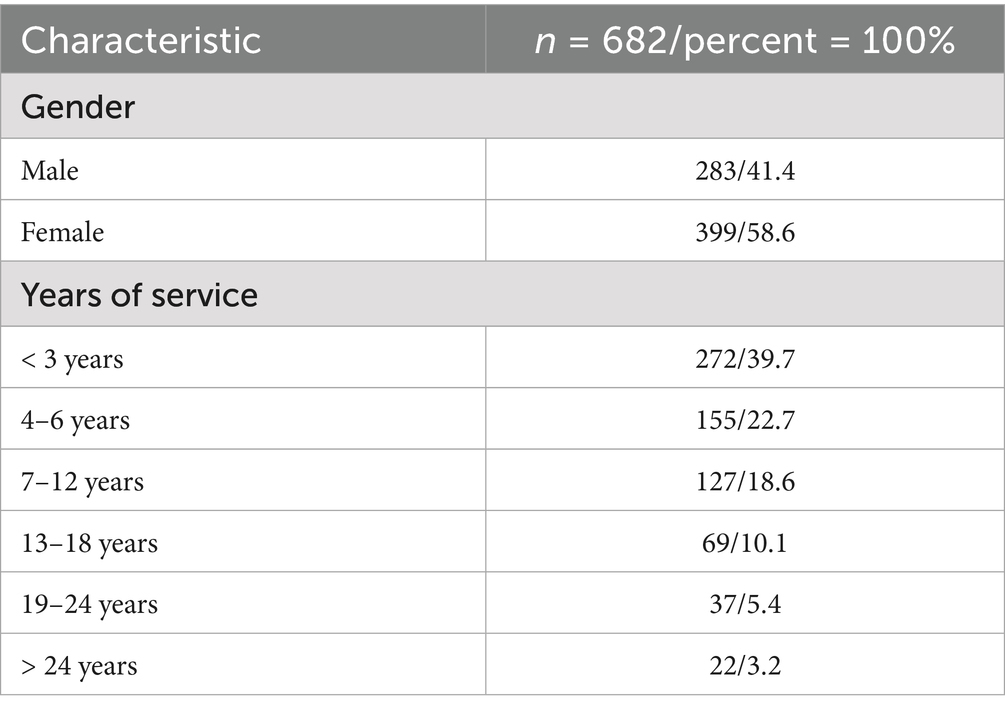
Table 1. Characteristics of the sample.
3.2 Instrument
The instrument employed in this study was a self-report questionnaire developed in Chinese, based on the core constructs of the Technology Acceptance Model (TAM). Item development was informed by prior TAM research and was adapted to align with the pedagogical context of Chinese high school teachers. The initial version of the instrument comprised 20 items, with five items designed to represent each of the four TAM constructs. All items were rated on a five-point Likert scale ranging from 1 (“strongly disagree”) to 5 (“strongly agree”).
Examples of items include: “Information technology improves the efficiency of my teaching” (PU), “Using information technology in teaching does not require much effort from me” (PEOU), “I really like the role information technology plays in teaching” (ATT), and “I hope to see more information technology tools used in teaching” (IU). A complete list of the questionnaire items, in both Chinese and English, is available in the Supplementary materials.
3.3 Statistical analyses
Since respondents with missing data were excluded during preprocessing; therefore, no further data cleaning or imputation was performed.
To confirm that the instrument reflects the four constructs of the TAM, a two-stage exploratory factor analysis was conducted (Costello and Osborne, 2005; Revelle, 2025). In the first stage, the number of factors to extract was determined to be four using the eigenvalue-greater-than-1 rule and parallel analysis, which was performed with 1,000 simulations (Horn, 1965; Revelle, 2025). Factors were extracted using principal axis factoring, followed by both orthogonal and oblique rotations of the factor loading matrix. After considering cross-loadings, low communalities, and factor loadings, items that negatively impacted the clarity of the constructs were removed. In the second stage, the remaining items underwent the same EFA to confirm the final construct results.
Multivariate normality was assessed using Mardia’s (1970) test (Kline, 2023), which revealed significant multivariate skewness ( = 1947.63, χ2 = 1957.21, p < 0.001) and kurtosis ( = 28.27, z = 28.27, p < 0.001), suggesting deviations from the assumption of multivariate normality. Consequently, CFA, measurement invariance, and group comparisons were performed using the Robust Maximum Likelihood (MLM) estimator with Satorra-Bentler correction (Satorra and Bentler, 2001).
Measurement invariance across gender was examined sequentially, following established guidelines (Vandenberg and Lance, 2000; Chen, 2007; Putnick and Bornstein, 2016). A series of nested models were tested, including configural, metric, scalar, and strict invariance models. Model fit at each step was evaluated using multiple indices: the Comparative Fit Index (CFI), the Root Mean Square Error of Approximation (RMSEA), and the Standardized Root Mean Square Residual (SRMR). The criteria of CFI ≥ 0.90, RMSEA ≤ 0.08, and SRMR ≤ 0.08 were adopted as indicators of acceptable fit (Hu and Bentler, 1999; Marsh et al., 2004). To compare nested models, both the Satorra-Bentler scaled χ2 difference test and changes in CFI (ΔCFI ≤ 0.01; Cheung and Rensvold, 2002) were used to determine whether additional parameter constraints significantly worsened model fit. Latent mean comparisons between gender groups were conducted only if scalar invariance was established, with Cohen’s d used to evaluate effect sizes, was interpreted as supporting measurement equivalence across gender (Meredith, 1993; Little, 2013).
Validity was evaluated across three domains. Construct validity was examined via confirmatory factor analysis (CFA), focusing on model fit indices and the standardized factor loading structure. Convergent validity was evaluated using standardized factor loadings (targeting most ≥ 0.70, none < 0.50), average variance extracted (AVE ≥ 0.50), and internal consistency indices, including Cronbach’s α, McDonald’s ω (≥ 0.70), and Hancock and Mueller’s H index (≥ 0.80) (Hair et al., 2010). Discriminant validity was assessed using both the Fornell–Larcker criterion (Fornell and Larcker, 1981) and the Heterotrait–Monotrait (HTMT) ratio, applying the 0.85 threshold as recommended by Henseler et al. (2015).
All analyses were performed in R (v4.5.1; R Core Team, 2025). The packages “lavaan” (v0.6–19; Rosseel, 2012) was used for CFA and measurement invariance testing, “semTools” (v0.5–7; Jorgensen et al., 2025) for invariance and validity diagnostics, and “psych” (v2.5.6; Revelle, 2025) for reliability analysis.
4 Results
4.1 Exploratory factor analysis
To assess whether the instrument reflects the four constructs of TAM, a two-stage EFA was conducted. In Stage 1, sampling adequacy was strong (KMO = 0.92; Bartlett’s test, χ2 = 5757.584, df = 190, p < 0.001). Both the eigenvalue-greater-than-1 rule and parallel analysis supported a four-factor solution. Factors were extracted using principal axis factoring with orthogonal (varimax) and oblique (promax) rotations. Considering cross-loadings and communalities, one item per construct was removed to improve structural clarity (I05, I08, I13, and I19).
In Stage 2, sampling adequacy remained high (KMO = 0.90); Bartlett’s test was again significant (χ2 = 4259.274, df = 120, p < 0.001). The eigenvalue rule and parallel analysis continued to support four factors. Using principal axis factoring, item communalities ranged from 0.406 to 0.649; the four-factor solution explained 51.76% of total variance. No substantive cross-loadings (≥0.30) were observed in either varimax or promax solutions. Proportions of variance explained by the orthogonal solution were 13.40, 13.28, 13.02, and 12.07%; the corresponding oblique solution yielded 12.80, 13.00, 12.90, and 12.60%. Taken together with item content, these results support the intended four-dimension TAM structure: I01, I02, I03, I04 (Perceived Usefulness), I06, I07, I09, I10 (Perceived Ease of Use), I11, I12, I14, I15 (Attitude), and I16, I17, I18, I20 (Intention to Use).
4.2 Validity and reliability
The four-factor measurement model showed acceptable fit to the data based on multiple indices: χ2(98) = 192.679, p < 0.001; normed chi-square (χ2/df) = 1.966; CFI = 0.971; RMSEA = 0.038; and SRMR = 0.032. These fit indices met or exceeded the commonly accepted thresholds for good model fit. As summarized in Table 2, all standardized factor loadings were statistically significant (p < 0.001), ranging from 0.645 (PEOU item I69) to 0.783 (PEOU item I66). Approximately 56.3% of the loadings exceeded 0.70, and the remainder were above 0.60. These results are consistent with a structurally sound measurement model.
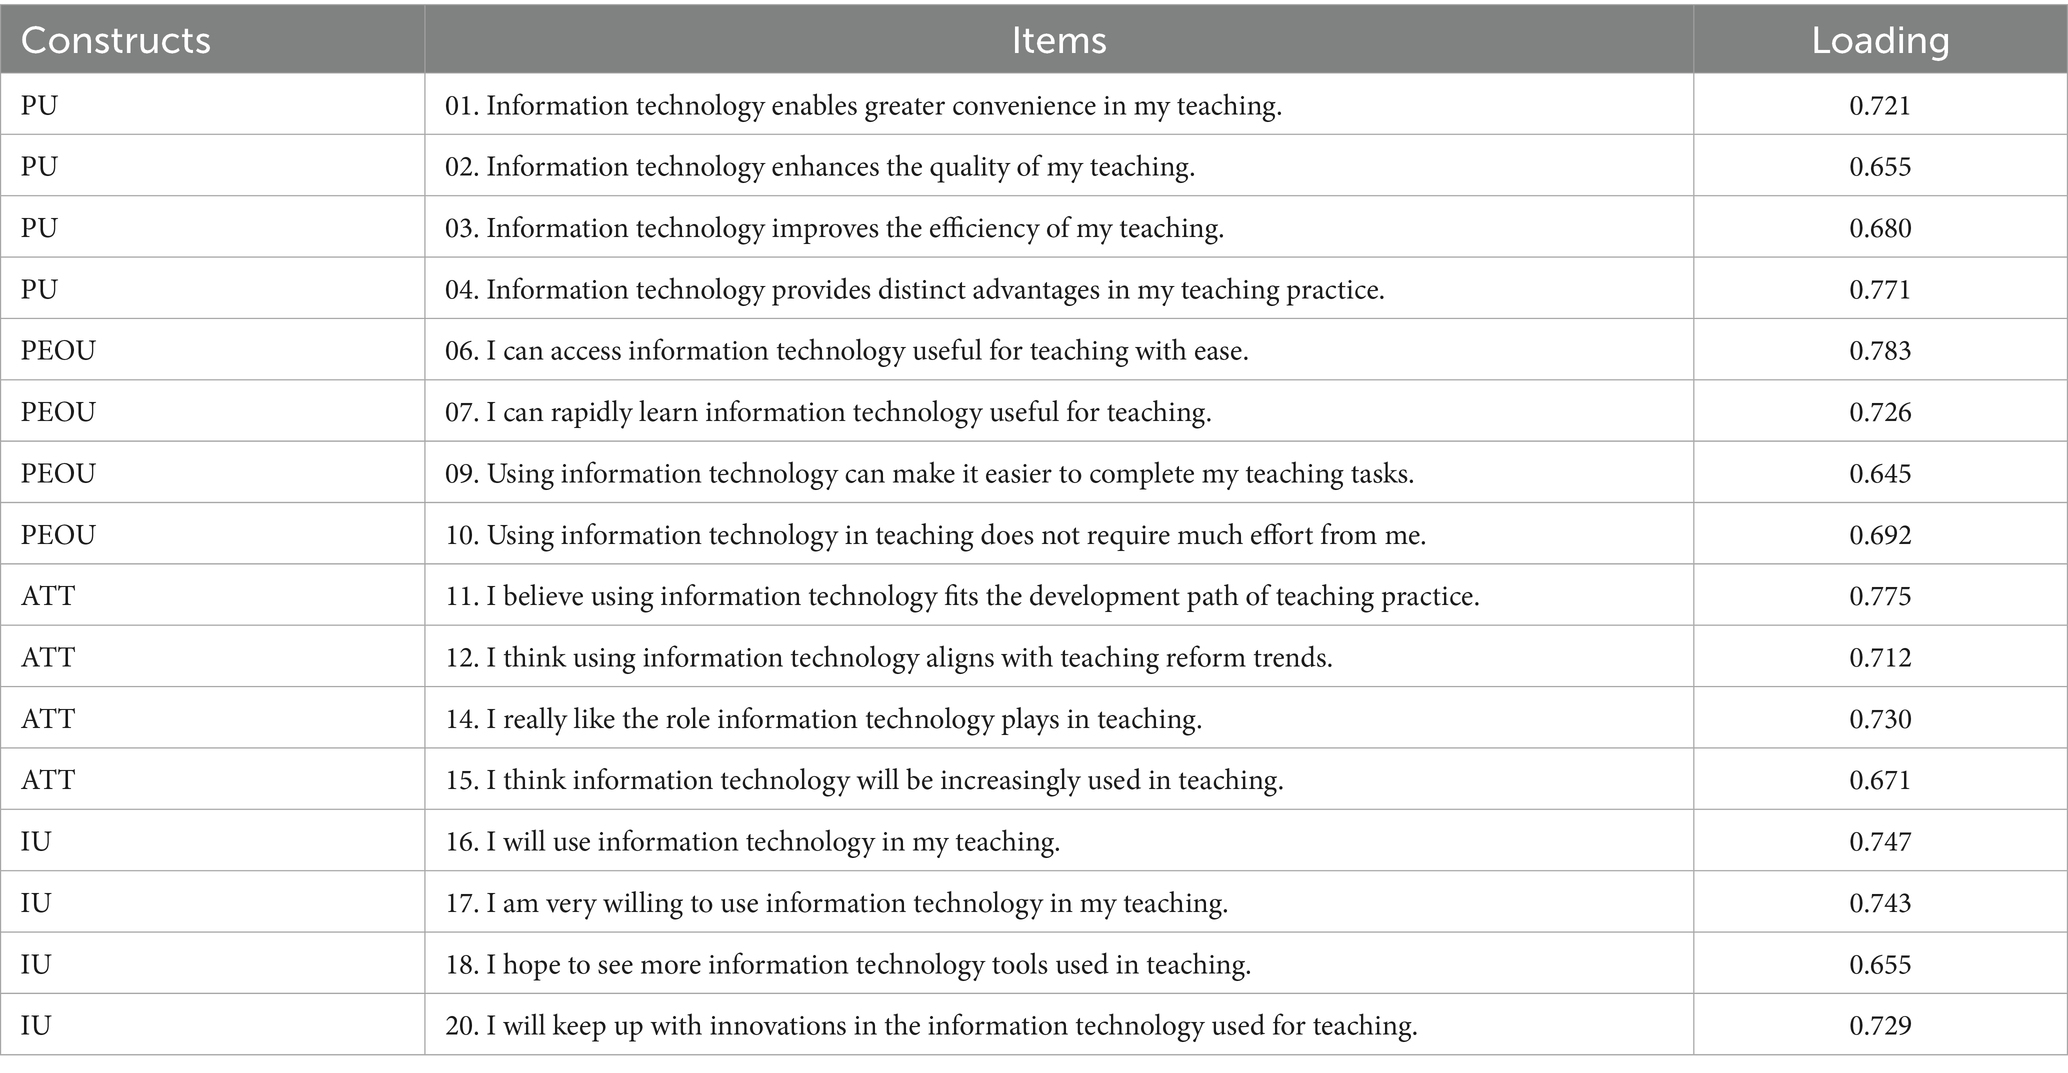
Table 2. Standardized factor loadings of ITAS-HST.
Convergent validity was supported by AVE values at or above 0.50 (PU, 0.500; PEOU, 0.510; ATT, 0.521; IU, 0.517). Reliability was acceptable, with Cronbach’s α ranging from 0.799 to 0.811 and McDonald’s ω from 0.799 to 0.814, all above the 0.70 threshold. Construct replicability was confirmed by Hancock-Mueller’s H index (0.801–0.814), indicating well-defined latent constructs. Although PU’s AVE and some loadings were near the lower bound, the overall evidence indicated satisfactory convergent validity.
Discriminant validity was supported by both the Fornell–Larcker criterion and the HTMT ratio. For each construct, the square root of AVE (√PU = 0.707; √PEOU = 0.714; √ATT = 0.722; √IU = 0.719) exceeded all inter-construct correlations (r = 0.449–0.681). HTMT values (0.445–0.688) were well below the conservative 0.85 threshold. Although ATT and IU were moderately correlated (r = 0.681), both √AVE and HTMT remained within acceptable limits, consistent with theoretical distinctions in the TAM. These results jointly affirm satisfactory discriminant validity across all constructs.
4.3 Measurement invariance and latent means comparisons in the ITAS-HST across gender
Measurement invariance across gender was evaluated via multi-group confirmatory factor analysis, progressing through a series of nested models: metric, scalar, and strict models. As summarized in Table 3, the configural model demonstrated adequate fit to the data, χ2(196) = 318.82, CFI = 0.964, RMSEA = 0.043, SRMR = 0.039, suggesting that the factorial structure was comparable across male and female participants. Constraining factor loadings in the metric model did not lead to a meaningful decline in fit, with ΔCFI = −0.0003; ΔRMSEA = −0.001. Similarly, the scalar model showed acceptable fit, χ2(220) = 350.73, CFI = 0.962, RMSEA = 0.046, and the strict model also maintained satisfactory fit, χ2(236) = 367.05, CFI = 0.961, RMSEA = 0.045. All changes in CFI were well within the recommended threshold (Chen, 2007; Cheung and Rensvold, 2002), supporting the assumption of measurement invariance across gender at all levels.
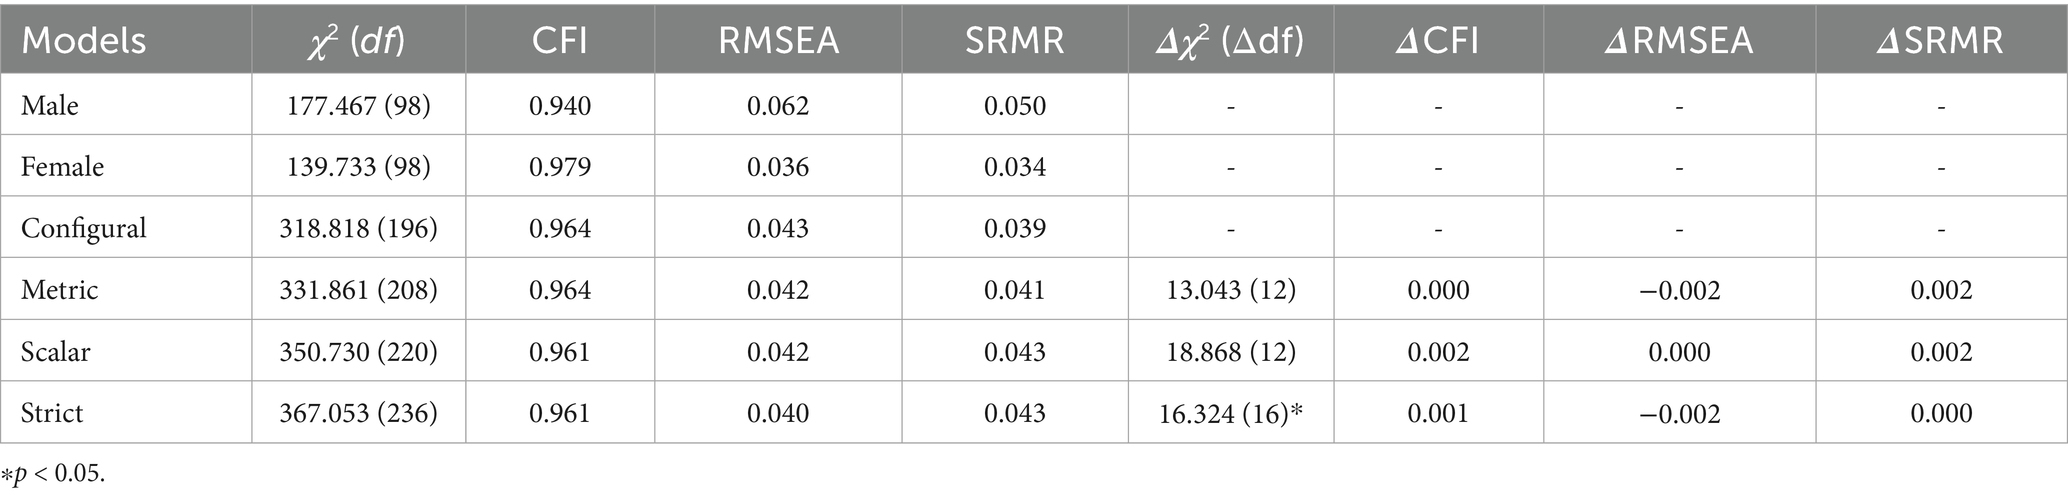
Table 3. Measurement invariance testing for ITAS-HST across gender.
Following the establishment of scalar invariance, latent mean differences were examined using the male group as the reference. No statistically significant differences were observed between males and females in PU (ΔM = 0.020, p = 0.810, Cohen’s d = 0.021), PEOU (ΔM = −0.086, p = 0.306, d = −0.088), ATT (ΔM = 0.105, p = 0.198, d = 0.108), or IU (ΔM = 0.081, p = 0.306, d = 0.086). All effect sizes were below the conventional threshold of 0.20, and confidence intervals for the differences included zero, indicating negligible practical differences. These results provide support for both structural and substantive equivalence of the instrument across gender groups.
4.4 Structural invariance and latent means comparisons in the TAM framework across gender
Following validation of the ITAS-HST measurement model, structural equivalence and latent mean differences within the TAM framework were assessed across gender groups. A multigroup structural invariance analysis tested a sequence of models—configural, metric, scalar, and strict. As shown in Table 4, the configural model demonstrated acceptable fit, χ2(198) = 335.706, CFI = 0.959, RMSEA = 0.045 SRMR = 0.045, suggesting comparable structural patterns across genders. Subsequent constraints produced minimal fit changes: metric model χ2(210) = 349.231, CFI = 0.959 (ΔCFI = −0.0002; ΔRMSEA = −0.0016); scalar model χ2(222) = 368.300, CFI = 0.957; strict model χ2(243) = 388.772, CFI = 0.957. All ΔCFI values remained ≤ 0.002 and ΔRMSEA ≤ 0.002, supporting structural invariance of path coefficients, intercepts, and residuals.
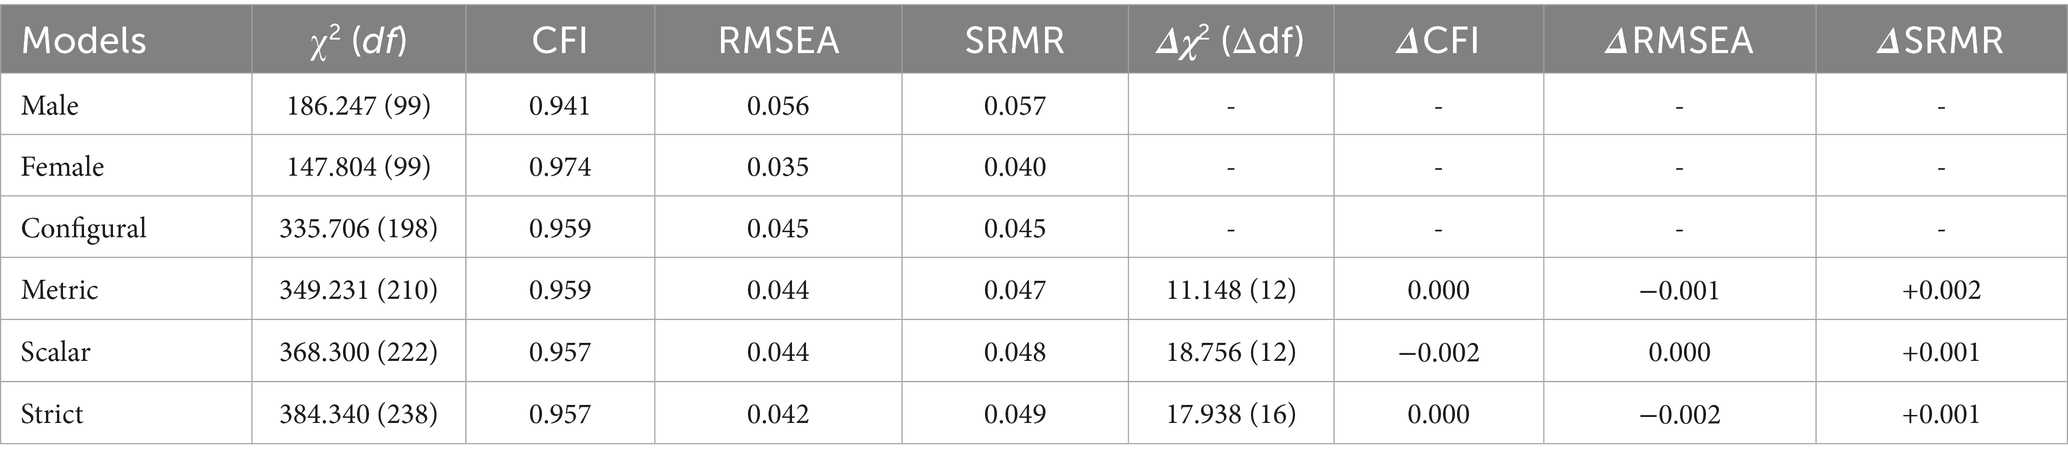
Table 4. Multigroup invariance of TAM across gender.
Latent mean comparisons using males as the reference group indicated no statistically significant gender differences. Females reported slightly higher PU (ΔM = 0.056, p = 0.452, d = 0.061), ATT (ΔM = 0.133, p = 0.057, d = 0.145), IU (ΔM = 0.027, p = 0.671, d = 0.030), and slightly lower PEOU (ΔM = −0.086, p = 0.306, d = −0.089). All effect sizes were below the 0.20 threshold, indicating practical equivalence.
These findings support the structural and substantive comparability of the TAM framework across gender groups. The final section examines its predictive performance within this sample.
4.5 Structural relationships and predictive strength within the TAM framework
To estimate direct, indirect, and total effects, the model was fitted using maximum likelihood estimation with 5,000 bootstrap resamples.
The pooled sample TAM model demonstrated acceptable fit: χ2(99) = 265.89, CFI = 0.960, RMSEA = 0.050, SRMR = 0.039. PEOU was positively associated with PU (β = 0.466, p < 0.001), and PU significantly predicted both ATT (β = 0.361, p < 0.001) and IU (β = 0.364, p < 0.001). PEOU also had a direct effect on ATT (β = 0.378, p < 0.001), while ATT showed the strongest association with IU (β = 0.501, p < 0.001). Effect decomposition indicated that the total PEOU→IU effect (0.443) was distributed across three indirect paths: 18.9% via PEOU→PU → ATT → IU, 42.8% via PEOU→ATT → IU, and 38.3% via PEOU→PU → IU. For PU → IU, 66.8% was direct, with 33.2% mediated through ATT. R2 values indicated moderate to substantial variance explained: PU = 0.217, ATT = 0.400, IU = 0.579.
For males, model fit was acceptable: χ2(99) = 246.87, CFI = 0.916, RMSEA = 0.073, SRMR = 0.057. The PEOU→PU path was comparatively stronger (β = 0.513), and the ATT → IU path reached its highest strength (β = 0.570). The PEOU→IU total effect (0.444) comprised 28.4% via chained mediation, 39.9% via PEOU→ATT → IU, and 31.8% via PEOU→PU → IU. The direct effect of PU → IU accounted for 52.8%, with the remaining 47.2% mediated. R2 values were PU = 0.264, ATT = 0.421, IU = 0.585.
For females, model fit was stronger: χ2(99) = 179.75, CFI = 0.968, RMSEA = 0.045, SRMR = 0.040. the PU → IU path showed higher magnitude (β = 0.432), and PEOU→ATT was more pronounced (β = 0.424). The total PEOU→IU effect (0.439) involved 13.6% via chained mediation, 43.4% via ATT, and 43.0% via PU → IU. PU → IU was primarily direct (76.1%), with 23.9% mediated. R2 values were: PU = 0.192, ATT = 0.384, IU = 0.579.
Gender comparisons revealed subtle variations in the relative strength of paths within the TAM framework. For males, intention to use was more strongly predicted by attitude, while for females, perceived usefulness played a more prominent direct role in shaping intention.
5 Discussion
This study provides psychometric evidence for a Technology Acceptance Model–based instrument developed to assess Chinese high school teachers’ acceptance of information technology.
The instrument demonstrated sound psychometric properties. The four-factor structure (PU, PEOU, ATT, IU) was supported by acceptable model fit, satisfactory standardized loadings, and adequate reliability coefficients. Convergent and discriminant validity were supported through AVE thresholds, inter-construct correlations, and HTMT ratios. These results suggest conceptual clarity and empirical distinctiveness among the four TAM constructs in this context, aligning with previous TAM validations in educational settings (e.g., Scherer et al., 2019; Teo, 2010a, 2010b; Hsieh et al., 2017).
The measurement model demonstrated strict measurement invariance across gender groups. Latent mean comparisons indicated only minor, non-significant differences with small effect sizes across constructs. Furthermore, additional analyses conducted across teaching subject groups (see Supplementary materials) also demonstrated full measurement invariance, reinforcing the scale’s robustness across key demographic variables within the educational context. These findings support the scale’s structural and substantive validity and suggest its appropriateness for the present educational context.
The structural model was consistent with the theoretical pathways proposed by TAM. Perceived ease of use was associated with both perceived usefulness and attitude; in turn, both perceived usefulness and attitude were significantly associated with intention to use. These patterns are consistent with prior TAM studies in educational contexts (Al-Emran and Granić, 2021; Scherer et al., 2019). Despite contextual differences, the PU–PEOU–ATT–IU pathway remained stable, indicating its relevance for understanding technology acceptance among Chinese high school teachers.
Structural equation modeling further supported the internal logic of the TAM framework. ATT was the strongest direct predictor of IU, and its mediating role was evident. The model’s explanatory capacity (R2 = 0.579), accounting for over half the variance in IU, aligns with meta-analytic results and recent findings showing that TAM-based models typically explain 40 to 66% of variance in usage intention (Al-Emran and Granić, 2021; Rad et al., 2022).
In addition, the validated instrument offers a theoretically grounded and contextually adapted tool for assessing teacher acceptance of technology in secondary education. The contextualization of item wording to reflect high school realities may enhance ecological validity while preserving conceptual consistency. The instrument holds potential for both future research and teacher development initiatives.
6 Limitations and future research
One recognized limitation of this study is the lack of age data, which precluded measurement invariance testing across age groups. However, to thoroughly evaluate the instrument’s generalizability across different teacher characteristics, we conducted and report in the Supplementary Tables 31–33, a comprehensive measurement invariance analysis based on teaching subject groupings (Core Academic, Natural Sciences, and Social Sciences). The results establish full measurement invariance across these subject groups, and latent mean comparisons revealed only minimal, practically negligible differences. This provides strong evidence for the scale’s validity and equivalence across the diverse subject specializations represented by our sample.
Additionally, although the item phrasing of the ITAS-HST is contextualized to the teaching reality of high school teachers, it measures the universal constructs of the TAM framework. The demonstrated psychometric properties and theoretical validity suggest that this scale can be adapted for use in different educational contexts, allowing for meaningful comparisons of teacher technology acceptance across diverse settings.
The data used to develop this scale were obtained through convenience sampling. From a statistical perspective, convenience sampling limits generalizability, but the results derived from these data meet recognized psychometric standards, making the scale a reliable tool for further research. Given its robust psychometric properties, the scale offers a valuable resource for future studies on teacher technology acceptance in various educational settings.
In recent years, artificial intelligence technology has developed rapidly and gradually integrated into educational contexts. Previous research has shown that the Technology Acceptance Model is applicable in AI-related studies (Ibrahim et al., 2025). As this technology continues to transform education, future work could adapt the ITAS-HST by adjusting item phrasing and incorporating additional constructs relevant to artificial intelligence technology contexts. This will enable the scale to be applied effectively to research on artificial intelligence technology acceptance in educational settings.
7 Conclusion
This study presents a TAM-based instrument demonstrating acceptable reliability, convergent and discriminant validity, and alignment with theoretical expectations. The structural integrity of the model was supported, with evidence of measurement invariance across gender groups. Developed to reflect the contextual realities of Chinese high schools, the instrument integrates conceptual rigor with contextual relevance. It provides a psychometrically sound and adaptable tool for future research and practical use in assessing teacher acceptance of educational technology.
Data availability statement
The raw data supporting the conclusions of this article will be made available by the authors, without undue reservation.
Ethics statement
The studies involving humans were approved by Research Ethics Committee, School of Education, Yunnan University, China. This study was conducted in accordance with the institutional ethical guidelines of the School of Education, Yunnan University. Formal ethics committee approval was not required for anonymous survey-based research involving adult participants. Written informed consent was obtained at the beginning of the questionnaire. The studies were conducted in accordance with the local legislation and institutional requirements. The participants provided their written informed consent to participate in this study.
Author contributions
GD: Writing – original draft, Writing – review & editing, Formal analysis, Supervision, Methodology, Conceptualization, Validation. YF: Writing – original draft, Data curation, Investigation, Project administration.
Funding
The author(s) declare that no financial support was received for the research and/or publication of this article.
Acknowledgments
We gratefully acknowledge the cooperation of the high school teachers who participated in the survey, and the support of the school leadership and institutions that facilitated data collection.
Conflict of interest
The authors declare that the research was conducted in the absence of any commercial or financial relationships that could be construed as a potential conflict of interest.
Generative AI statement
The author(s) declare that Gen AI was used in the creation of this manuscript. Generative AI (DeepSeek, ChatGPT) was used to assist with language polishing and grammar refinement. The authors reviewed and approved all AI-generated suggestions, and take full responsibility for the final content.
Any alternative text (alt text) provided alongside figures in this article has been generated by Frontiers with the support of artificial intelligence and reasonable efforts have been made to ensure accuracy, including review by the authors wherever possible. If you identify any issues, please contact us.
Publisher’s note
All claims expressed in this article are solely those of the authors and do not necessarily represent those of their affiliated organizations, or those of the publisher, the editors and the reviewers. Any product that may be evaluated in this article, or claim that may be made by its manufacturer, is not guaranteed or endorsed by the publisher.
Supplementary material
The Supplementary material for this article can be found online at: https://www.frontiersin.org/articles/10.3389/feduc.2025.1678302/full#supplementary-material
References
Al-Emran, M., and Granić, A. (2021). Is it still valid or outdated? A bibliometric analysis of the technology acceptance model and its applications from 2010 to 2020. In M. Al-Emran and K. Shaalan (eds.), Recent advances in technology acceptance models and theories (Studies in systems, decision and control). Springer, 35. doi: 10.1007/978-3-030-64987-6_1
Chen, F. F. (2007). Sensitivity of goodness of fit indexes to lack of measurement invariance. Struct. Equ. Model. 14, 464–504. doi: 10.1080/10705510701301834
Cheung, G. W., and Rensvold, R. B. (2002). Evaluating goodness-of-fit indexes for testing measurement invariance. Struct. Equ. Model. 9, 233–255. doi: 10.1207/S15328007SEM0902_5
Costello, A. B., and Osborne, J. (2005). Best practices in exploratory factor analysis: four recommendations for getting the most from your analysis. Pract. Assess. Res. Eval. 10, 1–9. doi: 10.7275/jyj1-4868
Davis, F. D. (1989). Perceived usefulness, perceived ease of use, and user acceptance of information technology. MIS Q. 13, 319–340. doi: 10.2307/249008
Davis, F. D., Bagozzi, R. P., and Warshaw, P. R. (1989). User acceptance of computer technology: a comparison of two theoretical models. Manag. Sci. 35, 982–1003. doi: 10.1287/mnsc.35.8.982
Fornell, C., and Larcker, D. F. (1981). Evaluating structural equation models with unobservable variables and measurement error. J. Mark. Res. 18, 39–50. doi: 10.1177/002224378101800104
Granić, A., and Marangunić, N. (2019). Technology acceptance model in educational context: a systematic literature review. Br. J. Educ. Technol. 50, 2572–2593. doi: 10.1111/bjet.12864
Hair, J. F., Black, W. C., Babin, B. J., and Anderson, R. E. (2010). Multivariate data analysis. 7th Edn. Upper Saddle River, NJ: Pearson Prentice Hall.
Henseler, J., Ringle, C. M., and Sarstedt, M. (2015). A new criterion for assessing discriminant validity in variance-based structural equation modeling. J. Acad. Mark. Sci. 43, 115–135. doi: 10.1007/s11747-014-0403-8
Hong, X., Zhang, M., and Liu, Q. (2021). Preschool teachers’ technology acceptance during the COVID-19: an adapted technology acceptance model. Front. Psychol. 12:691492. doi: 10.3389/fpsyg.2021.691492
Horn, J. L. (1965). A rationale and test for the number of factors in factor analysis. Psychometrika 30, 179–185. doi: 10.1007/BF02289447
Hsieh, J. S. C., Wu, W. C. V., and Marek, M. W. (2017). Using the flipped classroom to enhance EFL learning. Comput. Assist. Lang. Learn. 30, 1–21. doi: 10.1080/09588221.2015.1111910
Hu, L.-T., and Bentler, P. M. (1999). Cutoff criteria for fit indexes in covariance structure analysis: conventional criteria versus new alternatives. Struct. Equ. Model. 6, 1–55. doi: 10.1080/10705519909540118
Huang, F., Sánchez-Prieto, J. C., Teo, T., García-Peñalvo, F. J., Olmos-Migueláñez, S., and Zhao, C. (2021). A cross-cultural study on the influence of cultural values and teacher beliefs on university teachers' information and communications technology acceptance. Etr&D-Educ. Technol. Res. Dev. 69, 1271–1297. doi: 10.1007/s11423-021-09941-2
Ibrahim, F., Münscher, J.-C., Daseking, M., and Telle, N.-T. (2025). The technology acceptance model and adopter type analysis in the context of artificial intelligence. Front. Artif. Intell 7:1496518. doi: 10.3389/frai.2024.1496518
Jorgensen, T. D., Pornprasertmanit, S., Schoemann, A. M., and Rosseel, Y. (2025). semTools: useful tools for structural equation modeling. R package version 0.5-7. [computer software]. Available online at: https://CRAN.R-project.org/package=semTools
Kline, R. B. (2023). Principles and practice of structural equation modeling. 5th Edn. New York, NY: Guilford Press.
Mardia, K. V. (1970). Measures of multivariate skewness and kurtosis with applications. Biometrika 57, 519–530. doi: 10.1093/biomet/57.3.519
Marsh, H. W., Hau, K. T., and Wen, Z. (2004). In search of golden rules: comment on hypothesis-testing approaches to setting cutoff values for fit indexes and dangers in overgeneralizing Hu and Bentler’s (1999) findings. Struct. Equ. Model. 11, 320–341. doi: 10.1207/s15328007sem1103_2
Meredith, W. (1993). Measurement invariance, factor analysis and factorial invariance. Psychometrika 58, 525–543. doi: 10.1007/BF02294825
Ministry of Education of the People's Republic of China (2021). 教育部等六部门关于推进教育新型基础设施建设构建高质量教育支撑体系的指导意见 [guidance from six ministries including the Ministry of Education on promoting new educational infrastructure to build a high-quality education support system] (document no. Jiaokexin [2021] no. 2). Available online at: http://www.moe.gov.cn/srcsite/A16/s3342/202107/t20210720_545783.html
Ministry of Education of the People's Republic of China (2025a). 教育部等九部门关于加快推进教育数字化的意见 [guidance from nine ministries including the Ministry of Education on accelerating the advancement of educational digitalization] (document no. Jiaoban [2025] no. 3). Available online at:http://www.moe.gov.cn/srcsite/A01/s7048/202504/t20250416_1187476.html
Ministry of Education of the People's Republic of China (2025b). 关于组织实施数字化赋能教师发展行动的通知 [notice on organizing and implementing the digital empowerment of teacher development] (document no. Jiaoshiting [2025] no. 13). Available online at:http://www.moe.gov.cn/srcsite/A10/s7034/202507/t20250704_1196586.html
Oinas, S., Määttä, K., and Uusiautti, S. (2022). The use of digital tools in home-school communication: a qualitative study from Finnish comprehensive schools. Educ. Inf. Technol. 27, 10209–10230. doi: 10.1007/s10639-022-11054-7
Özbek, T., Wekerle, C., and Kollar, I. (2024). Fostering pre-service teachers' technology acceptance - does the type of engagement with tool-related information matter? Educ. Inf. Technol. 29, 6139–6161. doi: 10.1007/s10639-023-12047-2
Putnick, D. L., and Bornstein, M. H. (2016). Measurement invariance conventions and reporting: the state of the art and future directions for psychological research. Dev. Rev. 41, 71–90. doi: 10.1016/j.dr.2016.06.004
R Core Team. (2025). R: a language and environment for statistical computing (version 4.3.1) [computer software]. R foundation for statistical computing. Available online at:https://www.R-project.org/
Rad, D., Egerau, A., Roman, A., Dughi, T., Balas, E., Maier, R., et al. (2022). A preliminary investigation of the technology acceptance model (TAM) in early childhood education and care. BRAIN. Broad Res. Artif. Intell. Neurosci. 13, 518–533. doi: 10.18662/brain/13.1/297
Revelle, W. (2025). psych: procedures for personality and psychological research (version 2.5.6) [computer software]. Available online at:https://cran.r-project.org/package=psych
Rosseel, Y. (2012). Lavaan: an R package for structural equation modeling. J. Stat. Softw. 48, 1–36. doi: 10.18637/jss.v048.i02
Satorra, A., and Bentler, P. M. (2001). A scaled difference chi-square test statistic for moment structure analysis. Psychometrika 66, 507–514. doi: 10.1007/BF02296192
Scherer, R., Siddiq, F., and Tondeur, J. (2019). The technology acceptance model (TAM): a meta-analytic structural equation modeling approach to explaining teachers’ adoption of digital technology in education. Comput. Educ. 128, 13–35. doi: 10.1016/j.compedu.2018.09.009
Scherer, R., Siddiq, F., and Tondeur, J. (2020). All the same or different? Revisiting measures of teachers' technology acceptance. Comput. Educ. 143:103656. doi: 10.1016/j.compedu.2019.103656
Taherdoost, H. (2018). Development of an adoption model to assess user acceptance of e-service technology: E-service technology acceptance model. Behav. Inform. Technol. 37, 173–197. doi: 10.1080/0144929X.2018.1427793
Teo, T. (2010a). A path analysis of pre-service teachers' attitudes to computer use: applying and extending the technology acceptance model in an educational context. Interact. Learn. Environ. 18, 65–79. doi: 10.1080/10494820802231327
Teo, T. (2010b). The development, validation, and analysis of measurement invariance of the technology acceptance measure for preservice teachers (TAMPST). Educ. Psychol. Meas. 70, 990–1006. doi: 10.1177/0013164410378087
Teo, T., Lee, C. B., and Chai, C. S. (2008). Understanding pre-service teachers' computer attitudes: applying and extending the technology acceptance model. J. Comput. Assist. Learn. 24, 128–143. doi: 10.1111/j.1365-2729.2007.00247.x
Teo, T., and Noyes, J. (2011). An assessment of the influence of perceived enjoyment and attitude on the intention to use technology among pre-service teachers: a structural equation modeling approach. Comput. Educ. 57, 1645–1653. doi: 10.1016/j.compedu.2011.03.002
UNESCO (2022). Global education monitoring report 2022: Technology in education—A tool on whose terms? UNESCO.
Vandenberg, R. J., and Lance, C. E. (2000). A review and synthesis of the measurement invariance literature: suggestions, practices, and recommendations for organizational research. Organ. Res. Methods 3, 4–69. doi: 10.1177/109442810031002
Venkatesh, V., and Bala, H. (2008). Technology acceptance model 3 and a research agenda on interventions. Decis. Sci. 39, 273–315. doi: 10.1111/j.1540-5915.2008.00192.x
Venkatesh, V., and Davis, F. D. (2000). A theoretical extension of the technology acceptance model: four longitudinal field studies. Manag. Sci. 46, 186–204. doi: 10.1287/mnsc.46.2.186.11926
Venkatesh, V., Morris, M. G., Davis, G. B., and Davis, F. D. (2003). User acceptance of information technology: toward a unified view. MIS Q. 27, 425–478. doi: 10.2307/30036540
Venkatesh, V., Thong, J. Y. L., and Xu, X. (2016). Unified theory of acceptance and use of technology: a synthesis and the road ahead. J. Assoc. Inf. Syst. 17, 328–376. doi: 10.17705/1jais.00428
Keywords: information technology acceptance, high school teacher, psychometric properties, measurement invariance, latent mean comparisons
Citation: Dou G and Feng Y (2025) Psychometric validation of the information technology acceptance scale for Chinese high school teacher. Front. Educ. 10:1678302. doi: 10.3389/feduc.2025.1678302
Edited by:
Azliza Binti Yacob, TATI University College, MalaysiaReviewed by:
Yuane Jia, The State University of New Jersey, United StatesÖzlem Gökçe Tekin, Independent Researcher, Kahramanmaraş, Türkiye
Copyright © 2025 Dou and Feng. This is an open-access article distributed under the terms of the Creative Commons Attribution License (CC BY). The use, distribution or reproduction in other forums is permitted, provided the original author(s) and the copyright owner(s) are credited and that the original publication in this journal is cited, in accordance with accepted academic practice. No use, distribution or reproduction is permitted which does not comply with these terms.
*Correspondence: Gang Dou, ZG91Z2FuZ0Bob3RtYWlsLmNvbQ==