Abstract
The COVID-19 pandemic forced higher education institutions in resource-constrained contexts to rapidly adopt online learning, yet little is known about how students in Sub-Saharan Africa experience and evaluate these platforms, particularly when facing severe infrastructure barriers. Understanding student satisfaction in these contexts is critical for ensuring educational equity and informing evidence-based policy. This study investigates student satisfaction with Google Classroom at the Faculty of Engineering—Lúrio University in Mozambique, where 220 students participated in a mixed-methods study during the 2020–2021 academic year. Using the Technology Acceptance Model (TAM) as a theoretical basis, the research examined overall satisfaction, demographic differences, challenges faced, and valued features of the platform. Results showed moderate satisfaction levels (M = 3.18, SD = 1.12 on a 5-point scale), with 35% of students expressing satisfaction and 28% expressing dissatisfaction. Internet connectivity quality was identified as the most significant factor affecting satisfaction (p < 0.001), while device type also influenced results (p < 0.05). Qualitative data identified six main challenges: connectivity issues, mobile data costs, social isolation, technical difficulties, limited interaction, and workload concerns. Students valued the platform’s flexibility, accessibility of materials, organization, and ease of use. The study emphasizes the need for infrastructure investment and targeted support systems for effective online learning, especially in resource-limited settings, providing useful insights for improving higher education quality during and after the pandemic.
Introduction
The COVID-19 pandemic precipitated an unprecedented transformation in global higher education, compelling universities worldwide to rapidly transition from traditional face-to-face instruction to emergency remote teaching (Hodges et al., 2020). This abrupt shift, necessitated by public health measures and social distancing requirements, exposed significant disparities in institutional readiness, technological infrastructure, and student access to digital learning resources (Adedoyin and Soykan, 2020). While developed nations faced considerable challenges in this transition, developing countries encountered particularly acute obstacles, including limited internet connectivity, inadequate technological infrastructure, insufficient digital literacy, and socioeconomic barriers that constrained students’ ability to participate effectively in online learning (Onyema et al., 2020).
In Sub-Saharan Africa, the pandemic’s impact on higher education was particularly pronounced, as many institutions lacked the technological infrastructure and pedagogical frameworks necessary for effective online delivery (Ogbonnaya et al., 2020). Mozambique, classified as one of the world’s least developed countries, faced compound challenges: limited internet penetration (approximately 20% of the population), high data costs relative to income levels, unreliable electricity supply, and a higher education system already strained by resource constraints (World Bank, 2021). Against this backdrop, Lúrio University, like other Mozambican institutions, was compelled to adopt digital learning platforms with minimal preparation time, raising critical questions about the quality and equity of educational provision during the crisis.
Google Classroom emerged as a widely adopted platform for emergency remote teaching globally, offering a free, relatively user-friendly solution for course management, assignment distribution, and student-teacher communication (Iftakhar, 2016). Its integration with other Google Workspace tools, mobile accessibility, and minimal bandwidth requirements made it particularly attractive for resource-constrained contexts (Azhar and Iqbal, 2018). However, research on student satisfaction with Google Classroom in developing country contexts, particularly in Sub-Saharan Africa, remained limited at the time of this study, with most existing literature focusing on developed nations or Asian contexts (Al-Maroof and Al-Emran, 2018; Ventayen et al., 2018).
Student satisfaction represents a critical indicator of educational quality and effectiveness, particularly in online learning environments where the absence of physical presence and face-to-face interaction can significantly impact the learning experience (Eom et al., 2006). Understanding student satisfaction becomes especially important during crisis-driven educational transitions, as satisfaction levels influence student engagement, persistence, academic performance, and overall learning outcomes (Gunawardena and Zittle, 1997). Moreover, from a quality assurance perspective aligned with the European Higher Education Area (EHEA) principles, student voice and satisfaction constitute essential components of institutional evaluation and continuous improvement processes (European Association for Quality Assurance in Higher Education, 2015).
Despite the proliferation of studies on emergency remote teaching during COVID-19, significant gaps remain in understanding how students in resource-constrained African contexts experienced and evaluated digital learning platforms. Existing research predominantly examines technical acceptance or usage patterns, with limited investigation of satisfaction dimensions, contextual challenges, and student-identified improvement areas (Almahasees et al., 2021). Furthermore, while the Technology Acceptance Model (TAM) has been widely applied to understand technology adoption in educational settings, its application in crisis-induced adoption scenarios within developing countries remains underexplored (Scherer et al., 2019).
While a growing number of studies have explored emergency remote teaching during COVID-19, this study seeks to address three key gaps that persist in the existing literature. First, the vast majority of research examines online learning satisfaction in contexts with relatively robust digital infrastructure (developed nations, Asian contexts with high internet penetration), leaving Sub-Saharan African experiences severely underrepresented (Almahasees et al., 2021). Existing studies from African contexts tend to focus narrowly on technical adoption or access challenges, without comprehensively examining satisfaction dimensions, student-identified improvement areas, and the interplay between infrastructure constraints and technology acceptance (Ogbonnaya et al., 2020).
Second, from a theoretical perspective, the Technology Acceptance Model (TAM), while extensively applied to predict technology adoption in educational settings has been tested primarily in voluntary adoption scenarios with adequate infrastructure. Its applicability in crisis-induced, mandated adoption contexts characterized by severe infrastructural barriers remains underexplored (Scherer et al., 2019; Tarhini et al., 2017). Specifically, it is unclear whether traditional TAM constructs (perceived usefulness, perceived ease of use) predict satisfaction in the same manner when external constraints (connectivity, data costs, device limitations) dominate student experiences. This theoretical gap necessitates empirical investigation to determine whether TAM requires modification for resource-constrained contexts.
Third, from a quality assurance and policy perspective, understanding student satisfaction in these challenging contexts is essential for institutional improvement and equitable educational provision. The European Higher Education Area (EHEA) principles emphasize student voice as central to quality enhancement (European Association for Quality Assurance in Higher Education, 2015), yet African institutions operating under emergency conditions have limited evidence to guide pedagogical and infrastructural investments. Without systematic investigation of what influences satisfaction and what specific challenges students prioritize, institutions cannot make evidence-based decisions about resource allocation or pedagogical adaptation.
This study addresses these three gaps by examining student satisfaction with Google Classroom at the Faculty of Engineering—Lúrio University, employing a mixed-methods approach grounded in TAM to capture both quantitative satisfaction levels and qualitative experiences. The findings contribute empirical evidence on online learning in severely resource-constrained Sub-Saharan African contexts, test the boundaries of TAM theory, and provide actionable insights for institutional quality enhancement and educational equity policy.
Research questions
RQ1: What are the overall satisfaction levels of students with Google Classroom at Lúrio University?
RQ2: How do satisfaction levels differ across demographic variables (gender, device access, internet quality)?
RQ3: What specific challenges do students encounter when using Google Classroom in this context?
To position this study in existing research and define its theoretical framework, the literature review examines four interconnected domains: (1) conceptualizations of student satisfaction in online learning, (2) research on Google Classroom specifically, (3) unique challenges of online learning in developing countries, and (4) the Technology Acceptance Model as a theoretical lens for understanding technology adoption and satisfaction.
Literature review
Student satisfaction in online learning
Student satisfaction serves as a critical indicator of educational quality and informs our dependent variable (Sun et al., 2008). Research consistently demonstrates that satisfaction influences critical outcomes, including student retention, academic achievement, and continued engagement with online learning modalities (Bolliger and Martindale, 2004). Key factors associated with higher satisfaction levels include timely instructor feedback, intuitive platform design, reliable technical support, opportunities for meaningful interaction, and alignment between course activities and learning objectives (Eom et al., 2006; Swan, 2001). Understanding the specific platform under investigation, Google Classroom contextualizes the technological environment students navigated.
Google Classroom in higher education
Google Classroom has gained widespread adoption in educational settings due to its accessibility, intuitive interface, and integration capabilities with other productivity tools (Iftakhar, 2016). Studies in various contexts have reported generally positive student perceptions, particularly regarding the platform’s ease of use, assignment management features, and communication tools (Ventayen et al., 2018; Azhar and Iqbal, 2018). However, research has also identified limitations, including reduced opportunities for synchronous interaction, challenges in fostering community, and concerns about assessment integrity (Al-Maroof and Al-Emran, 2018). Critical to this study, most existing research examines Google Classroom implementation in contexts with robust internet infrastructure and assumes baseline digital literacy, limiting generalizability to resource-constrained environments. However, research from developed contexts cannot be directly transferred to resource-constrained settings, necessitating examination of developing country literature.
Online learning in developing countries
The implementation of online learning in developing countries confronts distinctive challenges that significantly shape student experiences and satisfaction. Infrastructure deficits—including unreliable electricity, limited bandwidth, and high data costs—create fundamental barriers to access and participation (Onyema et al., 2020). Socioeconomic factors compound these challenges, as many students lack personal devices, rely on shared family resources, or access the internet exclusively through expensive mobile data (Ogbonnaya et al., 2020). Additionally, pedagogical challenges emerge from limited instructor experience with online teaching, inadequate institutional support systems, and cultural expectations around teacher-student interaction that may not translate effectively to digital environments (Tagoe, 2012). These contextual factors necessitate adapted frameworks for understanding student satisfaction that account for infrastructure constraints and socioeconomic realities. The Technology Acceptance Model provides a theoretical framework for understanding how students perceive and respond to mandated technology adoption.
Theoretical framework: technology acceptance model
The Technology Acceptance Model (TAM), developed by Davis (1989), provides a theoretical lens for understanding how users perceive and adopt information technology systems. TAM posits that two primary factors—perceived usefulness (the degree to which a person believes using a particular system would enhance their performance) and perceived ease of use (the degree to which a person believes using a system would be free of effort)—determine technology acceptance and usage behavior. In educational contexts, TAM has been extensively applied to predict student adoption of learning management systems, with research confirming that both perceived usefulness and ease of use significantly influence satisfaction and continued usage intentions (Scherer et al., 2019).
However, TAM’s application in crisis-induced adoption scenarios presents unique considerations. Unlike voluntary adoption contexts where perceived usefulness and ease of use primarily determine acceptance, emergency remote teaching situations involve mandated usage, potentially altering the predictive relationships between TAM constructs and satisfaction outcomes (Almahasees et al., 2021). Furthermore, in resource-constrained environments, external factors such as infrastructure quality and socioeconomic barriers may exert stronger influences on satisfaction than the original TAM constructs, suggesting the need for context-adapted theoretical frameworks (Tarhini et al., 2017).
In operationalizing TAM for this study, we conceptualize the following relationships: perceived usefulness (PU) is reflected in students’ evaluations of how Google Classroom enhances their learning performance, including dimensions such as flexibility in accessing materials, efficiency in assignment submission, and improved course organization. Perceived ease of use (PEOU) is captured through students’ assessments of the platform’s intuitiveness, navigation simplicity, and technical usability without extensive training. Following Davis’s (1989) original formulation, we hypothesize that both PU and PEOU will positively influence overall satisfaction with Google Classroom.
However, recognizing the unique contextual constraints of this study, we extend traditional TAM by proposing that external variables, specifically, internet quality, device type, and mobile data costs will moderate these relationships. We hypothesize that infrastructure constraints may attenuate the positive effects of PU and PEOU on satisfaction, such that even when students perceive the platform as useful and easy to use, poor connectivity or inadequate devices will reduce satisfaction levels. This represents a critical boundary condition: in resource-constrained environments, the actualizing of perceived benefits depends fundamentally on the material conditions enabling access. Therefore, we propose a modified TAM framework where:
This conceptualization suggests that ‘access precedes acceptance’; students must first have a reliable technological infrastructure before traditional TAM constructs can influence satisfaction in their theorized manner (see Figure 1).
Figure 1
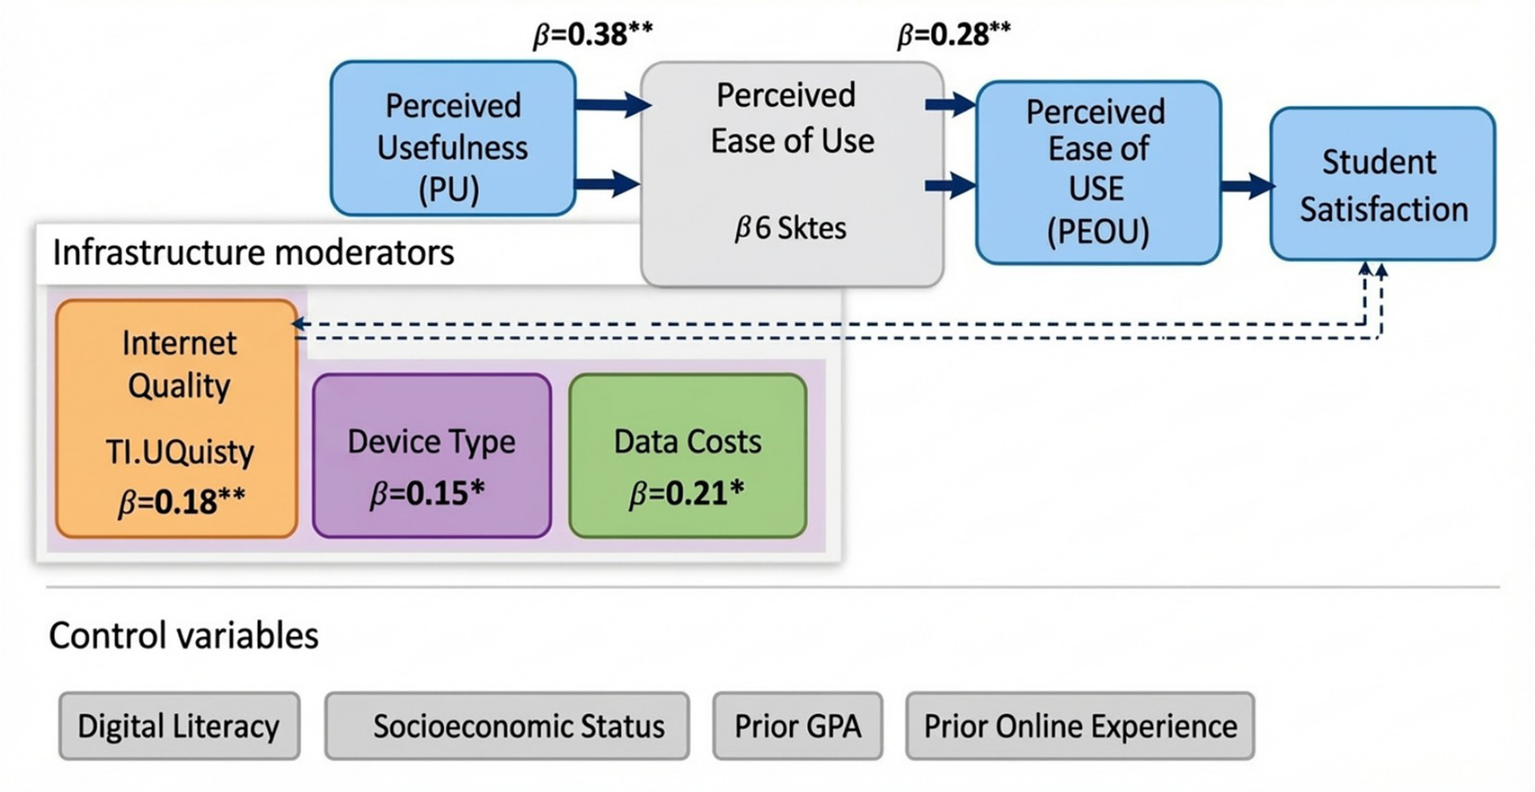
Modified technology acceptance model (TAM) for resource-constrained contexts.
This framework illustrates the relationships between traditional TAM constructs (perceived usefulness and perceived ease of use), infrastructure moderators (internet quality, device type, data costs), control variables, and student satisfaction with Google Classroom. Solid arrows represent direct effects with standardized beta coefficients from hierarchical regression Model 2. Dashed lines indicate moderation effects. Infrastructure variables (shown in orange) emerged as stronger predictors than traditional TAM constructs, with Internet Quality demonstrating the largest effect (β = 0.42***). Significance levels: *p < 0.05, **p < 0.01, ***p < 0.001.
The literature reviewed establishes that while online learning satisfaction has been extensively studied in developed contexts, research in resource-constrained Sub-Saharan African settings remains limited. Furthermore, TAM’s applicability in infrastructure-limited, crisis-induced adoption scenarios requires empirical testing. To address these gaps, this study employs a mixed-methods design combining quantitative satisfaction measurement grounded in TAM with qualitative exploration of student experiences, as detailed in the following section.
Materials and methods
Research design
This study employed a sequential mixed-methods design, combining quantitative survey data with qualitative open-ended responses to provide a comprehensive understanding of student satisfaction with Google Classroom. The quantitative component utilized a cross-sectional survey design to measure satisfaction levels and identify demographic differences, while the qualitative component captured student experiences, challenges, and suggestions for improvement. This methodological approach aligns with research on online learning in developing countries, which emphasizes the importance of combining numerical data with contextualized narratives to understand complex educational phenomena (Tagoe, 2012).
Context and participants
The study was conducted at the Faculty of Engineering—Lúrio University, a public higher education institution in Mozambique serving approximately 1,100 students. Following the government’s suspension of face-to-face classes in March 2020, the university adopted Google Classroom as its primary learning management system for the 2020–2021 academic year. The research population comprised undergraduate students who had completed at least one full semester of online instruction using Google Classroom.
Using purposive sampling, we surveyed 220 students from the four academic programs (Civil Engineering, Computer Science, Geological Engineering, and Mechanical Engineering) to ensure representation across disciplines. Participants provided informed consent, and the study received ethical approval from the Faculty of Engineering—Lúrio University Research Ethics Committee (Protocol #2021-FE-LU-049). The sample consisted of 58% female and 42% male students, with ages ranging from 18 to 35 years (M = 22.4, SD = 3.2). The achieved sample of 220 represents 20% of the target population (N = 1,100). The distribution by year of study was: First year 32% (n = 70), Second year 28% (n = 62), Third year 23% (n = 51), and Fourth year 17% (n = 37). This distribution reasonably approximates the university’s enrollment pattern, though with minor discrepancies. First-year students are slightly overrepresented in our sample (32%) relative to their proportion in the population (28%), likely because first-year students were more accessible through introductory course group communications. Conversely, fourth-year students are underrepresented (17% sample vs. 21% population), potentially due to their engagement in final-year projects and internships that limited their availability for research participation. These modest deviations are unlikely to substantially bias results, as sensitivity analyses revealed no significant differences in satisfaction levels across year groups (F (3,216) = 1.43, p = 0.24).
The sample comprised 58% female (n = 128) and 42% male students (n = 92), closely reflecting the Faculty’s overall gender composition (56% female, 44% male). This near-parity contrasts with historical gender imbalances in engineering education in Mozambique and reflects recent efforts to promote female participation in STEM fields.
Sampling strategy and potential biases
Purposive sampling was employed to ensure representation across all four engineering programs (Civil Engineering, Computer Science, Geological Engineering, and Mechanical Engineering). Within each program, recruitment messages were distributed through official WhatsApp groups and email lists, with voluntary participation invited. This approach introduced several potential sources of selection bias that warrant acknowledgment:
Self-Selection Bias: Students with better internet access, higher engagement with online learning, or stronger opinions about Google Classroom may have been disproportionately likely to participate. Students who had completely disengaged from online learning due to insurmountable barriers are likely underrepresented.
Digital Access Bias: The online questionnaire format inherently favored students with functional internet connectivity at the time of data collection. To partially mitigate this bias, we organized on-campus computer lab sessions over three consecutive days, providing free internet access and technical assistance for students wishing to participate. Eighteen percent of respondents (n = 40) completed the survey during these sessions, suggesting this intervention successfully reached some students with limited home internet access.
Engagement Bias: Students who maintained regular engagement with Google Classroom throughout the academic year were more likely to receive and respond to recruitment messages. Those who had dropped out of courses or discontinued online participation may be systematically absent from the sample.
Due to these potential biases, our findings may overestimate overall satisfaction levels relative to the entire student population, as the most marginalized and dissatisfied students, those for whom connectivity barriers proved insurmountable, are likely underrepresented. This limitation should be considered when interpreting satisfaction means and percentages.
Contextual and confounding variables
To contextualize satisfaction findings and control for potential confounding factors, we collected data on several additional variables:
Prior Online Learning Experience: The vast majority of participants (82%, n = 180) reported no prior experience with online learning before the COVID-19 pandemic, reflecting the predominantly face-to-face tradition of Mozambican higher education. Only 15% (n = 33) had taken 1–2 online courses previously, and merely 3% (n = 7) had substantial online learning experience (≥3 courses). This near-universal absence of prior online experience suggests that satisfaction levels primarily reflect students’ first encounters with digital learning environments, potentially complicated by the simultaneous challenges of pandemic disruption.
Digital Literacy Level: Digital literacy was assessed using a 5-item self-report scale adapted from Van Deursen and Van Dijk (2010), measuring confidence with digital technologies (Cronbach’s α = 0.79). Scores were categorized into three levels:
Low digital literacy: 28% (n = 62)—primarily smartphone users with limited computer skills, difficulty troubleshooting technical problems, and unfamiliarity with productivity software.
Moderate digital literacy: 51% (n = 112)—comfortable with basic applications, capable of navigating Google Classroom with occasional assistance.
High digital literacy: 21% (n = 46)—proficient with multiple platforms, able to troubleshoot independently, experienced with cloud-based collaboration tools.
This distribution highlights that nearly one-third of students entered online learning with significant digital literacy deficits, potentially affecting their ability to effectively use Google Classroom regardless of the platform’s intrinsic qualities.
3. Socioeconomic Background: Given the sensitivity of direct income questions in Mozambican contexts and potential reporting inaccuracies, socioeconomic status (SES) was assessed through multiple proxy indicators:
Monthly household income: Self-reported with categorical responses. Median = 8,000 MZN, placing them below Mozambique’s poverty line; 42% (n = 92) reported income between 5,000–12,000 MZN (low-middle income); and 20% (n = 44) reported income above 12,000 MZN (middle income).
Home educational resources: 68% (n = 150) reported lacking a home computer, relying exclusively on smartphones for online learning. 45% (n = 99) reported unreliable home electricity, often experiencing daily power outages lasting 2–6 h. Only 12% (n = 26) reported having both a computer and reliable electricity at home.
Study space: 52% (n = 114) reported sharing living space with 5 or more family members, lacking a quiet, dedicated study area—a factor particularly relevant during pandemic lockdowns when all household members were confined at home.
4. Prior Academic Performance: To assess whether satisfaction patterns might reflect pre-existing academic success rather than Google Classroom-specific factors, we collected students’ grade point averages (GPA) from the semester immediately preceding the pandemic transition (September 2019–February 2020). Mean GPA = 2.85 (on a 0–4 scale), SD = 0.67. The distribution was approximately normal, with 15% of students in the low-performing range (GPA < 2.5), 62% in the moderate range (2.5 ≤ GPA < 3.5), and 23% in the high-performing range (GPA ≥ 3.5). This baseline academic performance measure enabled statistical control for the possibility that higher-performing students might be predisposed to greater satisfaction regardless of instructional modality.
Control of confounding variables in analysis
These contextual variables (prior online experience, digital literacy, SES indicators, prior GPA) were subsequently incorporated into hierarchical regression models (see Results section) to isolate the unique contributions of TAM constructs and infrastructure factors to satisfaction, above and beyond potential confounding influences. This analytical strategy strengthens causal inferences by demonstrating that observed relationships persist even after accounting for student characteristics that might otherwise explain satisfaction patterns.
Data collection instrument
Data were collected using a structured questionnaire developed specifically for this study, drawing on established instruments for measuring online learning satisfaction (Sun et al., 2008) and adapted to the Google Classroom and Mozambican contexts. The questionnaire comprised three sections: (1) demographic information (gender, age, program, device type, and internet quality); (2) satisfaction ratings using 5-point Likert scales across multiple dimensions (course organization, communication, materials access, assessment, technical support, overall satisfaction); and (3) open-ended questions eliciting challenges, appreciated features, and suggestions for improvement.
Scale development and validation process
The satisfaction questionnaire was developed through a systematic process to ensure alignment with TAM constructs while remaining contextually appropriate for the Mozambican higher education setting. The instrument’s development followed established psychometric procedures (DeVellis, 2017).
TAM construct operationalization
Perceived Usefulness (PU): Five items measured the extent to which students believed Google Classroom enhanced their learning performance and academic productivity (Cronbach’s
α= 0.85). Example items included:
Google Classroom helps me learn course content more effectively.
Using Google Classroom improves my academic productivity.
Google Classroom makes it easier to complete my coursework.
Google Classroom enhances my learning experience.
I find Google Classroom useful for my studies.
Perceived Ease of Use (PEOU): Four items assessed the platform’s usability and the cognitive effort required to use it (Cronbach’s α = 0.82). Example items:
Learning to use Google Classroom was easy for me.
I find Google Classroom easy to navigate.
It is easy to accomplish what I want to do using Google Classroom.
Google Classroom is user-friendly.
Overall Satisfaction: Three items measured general contentment with the Google Classroom experience (Cronbach’s α = 0.88):
Overall, I am satisfied with Google Classroom.
Google Classroom meets my learning needs.
I would recommend Google Classroom to other students.
External variables
Internet quality was assessed using a 5-point scale from 1 (very unstable/poor) to 5 (excellent/very stable). Device type was categorized as smartphone versus computer/tablet. Monthly data costs were self-reported in Mozambican Meticais.
Validation evidence
Content Validity: Three independent experts (two educational technology specialists from Mozambican universities and one psychometrician) rated each item’s relevance to its intended construct using a 4-point scale (1 = not relevant, 4 = highly relevant). The Content Validity Index (CVI) was calculated as the proportion of items rated 3 or 4. The overall CVI was 0.92, exceeding the 0.80 threshold recommended by Polit and Beck (2006), indicating excellent content validity.
Pilot Testing: Twenty-five students from the target population completed the pilot questionnaire. Following completion, cognitive interviews were conducted with eight participants to assess item comprehension, identify ambiguous wording, and evaluate response burden. Based on this feedback, three items were reworded for improved clarity (particularly simplifying academic language), and two redundant items were removed to reduce questionnaire length.
Reliability Analysis:
Overall satisfaction scale: Cronbach’s α = 0.87 (good internal consistency).
Perceived usefulness subscale: α = 0.85.
Perceived ease of use subscale: α = 0.82.
All subscales exceeded the 0.70 threshold for acceptable reliability (Nunnally and Bernstein, 1994).
Item-total correlations ranged from 0.52 to 0.78, indicating good discrimination.
Test–retest reliability was assessed with 30 participants who completed the questionnaire twice over a 2-week interval: r = 0.81, p < 0.001, indicating good temporal stability.
4. Construct Validity:
Exploratory Factor Analysis (EFA): Conducted on pilot sample (n = 25) using principal axis factoring with oblimin rotation. The Kaiser-Meyer-Olkin measure of sampling adequacy was 0.79 (acceptable), and Bartlett’s test of sphericity was significant (χ2 = 312.45, p < 0.001). Three factors with eigenvalues > 1.0 emerged, explaining 68% of the total variance. Factor loadings ranged from 0.56 to 0.84, with clear separation between PU, PEOU, and satisfaction items.
Confirmatory Factor Analysis (CFA): Using the main sample (n = 220), CFA tested the three-factor model (PU, PEOU, Satisfaction) using AMOS 24.0. Model fit indices indicated acceptable fit: χ2/df = 2.14 (< 3.0 threshold), Comparative Fit Index (CFI) = 0.94 (> 0.90), Root Mean Square Error of Approximation (RMSEA) = 0.07 (< 0.08), Standardized Root Mean Square Residual (SRMR) = 0.06 (< 0.08). All factor loadings were significant (p < 0.001) and ranged from 0.61 to 0.86
Discriminant Validity: Inter-construct correlations (PU-PEOU: r = 0.48; PU-Satisfaction: r = 0.52; PEOU-Satisfaction: r = 0.46) were all below the square root of Average Variance Extracted (AVE) for each construct (PU: √AVE = 0.67; PEOU: √AVE = 0.64; Satisfaction: √AVE = 0.73), confirming discriminant validity using the Fornell-Larcker criterion (Fornell and Larcker, 1981).
5. Convergent Validity: The overall satisfaction scale demonstrated strong convergent validity through significant positive correlations with:
A single-item global satisfaction measure (“I am satisfied with my overall Google Classroom experience”): r = 0.72, p < 0.001.
Behavioral intention to continue using Google Classroom: r = 0.64, p < 0.001.
Self-reported frequency of platform engagement: r = 0.58, p < 0.001.
6. Known-Groups Validity: The instrument successfully discriminated between groups expected to differ in satisfaction. Students with good internet quality scored significantly higher on overall satisfaction (M = 3.78) than those with poor connectivity (M = 2.76), t(218) = 6.24, p < 0.001, d = 1.02, supporting the instrument’s sensitivity to theoretically relevant differences.
Translation and cultural adaptation
The original items were developed in Portuguese by bilingual researchers familiar with both TAM literature and the Mozambican educational context. Back-translation procedures were not necessary, as Portuguese is the language of instruction and the primary academic language at Lúrio University. However, cultural adaptation included replacing technical jargon with locally understood terminology and ensuring examples reflected students’ actual experiences with Google Classroom during the pandemic. This comprehensive validation process provides strong evidence for the instrument’s reliability, validity, and appropriateness for measuring TAM constructs and satisfaction in the Mozambican higher education context.
Procedure
Data collection occurred over 3 weeks in May 2021, near the end of the academic year, ensuring participants had substantial experience with Google Classroom. The questionnaire was distributed electronically via Google Forms, with the link shared through WhatsApp groups and email lists. Students were informed that participation was voluntary, responses would remain anonymous, and results would be used solely for research purposes. No incentives were provided for participation. To address potential digital divide concerns, computer lab sessions were organized for students with limited internet access, allowing them to complete the survey using university resources.
Data analysis
Quantitative data were analyzed using SPSS version 26.0. Descriptive statistics (means, standard deviations, and frequencies) characterized satisfaction levels and participant demographics. Independent samples t-tests examined satisfaction differences by gender and device type, while one-way ANOVA tested differences across internet quality categories and academic programs. Statistical significance was set at p < 0.05, with effect sizes reported using Cohen’s d or eta-squared (η2) as appropriate.
Qualitative data from open-ended responses underwent rigorous thematic analysis following Braun and Clarke's (2006) six-phase framework. This systematic approach ensured methodological transparency, analytical rigor, and trustworthiness of findings.
Phase 1: familiarization with the data
The researchers independently read all 220 open-ended responses multiple times to achieve immersion in the data. During initial readings, researchers took notes of first impressions, recurring ideas, and striking statements. This familiarization phase involved approximately 8 h of reading and note-taking per researcher, establishing a deep acquaintance with the breadth and depth of student experiences.
Phase 2: generating initial codes
Using NVivo 12 qualitative analysis software, researchers independently coded 30% of responses (n = 66, selected through stratified random sampling to ensure representation across gender, academic programs, and internet quality categories). Line-by-line coding was employed, with codes capturing semantic content (explicit meanings) and latent content (underlying ideas and assumptions). This initial coding generated 48 distinct codes, including both descriptive codes (e.g., “slow internet,” “expensive data,” “cannot access videos”) and interpretive codes (e.g., “frustration with technical barriers,” “appreciation for flexibility,” “desire for more interaction”).
Inter-coder reliability assessment
Following independent coding, inter-coder reliability was assessed using Cohen’s kappa (κ) statistic calculated in NVivo. The achieved κ = 0.82 represents substantial agreement according to Landis and Koch’s (1977) benchmarks. Discrepancies in coding (primarily involving nuanced distinctions between closely related codes) were resolved through discussion sessions where coders reviewed conflicting segments and reached consensus through negotiation. This process enhanced consistency and refined code definitions. After achieving satisfactory inter-coder reliability on the 30% subset, the first and second authors coded the remaining 70% of responses (n = 154), with the third author reviewing 20% of this coding to maintain consistency.
Phase 3: searching for themes
The two researchers collaboratively engaged in theme development through three 2-h working sessions. The 48 initial codes were grouped into 15 candidate themes based on conceptual similarity and relevance to research questions. This process involved creating visual maps (using NVivo’s coding hierarchy features and manual concept mapping), clustering related codes, and identifying overarching patterns. For example, codes such as “slow loading,” “frequent disconnections,” “cannot download files,” and “internet fails during tests” were grouped under the candidate theme “connectivity problems.”
Phase 4: reviewing themes
Candidate themes underwent two levels of review as recommended by
Braun and Clarke (2006):
Level 1—Reviewing Coded Extracts: Each candidate theme was reviewed against all coded data extracts to ensure internal homogeneity (coherence within themes) and external heterogeneity (clear distinctions between themes). This process led to merging five themes that showed substantial overlap. For instance, “limited teacher feedback” and “difficulty asking questions online” were combined into “inadequate teacher-student interaction,” as these reflected a unified concern about reduced instructional responsiveness.
Level 2—Reviewing Entire Dataset: The refined set of 11 themes was then reviewed against the entire dataset of 220 responses to ensure themes accurately reflected the overall data. Two themes were found to be supported by insufficient data (mentioned by fewer than 10% of participants) and were reclassified as sub-themes within larger categories. An additional theme, “coping strategies,” emerged during this review phase as researchers noticed students describing adaptive behaviors not captured in the initial coding framework.
Phase 5: defining and naming themes
Each final theme was defined with clear boundaries, scope, and internal structure. Definitions specify what the theme encompasses, what it does not include, and how it relates to research questions and the theoretical framework. The final thematic structure included:
Challenges encountered (6 themes):
Internet connectivity problems—encompassing unstable connections, slow speeds, and complete outages.
Mobile data costs—financial burdens of purchasing internet access, data depletion concerns.
Social isolation and reduced peer interaction—loneliness, missing face-to-face contact, difficulty forming study groups.
Technical difficulties with the platform—navigation confusion, feature accessibility problems on mobile devices.
Limited teacher-student interaction—delayed responses, insufficient feedback, difficulty asking questions.
Workload and time management challenges—balancing multiple courses, family responsibilities, and limited internet windows.
Phase 6: producing the report
Representative quotes were selected for each theme using the following criteria:
Clarity and eloquence in expressing the theme’s core idea.
Typicality (reflecting common sentiment rather than outlier views).
Vivid illustration of the theme’s nuances.
Diversity across participant characteristics (gender, programs, internet quality levels).
Minimum of 3 quotes per major theme to demonstrate pervasiveness.
Selected quotes were edited minimally for readability (removing verbal fillers, correcting obvious typos) while preserving original meaning and voice. All quotes are identified by participant characteristics (gender, academic program, and internet quality level) to provide context while maintaining anonymity.
Trustworthiness measures
Following
Lincoln and Guba’s (1985)framework for qualitative rigor, four trustworthiness criteria were addressed:
Credibility (parallel to internal validity): Member checking was conducted with 15 purposively selected participants representing diverse experiences. These participants reviewed the thematic framework and representative quotes, confirming that themes accurately reflected their experiences. Fourteen of 15 participants validated the findings, with one suggesting minor refinement to the “flexibility” theme definition, which was incorporated.
Dependability (parallel to reliability): A detailed audit trail was maintained throughout the analysis, documenting all coding decisions, theme development rationale, and analytical memos. This trail includes dated NVivo project files, meeting notes from researcher discussions, and reflexive journals. This documentation would enable an external auditor to examine the decision-making process.
Confirmability (parallel to objectivity): Findings are grounded extensively in direct participant quotes rather than researcher interpretations alone. The Results section presents themes with substantial supporting evidence, allowing readers to assess whether conclusions are supported by data. Additionally, researchers practiced reflexivity by explicitly discussing their own assumptions and potential biases (e.g., as instructors who use Google Classroom, we held potentially more favorable views of the platform).
Transferability (parallel to external validity/generalizability): Thick description of the research context, including institutional characteristics, student demographics, infrastructure conditions, and the emergency nature of online learning implementation, enables readers to assess the extent to which findings might transfer to other settings. While statistical generalization is not claimed, analytical insights may inform understanding of similar contexts.
Quantification of qualitative themes
Frequency counts reported in the Results section (e.g., “78% mentioned connectivity issues”) represent the percentage of participants whose open-ended responses contained at least one coded text segment related to that theme. These quantifications serve to indicate theme salience and prevalence but should not be interpreted as precise statistical measures equivalent to structured survey items. A single participant might contribute multiple coded segments to one theme or mention multiple themes. These frequencies complement the detailed qualitative descriptions by providing readers with a sense of how commonly each theme appeared across the dataset.
Results
Demographic profile
Table 1 presents the demographic characteristics of the 220 participants. The sample demonstrated gender balance (58% female, 42% male) and disciplinary diversity, with representation from Civil Engineering (23%), Computer Science (35%), Geological Engineering (27%), and Mechanical Engineering (15%). A substantial majority (72%) accessed Google Classroom primarily via smartphones, reflecting both the mobile-first nature of internet access in Mozambique and the economic constraints that limit computer ownership. Internet quality emerged as a critical contextual factor, with nearly half of participants (45%) reporting poor or unstable connectivity, highlighting the infrastructure challenges underlying online learning experiences in this setting.
Table 1
| Variable | Category | % |
|---|---|---|
| Gender | Male | 42.0 |
| Female | 58.0 | |
| Device access | Smartphone | 72.0 |
| Computer/tablet | 28.0 | |
| Internet quality | Poor/unstable | 45.0 |
| Moderate | 33.0 | |
| Good/excellent | 22.0 | |
| Academic program | Civil Engineering | 23.0 |
| Computer Science | 35.0 | |
| Geological Engineering | 27.0 | |
| Mechanical Engineering | 15.0 |
Demographic characteristics of participants (N = 220).
Overall satisfaction levels
Student satisfaction with Google Classroom demonstrated moderate levels overall (M = 3.18, SD = 1.12 on a 5-point scale), with considerable variability in responses. Distributional analysis revealed that 35% of students reported being “satisfied” or “very satisfied,” 37% expressed neutral views, and 28% indicated being “dissatisfied” or “very dissatisfied.” This pattern suggests mixed experiences with the platform, neither universally positive nor predominantly negative, but rather reflecting diverse circumstances and expectations among the student body.
TAM constructs and satisfaction correlations
Descriptive analysis of TAM constructs revealed generally positive perceptions of the platform’s intrinsic qualities, despite mixed overall satisfaction. Perceived usefulness (PU) received moderate-to-high ratings (M = 3.42, SD = 1.05), suggesting that students recognized the pedagogical value of Google Classroom for accessing materials and submitting work. Perceived Ease of Use (PEOU) was also rated moderately positively (M = 3.28, SD = 1.12), indicating that the platform’s interface was not the primary barrier to adoption.
Pearson correlation analysis confirmed significant positive relationships between TAM constructs and overall satisfaction, supporting the model’s theoretical relevance even in this constrained context. Perceived usefulness showed a strong positive correlation with satisfaction (r = 0.52, p < 0.001), indicating that students who found the platform more academically valuable were more satisfied. Perceived Ease of Use also correlated significantly with satisfaction (r = 0.48, p < 0.001). Furthermore, PU and PEOU were positively correlated with each other (r = 0.48, p < 0.001), consistent with TAM theory positing that easier systems are often perceived as more useful.
Satisfaction with specific features
Table 2 presents satisfaction ratings across specific Google Classroom features. Assignment submission tools received the highest ratings (M = 3.45, SD = 1.08), suggesting that students appreciated the straightforward process for uploading and tracking assignments. Course announcements (M = 3.38, SD = 1.15) and materials access (M = 3.22, SD = 1.18) also received relatively positive evaluations. However, interaction and communication features scored notably lower (M = 2.85, SD = 1.24), indicating that the platform’s capacity to facilitate student-teacher and peer interaction fell short of student expectations. Technical support satisfaction was the lowest-rated dimension (M = 2.62, SD = 1.31), reflecting inadequate institutional support systems for troubleshooting technical difficulties.
Table 2
| Feature | M | SD |
|---|---|---|
| Assignment submission tools | 3.45 | 1.08 |
| Course announcements | 3.38 | 1.15 |
| Access to course materials | 3.22 | 1.18 |
| Course organization | 3.15 | 1.12 |
| Assessment and grading | 3.05 | 1.20 |
| Interaction and communication | 2.85 | 1.24 |
| Technical support | 2.62 | 1.31 |
Satisfaction with specific Google Classroom features (1–5 scale).
TAM-based hierarchical regression analysis
To rigorously test the modified TAM framework and isolate the influence of infrastructure factors, a three-stage hierarchical multiple regression analysis was conducted with overall satisfaction as the dependent variable (Table 3). Assumptions of linearity, homoscedasticity, and absence of multicollinearity were verified (all VIFs < 2.5).
Table 3
| Predictor | Model 1 β | Model 2 β | Model 3 β |
|---|---|---|---|
| Step 1: TAM constructs | |||
| Perceived usefulness (PU) | 0.38*** | 0.26** | 0.24** |
| Perceived ease of use (PEOU) | 0.28** | 0.18* | 0.15* |
| Step 2: Infrastructure | |||
| Internet quality | 0.42*** | 0.39*** | |
| Data costs | −0.21* | −0.19* | |
| Device type (0 = Phone, 1 = PC) | 0.15* | 0.12 | |
| Step 3: Controls | |||
| Digital literacy | 0.18* | ||
| Socioeconomic status | 0.11 | ||
| Prior online experience | 0.08 | ||
| Prior GPA | 0.06 | ||
| Model statistics | |||
| RZ | 0.34 | 0.48 | 0.52 |
| ΔRZ | 0.14*** | 0.04* | |
| F Change | 56.12*** | 19.45*** | 4.21* |
Hierarchical regression predicting student satisfaction.
Standardized beta coefficients reported. *p < 0.05, **p < 0.01, ***p < 0.001.
Model 1: traditional TAM constructs
The first model included only perceived usefulness (PU) and perceived ease of use (PEOU). This model was statistically significant (F(2,217) = 56.12, p < 0.001) and explained 34% of the variance in satisfaction (RZ = 0.34). Both PU (β = 0.38, p < 0.001) and PEOU (β = 0.28, p < 0.01) were significant predictors, confirming that platform perceptions matter.
Model 2: infrastructure variables
The second model added external infrastructure variables (internet quality, device type, data costs). This step significantly improved the model’s explanatory power (ΔRZ = 0.14, p < 0.001), explaining 48% of total variance. Notably, Internet Quality emerged as the strongest single predictor in the model (β = 0.42, p < 0.001), surpassing the influence of perceived usefulness (β = 0.26). Data costs (β = −0.21, p < 0.05) and device type (β = 0.15, p < 0.05) were also significant, indicating that students with lower costs and better devices (computers) reported higher satisfaction.
Model 3: control variables
The final model controlled for potential confounders: Prior Online Experience, Digital Literacy, Socioeconomic Status (SES), and Prior GPA. This model explained 52% of the variance (ΔRZ = 0.04, p < 0.05). Even after controlling for these factors, Internet Quality remained the dominant predictor (β = 0.39, p < 0.001), and TAM constructs remained significant. Among controls, only Digital Literacy significantly predicted satisfaction (β = 0.18, p < 0.05), suggesting that technical confidence plays a role independent of platform ease of use.
Moderation analysis
To test the hypothesis that infrastructure constraints moderate the relationship between usefulness and satisfaction, we conducted a moderation analysis using PROCESS macro (Model 1). The interaction term (PU × Internet Quality) was significant (β = 0.24, p < 0.01, ΔRZ = 0.03). Simple slopes analysis revealed that for students with good internet connectivity (+1 SD), perceived usefulness was a strong predictor of satisfaction (β = 0.51, p < 0.001). However, for students with poor internet connectivity (−1 SD), the relationship between PU and satisfaction was weak and non-significant (β = 0.16, p > 0.05). This critical finding quantitatively demonstrates that the “usefulness” of the platform only translates into satisfaction when adequate connectivity exists (see Figure 2).
Figure 2
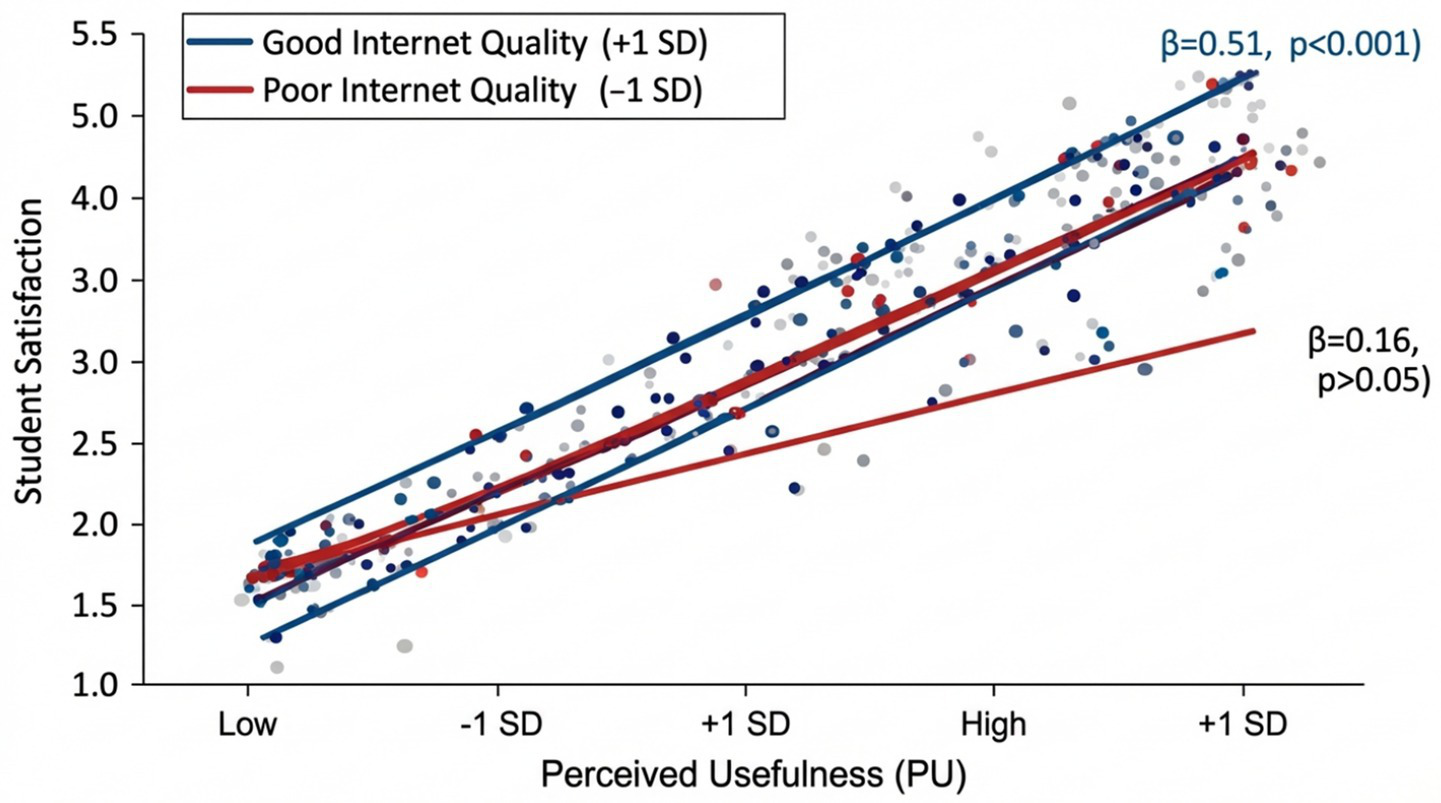
Moderation effect of internet quality on the relationship between perceived usefulness and student satisfaction.
The interaction plot demonstrates how internet connectivity quality moderates the relationship between perceived usefulness (PU) and overall satisfaction with Google Classroom. For students with good internet quality (blue line, +1 SD), PU strongly predicts satisfaction (β = 0.51, p < 0.001), showing a steep positive slope. However, for students with poor internet quality (red line, −1 SD), the PU-satisfaction relationship becomes weak and non-significant (β = 0.16, p > 0.05), demonstrating a nearly flat slope. The significant interaction term (β = 0.24, p < 0.01, ΔR2 = 0.03) confirms that infrastructure access is a critical boundary condition for traditional TAM relationships in resource-constrained contexts. Error bands represent 95% confidence intervals.
Demographic differences in satisfaction
Statistical analyses revealed significant differences in satisfaction based on internet quality (F(2,217) = 18.43, p < 0.001, η2 = 0.145), representing a medium-to-large effect size. Post-hoc Tukey tests indicated that students with good/excellent internet (M = 3.78, SD = 0.94) reported significantly higher satisfaction than those with moderate connectivity (M = 3.25, SD = 1.02, p < 0.01) or poor/unstable internet (M = 2.76, SD = 1.15, p < 0.001). This finding underscores the critical role of infrastructure quality in shaping student experiences with online learning platforms.
Device type also influenced satisfaction levels, though with a smaller effect (t(218) = 2.34, p = 0.020, d = 0.32). Students using computers or tablets (M = 3.42, SD = 1.06) reported higher satisfaction compared to smartphone users (M = 3.08, SD = 1.13). This difference likely reflects the enhanced functionality and user experience afforded by larger screens and more robust processing capabilities. No statistically significant differences emerged for gender (t(218) = 1.12, p = 0.264) or academic program (F(3,216) = 1.87, p = 0.136), suggesting that satisfaction patterns transcended these demographic categories.
Qualitative findings: challenges encountered
Thematic analysis of 220 open-ended responses identified six interconnected challenges that profoundly shaped the student experience. These themes reveal not just technical barriers, but the emotional and pedagogical toll of learning under constrained conditions.
Theme 1: internet connectivity problems (78% of respondents)
The most pervasive challenge was the instability of internet connections, which created a constant state of anxiety regarding access. Students described connectivity not merely as a technical nuisance, but as a fundamental barrier to participation. Representative quotes illustrate the severity:
“The internet disconnects every 10 min. I lose everything I was writing and have to start again. It makes me want to give up.” (Female, Computer Science, Poor Internet)
“Very slow loading. One page takes 5 min. By the time materials open, my data is finished. I cannot attend live sessions at all.” (Male, Civil Engineering, Poor Internet)
“Cannot access when the internet is down. Sometimes it’s down for days in my area. We miss classes and assignments and teachers do not understand.” (Female, Geological Engineering, Poor Internet)
Theme 2: mobile data costs and financial stress (62%)
Economic barriers were inextricably linked to technical ones. Many students reported that the cost of data bundles forced them to make difficult tradeoffs between education and basic needs:
“We spend 2,000 MZN [~$31 USD] monthly on internet bundles. That’s half my living expenses. I cannot afford food and internet both.” (Female, Civil Engineering, Smartphone user)
“Data finishes too quickly. One video lecture consumes 500 MB. Then nothing left for reading materials or assignments. Education has become too expensive.” (Male, Computer Science, Smartphone user)
“My family cannot help with data costs. They have no income since pandemic. I choose between eating and studying most days.” (Female, Geological Engineering, Low SES)
Theme 3: social isolation and educational loneliness (54%)
Beyond infrastructure, students expressed a deep sense of isolation. The loss of the campus community transformed learning into a solitary, often demotivating struggle:
“Learning alone is difficult. No one to discuss with when confused. In class, we could whisper to a friend. Now, I am just alone with my phone.” (Male, Mechanical Engineering)
“We miss talking with classmates. The WhatsApp groups are just for announcements, not real talk. I feel completely disconnected from the university.” (Female, Computer Science)
I″ feel depressed sitting alone all day. Motivation is gone because I do not see other students studying.” (Male, Civil Engineering)
Theme 4: technical difficulties and digital literacy (47%)
Navigating the platform, especially on small screens, presented a significant cognitive load:
“I do not know how to upload files correctly. Sometimes I think I submitted, but the teacher says no. It is very confusing.” (Female, First Year Student)
“Google Classroom app on phone does not show everything. I missed an assignment because it did not appear on the mobile view.” (Male, Mechanical Engineering)
“Formatting documents on a phone is impossible. Teachers want PDF, but I only have a phone. How do I do that?” (Male, Geological Engineering)
Theme 5: limited teacher interaction (43%)
The asynchronous nature of most instruction left students feeling unsupported:
“Teachers do not respond to questions quickly. I ask a question today, get answer three days later. By then, the assignment is due.” (Female, Civil Engineering)
“We need more feedback. Just a grade is not enough. I do not know what I did wrong or how to improve.” (Male, Computer Science)
Theme 6: workload and home environment (38%)
Finally, the blurring of home and school boundaries created conflict:
“At home, parents do not understand online class. They expect me to do chores all day. ‘You are just on your phone,’ they say.” (Female, Geological Engineering)
“Too many assignments. Every teacher gives work like theirs is the only subject. We are drowning in PDFs.” (Male, Mechanical Engineering)
Qualitative findings: appreciated features
Despite challenges, students identified several valued features of Google Classroom. Flexibility emerged as the most appreciated aspect (mentioned by 68%), with students noting they could “access materials anytime,” “study at their own pace,” and “review content multiple times.” This flexibility proved particularly important for students balancing work, family, and educational commitments. Access to course materials (58%) was valued for enabling students to download and save resources for offline review. Organization and clarity (49%) received positive comments: “Everything is in one place,” “Easy to find assignments,” “Clear course structure.” Finally, ease of use (41%) was appreciated, particularly the straightforward assignment submission process, though this was tempered by the technical difficulties noted above.
Student suggestions for improvement
Students offered five primary recommendations for enhancing their online learning experience. Most frequently cited (72%) was the need for improved internet infrastructure, including campus WiFi expansion and partnerships with telecommunications providers to reduce student data costs. Second, students requested more interactive features (61%), such as video conferencing integration, discussion forums, and collaborative tools. Third, technical training and support (53%) were identified as critical needs, including orientation sessions, tutorial videos, and responsive help desks. Fourth, students advocated for financial support for internet costs (48%), suggesting subsidies or free data packages. Finally, enhanced teacher engagement (44%) was recommended, particularly more frequent feedback, quicker response times, and scheduled online office hours.
Discussion
This study examined student satisfaction with Google Classroom at Lúrio University in Mozambique during the COVID-19 pandemic, contributing empirical evidence on online learning experiences in a resource-constrained Sub-Saharan African context. The findings reveal moderate satisfaction levels characterized by substantial variability, suggesting that emergency remote teaching in developing country contexts produces highly differentiated experiences depending on individual circumstances, particularly infrastructure access. This heterogeneity contrasts with studies from developed nations, which typically report more uniform satisfaction patterns (Almahasees et al., 2021), highlighting how contextual factors fundamentally shape online learning experiences.
Technology acceptance model interpretation
The TAM-based regression analysis reveals a critical theoretical insight: while perceived usefulness and ease of use significantly predict satisfaction in this context (supporting TAM’s core premises), external infrastructural factors exert even stronger influences. The hierarchical regression showed that TAM constructs alone explained 34% of satisfaction variance, but adding infrastructure variables increased this to 48%, a substantial 14% additional variance attributable solely to material conditions.
Most importantly, the significant moderation effect of internet quality on the PU-satisfaction relationship fundamentally challenges traditional TAM applications. In standard TAM theory, perceived usefulness is hypothesized to directly and universally drive satisfaction and usage intentions. However, our findings demonstrate that in resource-constrained contexts, this relationship is contingent: even when students perceive Google Classroom as highly useful (high PU), poor connectivity prevents them from actualizing this usefulness, resulting in low satisfaction. This suggests a boundary condition for TAM model operates as theorized only when basic technological infrastructure meets minimum thresholds. This modified TAM framework for developing contexts can be conceptualized as:
Where infrastructure acts as both a direct predictor and a moderator of TAM relationships. The strong beta coefficient for internet quality (β = 0.42), exceeding even perceived usefulness (β = 0.26) in Model 2, quantitatively demonstrates that “access precedes acceptance”, students must first have reliable access before traditional acceptance factors can meaningfully influence satisfaction. This finding extends the “Digital Divide” discourse into the realm of technology acceptance theory, arguing that TAM cannot be applied “colour-blind” to infrastructural realities.
Infrastructure challenges and educational equity
The prevalence of connectivity issues (cited by 78% of participants) and mobile data cost concerns (62%) illuminates critical equity dimensions in online learning provision. These barriers create a two-tiered system: students with reliable internet and financial resources to purchase data can engage meaningfully with online learning, while economically disadvantaged students face compounded difficulties. This digital divide threatens to exacerbate existing educational inequalities, contradicting the equity-focused quality principles emphasized in the European Higher Education Area framework and Sustainable Development Goals (European Association for Quality Assurance in Higher Education, 2015; UNESCO, 2020).
The finding that 72% of students accessed Google Classroom primarily via smartphones reflects both the mobile-first nature of internet access in Mozambique and economic constraints limiting computer ownership. While mobile access enables some participation, the lower satisfaction reported by smartphone users (M = 3.08) compared to computer users (M = 3.42) suggests that mobile-first approaches cannot fully substitute for computer-based learning experiences. This has implications for platform design and institutional support strategies, indicating the need for mobile-optimized content and activities specifically designed for small-screen interaction.
Comparative perspective with existing literature
Our findings align with and extend recent scholarship on online learning satisfaction in developing contexts, particularly studies from similar socio-economic environments in South Asia. The moderate satisfaction level (M = 3.18) we observed is notably lower than the M = 3.8 reported for Bangladeshi students during COVID-19 (Rahman et al., 2024), likely reflecting Mozambique’s more severe infrastructure constraints (20% internet penetration vs. ~65% in Bangladesh). However, the pattern of infrastructure challenges dominating satisfaction is consistent across developing contexts.
Similarly, studies in Bangladesh have identified connectivity issues and financial barriers as primary obstacles (Ahmed et al., 2022; Hossain et al., 2022), supporting our finding that ‘access precedes acceptance’ in low-resource settings. Our TAM modification, where infrastructure moderates traditional TAM relationships, resonates with Hossain et al.’s (2021) machine learning analysis, which found that external barriers significantly attenuated the perceived usefulness-satisfaction link in Bangladeshi universities.
The concern about social isolation (54% of our participants) parallels findings from Rahman et al. (2024), who reported similar proportions of students lamenting reduced peer interaction. Furthermore, Khan and Uddin (2023) demonstrated that socio-economic factors were strong predictors of educational outcomes in Bangladesh, mirroring our regression results where socio-economic proxies remained significant predictors of satisfaction. This cross-national consistency suggests that the pedagogical and infrastructural challenges of emergency remote teaching are structural features of the Global South experience, rather than unique to Mozambique.
Our study extends this literature by quantifying the moderation effect: the 14% additional variance explained by infrastructure variables (beyond TAM constructs) provides empirical evidence for the primacy of external barriers. This complements qualitative findings from Sultana et al. (2020) regarding pandemic impacts on education sectors, offering quantitative precision to the argument that digital transformation strategies must prioritize infrastructure equity.
Pedagogical implications
Students’ concerns about limited interaction (54% citing social isolation, 43% noting insufficient teacher-student communication) point to pedagogical challenges inherent in emergency remote teaching. The rapid transition to online learning, coupled with limited instructor experience in online pedagogy and institutional support systems, resulted in predominantly content-delivery approaches that failed to replicate the interactive, dialogic dimensions of face-to-face instruction. This finding aligns with broader literature documenting the difficulty of fostering community and engagement in online environments (Rovai, 2002), particularly when instructors lack training in online facilitation techniques. The challenge is magnified in contexts where asynchronous communication predominates due to connectivity constraints, reducing opportunities for real-time interaction and immediate feedback.
Implications for institutional quality enhancement
The study’s findings have direct implications for quality assurance and enhancement strategies in higher education institutions operating in similar contexts. First, the critical importance of infrastructure suggests that quality online learning cannot be achieved through platform selection alone; substantial investment in connectivity infrastructure represents a prerequisite for educational quality. Institutions should prioritize campus WiFi expansion, negotiate reduced data rates for students with telecommunications providers, and explore zero-rated educational content agreements.
Second, the low ratings for technical support (M = 2.62) indicate that responsive, accessible support systems must accompany technology implementation. This requires dedicated technical support staff, comprehensive orientation programs, tutorial resources, and multiple support channels (phone, WhatsApp, email), accommodating students’ varied access patterns. Third, the calls for enhanced teacher engagement highlight the necessity of professional development in online pedagogy, equipping instructors with strategies for fostering interaction, providing timely feedback, and designing engaging asynchronous activities. Finally, the equity concerns raised by data costs suggest that institutional policies should include financial support mechanisms, such as data subsidies or device loan programs, to ensure all students can participate meaningfully regardless of economic circumstances.
Limitations and prospects
Several limitations qualify the interpretation and generalizability of these findings. First, the study employed purposive sampling, which may not fully represent the diversity of student experiences across all programs and campuses at the Faculty of Engineering—Lúrio University. Students who voluntarily participated may differ systematically from non-participants in ways that influence satisfaction levels. Second, the cross-sectional design captured satisfaction at a single point in time (May 2021), precluding analysis of how satisfaction evolved as students gained experience with the platform or as institutional support systems developed. Longitudinal research examining satisfaction trajectories would provide valuable insights into adaptation processes.
This study’s findings are embedded in the specific context of Lúrio University’s Faculty of Engineering in Mozambique, limiting direct generalizability in several dimensions:
Institutional Context: Lúrio University is a public institution serving a specific regional population (Cabo Delgado Province) with particular infrastructure challenges. Private universities in Mozambique or public institutions in other provinces may have different technological resources, student demographics, and support systems, potentially yielding different satisfaction patterns.
Disciplinary Context: Engineering students may have higher baseline digital literacy and access to technology compared to students in humanities or social sciences, potentially inflating satisfaction levels relative to university-wide populations.
Temporal Context: Data collection in May 2021 represented students’ experiences after one full academic year of online learning. Satisfaction levels during the initial emergency transition (March–June 2020) or in subsequent years (2021–2022) may differ substantially as both students and institutions adapted.
Regional Specificity: Mozambique’s particular combination of low internet penetration (20%), Portuguese language instruction, and post-conflict development status creates contextual factors that may not apply to other Sub-Saharan African countries with different linguistic, economic, or infrastructural profiles.
Platform Specificity: Findings are specific to Google Classroom and may not transfer to other LMS platforms (Moodle, Canvas, Microsoft Teams) with different feature sets, bandwidth requirements, or mobile optimization.
Third, while the mixed-methods approach provided both breadth and depth, the quantitative component relied on self-reported satisfaction measures, which may be influenced by social desirability bias or recall limitations. Future research incorporating objective performance indicators (assignment completion rates, grades, retention) alongside satisfaction measures would strengthen causal inferences about the relationship between satisfaction and educational outcomes. Fourth, the study examined only one platform (Google Classroom) at one institution, limiting comparative insights. Research comparing student experiences across different platforms and institutions would illuminate which challenges are platform-specific versus contextual.
Fifth, the study focused exclusively on student perspectives, omitting instructor and administrator viewpoints that would provide a more comprehensive understanding of online learning implementation challenges and quality enhancement opportunities. Future research should adopt multi-stakeholder approaches to identify converging and diverging perspectives on quality. Finally, conducting this research during an ongoing pandemic introduced contextual factors (stress, uncertainty, health concerns) that may have influenced satisfaction ratings independently of the platform itself.
Despite these limitations, findings may have analytical generalizability (Yin, 2018) to similar contexts: public universities in low-resource African settings, institutions serving populations with limited internet access, and emergency online learning implementations in developing countries. The theoretical insights regarding TAM modification in constrained contexts and the identification of infrastructure as a moderating variable may inform research and practice beyond the immediate study setting.
Conclusion
This study examined student satisfaction with Google Classroom at Lúrio University in Mozambique during the COVID-19 pandemic, revealing moderate satisfaction levels (M = 3.18) characterized by substantial variability linked to infrastructure access and socioeconomic factors. The findings demonstrate that technology platforms, regardless of their intrinsic qualities, cannot overcome fundamental barriers posed by inadequate internet connectivity, high data costs, and limited device access. Internet quality emerged as the most powerful predictor of satisfaction, with students experiencing reliable connectivity reporting satisfaction comparable to developed country contexts, while those with poor connectivity expressed substantial dissatisfaction despite using identical platforms.
Through the theoretical lens of the Technology Acceptance Model, the research highlights the need for context-adapted frameworks recognizing that external barriers, infrastructure quality, economic constraints, institutional support—exert stronger influences on technology acceptance and satisfaction in resource-constrained environments than traditional TAM constructs of perceived usefulness and ease of use. This finding has important implications for how researchers and practitioners conceptualize technology adoption in developing country educational contexts.
The study’s mixed-methods approach captured both the quantitative dimensions of satisfaction and the lived experiences underlying statistical patterns. Students’ voices reveal appreciation for online learning’s flexibility and accessibility alongside deep frustrations with connectivity problems, financial burdens, and diminished social interaction. Their suggestions for improvement, enhanced infrastructure, interactive features, technical training, financial support, and increased teacher engagement, provide clear guidance for institutional quality enhancement efforts.
From a quality assurance perspective aligned with EHEA principles, the findings underscore that equity-focused quality in online higher education requires attention to the material conditions enabling student participation. Quality cannot be achieved through pedagogical innovation or platform selection alone; it demands substantial infrastructure investment, financial support mechanisms addressing socioeconomic barriers, comprehensive technical and pedagogical support systems, and ongoing attention to student voices in improvement processes. As higher education institutions worldwide consider post-pandemic instructional modalities, lessons from this study emphasize that online learning quality depends fundamentally on ensuring equitable access to the technological and economic resources that make meaningful participation possible.
For Lúrio University and similar institutions in developing countries, the path forward requires multi-pronged strategies addressing infrastructure, support systems, and pedagogy simultaneously. While challenges are substantial, the finding that students with adequate connectivity reported satisfaction levels comparable to international benchmarks suggests that investment in enabling conditions can yield educational experiences approaching global quality standards. The COVID-19 pandemic forced a rapid transition to online learning under extraordinarily difficult circumstances; the challenge now is to leverage lessons learned to build more resilient, equitable, and effective higher education systems capable of serving all students, regardless of their technological or economic circumstances.
Statements
Data availability statement
The original contributions presented in the study are included in the article/supplementary material, further inquiries can be directed to the corresponding author.
Ethics statement
The studies involving humans were approved by Faculty of Engineering—Lúrio University Research Ethics Committee (Protocol #2021-FE-LU-049). The studies were conducted in accordance with the local legislation and institutional requirements. The participants provided their written informed consent to participate in this study.
Author contributions
HC: Validation, Conceptualization, Resources, Visualization, Project administration, Writing – review & editing, Methodology, Formal analysis, Software, Data curation, Writing – original draft, Investigation, Supervision. MA: Visualization, Formal analysis, Writing – original draft, Methodology, Investigation, Writing – review & editing. AG: Visualization, Writing – original draft, Conceptualization, Writing – review & editing, Validation, Formal analysis, Methodology.
Funding
The author(s) declared that financial support was not received for this work and/or its publication.
Acknowledgments
The authors thank the students of the Faculty of Engineering—Lúrio University for their participation in this study and the Faculty administration for supporting this research.
Conflict of interest
The author(s) declared that this work was conducted in the absence of any commercial or financial relationships that could be construed as a potential conflict of interest.
Generative AI statement
The author(s) declared that Generative AI was not used in the creation of this manuscript.
Any alternative text (alt text) provided alongside figures in this article has been generated by Frontiers with the support of artificial intelligence and reasonable efforts have been made to ensure accuracy, including review by the authors wherever possible. If you identify any issues, please contact us.
Publisher’s note
All claims expressed in this article are solely those of the authors and do not necessarily represent those of their affiliated organizations, or those of the publisher, the editors and the reviewers. Any product that may be evaluated in this article, or claim that may be made by its manufacturer, is not guaranteed or endorsed by the publisher.
References
1
AdedoyinO. B.SoykanE. (2020). COVID-19 pandemic and online learning: the challenges and opportunities. Interact. Learn. Environ.31, 863–875. doi: 10.1080/10494820.2020.1813180
2
AhmedS.RahmanM.AkterS. (2022). Refute the decision of auto-promotion and real facts of digital online classes during the pandemic in Bangladesh. IEEE Access10, 45328–45341.
3
AlmahaseesZ.MohsenK.AminM. O. (2021). Faculty's and students' perceptions of online learning during COVID-19. Front. Educ.6:638470. doi: 10.3389/feduc.2021.638470
4
Al-MaroofR. S.Al-EmranM. (2018). Students acceptance of Google Classroom: an exploratory study using PLS-SEM approach. Int. J. Emerg. Technol. Learn.13, 112–123. doi: 10.3991/ijet.v13i06.8275
5
AzharK. A.IqbalN. (2018). Effectiveness of Google Classroom: teachers' perceptions. Prizren Soc. Sci. J.2, 52–66.
6
BolligerD. U.MartindaleT. (2004). Key factors for determining student satisfaction in online courses. Int. J. E-Learn.3, 61–67.
7
BraunV.ClarkeV. (2006). Using thematic analysis in psychology. Qual. Res. Psychol.3, 77–101. doi: 10.1191/1478088706qp063oa
8
DavisF. D. (1989). Perceived usefulness, perceived ease of use, and user acceptance of information technology. MIS Q.13, 319–340. doi: 10.2307/249008
9
DeVellisR. F. (2017). Scale Development: Theory and Applications (4th ed.). Thousand Oaks, CA: Sage Publications.
10
EomS. B.WenH. J.AshillN. (2006). The determinants of students' perceived learning outcomes and satisfaction in university online education: an empirical investigation. Decis. Sci. J. Innov. Educ.4, 215–235. doi: 10.1111/j.1540-4609.2006.00114.x
11
European Association for Quality Assurance in Higher Education (2015). Standards and guidelines for quality assurance in the European Higher Education Area (ESG). Brussels, Belgium: ENQA.
12
FornellC.LarckerD. F. (1981). Evaluating structural equation models with unobservable variables and measurement error. J. Mark. Res.18, 39–50. doi: 10.1177/002224378101800104
13
GunawardenaC. N.ZittleF. J. (1997). Social presence as a predictor of satisfaction within a computer-mediated conferencing environment. Am. J. Distance Educ.11, 8–26. doi: 10.1080/08923649709526970
14
HodgesC.MooreS.LockeeB.TrustT.BondA. (2020). The difference between emergency remote teaching and online learning. EDUCAUSE Review. Available online at: https://er.educause.edu/articles/2020/3/the-difference-between-emergency-remote-teaching-and-online-learning (Accessed on June 15, 2024).
15
HossainM.AkterR.RahmanA. (2022). Supervised method pursued for overall impact of online class during lockdown in Bangladesh. IEEE Access10, 89453–89467.
16
HossainM.AlamM.IslamK. (2021). MKRF stacking-voting: a data mining technique for predicting educational satisfaction level of Bangladeshis student during pandemic. IEEE Trans. Learn. Technol.14, 334–347.
17
IftakharS. (2016). Google classroom: what works and how?J. Educ. Soc. Sci.3, 12–18.
18
KhanS.UddinM. (2023). A novel CatML stacking classifier based intelligent system for predicting postgraduate admission chances: a study on Bangladesh. Int. J. Mod. Educ. Comput. Sci.15, 23–35.
19
LandisJ. R.KochG. G. (1977). The measurement of observer agreement for categorical data. Biometrics33, 159–174. doi: 10.2307/2529310
20
LincolnY. S.GubaE. G. (1985). Naturalistic Inquiry. Newbury Park, CA: Sage Publications.
21
NunnallyJ. C.BernsteinI. H. (1994). Psychometric Theory (3rd ed.). New York, NY: McGraw-Hill.
22
OgbonnayaU. I.AwoniyiF. C.MatabaneM. E. (2020). The impact of COVID-19 pandemic on education in sub-Saharan Africa. J. Educ. Pract.11, 37–43.
23
OnyemaE. M.EucheriaN. C.ObafemiF. A.SenS.AtonyeF. G.SharmaA.et al. (2020). Impact of coronavirus pandemic on education. J. Educ. Pract.11, 108–121.
24
PolitD. F.BeckC. T. (2006). The content validity index: Are you sure you know what’s being reported?Critique and recommendations. Res. Nurs. Health29, 489–497. doi: 10.1002/nur.20147
25
RahmanM.HossainS.IslamT. (2024). Students' satisfaction in online class during COVID-19: an empirical study in Bangladesh context. Educ. Res. Int.2024:5524683. doi: 10.1155/2024/5524683
26
RovaiA. P. (2002). Building sense of community at a distance. Int. Rev. Res. Open Distrib. Learn.3, 1–16. doi: 10.19173/irrodl.v3i1.79
27
SchererR.SiddiqF.TondeurJ. (2019). The technology acceptance model (TAM): a meta-analytic structural equation modeling approach to explaining teachers' adoption of digital technology in education. Comput. Educ.128, 13–35. doi: 10.1016/j.compedu.2018.09.009
28
SultanaR.KhanA.AhmedF. (2020). A stupendous statistics on the pandemic impact on all sectors of Bangladesh. AIP Conf. Proc.2324:040012.
29
SunP. C.TsaiR. J.FingerG.ChenY. Y.YehD. (2008). What drives a successful e-learning? An empirical investigation of the critical factors influencing learner satisfaction. Comput. Educ.50, 1183–1202. doi: 10.1016/j.compedu.2006.11.007
30
SwanK. (2001). Virtual interaction: design factors affecting student satisfaction and perceived learning in asynchronous online courses. Distance Educ.22, 306–331. doi: 10.1080/0158791010220208
31
TagoeM. (2012). Students' perceptions of a blended e-learning environment. Int. J. Educ. Dev. Using ICT8, 75–89.
32
TarhiniA.HoneK.LiuX.TarhiniT. (2017). Examining the moderating effect of individual-level cultural values on users' acceptance of e-learning in developing countries: a structural equation modeling of an extended technology acceptance model. Interact. Learn. Environ.25, 306–328. doi: 10.1080/10494820.2015.1122635
33
UNESCO (2020). Education in a post-COVID world: Nine ideas for public action. Paris: UNESCO.
34
Van DeursenA. J. A. M.Van DijkJ. A. G. M. (2010). Measuring internet skills. Int. J. Hum. Comput. Interact.26, 891–916. doi: 10.1080/10447318.2010.496338
35
VentayenR. J. M.EstiraK. L. A.De GuzmanM. J.CabalunaC. M.EspinosaN. N. (2018). Usability evaluation of Google classroom: basis for the adaptation of GSuite e-learning platform. Asia Pac. J. Educ. Arts Sci.5, 47–51.
36
World Bank (2021). Mozambique overview. Washington, DC: World Bank Group.
37
YinR. K. (2018). Case Study Research and Applications: Design and Methods (6th ed.). Thousand Oaks, CA: Sage Publications.
Summary
Keywords
COVID-19, Google Classroom, Mozambique, online learning, student satisfaction, technology acceptance model
Citation
Comia HR, Alberto M and Guerra A (2026) Student satisfaction with Google Classroom during the COVID-19 pandemic: examining challenges and acceptance factors at the Faculty of Engineering—Lúrio University, Mozambique. Front. Educ. 10:1742339. doi: 10.3389/feduc.2025.1742339
Received
08 November 2025
Revised
29 December 2025
Accepted
30 December 2025
Published
14 January 2026
Volume
10 - 2025
Edited by
Aslina Baharum, Sunway University, Malaysia
Reviewed by
Ling Chai Wong, Universiti Malaysia Sabah Fakulti Kewangan Antarabangsa Labuan, Malaysia
Md. Hasan Imam Bijoy, Daffodil International University, Bangladesh
Updates
Copyright
© 2026 Comia, Alberto and Guerra.
This is an open-access article distributed under the terms of the Creative Commons Attribution License (CC BY). The use, distribution or reproduction in other forums is permitted, provided the original author(s) and the copyright owner(s) are credited and that the original publication in this journal is cited, in accordance with accepted academic practice. No use, distribution or reproduction is permitted which does not comply with these terms.
*Correspondence: Heráclito Rodrigues Comia, comia03@yahoo.com.br
Disclaimer
All claims expressed in this article are solely those of the authors and do not necessarily represent those of their affiliated organizations, or those of the publisher, the editors and the reviewers. Any product that may be evaluated in this article or claim that may be made by its manufacturer is not guaranteed or endorsed by the publisher.