 Kristin L. Brandt
 Johnway Gao
 Jinwu Wang
 Robert J. Wooley
 Michael Wolcott
- 1Composite Materials and Engineering Center, Washington State University, Pullman, WA, United States
- 2Global Cellulose Fibers, International Paper, Federal Way, WA, United States
- 3Forest Products Laboratory, USDA Forest Service, Madison, WI, United States
- 4Biomass ad Infinitum LLC, Cedar Key, FL, United States
This study quantifies the cost of cellulosic sugar production using a fully-mechanical pretreatment process and fuel pellets as a co-product. The pretreatment reduces softwood forest harvest residuals to micron-sized amorphous particles. Energy consumption is minimized using a three-stage milling process. A techno-economic analysis was completed for a milling facility with saccharification and wood pellet manufacture. For the base case, concentrated sugar syrup can be produced for $0.496/kg of sugar. Sensitivity analyses were used to determine cost controlling variables, optimize the sugar cost and found that siting for this technology needs to strongly consider electricity cost and to a lesser extent local feedstock availability. If the sugar produced in this process is used to generate biofuel and is qualified for RIN credits through a life-cycle analysis, the effective cost could be reduced by $0.04–$0.06/kg of sugar. An additional $0.067/kg savings is possible if the biofuel facility is located adjacent or on-site; the finished sugar syrup would not have to be concentrated for transportation. An optimized scenario, including the RIN credit, dilute sugar syrup, and favorable energy costs and consumption, could reduce the cost to $0.34/kg sugar compared to $0.496/kg for the base case.
Introduction
Conversion of non-food lignocellulosic material into clean sugars or transportation fuels has been widely studied, with researchers citing abundant and low-cost feedstocks. However, they present caution regarding lower yields and more difficult processes, especially with high lignin feedstocks (Piccolo and Bezzo, 2009; He and Zhang, 2011; Dutta et al., 2015). Cost effective processing of lignocellulosic biomass into sugars or biofuels is most likely to be achieved through the addition of co-products. The choice of co-products, along with their price, will help determine if a process will succeed financially by increasing income and lowering risk through product diversification (Crawford, 2013; Davis et al., 2013; Biddy et al., 2016).
Lignocellulosic biomass is comprised primarily of cellulose, hemicellulose, and lignin. Cellulose, a highly crystalline substance, is the major component. Pretreatment before a bioconversion process is required to disrupt the intricate hierarchical structures, thereby allowing enzymes access to the cellulose and hemicellulose for saccharification (Cadoche and López, 1989; McMillan, 1994; Sun and Cheng, 2002; Zhu et al., 2008). Disrupting this crystalline microstructure is difficult and requires complex, high-cost pretreatment options (Mosier et al., 2005; Crawford, 2013; Zhang et al., 2013; MYPP BETO, 2016). Although thermochemical pretreatment methods are effective for pretreating biomass (Zhu et al., 2009; Humbird et al., 2011; Gao et al., 2013), significant amounts of chemicals are needed. These chemicals include sulfuric acid and bisulfites for pretreatment as well as ammonium hydroxide, calcium hydroxide or other bases for overliming and/or neutralization processes. Sulfites, in particular, are capable of breaking down carbohydrates and separating lignin for hemicellulosic feedstocks (Zhu et al., 2015). Chemical pretreatments contaminate the biomass and chemical removal adds significant processing costs. Contaminates from some pretreatment methods, including sulfur, can cause catalyst poisoning in a sugar catalytic process (Elliott et al., 2004; Biddy and Jones, 2013; Guan and Blersch, 2018). In addition, thermochemical pretreatments require high temperatures that can create inhibitors, such as hydroxymethylfurfural (HMF) and furfural (Weil et al., 2002; Jönsson et al., 2013). These compounds are toxic to the fermentation organisms and their removal adds cost to the process.
The cost of equipment for thermochemical processes is scaled exponentially, which equates with larger facilities being more cost effective (Humbird et al., 2011; Davis et al., 2013; de Jong et al., 2015). However, the nature of milling equipment can result in a linear scale-up for equipment costs; grinding equipment has a physical size limit that once reached requires additional pieces of equipment have to be added to meet greater throughput values instead of simply purchasing larger equipment (Pirraglia et al., 2010a). While mechanical pretreatment may not offer the economy of scale, the modular nature of mechanical milling provides ample opportunity for distributed processing strategies with little influence on the conversion costs. The micronizing process increases the bulk density of the biomass to 0.46 g/cm3 from 0.19 g/cm3 (Wang et al., 2018). It is well documented that increased feedstock density can lower transport costs which helps to offset the traditionally increased operating and capital costs of a distributed processing model, especially for longer transport distances (Wright et al., 2008; Kim et al., 2011; You and Wang, 2011; Kim and Dale, 2015, 2016). If smaller, milling depots are located at existing wood processing facilities, the existing supply chain can be used to efficiently transport the feedstock. In addition, the core competencies of other wood processing facilities align with wood milling. The micronized wood could then be transported to a central saccharification facility.
In general, all biomass pretreatment starts with mechanical particle size reduction, followed by a thermochemical or a biochemical pretreatment process. A fully mechanical pretreatment has the advantages of eliminating chemical contamination and producing no inhibitors in the pretreated biomass and its final sugars and residue products, in addition to saving water in the pretreated biomass washing process. However, the required energy has been considered cost-prohibitive as a stand-alone alternative and has therefore been largely discounted (Cadoche and López, 1989; McMillan, 1994; Zhu and Pan, 2010; Zhang et al., 2016). For fine wood milling, McMillan (1994) used a ball mill to reduce wood to 50 μm. However, the electricity usage was high at 2.8 kWh/kg. Coarse milling completed by Cadoche and López (1989), who reduced hardwood chips from 23 mm to 1,600 μm using a hammermill or a knife mill, requires less energy, only 0.13 kWh/ kg. Esteban and Carrasco (2006) compared one and two stage milling of pine chips with hammermills. They measured the lowest energy use, 0.15 kWh/OD kg for 95% passing a 1,000 μm screen and at least 12% passing a 125 μm screen, when they applied a two-stage milling process with a sorting step after the first milling stage. Reducing woody biomass to a finer size, a median size (D50) of 105 μm by an attrition mill requires much more energy at 1.9 kWh/ kg (Repellin et al., 2010).
The current paper examines the economics of a mechanical pretreatment process that uses three stages of milling to produce clean feedstock for saccharification. Included in this work is a description of the process and economics of converting biomass, specifically softwood forest harvest residuals (FHR) into sugars and fuel pellets. In addition to providing clean material for conversion, the removal of chemicals and water from the pretreatment lowers the environmental impact and the waste water treatment costs (Jones et al., 2013).
The cost of sugar can be used as a first step to determine the cost of high-value products including, biojet fuel, and biochemicals. Humbird et al. (2011) included a section in the 2011 NREL report that stopped at sugar instead of continuing to ethanol at the request of non-ethanol biofuels industry stakeholders. Zhang et al. (2013) describes the need to use cost-intense biochemical pretreatments to convert lignocellulosic biomass into sugars and Wyman (2003) stressed the need to choose the scale and products that are made from cellulosic sugars to ensure financial viability. Davis et al. (2013) states sugar costs must be lowered to manufacture hydrocarbons from lignocellulosic material in an economically viable way and suggests milder pretreatments.
This objective of this paper is intended to provide economic analysis for converting softwood biomass into sugars using a fully mechanical pretreatment, information that is not well defined in the current literature. The analysis provides the financially controlling variables and possible cost-reduction strategies to make the sugar produced economically viable for biofuels or biochemicals. Using the three-stage milling process reduces the power consumption to covert softwood biomass to both clean sugar and lignin fuel pellets compared to other milling methodologies (Wang et al., 2018).
Methods
For this paper, a techno-economic analysis of processing softwood FHR, referred to using the general term “biomass” into sugar and fuel pellets was completed in a single facility. The experimental results for micronizing the biomass, saccharification and manufacturing pellets used in this study are from literature sources. In the future, additional analyses should be completed to determine the impact of separating the mechanical pretreatment and saccharification into two facilities being managed by a single company, separate companies, or separating the pretreatment facility into multiple smaller wood micronizing depots. The base case used in this paper describes the process using values that are representative of Washington state and is used for comparison as variables are manipulated.
Mechanical Pretreatment-Micronizing
The micronizing process reduces softwood biomass from material that passes through a 45-mm round screen to amorphous particles (Wang et al., 2018) (Figure 1). The biomass arrives at the facility and is stored in open air piles until entering the process where the material is first screened to remove bark and inorganic material. This rejected material is sold as hog fuel (Marrs et al., 2016). The assumed initial biomass wet-basis moisture content of 35% is reduced using natural gas fired drum dryers to a nominal 10% before entering the milling process. To minimize energy use, the milling is divided into three stages: coarse milling, fine milling, and amorphous milling, which concludes with amorphorous cellulose. The use of multiple milling stages optimizes the process by matching the particle initial size and size reduction for each mill type. Separating the energy intense fine and amorphous milling stages from the coarse milling is an effective method to reduce total energy consumption (Gu et al., 2018; Wang et al., 2018). The first stage of milling, coarse milling, reduces the biomass to a median particle D50 of 270 μm using a hammermill and 0.19 kWh/OD kg. This material is fed into the fine milling stage where an air classifying mill (ACM) takes the 270 μm material down to a median size of 63 μm using an additional 0.70 kWh/OD kg. The final stage of milling achieves an amorphous state in the wood particles using a media mill to attain a final median particle size of approximately 25 μm. The media mill consumes 0.57 kWh/OD kg in this milling stage (Wang et al., 2018). The final product is called micronized wood and is transferred to the saccharification department to be processed into a concentrated sugar syrup; the lignin residuals are manufactured into fuel pellets.
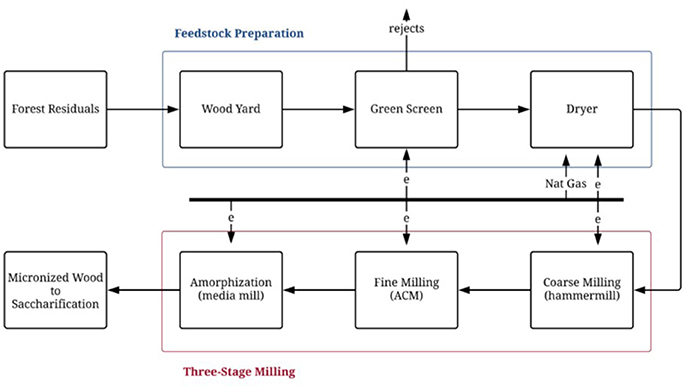
Figure 1. Process flow chart for mechanical pretreatment of biomass using a three-stage milling process.
Saccharification
The micronized wood is sent to saccharification where the amorphous wood is hydrolyzed by cellulolytic enzymes (cellulase and hemicellulose-xylanase). In laboratory testing, a high solids content of 15–21% micronized wood is easily suspended by standard mixing. The micronized wood was hydrolyzed enzymatically at 21% solids to achieve the base case sugar yield of 0.328 kg sugar/kg micronized wood (Gao and Neogi, 2015; Wang et al., 2018). Explicit saccharification process details are presented by Gao and Neogi (2015). This yield accounts for process losses. The sugar yield includes the C6 sugars, glucose, mannose and galactose, which can all be used by standard yeasts for biofuel fermentation.
After enzymatic hydrolysis, the hydrolyzed slurry is pumped to a belt filter press operation, where the clear hydrolysate is filter-pressed and separated from the hydrolyzed residuals. The residuals are further washed with water to recover additional sugar. The clear hydrolysate or sugar stream is sent directly to an evaporator to concentrate it into a high titer syrup (49% solids). If non-concentrated sugar stream is produced for an onsite biofuel facility, the dilute stream can be directly transferred to fermentation. The filter-pressed residuals are sent to the fuel pellet department.
Fuel Pellets
Fuel pellets were chosen as the co-product to be manufactured from the lignin waste stream. Consumption of fuel pellets in the US grew 200% from 2002 to 2006 and world consumption is predicted to grow from 16.4 million tons in 2010 to 123 million tons in 2020 (Pirraglia et al., 2010b). The United States produced 11.5 million tons of fuel pellets in 2017 (EIA, 2018c). The costs of biomass, labor, and drying dominate the economics of energy pellet manufacture (Mani et al., 2006; Pirraglia et al., 2010a; Qian and McDow, 2013). Using a waste stream for feedstock will decrease the risks of fuel pellet manufacture though consistent, economic feedstock (Qian and McDow, 2013).
The residuals from the saccharification process are composed primarily of high lignin content residuals with a small amount of undigested cellulose and hemicellulose. This residual stream also includes small amounts of hydrolysates, monomeric sugars, and enzymes (Gao and Neogi, 2015; Fish et al., 2016). The filter-pressed residuals from the saccharification are assumed in the analysis to be 38% solids, or 62% water. After entering the pelletizing process, the residuals are dried before being extruded through the pellet mills into pellets in which the lignin acts as the binder. The pellets are cooled and screened, before packaging and storage. The fines are recirculated back into the pelleting process.
The conversion of the residuals into pellets requires 0.15 kWh/OD kg of electricity to operate the pellet mills, cooler. and shaker (Pirraglia et al., 2010a). However, the majority of the energy consumed is to dry the residuals using natural gas. The energy values utilized were reported by DiGiacoma and Taglieri (2009) and converted from electricity to natural gas.
Financial
Following the financial analysis method outlined by Petter and Tyner (2014), both engineering and economic analyses were completed. The engineering analysis consists of a discounted cash flow rate of return (DCFROR) with the minimum sugar selling price (MSSP) set to attain an internal rate of return (IRR) of 10%. For this analysis the MSSP is the break-even price where the future sugar syrup and fuel pellet sales cover the present value of both capital and operating costs, or the net present value (NPV) is zero. This analysis does not include the impact of inflation but does include the cost of debt. The inclusion of the engineering analysis allows comparison to the economic analysis and with historical literature, which often uses DCFROR without accounting for inflation.
The economic analysis follows the method used by Petter and Tyner (2014); the real discount rate chosen is 10%, which corresponds to a nominal financial discount rate of 12.2%, assuming 2% inflation. The average inflation from 1997 through 2016 is 2.0% according to the Consumer Price Index from the US Bureau of Labor and Statistics; this value was assumed for the economic analysis. The MSSP was determined by setting the NPV calculated in the nominal economic analysis to zero.
The techno-economic analysis (TEA) was completed assuming the parameters defined in Table 1 and the TEA boundaries begin with the delivered biomass cost and ends with concentrated sugar syrup, fuel pellets and hog fuel, but does not consider the cost to ship these products or the costs to convert the sugar into higher value products. The Supplementary Material for this paper includes the details of the financial analysis as well as a complete listing of capital and operating costs. The tax rate of 16.9% is average US corporate tax rate paid from 2008 to 2012 (Bann et al., 2017). The facility is assumed to be an Nth plant, meaning the technology and manufacturing process has been successfully implemented for multiple plants.
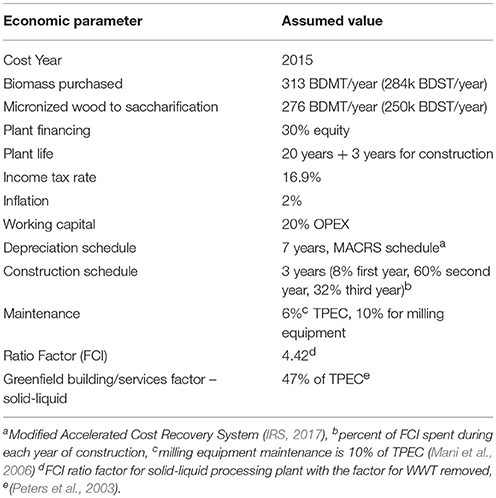
Table 1. Assumed economic parameters for base case scenario.
The fixed capital investment (FCI) was estimated using the ratio factor for solid-liquid processing plants applied to total delivered equipment cost (TDEC). This methodology approximates total direct costs (TDC) and FCI from the TDEC of major equipment located inside the battery limits (ISBL). Total purchased equipment costs (TPEC) used are a combination of literature values and vendor quotations and were increased by 10% to account for the cost of delivery to obtain TDEC as appropriate. This methodology is used for preliminary and study estimates with a predicted accuracy of ± 20–30% (Peters et al., 2003). This aligns with this strategic study, which scales up the laboratory data to determine if mechanical pretreatment of biomass is economically viable. Ratio factors have been successfully applied to compare processes and for siting decisions (Wright et al., 2010; Zhang et al., 2013; Astonios et al., 2015; de Jong et al., 2015; Martinkus and Wolcott, 2017). The ratio factor approach is used to estimate the cost of items located outside of the battery limits (OSBL). One item included in the direct costs estimated by a ratio factor is service facilities. For a solid-fluid processing plant, the ratio factor for service facilities is 0.55 × TDEC. The process included in this paper has only a small waste water treatment (WWT) requirement. It was decided to assume the small WWT need could be outsourced and is included as an operating cost. The service facilities ratio factor was reduced by 0.04, which corresponds to removing the typical value for WWT. Total capital investment (TCI) is the sum of installed equipment costs, land, and working capital. Working capital is used to cover operating costs when production and sales do not meet the cash demands. Peters et al. (2003) suggests having cash to cover 30-days operations or 10–20% of TCI. The value chosen is 20% of the yearly operating costs; this covers just over 2 months of costs and is 13% of TCI for the base case scenario.
Capital Costs
The facility TDEC is dominated by milling equipment. The cost of equipment is a combination of vendor quotes and literature values. The milling portion of this facility does not have the same economy of scale that is common to many chemical processing plants as milling equipment reaches a finite size before needing to add additional units. This property of scaling makes a distributed processing model viable. However, the economic impact of a distributed model this will depend on the availability of feedstock and the transportation logistics for each specific location. This model should be evaluated in future work.
The saccharification process converts the micronized biomass into sugar, using capital and operating costs that are scaled from Humbird et al. (2011) for both the concentrated and non-concentrated sugar syrup scenarios. The concentrated sugar titer for this study and Humbird et al. (2011) is 49%; the cost of concentrating was increased to match the lower non-concentrated sugar titer in this study of 8.4%, compared to the Humbird et al. (2011) value of 12.7%. For the base case used throughout this document, facility and operating costs were calculated for concentrated sugar syrup, which is appropriate for shipping. However, if the syrup is to be further processed onsite, or at an adjacent facility, the additional costs to remove water can be avoided and the final product is a non-concentrated sugar solution. The differences in capital costs for concentrated and non-concentrated sugar syrup are detailed in Table 2.
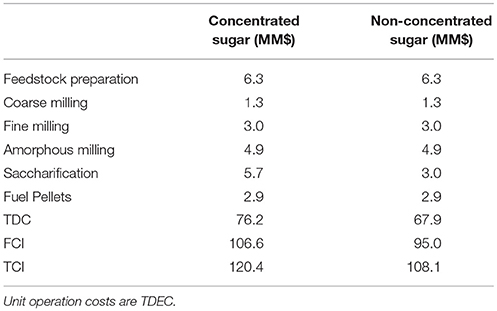
Table 2. Capital costs for concentrated and non-concentrated sugar facilities.
Solid residues, comprised of mostly lignin, are removed after saccharification, dried and processed into fuel pellets to be sold as a co-product. The fuel pellet equipment costs were taken from Mani et al. (2006), updating costs for the year using CEPCI Index and scaled to the appropriate pellet capacity (Chemical Engineering, 2017). The TPEC is $2.9 MM; this does not include size reduction equipment needed in traditional pellet manufacturing facilities.
Operating Costs
The base case scenario assumes electricity and natural gas costs that are a five-year average of Energy Information Administration (EIA, 2018a,b) industrial rates for the state of Washington; the values used are 2011–2015. The feedstock cost used is the weighted average of the delivered biomass cost to the Longview, WA mill, the assumed mill location. The cost for delivered feedstock assumes a facility scale of 249 k bone dry metric ton (BDMT)/yr. This cost includes the cost of the biomass in the woods, on-site grinding, loading into chip trucks and transport to the micronizing facility (Martinkus et al., 2017). The delivered feedstock cost used in this study, calculated using the Martinkus model, to the micronizing facility is $56.9/BDMT, which includes $4.4/BDMT stumpage (US DOE, 2011).
For the base case, the MSSP was calculated assuming a 12.2% nominal financial discount rate, which corresponds to a 10% real discount rate with 2% annual inflation using an updated fuel pellet value from Pirraglia et al. (2010b). The major variables for the base case are listed in Table 3; sugar yield is based on actual polymer sugar hydrolysis yield, e.g. glucan conversion yield to glucose is 1.10.
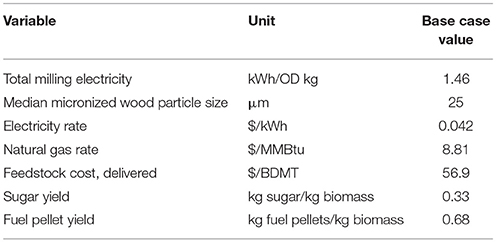
Table 3. Base case variables for micronized and saccharification facilities.
The operating costs are dominated by electricity and feedstock, followed by pellet manufacture (Figure 2). The OPEX for pellet manufacture includes electricity and natural gas costs for this department, which are not included in the overall electricity and natural gas costs. For the base case, the milling energy use and yield scenario chosen is 1.46 kWh/OD kg, which corresponds to a sugar yield of 0.33 kg of sugar/kg of biomass (Wang et al., 2018). With the chosen energy requirement and yield combination, the electricity required to micronize the biomass was calculated as 20% of the yearly manufacturing costs. The additional 2% seen in the electricity category (Figure 2) is the electricity requirement for saccharification.
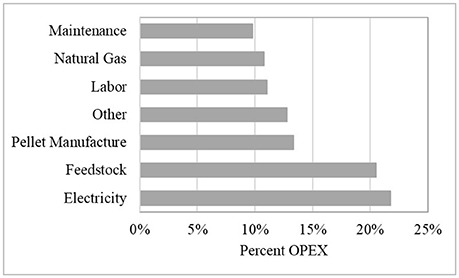
Figure 2. Percentage of operating costs by category for concentrated sugar syrup.
The third largest category is the combined OPEX costs for pellet manufacture, at 13%. Pellet manufacture operating costs were adapted from Pirraglia et al. (2010a) with the secondary drying energy values modified to the process from DiGiacoma and Taglieri (2009). Labor and natural gas both require 11% of the yearly OPEX, the lowest individual category is maintenance, at 10%. Labor costs were adapted from Marrs et al. (2016) and Jones et al. (2013) not including the operational labor for pellet manufacture that was scaled from Qian and McDow (2013). If the sugar is left as a non-concentrated syrup, the evaporator can be removed, which reduces the yearly OPEX by $3.5MM, or 5%, primarily by reducing the energy requirements (Table 4).
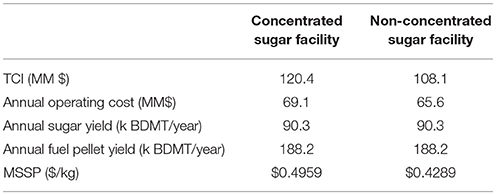
Table 4. TCI, annual operating costs and MSSP for concentrated and non-concentrated sugar.
Results
A sensitivity analysis was completed to determine which variables have the greatest impact on MSSP. The values to test were set at assumed realistic, stretch limits for each variable. The outcomes of the analyses were examined alone and in combination to aid in determining the range of possible financial outcomes. All scenarios are compared to the base case.
MSSP of Concentrated Sugar Syrup From Micronized Wood
Within the ranges evaluated, the two most influential variables for MSSP are the TPEC and electricity cost rate. Peters et al. (2003) reports a TPEC accuracy of ± 30% and this was the range evaluated for impact on MSSP. However, it was assumed that the TPEC estimate is realistic and therefore this variable is held constant at the base case level for all other analyses. Although the industrial electricity rate for the state of Washington state is $0.0265 less than the US national average for the same timeframe, electricity rates within some regions of Washington state are well below the value used in the base case and are therefore considered in the optimized analysis. Although electricity use is not among the most influential variables, it does have a practical impact and could be a path to lower costs. The milling energy requirements in this paper are from pilot-scale equipment and these requirements may drop as the mass throughput of biomass increase to industrial rates.
The skill sets that are required for the micronized wood and saccharification departments are very different. Size reduction of biomass, especially the heterogeneous forest residuals feedstock, is a complex solids handling and milling process. Experts in wood science and machine processing will be required to consistently attain target moisture content and particle size while running the equipment efficiently. The saccharification department will require chemical engineers that are experts in converting lignocellulosic materials to sugars. It is possible that a company suited to run a saccharification facility, and perhaps a downstream biofuel or biochemical facility will not have the in-house expertise or the desire to add this expertise, which will be required to effectively run the micronizing facility. This may create a situation where the pretreatment and saccharification are handled in separate facilities, even if located at a single location. It is also possible that adjacent locations could allow the saccharification facility to sell the waste stream to the micronizing facility, which may be best suited to manufacture fuel pellets. Alternatively, this waste could be used to fuel the biomass dryers, decreasing capital and operating costs while eliminating the co-product revenue.
Sensitivity Analysis-Electricity Use, Electricity Rate
Seven key cost variables were analyzed for impact on final, concentrated MSSP. These variables are TPEC, electricity rate, assumed real discount rate, milling energy, feedstock cost, natural gas rate, and labor cost. The cost of enzymes was determined to be $3.2MM per year, while not negligible, this cost was also not a controlling parameter of concentrated sugar cost. A tornado plot of these variables shows that the most important factors to focus on are electricity rate, sugar concentration, and electricity use (Figure 3). Feedstock cost, which is often a controlling variable, is overshadowed for this process as a result of intense energy use (Mani et al., 2006; DiGiacoma and Taglieri, 2009; Pirraglia et al., 2010a; Wright et al., 2010; He and Zhang, 2011; Humbird et al., 2011; Crawford, 2013; Davis et al., 2013; Jones et al., 2013; Qian and McDow, 2013; Zhang et al., 2013; Astonios et al., 2015; Dutta et al., 2015). The feedstock cost used is specific to the Pacific Northwest and will vary by region. Although the detailed methodology used to determine the feedstock cost in this paper has not been applied on a national level, the feedstock cost was varied to ± 50% to encompass all reasonable delivered feedstocks in the United States; the impact of this is illustrated in Figure 4.
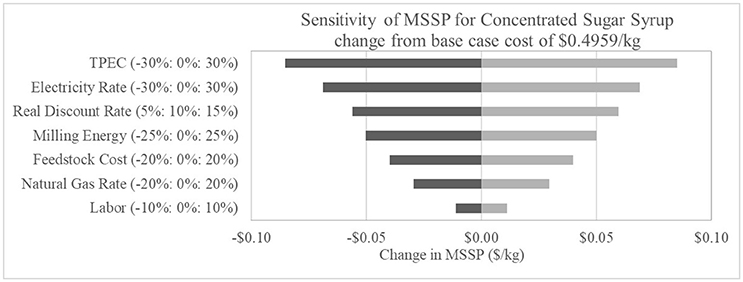
Figure 3. Impact on cost of sugar production with changes from the base case, applied to major cost variables.
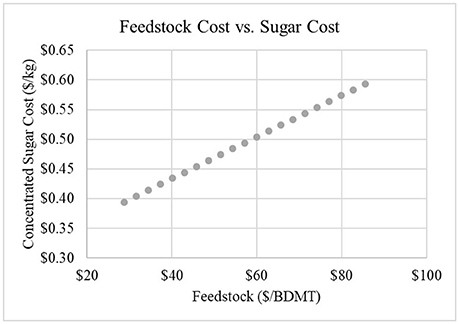
Figure 4. Impact of delivered feedstock cost on concentrated sugar cost.
In general, the literature uses a 10% IRR calculated using DCFROR analysis. This analysis assumes a 10% real discount rate for the base case. However, this may not be acceptable to investors. Zhang et al. (2013) suggested that 25% IRR may be necessary to attract capital to build an advanced biofuels facility and Crawford (2013) proposed an IRR of 15% to appeal to investors. The cost of concentrated sugar would increase to $0.56/kg and $0.68/kg for 15 and 25% IRR, respectively.
Sugar concentration is discussed in a later section as it is driven by the location of post-processing facilities that are outside the scope of the current assessment. The reduction in electricity use applies to milling energy only and is a percent change to the kWh/OD kg biomass to reach the target micronized wood dimension. The reductions to electricity rate is the major cost driver, most of which is from the decrease in cost to micronizing the wood and could be attained through negotiations with local electricity suppliers.
Discussion
Non-Concentrated Sugar Sales
The cost to concentrate sugar from the non-concentrated stream exiting the hydrolysis unit operation is split between capital costs and operating costs, which are dominated by the purchase of natural gas. The cost to concentrate the sugar varies with each scenario, which for the base case, is 14% of the concentrated sugar cost, or $0.067/kg. A promising future scenario is to locate the biochemical or biofuel facility on-site or adjacent to the saccharification facility so that the sugar can be transferred without this added cost.
Sugar Yield
The sugar yield, which reflects losses from washing, is controlled by multiple, interacting variables, making the impact of greater sugar yields inconsistent. Three realistic yield scenarios were analyzed: the base case and an assumed optimistic and pessimistic case; the descriptors are for the sugar yield only (Table 5). Increasing the sugar yield decreases the fuel pellet yield. However, the milling energy required increases (Wang et al., 2018) and the net impact on sugar cost is small, a decrease of just under $0.01/kg, compared to the base case. If the cost of electricity changes the financial decision for targeting the base or optimistic case will also change. For the pessimistic scenario, the sugar yield drops, the fuel pellet yield increases, and the milling energy is the same. This leads to an increase in MSSP of $0.17/kg, as a result of the value reduction caused by lower sugar yield.
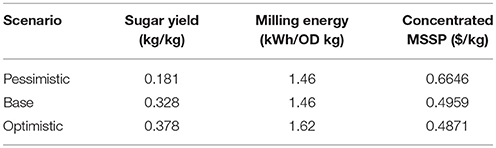
Table 5. Impact of sugar yield scenarios on required milling energy and concentrated sugar cost.
National Energy Impact
Average, industrial Washington state electricity and natural gas prices were used in the base case. This decision reflects the location-specific feedstock costs that were used. The feedstock cost methodology chosen has not been extended to a national level to date. However, electricity and natural gas rates are readily available. The average state industrial rates for 2011–2015 were obtained from the EIA for the continental US (EIA, 2018a,b). The change in sugar price based on average electricity and natural gas prices on a state level are shown in Figure 5. The US Forest Service FSGeodata Clearinghouse forest coverage information was also included (USFS)1 The map demonstrates the impact of state utility costs and shows areas where low costs align with forest coverage. It should be noted that rates within a state vary and specific locations will have to be analyzed for cost effectiveness. Additional feedstock work will be required to analyze the biomass cost at each potential location. The information in Figure 5 can be used to choose the next region to study.
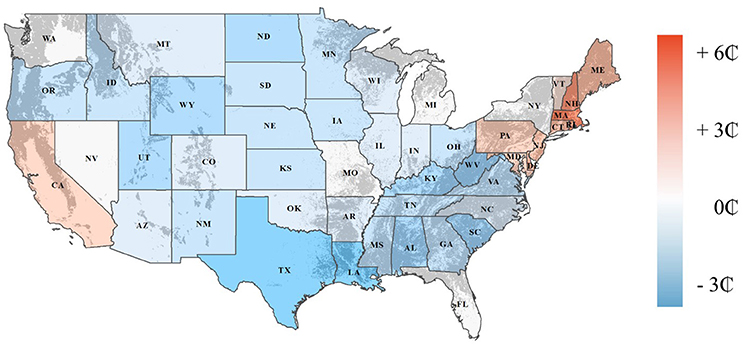
Figure 5. Change in sugar price from the base case using state-wide average industrial utility rates. Forest coverage background is shown in gray scale.
RIN-Enabled Sugar
The softwood biomass feedstock utilized in this study may be a Renewable Identification Number (RIN) enabled cellulosic feedstock, meaning biofuel produced from this sugar is eligible for RIN credits. A life cycle analysis will need to be completed to verify that eligibility. Providing RIN-enabled sugar to biofuel producers will cover some of the conversion costs or increase the return (Lane, 2013). The cellulosic waiver credit (CWC) is feedstock dependent and can be combined with D5 RINs if the fuel is advanced (Christensen et al., 2014). The CWC value is difficult to define as a result of low cellulosic biofuel production and the corresponding uncertainty in future values. However, the average of the CWC values published by the US EPA for 2010–2015 for jet fuel is $0.35/liter (Environmental Protection Agency, 2016). The CWC, claimed by the fuel producer, however, it is reasonable to assume that a producer will be willing to pay more for sugar that is RIN-enabled. Mathematical conversion of sugar to jet fuel was completed using the conversion of 3 kg/L of jet fuel (Lane, 2013). If the CWC is divided evenly between the sugar and fuel producers, a $0.06/kg MSSP increase is possible. This sugar to jet fuel yield may be process dependent; if a conservative conversion value of 4 kg/L is assumed the price differential drops to $0.04/kg sugar. Conservatively using the lower jet fuel yield, the MSSP would drop to $0.4559/kg sugar for the base case.
Optimized Sugar Cost
An optimized scenario was analyzed to determine the impact of selecting low values for multiple cost variables to manufacture non-concentrated sugar. The natural gas and electricity rates were both dropped to match Cowlitz County, WA values. This location was chosen to match the cost of feedstock, which was determined for a location inside this county (Table 6). The milling energy reduction is assumed to be attainable in the scale up from the small equipment used to attain the energy use values to industrial equipment. The RIN-enabled cost reduction is the 50/50 CWC value for the lower sugar to jet fuel yield. Together these values drop the non-concentrated MSSP to $0.33/kg.
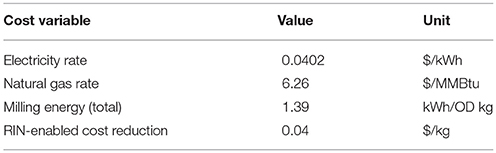
Table 6. Variables used to calculate the optimized non-concentrated sugar cost.
MSSP Comparison
The USDA publishes multiple annual sugar price indexes. The price for US raw sugar and glucose syrup were the closest to the product we are discussing. However, they are food grade products and although the lack of chemical pre-treatment means that this sugar could be food grade, approval by the Food and Drug Administration would be required. The values from 1990 to 2015 are shown in Figure 6 along with the base case, optimized case and optimized with the real discount rate increased to 15% (USDA, 2016a,b). The cost of sugar from micronized wood for the three chosen scenarios is comparable with both of the USDA data sets. Zhang et al. (2013) converted red oak into monosaccharides, gasoline, diesel and hydrogen to attain an 11.4% IRR; the sugar cost used was $0.64/kg. The prices calculated within this study illustrate that stopping at sugar is an economically viable pathway, depending on the market prices of downstream products.
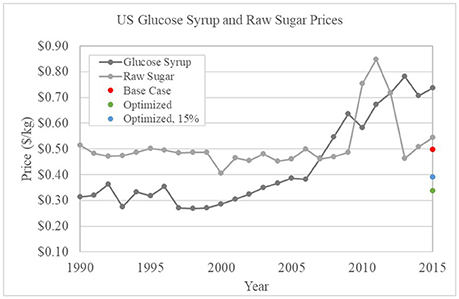
Figure 6. Fiscal year USDA US glucose syrup and raw sugar prices with the micronized base case, optimized and high IRR optimized sugar prices.
Conclusions
The results of the financial analysis of using mechanical pretreatment for conversion of softwood biomass, specifically FHR, into sugars is promising, with cost values in line with both US raw sugar and glucose syrup. The success of this technology will be controlled by electricity use and cost, siting decisions, downstream biofuel or biochemical production and the production of co-products. Investigation into higher-value lignin-based co-products could reduce the minimum sugar selling price. Additional analysis that will help better determine financial viability of micronizing wood include the use of micronizing depots and co-location cost reductions. These reductions may come in the form of overhead and fixed costs; however, they could also come from locating the facilities with a traditional wood-product facility to maximize the financial benefits of waste streams. Further cost reductions are possible with facility integration, co-location, siting at a closed mill or brownfield location.
Author Contributions
The study described in this work was designed by MW, JG, and JW and the data was largely compiled by KB, JG, and RW. The analysis was completed by KB, JG, RW, and MW. KB wrote the draft manuscript that was reviewed by MW, JG, RW, and JW.
Funding
This work, as part of the Northwest Advanced Renewables Alliance (NARA), was supported by the Agriculture and Food Research Initiative Competitive Grant no. 2011-68005-30416 from the USDA National Institute of Food and Agriculture. Partial funding was also generously provided by the Sun Grant Program as part of a project titled Advancing the National Bioeconomy through Regional Sun Grant Centers award number 2014-38502-22598.
Disclaimer
The views and opinions expressed in this article are those of the authors and do not necessarily reflect the official policy or position of any corporation and any agency of the U.S. government.
Conflict of Interest Statement
The authors declare that the research was conducted in the absence of any commercial or financial relationships that could be construed as a potential conflict of interest.
The reviewer, JST, and handling Editor declared their shared affiliation.
Acknowledgments
The authors express the sincere appreciation to Wallace E. Tyner and Dawoon Jeong for their assistance in completing the economic analysis. We would like to acknowledge the delivered feedstock cost modeling completed by Natalie Martinkus.
Supplementary Material
The Supplementary Material for this article can be found online at: https://www.frontiersin.org/articles/10.3389/fenrg.2018.00077/full#supplementary-material
Footnotes
1. ^ FS Geodata Clearinghouse. Forest Biomass Across the Lower 48 States and Alaska. United States Department of Agriculture Forest Service. Available online at: https://data.fs.usda.gov/geodata/rastergateway/biomass/index.php.
References
Astonios, K., Kougioumtzis, M. A., Panopoulos, K. D., and Kakaras, E. (2015). Alternative thermochemical routes for aviation biofuels via alcohols synthesis: process modeling, techno-economic assessment and comparison. Appl. Energy 138, 346–366. doi: 10.1016/j.apenergy.2014.10.056
Bann, S. J., Malina, R., Staples, M. D., Suresh, P., Pearlson, M., Tyner, W. E., et al. (2017). The costs of production of alternative jet fuel: a harmonized stochastic assessment. Bioresour. Technol. 227, 179–187. doi: 10.1016/j.biortech.2016.12.032
Biddy, M. J., Davis, R., Humbird, D., Tao, L., Dowe, N., Guarnieri, M. T., et al. (2016). The techno-economic basis for coproduct manufacturing to enable hydrocarbon fuel production from lignocellulosic biomass. ACS Sustainable Chem. Eng. 4, 3196–3211. doi: 10.1021/acssuschemeng.6b00243.
Biddy, M., and Jones, S. (2013). Catalytic Upgrading of Sugars to Hydrocarbons Technology Pathway. NREL Technical Report NREL/TP-5100-58055, PNNL-22319.
Cadoche, L., and López, G. D. (1989). Assessment of size reduction as a preliminary step in the production of ethanol from lignocellulosic wastes. Biol. Wastes 30, 153–157. doi: 10.1016/0269-7483(89)90069-4
Christensen, A., Searle, S., and Malins, C. (2014). “A conversational guide to… renewable identification numbers (RINs) in the U.S. Renewable fuel standard,” in ICCT Briefing, May 2014. Available online at: https://www.theicct.org/sites/default/files/publications/ICCTbriefing_RINs_20140508.pdf
Crawford, J. (2013). Techno-Economic Analysis of Hydrocarbon Biofuels From Poplar Biomass. Master's Thesis. Seattle, WA: University of Washington.
Davis, R., Tao, L., Tan, E. C. D., Biddy, M. J., Beckham, G. T., Scarlata, C., et al. (2013). Process Design and Economics for the Conversion of Lignocellulosic Biomass to Hydrocarbons: Dilute-Acid and Enzymatic Deconstruction of Biomass to Sugars and Biological Conversion of Sugars to Hydrocarbons. NREL/TP-5100-60223.
de Jong, S., Faaij, A., Slade, R., Mawhood, R., and Junginger, M. (2015). The feasibility of short-term production strategies for renewable jet fuels–a comprehensive techno-economic comparison. Biofuels Bioprod. Bioref. 9, 778–800. doi: 10.1002/bbb.1613
DiGiacoma, G., and Taglieri, L. (2009). Renewable energy benefits with conversion of woody residues to pellets. Energy 34, 724–731. doi: 10.1016/j.energy.2008.08.010
Dutta, A., Sahir, A., Tan, E., Humbird, D., Snowden-Swan, L. J., Meyer, P., et al. (2015). Process Design and Economics for the Conversion of Lignocellulosic Biomass to Hydrocarbon Fuels Thermochemical Research Pathways with In Situ and Ex Situ Upgrading of Fast Pyrolysis Vapors. NREL/TP-5100-62455, PNNL-23823.
EIA (2018a). Electricity: Detailed State Data. Average Price (Cents/kilowatthour) by State by Provider, 1990-2016. U.S. Energy Information Administration. Available online at: https://www.eia.gov/electricity/data/state/
EIA (2018b). Natural Gas Industrial Prices. U.S. Energy Information Administration. Available online at: http://www.eia.gov/dnav/ng/ng_pri_sum_a_epg0_pin_dmcf_a.htm
EIA (2018c). “Biomass Fuel Report Archvie” Data from January–December 2017. U.S. Energy Information Administration. (Accessed May 2, 2018). Available online at: https://www.eia.gov/biofuels/biomass/#archive
Elliott, D. C., Peterson, K. L., Muzatko, D. S., Alderson, E. V., Hart, T. R., and Neuenschwander, G. G. (2004). Effects of trace contaminants on catalytic processing of biomass-derived feedstocks. Appl. Biochem. Biotechnol. 113–116, 807–825. doi: 10.1385/A.B.A.B.:115:1-3:0807
Environmental Protection Agency (2016). Cellulosic Waiver Credits Purchased Annually. Environmental Protection Agency. (Accessed Septmeber 12, 2016). Available online at: https://www.epa.gov/fuels-registration-reporting-and-compliance-help/cellulosic-waiver-credits-purchased-annually
Esteban, L. S., and Carrasco, J. E. (2006). Evaluation of different strategies for pulverization of forest biomasses. Powder Technol. 166, 139–151. doi: 10.1016/j.powtec.2006.05.018
Fish, D., Dallmeyer, I., Fox, C., Eatherton, R., Cline, S., Casayuran, C., et al. (2016). Nara Report: Conversion of Lignin to High Value, Large Market Products. Available online at http://hdl.handle.net/2376/11921
Gao, J., Anderson, D., and Levie, B. (2013). Saccharification of recalcitrant biomass and integration options for lignocellulosic sugars from catchlight energy's sugar process (CLE Sugar). Biotechnol. Biofuels 6:10. doi: 10.1186/1754-6834-6-10
Gao, J., and Neogi, A. (2015). NARA Report: Clean Sugar and Lignin Pretreatment Technology. NARA Report. Available online at: http://hdl.handle.net/2376/6399
Gu, B.-J., Wang, J., Wolcott, M. P., and Ganjyal, G. M. (2018). Increased sugar yield from pre-milled Douglas-fir forest residuals with lower energy consumption by using planetary ball milling. Bioresour. Technol. 251, 93–98. doi: 10.1016/j.biortech.2017.11.103
Guan, W., and Blersch, D. (2018). Effects of Tween 80 on fermentative butanol production from alkali-pretreated switchgrass. Biochem. Engin. J. 135, 61–70. doi: 10.1016/j.bej.2018.03.015
He, J., and Zhang, W. (2011). Techno-economic evaluation of thermo-chemical biomass-to-ethanol. Appl. Energy 88, 1224–1232. doi: 10.1016/j.apenergy.2010.10.022
Humbird, D., Davis, R., Tao, L., Kinchin, C., Hsu, D., and Aden, A. (2011). Process Design and Economics for Biochemical Conversion of Lignocellulosic Biomass to Ethanol Dilute-Acid Pretreatment and Enzymatic Hydrolysis of Corn Stover. NREL/TP 5100–47764.
IRS (2017). IRS Publication, 946. How To Depreciate Property. (Accessed April 3, 2018). Available online at: https://www.irs.gov/publications/p946/ar02.html
Jones, S., Meyer, P., Snowden-Swan, L., Padmaperuma, A., Tan, E., Dutta, A., et al. (2013). Process Design and Economics For the Conversion of Lignocellulosic Biomass to Hydrocarbon Fuels: Fast Pyrolysis and Hydrotreating Bio-Oil Pathway. PNNL-23053, NREL/TP-5100-61178.
Jönsson, L., Alriksson, B., and Nilvebrant, N. O. (2013). Bioconversion of lignocellulose: inhibitors and detoxification. Biotechnol. Biofuels 6:16. doi: 10.1186/1754-6834-6-16
Kim, J., Realff, M. J., Lee, J. H., Whittaker, C., and Furtner, L. (2011). Design of biomass processing network for biofuel production using an MILP model. Biomass Bioenergy 35, 853–871. doi: 10.1016/j.biombioe.2010.11.008
Kim, S., and Dale, B. E. (2015). Comparing alternative cellulosic biomass biorefining systems: centralized versus distributed processing systems. Biomass Bioenergy 74, 135–147. doi: 10.1016/j.biombioe.2015.01.018
Kim, S., and Dale, B. E. (2016). A distributed cellulosic biorefinery system in the US Midwest based on corn stover. Biofuels Bioprod. Bioref. 10, 819–832. doi: 10.1002/bbb.1712
Lane, J. (2013). Amyris: Can Their Renewable Jet Fuel Ever be Affordable?. Biofuels Digest, 27 June 2013. Available online at: http://www.biofuelsdigest.com/bdigest/2013/06/27/amyris-can-their-renewable-jet-fuel-ever-be-affordable/
Mani, S., Sokhansanj, S., Bi, X., and Turhollow, A. (2006). Economics of producing fuel pellets from biomass. Appl. Eng. Agricult. 22, 421–426. doi: 10.13031/2013.20447
Marrs, G., Spink, T., and Gao, A. (2016). Process Design and Economics for Biochemical Conversion of Softwood Lignocellulosic Biomass to Isoparaffinic Kerosene and Lignin Co-products. NARA final report.
Martinkus, N., Latta, G., Morgan, T., and Wolcott, M. (2017). A comparison of methodologies for estimating delivered forest residue volume and cost to a wood-based biorefinery. Biomass Bioenergy 106, 83–94. doi: 10.1016/j.biombioe.2017.08.023
Martinkus, N., and Wolcott, M. (2017). A framework for quantitatively assessing the repurpose potential of existing industrial facilities as a biorefinery. Biofuel Bioprod. Bior. 11, 295–306. doi: 10.1002/bbb.1742
McMillan, J. D. (1994). “Pretreatment of lignocellulosic biomass,” in Enzymatic Conversion of Biomass for Fuels Production, eds M. E. Himmel, J.O. Baker, and R. P. Overend (Washington, DC: American Chemical Society), 292–324.
Mosier, N., Wyman, C., Dale, B., Elander, R., Lee, Y. Y., Holtzaplle, M., et al. (2005). Features of promising technologies for pretreatment of lignocellulosic biomass. Bioresour. Technol. 96, 673–686. doi: 10.1016/j.biortech.2004.06.025
MYPP BETO (2016). Multi-Year Program Plan: Bioenergy Technologies Office. US Department of Energy: Energy Efficiency and Renewable Energy. Available online at: https://www.energy.gov/sites/prod/files/2016/07/f33/mypp_march2016.pdf
Peters, M. S., Timmerhaus, K. D., and West, R. E. (2003). “Analysis of cost estimatio” in Plant Design and Economics for Chemical Engineers, 5th Edn. (New York, NY: McGraw-Hill), 226–278.
Petter, R., and Tyner, W. E. (2014). Technoeconomic and policy analysis for corn stover biofuels. ISRN Econ. 2014:515898. doi: 10.1155/2014/515898
Piccolo, C., and Bezzo, F. (2009). A techno-economic comparison between two technologies for bioethanol production from lignocellulose. Biomass Bioenergy 3, 478–491. doi: 10.1016/j.biombioe.2008.08.008
Pirraglia, A., Gonzalez, R., and Saloni, D. (2010a). Techno-economical analysis of wood pellets production for U.S. manufacturers. BioResources 5, 2374–2390. doi: 10.15376/biores.5.4.2374-2390
Pirraglia, A., Gonzalez, R., and Saloni, D. (2010b). Wood pellets: an expanding market opportunity. Biomass Magazine Available online at http://biomassmagazine.com/articles/3853/wood-pellets-an-expanding-market-opportunity
Qian, Y., and McDow, W. (2013). The Wood Pellet Value Chain: An Economic Analysis of the Wood Pellet Supply Chain From the Southeast United States to European Consumers. US Endowment for Forestry and Communities.
Repellin, V., Govin, A., Rolland, M., and Guyonnet, R. (2010). Energy requirements for fine grinding of torrefied wood. Biomass Bioenergy 34, 923–930. doi: 10.1016/j.biombioe.2010.01.039
Sun, Y., and Cheng, J. (2002). Hydrolysis of lignocellulosic materials for ethanol production: a review. Bioresour. Technol. 83, 1–11. doi: 10.1016/S0960-8524(01)00212-7
US DOE (2011). “U.S. Billion-ton update: biomass supply for a bioenergy and bioproducts industry,” in ORNL/TM-2011/224, eds R. D. Perlack and B. J. Stokes (Leads) (Oak Ridge, TN: Oak Ridge National Laboratory), 227.
USDA (2016a). Sugar and Sweetners Yearbook Tables. Table 4: U.S. Raw Sugar Price, Duty Fee Paid, New York, Monthly, Quarterly, and by Calendar and Fiscal Year. (Accessed September 1, 2016). Available online at http://www.ers.usda.gov/data-products/sugar-and-sweeteners-yearbook-tables.aspx#25498
USDA (2016b). Sugar and Sweetners Yearbook Tables. Table 7: U.S. Wholesale List Price For Glucose Syrup, Midwest Markets, Monthly, Quarterly, and by Calendar and Fiscal Year. (Accessed September 1, 2016). Available online at http://www.ers.usda.gov/data-products/sugar-and-sweeteners-yearbook-tables.aspx#25498
Wang, J., Gao, J., Brandt, K. L., Jiang, J., Liu, Y., and Wolcott, M. P. (2018). Improvement of enzymatic digestibility of wood by a sequence of optimized milling procedures with final vibratory tube mills for the amorphization of cellulose. Holzforschung 72, 435–441. doi: 10.1515/hf-2017-0161
Weil, J. R., Dien, B., Bothast, R., Hendrickson, R., Mosier, N. S., and Ladisch, M. R. (2002). Removal of fermentation inhibitors formed during pretreatment of biomass by polymeric adsorbents. Ind. Eng. Chem. Res. 41, 6132–6138. doi: 10.1021/ie0201056
Wright, M. M., Brown, R. C., and Boateng, A. A. (2008). Distributed processing of biomass to bio-oil for subsequent production of Fischer-Tropsch liquids. Biofuels Bioprod. Bioref. 2, 229–238. doi: 10.1002/bbb.73
Wright, M. M., Daugaard, D. E., Satrio, J. A., and Brown, R.C. (2010). Techno-economic analysis of biomass fast pyrolysis to transportation fuels. Fuel 89, S2–S10. doi: 10.1016/j.fuel.2010.07.029
Wyman, C. E. (2003). Potential synergies and challenges in refining cellulosic biomass to fuels, chemicals, and power. Biotechnol. Prog. 19, 254–262. doi: 10.1021/bp025654l
You, F., and Wang, B. (2011). Life cycle optimization of biomass-to-liquid supply chains with distributed-centralized processing networks. Ind. Eng. Chem. Res. 50, 10102–10127. doi: 10.1021/ie200850t
Zhang, X., Guo, M., and Lin, K. (2016). Techno-Economic Analysis (TEA) of Distributed Sugar Depot Based on Mechanical Deconstruction (pretreatment) of Forest Residues. NARA Cumulative Report: Education Team, April 2015–June 2016.
Zhang, Y., Brown, T. R., Hu, G., and Brown, R. C. (2013). Techno-economic analysis of monosaccharide production via fast pyrolysis of lignocellulose. Bioresour. Energy 127, 358–365. doi: 10.1016/j.biortech.2012.09.070
Zhu, J. Y., and Pan, X. J. (2010). Woody biomass pretreatment for cellulosic ethanol production: technology and energy consumption evaluation. Bioresour. Technol. 101, 4992–5002. doi: 10.1016/j.biortech.2009.11.007
Zhu, J. Y., Pan, X. J., Wang, G. S., and Gleisner, R. (2009). Sulfite pretreatment (SPORL) for robust enzymatic saccharification of spruce and red pine. Bioresour. Technol. 100, 2411–2418. doi: 10.1016/j.biortech.2008.10.057
Zhu, J. Y., Subhosh, C. M., Gu, F., Gleisner, R., Reiner, R., Sessions, J., et al. (2015). Using sulfite chemistry for robust bioconversion of Douglas-fir forest residue to bioethanol at high titer and lignosulfonate: a pilot-scale evaluation. Bioresour. Technol. 179, 390–397. doi: 10.1016/j.biortech.2014.12.052
Keywords: cellulosic sugar, clean sugar, mechanical pretreatment, amorphization milling, technoeconomic analysis, three-stage milling, fuel pellets
Citation: Brandt KL, Gao J, Wang J, Wooley RJ and Wolcott M (2018) Techno-Economic Analysis of Forest Residue Conversion to Sugar Using Three-Stage Milling as Pretreatment. Front. Energy Res. 6:77. doi: 10.3389/fenrg.2018.00077
Received: 09 April 2018; Accepted: 17 July 2018;
Published: 14 August 2018.
Edited by:
J. Richard Hess, Idaho National Laboratory (DOE), United StatesReviewed by:
Wenjian Guan, Harvard University, United StatesJaya Shankar Tumuluru, Idaho National Laboratory (DOE), United States
Copyright © 2018 Brandt, Gao, Wang, Wooley and Wolcott. This is an open-access article distributed under the terms of the Creative Commons Attribution License (CC BY). The use, distribution or reproduction in other forums is permitted, provided the original author(s) and the copyright owner(s) are credited and that the original publication in this journal is cited, in accordance with accepted academic practice. No use, distribution or reproduction is permitted which does not comply with these terms.
*Correspondence: Kristin L. Brandt, a3Jpc3Rpbi5icmFuZHRAd3N1LmVkdQ==