 Abby Samson
 Michal Mos
 Jan Najser
 Maurycy Daroch
 Joe Gallagher
- 1School of Engineering, University of Lincoln, United Kingdom
- 2Energene sp. z o.o., Poland
- 3Centre ENET, VSB-Technical University of Ostrava, Czechia
- 4School of Environment and Energy, Peking University Shenzhen Graduate School, China
- 5Institute of Biological, Environmental & Rural Sciences, Aberystwyth University, United Kingdom
Gasification of Miscanthus x giganteus (Mxgig), is highly promising due to the high efficiency of the process and the many advantageous properties of this crop. Pilot-scale, fixed bed gasification studies were performed utilizing this fuel at three temperatures (750, 850, and 950°C) to determine the process effects of temperature on gas quality and tar yields. Simple thermodynamic equilibrium modeling was successfully applied to the pilot-scale gasification process. The Mxgig crop performed well, with best process stability reached at temperatures of 800°C or higher. Average calorific values of the product gases were highest at around 850°C at 5.2 MJ·m−3. Tar yields gradually increased with increasing temperature and dropped after 900°C. The presented thermodynamic equilibrium model conformed well with experimental results, deviating little in terms of O2, CO2, H2, and CH4 and no more than 8.1% in the case of CO. This indicates that simple modeling methods can be utilized to predict gas compositions for the pilot-scale.
Introduction
Biomass is a low-carbon resource, which is finding increasing use in place of fossil fuels both for energy and chemical stock. Offering several advantages over other renewables such as wind and solar energies, biomass can be stored and supplied on demand. Various routes for thermochemical conversion of biomass exist. Currently, direct combustion or co-firing of lignocellulosic feedstocks is favored due partially to the lower capital investment required when existing facilities are used, and also due to perceived simplicity of operation (Xue et al., 2014). Gasification is a highly promising alternative to direct combustion and has been shown to have high energy efficiency and improved environmental performance (Kirkels and Verbong, 2011; Pereira et al., 2012; Xue et al., 2014). It has the added potential of being applied for chemical and fuel production (Kirkels and Verbong, 2011). Gasification involves the conversion of a solid fuel into a gas through partial oxidation at elevated temperatures (generally between 750 and 1,000°C). The main components of this gas, commonly called “producer gas,” are CO, H2, CH4, N2, and CO2 (Kuo et al., 2014; Xue et al., 2014). The producer gas can either be directly combusted, or can undergo further upgrading for the production of chemicals and fuels. Several factors affect gas composition, including the type biomass feedstock utilized, type of gasifier utilized, the gasifying agent, residence time, and also the temperature of the process (Heidenreich and Foscolo, 2015). Producer gas contains impurities such as tars, particulates, nitrogen and sulfur compounds (Galindo et al., 2014). Tar specifically introduces difficult technical barriers and its elimination or reduction is a highly active topic of study (Li and Suzuki, 2009). Because gasification technology can be highly flexible in terms of feedstock materials (Heidenreich and Foscolo, 2015), it is seen as an exciting opportunity to utilize more local fuels (Erlich and Fransson, 2011). In Europe, biomass energy crops are becoming widely cultivated (Xue et al., 2014) and include species such as Salix viminalis, Miscanthus x giganteus (Mxgig) and Andropogon Gerardi (Smolinski et al., 2010). Perennial grasses have a high growth potential in central Europe (van Dam et al., 2007; Xue et al., 2014). Mxgig, which is a perennial grass, provides some valuable advantages including its simple cultivation and harvesting, excellent yields and relatively high calorific values (ca. 17 kJ/kg for dry matter; Khelfa et al., 2009). In a European Miscanthus study, Hodgson et al. (Hodgson et al., 2010) showed that Mxgig has a high lignin content, compared with other biomass crops, which is advantageous for thermochemical conversion due to its higher energy content when compared with cellulose and hemicelluloses (Demirbaş, 1997; Friedl et al., 2005; Hodgson et al., 2011). Mxgig has also been shown to have low mineral content and high efficiency of carbon sequestration above and below ground (Xue et al., 2014). To date, most Miscanthus gasification studies have been performed on small, laboratory-scale, reactors, and little information could be found by the authors on pilot-scale work in fixed bed reactors, though the suitability of this fuel as a gasification feedstock should rely on pilot-scale trials (Simone et al., 2012). Additionally, thermodynamic equilibrium modeling is a simple way to predict gas composition for various feedstocks, used in a given gasifier. Outputs of such models have been shown to be accurate (Pandey et al., 2013). Different thermodynamic equilibrium models exist in the literature, however, these have also been limited in relying upon small, laboratory-scale, experimental data (Schuster et al., 2001; Zainal et al., 2001; Altafini et al., 2003; Ramanan et al., 2008; Pandey et al., 2013). It is therefore, necessary to determine if such kinetic models can accurately predict conversion when based upon pilot-scale data for conditions comparable to actual industrial-scale applications.
This publication presents pilot-scale, fixed bed, gasification studies on Mxgig, specifically looking at the effect of temperature on gas quality. The simplistic design of the gasifier lends itself more easily to further industrial scale-up. The work presented also includes thermodynamic equilibrium modeling of the pilot-scale gasification process to determine success of prediction based on pilot-scale data and to discover any issues or points of divergence from experimental data and similar models applied to laboratory-scale experiments.
Experimental
Feedstock
Pure Mxgig (from Poland, provided by Energene Sp. z o.o.) pellets were utilized in this work. They ranged in size between 6 mm in width and 10–30 mm in length. The Proximate analysis of these pellets was conducted according to the British standards BS EN 14774-1:2009, BS EN 15148:2009, and BS EN 14775:2009. The Proximate and Ultimate analyses of this fuel are shown in Table 1. The pellets are characterized by low ash, moisture, nitrogen and sulfur content, making them good candidates for gasification (Kallis et al., 2013).
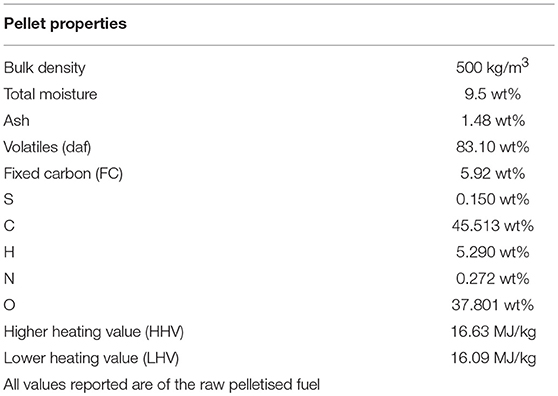
Table 1. Proximate and Ultimate Analysis of Miscanthus x giganteus Pellets.
Pilot-Scale Gasification Unit
The reactor, VT1, located in the Energy Research Center at the Technical University of Ostrava in the Czech Republic was built in 2007. It is a 100 kW unit, capable of gasifying biomass and alternative fuels. The fixed-bed autothermal gasification reactor operated under low under-pressure conditions produced by an air fan and is capable of utilizing both pellets and chips. The operational temperature can be regulated from 750°C to 1,000°C. The unit uses air as the gasifying agent and can additionally be enriched by steam or oxygen. The amount of added air was measured by a TIESTO flow meter, and was not preheated although preheating of the gasification agent both increases the efficiency and stabilizes the process. The top-loaded fuel tank has a capacity of 0.7 m2. Two screw conveyers transported the fuel into the reactor. The fuel was supplied constantly at variable rates, which resulted in continuous operation conditions and steady gas compositions. Automatic control systems regulate the amount of fuel delivered to the reactor based on a set gasification temperature, with more fuel delivered if temperatures dropped. Four circumferentially installed nozzles allowed for uniform distribution of the gasifying agent to reach the reactor bed, insuring a uniform temperature field. The cyclone separated bigger dust particles and charcoal from the hot gas. The gas was cooled by two heat exchangers to 150°C. Figure 1 shows both 3D and 2D depictions of the gasification unit. The ultimate flue gases leaving the combustion chamber had a temperature of around 900°C (unit 1 in Figure 1).
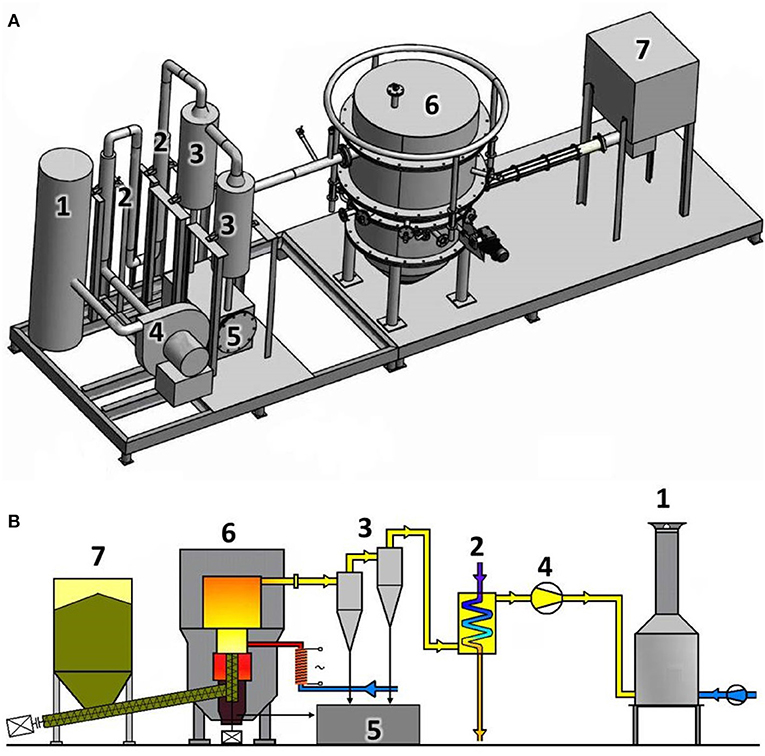
Figure 1. (A) 3D-Schematic (B) 2D-Schematic of the pilot-scale gasifier at the Energy Research Center (1, combustion chamber; 2, coolers; 3, cyclones; 4, air fan; 5, ash bunker; 6, reactor; 7, fuel tank).
There are three sampling points installed; one for the gas, one for the fines and one for the tars. The gas was sampled after the fan while tars and particulates are sampled downstream of the reactor.
The pellets were introduced into the reactor via two screw feeders as shown in Figure 2. The first screw feeder is 2 m long and transported the fuel horizontally from the fuel tank into bottom part of the reactor. The second screw feeder is 0.5 m long and transported the pellets up into the gasifier forming fuel layer of pellets lying on the grate where the gasification reactions took place. This layer was nearly 30 cm high and had a diameter of 28 cm. Both screw feeders have a diameter of 15 cm. The gasification chamber is 0.3 m high and has a diameter of 0.28 m. Fuel feeding rates used were 26.6, 17.2, and 13.1 kg/h for gasification temperatures of 950, 850, and 750°C, respectively.
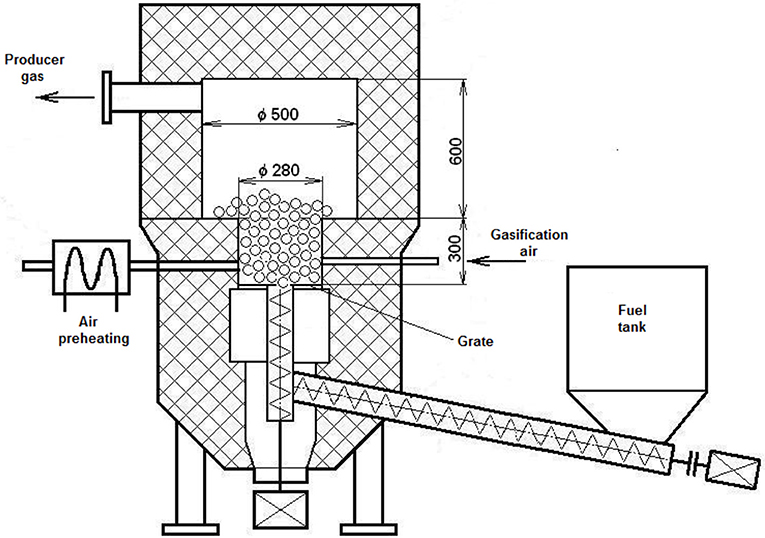
Figure 2. Pellet Feeding System and Gasification Chamber.
The reactor is insulated by 5 cm of inner heat-resistant concrete and a further 40 cm of glass wool. During gasification runs, temperatures on the outer surfaces remained at or below 50°C.
Online Gas Analysis
Once cooled, the combustibles in the gas (CO, CH4, C2H6, C2H4, C2H2, benzene, and other CxHy) were measured with a multicomponent GASMET FTIR analyzer (model XC4000). A filter, installed in the pipeline, was used to clean the gas and remove solid particles. Gas was transported into the analyzer after dilution with nitrogen (1:50 gas: N2). Data was recorded at intervals of 1 min. Prior to experimental analysis, the FTIR system was calibrated using nitrogen.
CO2 concentrations were measured with a Servomex IR Gas Analyzer PA 404. The analyzer was operated between 0 and 25% CO2 and calibrated with two points, the first at 0% and the second at 10% CO2.
The oxygen concentration in the gas, used in the conversion of gas compositions, was measured using a PMA 30 AFRISO analyzer which has a range of 0–30% O2. Two points were used to calibrate the instrument, one at 0% and the second at 21% O2. Samples were collected at four different temperatures and sent for analysis to the Nanotechnology Center VSB in the Technical University of Ostrava to determine H2 concentrations.
Particulates, Temperature and Gas Flow Rate Measurements
The particulate matter in the produced gas was measured according to ISO standard 9096. The measurement method was based on an isokinetic sample taken from the gas pipeline. In order to determine the concentration of dust, a measuring probe was installed and subsequently connected to a short hose attached to an electric particulate filter that separates the dust from the gas. A glass microfiber filter produced by Munktell was used. The gas was then fed to a condenser for analysis of moisture content. Upon exiting the condenser, the gas was dry and at room temperature. In the conducted experiments, there was under-pressure in the pipeline of up to 5 kPa. The pressure was measured by pressure transmitters from BD|SENSORS. Temperatures were recorded with K-type thermocouples attached to data loggers. After a temperature segment was completed, the filter was weighed to determine the amount of particulates collected. Particulate concentrations were recorded as the ratio of captured dust to gas collected. Figure 3 shows a schematic of the particulate capture installation.
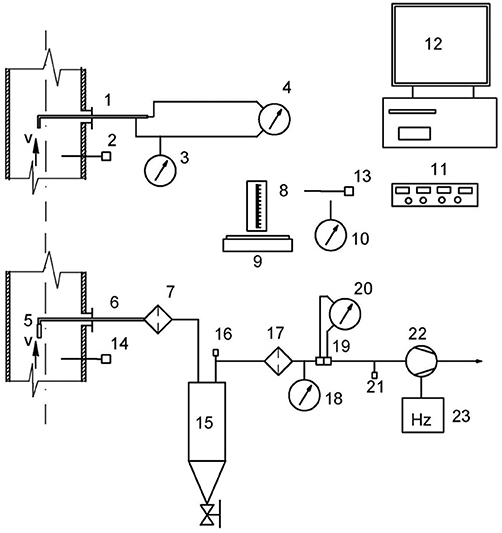
Figure 3. Particulate Capture Schematic: 1. Prandtl tube, 2. Thermocouple, 3. Manometer for measuring static pressure, 4. Manometer for measuring differential pressure, 5. Nozzle sampling probes, 6. Sampling probe, 7. Heating filter, 8. Lab bulb, 9. Weight measurement, 10. Manometer for atmospheric pressure, 11. Data capture module, 12. PC for data recording, 13. Thermocouple for ambient temperature, 14. Thermocouple, 15. Condenser, 16. Thermocouple exit gas from condenser, 17. Filter to protect the pump, 18. Manometer for measuring the static pressure at the condenser, 19. Aperture, 20. Manometer for flow measurement, 21. Manometer behind the aperture, 22. Vacuum pump, 23. Frequency converter.
Measurement of Tars
Tar content in the producer gas was determined according to CEN/TS 15439:2006, Biomass gasification-Tar and particulates in product gases-sampling and analysis. The gas was directed to an electrically heated filter with a glass fiber membrane. The tars and solids collected on the filter were then separated. The synthesis gas was passed through impinger bottles filled with isopropanol to absorb the tar. All unheated parts along the gas-sampling route are made of glass or Teflon to minimize tar adsorption onto the walls of the measuring apparatus. The last impinger was attached to a drying column (via a silicone tube) packed with silica gel and then to a flow control pump. Sample gas quantities were measured by a gasometer G4.
After the completion of a gas sampling run, the filter was transferred to a sample container. All glass or Teflon parts of the measuring apparatus were washed with isopropanol and this tar-isopropanol solution collected. Tar concentration was determined using a Zymark instrument at 60°C and a volume of ~5 ml.
Tar concentrations in the filters were determined by placing each filter in an extraction cartridge and dried for 6 h at 105°C. Once allowed to cool in a desiccator, the sample weight was recorded. The sample was extracted in dichloromethane (DCM, CH2Cl2) for 6 h, after which the sample was dried, cooled and weighed.
Ultimately, the extract from the filters and the impinger solutions were placed in a rotary evaporator (RVO), operated at 60°C, to drive off the alcohol while flushing with N2 for 30 min. Samples were then dried for 2 h at 50°C, allowed to cool and weighed.
Tar concentrations were calculated as the ratio of the extracted amount of tar per amount of received sample gas.
Figure 4 shows a diagram of the apparatus utilized in tar concentration determination.
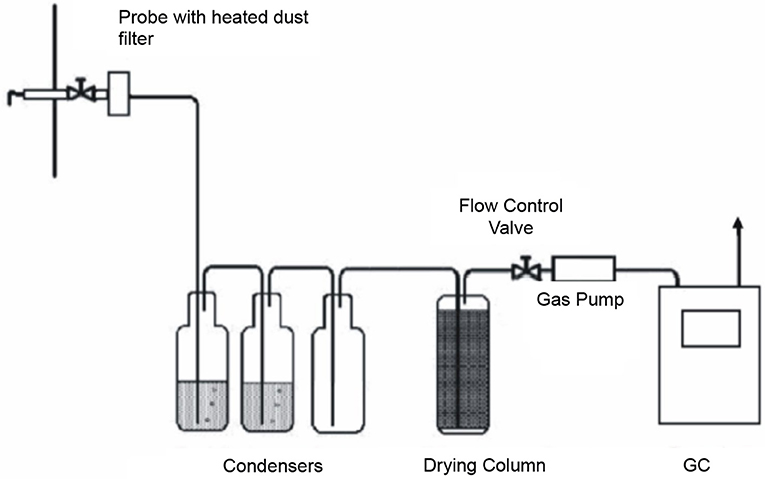
Figure 4. Schematic of tar collection assembly.
Experimental Matrix
Mxgig was gasified and the process was monitored at three temperatures of 750, 850, and 950°C. The gasification medium was air without preheating. Operating parameters including temperature and pressure, as well as gas composition and quality, particulates and tars, were monitored throughout.
Results and Discussion
Temperature Profiles
At the start of an experiment, the installation was heated to 1,000°C. Once this temperature was achieved, fuel was added to the reactor, forming a uniform layer, verifiable through a sight glass, and the first endothermic reactions initiated. After several minutes the gasification temperature stabilized and was maintained ±30°C for 1–2 h. The gasification temperature is maintained by manipulation of the fuel feeding rate. Results showed that satisfactory process stability was obtained during the two higher gasification temperature regions (850 and 950°C). It was observed that process stability was compromised at temperatures below 800°C in this pilot reactor. This was likely due to increased bulk bed density at lower gasification temperatures as described by Teixeira et al. (2014). Increased bulk density of the bed restricts gas flow in the reactor and impacts on the temperature profile (Susastriawan et al., 2017).
Gas Composition
Figure 5 shows averaged gas compositions for the three chosen temperature zones, derived from FTIR analysis. The compositions were calculated assuming that there was no O2 present in the gas. The tar sampling times are also shown.
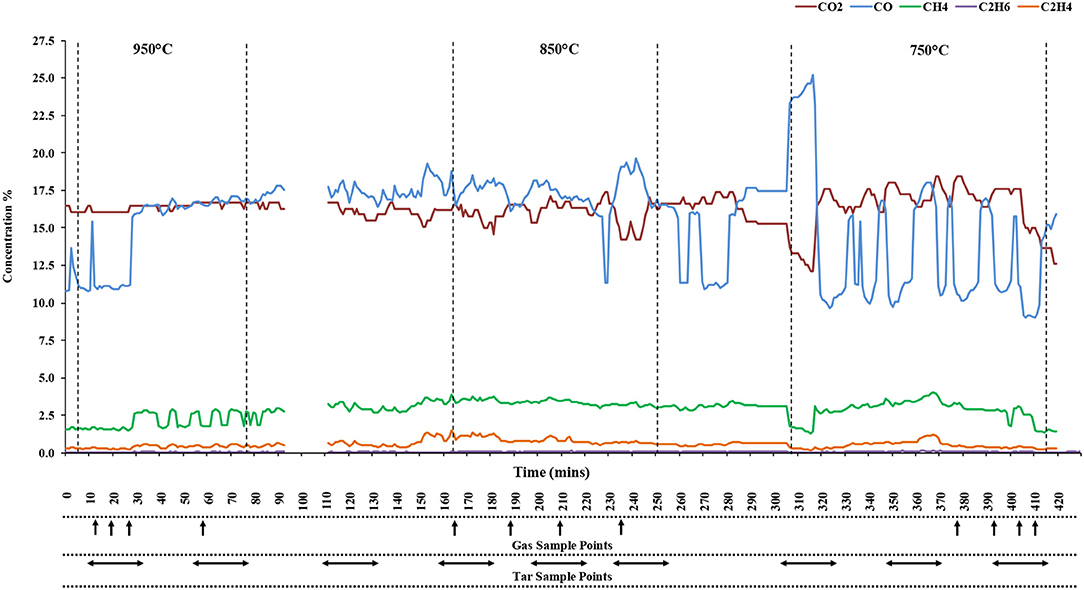
Figure 5. Gas composition monitoring and gas, tar sampling times.
From the levels of CO and CO2, it can be seen that the process was stable for the two higher temperature zones, 950 and 850°C, while greater fluctuations of these gases at lower temperatures illustrates a lower stability of the system. Decreased stability at 750°C, as noted by the spike in CO concentration and drop in CH4, was likely due to reduced heat flow through the length of the reactor. An uneven temperature profile was observed in the 750°C region and resulted in a lack of stability in producer gas composition as can be seen in b. Concentrations of CO will have a significant impact on the calorific value of the gas.
Total gas composition results are shown in Figure 6 (and are also provided in the Supplementary Material). Also included, are the calorific values (LHV), which were calculated for the regions when the reactor was considered stable. Gas sampling time was relatively short and to avoid errors in the final results, gas samples were collected four times (four repetitions) at each gasification temperature. The values from each repetition were averaged. A comparison of the concentrations of individual species measured online and offline showed good agreement.
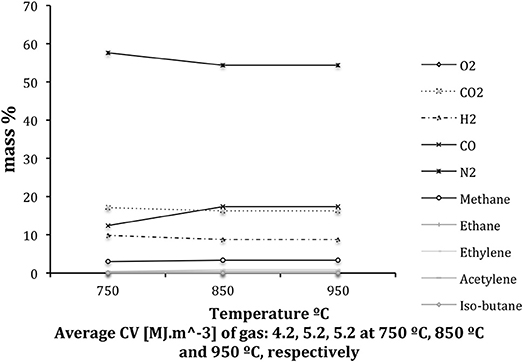
Figure 6. Average gas compositions at the three temperature regions studied.
A comparison of the calorific values of the gases obtained at the three varying temperatures showed that as the bed temperature dropped, an increase in the CV is observed. This indicated a regularity in the gasification process itself, irrespective of the chosen operating temperature.
Gasification rates fundamentally affect the economics of the process. The gasification rates, i.e., percentages of energy in the fed fuel converted into chemical energy in the produced gases, were 60% at 950°C, 74% at 850°C, and 65% at 750°C. Typical efficiencies for this type of reactor range between 80 and 90%. The drop in efficiencies achieved in this case is attributed to the use of cold gasification air. In commercial units, the air should be pre-heated. Thermal efficiency can also be increased with improvements in the insulation of the reactor and gas pipelines, particularly toward the bottom of the chamber where the looking glass is situated.
Tar Concentrations
Tars produced during the gasification process were sampled several times at each of the three chosen temperatures. Volatiles released in the pyrolysis zone of the reactor are the main source of tar in the producer gas. Properties of tars (concentration and composition) depend on several parameters including the heating rate, as well as the temperature and residence time in the hot section of reactor (Bhavanam and Sastry, 2011). The amount of tar contained in the gas also greatly depends on the moisture content of the solid fuel. Table 2 lists the tar concentrations collected at 950, 850, 750°C, respectively.
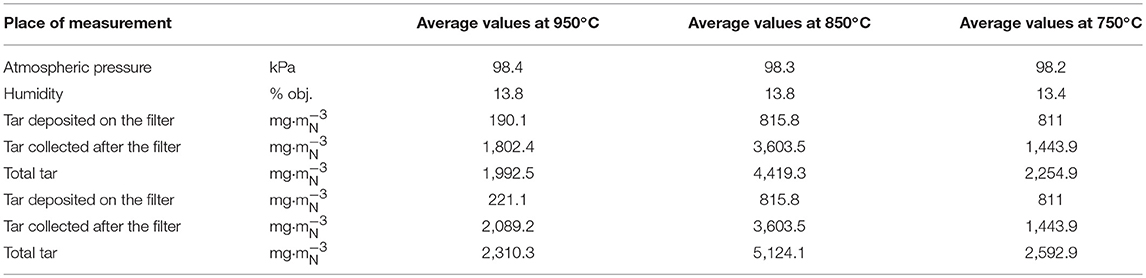
Table 2. Tar collected at 950, 850, and 750°C.
Previous studies by Fagbemi et al. have shown that gasification tar yields increase initially as temperatures rise to 600°C and then drop as the temperature continues to rise (Fagbemi et al., 2001). A similar pattern of a gradual rise and drop in tar yields was observed in this pilot-scale study. However, this shift in tar yield occurred as the temperature was approaching 900°C rather than the 600°C reported for bench-scale studies. Tar levels rose from 2,593 mg·m at 750°C to almost double (5,124 mg·m) at 850°C and then diminished to 2,310 mg·m at 950°C. The observed decrease in tar yield is likely due to tar cracking at such elevated temperatures.
Thermodynamic Equilibrium Modeling
Any algorithm for the approximation of downdraft gasification product gas compositions must be based on the chemical equilibrium between the different reaction species. In considering the chemical equilibrium, several assumptions are necessarily made. These include an infinite residence time such that the pyrolysis products burn and achieve thermodynamic equilibrium in the reaction zone prior to exiting the gasifier. Additionally, the products are tar free and assumed to behave as ideal gases and only include H2, CO, CO2, CH4 and N2 (Zainal et al., 2001; Altafini et al., 2003). Equilibrium data can be utilized to describe and study the most significant parameters influencing a gasification process (Schuster et al., 2001; Zainal et al., 2001). Based on the elemental analysis of the Mxgig pellets provided in Table 1, the molecular weight of the fuel can be estimated. C, H, N, S, O percentages can be converted to moles, which can then be summed, achieving a molecular weight of 23.6406 gmol−1 for pellet fuel and a molecular formula of C1H1.4009 O0.6316N0.00518S0.00125. Having obtained the molecular formula and weight of the fuel, a general conversion reaction must also be assumed as follows:
where W is the molar amount of water present per mole of fuel according to the equivalence ratio, m is the molar amount of air used in stoichiometric gasification and X1 through X7 are the equilibrium constants for the conversion reaction. Based on Equation (1), a series of mole balances can be calculated.
Carbon balance (assuming one mole of carbon in the fuel):
Hydrogen balance:
Oxygen balance:
Sulfur balance:
Nitrogen balance:
To determine the equilibrium constants described in Equation (1), it is necessary to rely upon the following intermediate reactions occurring during gasification (Schuster et al., 2001; Ramanan et al., 2008):
Based on the mole fractions or the partial pressures of the gaseous products and reactants, reaction rate constants are calculated as follows:
Methane formation
Water gas shift reaction
Equation (12) proceeds at a negligible rate in comparison to Equation (11). Therefore, only Equation (11) is taken into account when calculating the third reaction equilibrium constant.
Methane decomposition
Methane formed during gasification at high temperatures reacts endothermically with the formed water vapors and degrades into CO, CO2 and H2. Therefore, methane decreases as temperature increases (Ramanan et al., 2008).
According to the Gibbs function () at a constant pressure of 1 atm, an equilibrium constant is a function of temperature only (Perry and Green, 1984).
Where R is the universal gas constant, T is the temperature in Kelvin, and:
Where is the Gibbs function of formation at 1 atm and:
Where the values of a, b, c, d, e, f, and g are constants and h is the heat of formation. These values are presented for CO, CO2, H2O, CH4 in Synthetic fuels (Probstein and Hicks, 2006).
was calculated for Equations (9–11) according to Equations (17,18) using values in (Probstein and Hicks, 2006). This was done for the three relevant temperatures of 750, 850, and 950°C (i.e., 1,023, 1,123, and 1,223 Kelvin).
According to Perry's Chemical Engineer's Handbook (Perry and Green, 1984), The dependence of ΔGo on temperature can also be described as:
Where ΔHo is the change in enthalpy of each reaction from standard temperature to one of the three relevant temperatures 1,023, 1,123, and 1,223 Kelvin.
Rearrangement of Equations (16,19) yields:
Where I is the integration constant. The enthalpies can be found according to the following expression (Perry and Green, 1984):
Where J is a constant and A–D are the heat capacities for the different gas species (Δ implies products–reactants). Substituting Equation (21) into Equation (20), yields:
Therefore:
Equations (22,23) can be used to find the equilibrium constant for any reaction at a known T.
Thus the values for the equilibrium constants for the three main intermediate gasification reactions are presented in Table 3A.
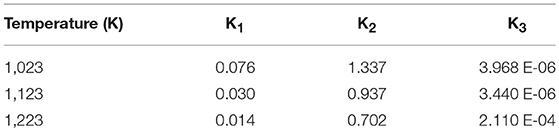
Table 3A. Model results: equilibrium constant values.
Ultimately, based on the molar balance equations and the equilibrium constant values, all of the gasification reaction coefficient values from Equation (1) can be calculated and are listed in Table 3B.
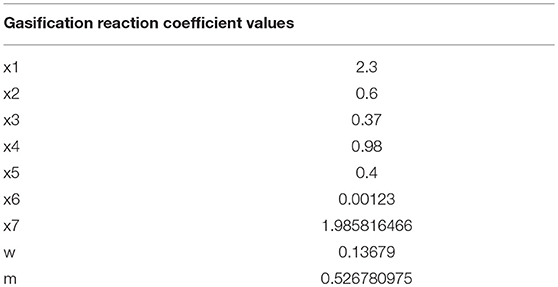
Table 3B. Model results: reaction coefficient values.
The equilibrium model described by Zainal et al. (Zainal et al., 2001) and utilized in works such as Koroneos et al. (Koroneos and Lykidou, 2011) was used to calculate the Mxgig gasification product gas compositions in the Ostrava pilot-scale reactor. A comparison between the model predicted values and those obtained experimentally is shown in Figure 7.
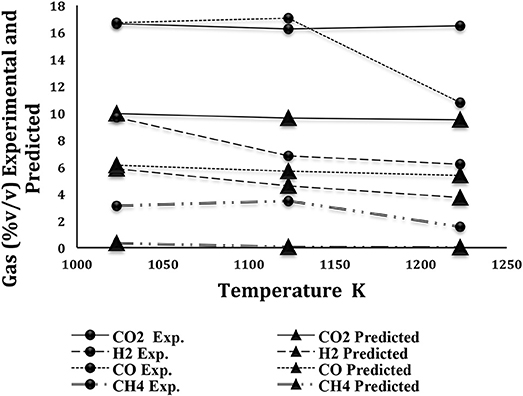
Figure 7. Experimental and Predicted Product Gas Compositions vs. Temperature.
Despite the many assumptions made to form the model, such as the omission of tar from the products, the results predicted by the model and those experimentally measured, agree closely with % deviation at each of the three temperatures, in the worst case when looking at CO, not exceeding 8.1% as shown in Table 4. This is significant in showing that simple equilibrium models can be used to successfully predict product gas compositions not just for bench-scale data but also. in pilot-scale scenarios.
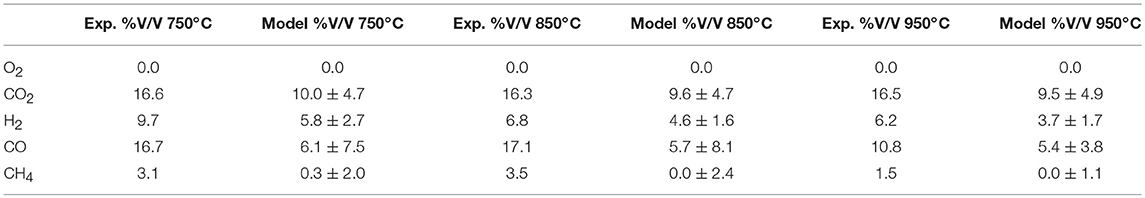
Table 4. Experimentally derived and model predicted product gases at the three selected temperatures.
Conclusions
Pilot-scale, fixed bed gasification studies were performed using a highly promising genotype of Miscanthus (Mxgig). Thermodynamic equilibrium modeling was employed to determine if simple, and accurate on the bench-scale, kinetic models could be used to predict conversion pilot-scale conditions comparable to actual industrial-scale applications. Three temperatures were considered (750, 850, 950°C) to determine the influence of temperature on gas quality and tar yields. Results revealed that:
• Pelletized Mxgig performed well in a pilot-scale fixed bed gasifier.
• Satisfactory process stability was achievable at 800°C or higher, with calorific values of product gases highest near 850°C and averaging 5.2 (MJ·m−3).
• Tar yields on the pilot-scale followed patterns observed in smaller units. A gradual increase proportional to rising temperatures (from 2,255 mg·m at 750°C for the wet gas to 4,419 mg·m at 850°C) followed by a decrease when temperatures rose above 900°C (1,993 mg·m at 950°C for the wet gas).
• Thermodynamic equilibrium modeling can indeed be successfully applied to pilot-scale biomass gasification data. Predicted gas composition values achieved strong agreement with experimental data and in the worst case (for CO) did not deviate more than 8.1 percentage points.
This study has shown the gasification behavior of Mxgig in a 100 kW reactor. The effects of three temperatures on gas composition and tar yields were studied for the combination of this fuel and reactor type. Predicted gas compositions, calculated using a simple thermodynamic equilibrium model, were compared to experimental values to determine the efficacy of such an approach.
Author Contributions
MM and AS contributed equally to this work. JN, MD conducted experimental work while AS, MM carried out data analysis and equilibrium modeling. All co-authors have helped in drafting the article and JG provided critical revision of the work.
Conflict of Interest Statement
The authors declare that the research was conducted in the absence of any commercial or financial relationships that could be construed as a potential conflict of interest.
Acknowledgments
This work was mainly supported by Energene Sp. z o.o., R&D department budget and within the framework of the project CZ.1.05/2.1.00/19.0389: Research Infrastructure Development of the CENET. The authors also gratefully acknowledge support from the BBSRC (BB/J004421/1).
Supplementary Material
The Supplementary Material for this article can be found online at: https://www.frontiersin.org/articles/10.3389/fenrg.2018.00091/full#supplementary-material
Abbreviations
Daf, dry ash free basis; Db, dry basis; I, integration constant; LHV, lower heating value; Mxgig, Miscanthus x giganteus; K, reaction rate constant; RVO, rotary evaporator; W, molar amount of water present per mole of fuel; X, equilibrium constant
References
Altafini, C. R., Wander, P. R., and Barreto, R. M. (2003). Prediction of the working parameters of a wood waste gasifier through an equilibrium model. Energy Convers. Manag. 44, 2763–2777. doi: 10.1016/S0196-8904(03)00025-6
Bhavanam, A., and Sastry, R. C. (2011). Biomass gasification processes in downd raft fixed bed reactors: a review. Int. J. Chem. Eng. Appl. 2, 425–433. doi: 10.7763/IJCEA.2011.V2.146
Demirbaş, A. (1997). Calculation of higher heating values of biomass fuels. Fuel 76, 431–434. doi: 10.1016/S0016-2361(97)85520-2
Erlich, C., and Fransson, T. H. (2011). Downdraft gasification of pellets made of wood, palm-oil residues respective bagasse: experimental study. Appl. Energy 88, 899–908. doi: 10.1016/j.apenergy.2010.08.028
Fagbemi, L., Khezami, L., Capart, R., Fagbemi, L., Khezami, L., and Capart, R. (2001). Pyrolysis products from different biomasses: application to the thermal cracking of tar. Appl. Energy 69, 293–306. doi: 10.1016/S0306-2619(01)00013-7
Friedl, A., Padouvas, E., Rotter, H., and Varmuza, K. (2005). Prediction of heating values of biomass fuel from elemental composition. Anal. Chim. Acta 544, 191–198. doi: 10.1016/j.aca.2005.01.041
Galindo, A. L., Lora, E. S., Andrade, R. V., Giraldo, S. Y., Jaén, R. L., and Cobas, V. M. (2014). Biomass gasification in a downdraft gasifier with a two-stage air supply: effect of operating conditions on gas quality. Biomass Bioenergy 61, 236–244. doi: 10.1016/j.biombioe.2013.12.017
Heidenreich, S., and Foscolo, P. U. (2015). New concepts in biomass gasification. Prog. Energy Combust. Sci. 46, 72–95. doi: 10.1016/j.pecs.2014.06.002
Hodgson, E. M., Lister, S. J., Bridgwater, A. V., Clifton-Brown, J., and Donnison, I. S. (2010). Genotypic and environmentally derived variation in the cell wall composition of Miscanthus in relation to its use as a biomass feedstock. Biomass Bioenergy 34, 652–660. doi: 10.1016/j.biombioe.2010.01.008
Hodgson, E. M., Nowakowski, D. J., Shield, I., Riche, A., Bridgwater, A. V., Clifton-Brown, J. C., et al. (2011). Variation in Miscanthus chemical composition and implications for conversion by pyrolysis and thermo-chemical bio-refining for fuels and chemicals. Bioresour. Technol. 102, 3411–8. doi: 10.1016/j.biortech.2010.10.017
Kallis, K. X., Pellegrini Susini, G. A., and Oakey, J. E. (2013). A comparison between Miscanthus and bioethanol waste pellets and their performance in a downdraft gasifier. Appl. Energy 101, 333–340. doi: 10.1016/J.APENERGY.2012.01.037
Khelfa, A., Sharypov, V., Finqueneisel, G., and Weber, J. V. (2009). Catalytic pyrolysis and gasification of Miscanthus Giganteus: haematite (Fe2O3) a versatile catalyst. J. Anal. Appl. Pyrolysis 84, 84–88. doi: 10.1016/j.jaap.2008.11.009
Kirkels, A. F., and Verbong, G. P. J. (2011). Biomass gasification: Still promising? A 30-year global overview. Renew. Sustain. Energy Rev. 15, 471–481. doi: 10.1016/j.rser.2010.09.046
Koroneos, C. J., and Lykidou, S. (2011). Equilibrium modeling for a dwndraft biomass gasifier for cotton stalks biomass in comparison with experimental data. J. Chem. Eng. Mater. Sci. 2, 61–68. Available online at: http://www.academicjournals.org/journal/JCEMS/article-full-text-pdf/36C73921613
Kuo, P.-C., Wu, W., and Chen, W.-H. (2014). Gasification performances of raw and torrefied biomass in a downdraft fixed bed gasifier using thermodynamic analysis. Fuel 117, 1231–1241. doi: 10.1016/j.fuel.2013.07.125
Li, C., and Suzuki, K. (2009). Tar property, analysis, reforming mechanism and model for biomass gasification—An overview. Renew. Sustain. Energy Rev. 13, 594–604. doi: 10.1016/j.rser.2008.01.009
Pandey, S., Baral, B., Karki, S., and Upreti, A. (2013). Prediction of syngas composition from biomass gasification using thermodynamics equilibrium model. Rentech Symp. Compend. 3, 5–8.
Pereira, E. G., da Silva, J. N., de Oliveira, J. L., and Machado, C. S. (2012). Sustainable energy: a review of gasification technologies. Renew. Sustain. Energy Rev. 16, 4753–4762. doi: 10.1016/j.rser.2012.04.023
Perry, R. H., and Green, D. W. (1984). Perry's Chemical Engineers Hand Book. 6th Edn. New York, NY: McGaw-Hill Book Company.
Ramanan, M. V., Lakshmanan, E., and Renganarayanan, S. (2008). Modeling and experimental validation of cashew nut shell char gasification adopting chemical equilibrium approach. Energy Fuels 22, 2070–2078. doi: 10.1590/S0104-66322008000300016
Schuster, G., Löffler, G., Weigl, K., and Hofbauer, H. (2001). Biomass steam gasification–an extensive parametric modeling study. Bioresour. Technol. 77, 71–79. doi: 10.1016/S0960-8524(00)00115-2
Simone, M., Barontini, F., Nicolella, C., and Tognotti, L. (2012). Gasification of pelletized biomass in a pilot scale downdraft gasifier. Bioresour. Technol. 116, 403–12. doi: 10.1016/j.biortech.2012.03.119
Smolinski, A., Stanczyk, K., and Howaniec, N. (2010). Steam gasification of selected energy crops in a fixed bed reactor. Renew. Energy 35, 397–404. doi: 10.1016/j.renene.2009.06.005
Susastriawan, A. A. P., and Saptoadi, H. (2017). Small-scale downdraft gasifiers for biomass gasification: a review. Renew. Sustain. Energy Rev. 76, 989–1003. doi: 10.1016/j.rser.2017.03.112
Teixeira, G., Van de Steene, L., Salvador, S., Gelix, F., Dirion, J.-L., and Paviet, F. (2014). Gasification of continuous wood char bed: modelling and experimental approach. Chem. Eng. Trans. 37, 247–252. doi: 10.3303/CET1437042
van Dam, J., Faaij, A. P. C., Lewandowski, I., and Fischer, G. (2007). Biomass production potentials in Central and Eastern Europe under different scenarios. Biomass Bioenergy 31, 345–366. doi: 10.1016/j.biombioe.2006.10.001
Xue, G., Kwapinska, M., Horvat, A., Li, Z., Dooley, S., Kwapinski, W., et al. (2014). Gasification of Miscanthus x giganteus in an Air-blown bubbling fluidized bed: a preliminary study of performance and agglomeration. Energy Fuels 28, 1121–1131. doi: 10.1021/ef4022152
Keywords: biomass, Miscanthus, gasification, equilibrium kinetics, pilot-scale
Citation: Samson A, Mos M, Najser J, Daroch M and Gallagher J (2018) Gasification of Miscanthus x giganteus Pellets in a Fixed Bed Pilot-Scale Unit. Front. Energy Res. 6:91. doi: 10.3389/fenrg.2018.00091
Received: 12 June 2018; Accepted: 22 August 2018;
Published: 11 September 2018.
Edited by:
Jalel Labidi, Universidad del País Vasco, SpainReviewed by:
Despina Vamvuka, Technical University of Crete, GreeceFehmi Akgun, Scientific and Technological Research Council of Turkey, Turkey
Arthur M. James R., Technological University of Panama, Panama
Copyright © 2018 Samson, Mos, Najser, Daroch and Gallagher. This is an open-access article distributed under the terms of the Creative Commons Attribution License (CC BY). The use, distribution or reproduction in other forums is permitted, provided the original author(s) and the copyright owner(s) are credited and that the original publication in this journal is cited, in accordance with accepted academic practice. No use, distribution or reproduction is permitted which does not comply with these terms.
*Correspondence: Abby Samson, YXNhbXNvbkBsaW5jb2xuLmFjLnVr