 David J. Wright
 Sana Badruddin
 Cameron Robertson-Gillis1
- 1Sunlab and Telfer School of Management, University of Ottawa, Ottawa, ON, Canada
- 2Institute of the Environment, University of Ottawa, Ottawa, ON, Canada
Micro-tracked CPV, in which cells move relative to fixed concentrating optics, allows CPV to be deployed in the same manner as fixed PV modules. Behind-the-meter applications in locations where there is a land/roof area cost for the space occupied by the modules confers a cost advantage to CPV compared to PV. The primary objective of the present paper is to estimate target prices below which CPV has a competitive advantage over PV. We analyse PV and CPV microgrids, optimizing the scheduling of power into and out of the battery in order to achieve the maximum savings compared to purchasing grid power. We then choose the battery capacity that maximizes the internal rate of return (IRR) on the PV microgrid. The CPV target price is the price that gives a CPV IRR that matches the PV IRR. The target CPV prices obtained are found to depend on the land price and on the ratio of CPV to PV annual energy yield (REY), but are insensitive to battery prices, load profiles, current electricity tariffs and future trends in electricity tariffs. Modesto, CA has a REY of 1.10 and an average target CPV price from $1.86/W at zero land price to $3.53/W at $400/m2. Lancaster, CA with a REY of 1.26 has corresponding target CPV prices from $2.14 to $4.23/W. In Las Vegas, NV, (REY = 1.27) the target CPV price is $2.13/W at a land price of zero, but at higher land prices the IRR is insufficient for solar power to be deployed. These target CPV prices correspond with current estimates of pedestal-tracked CPV of $2.4 to $3.3/W and indicate that it is realistic to expect micro-tracked CPV to be cost competitive with PV in some urban areas in southwestern USA.
Introduction: Trends in CPV and Microgrid Economics
Industry Trends
Although Concentrator Photovoltaics (CPV) has been profitable in utility-scale deployments in high Direct Normal Irradiance (DNI) regions, its cost in US$/W has not declined as fast as expected in Haysom et al. (2015) and deployment volumes have been very low since 2015, (Ekins-Daukes and Johnson, 2017; Gil et al., 2017). Photovoltaic (PV) costs are declining at 11% per annum (Cole et al., 2017) resulting in PV being more profitable than CPV in utility-scale applications, which constitute the vast majority (86%) of CPV deployment to date (Grand View Research, 2017).
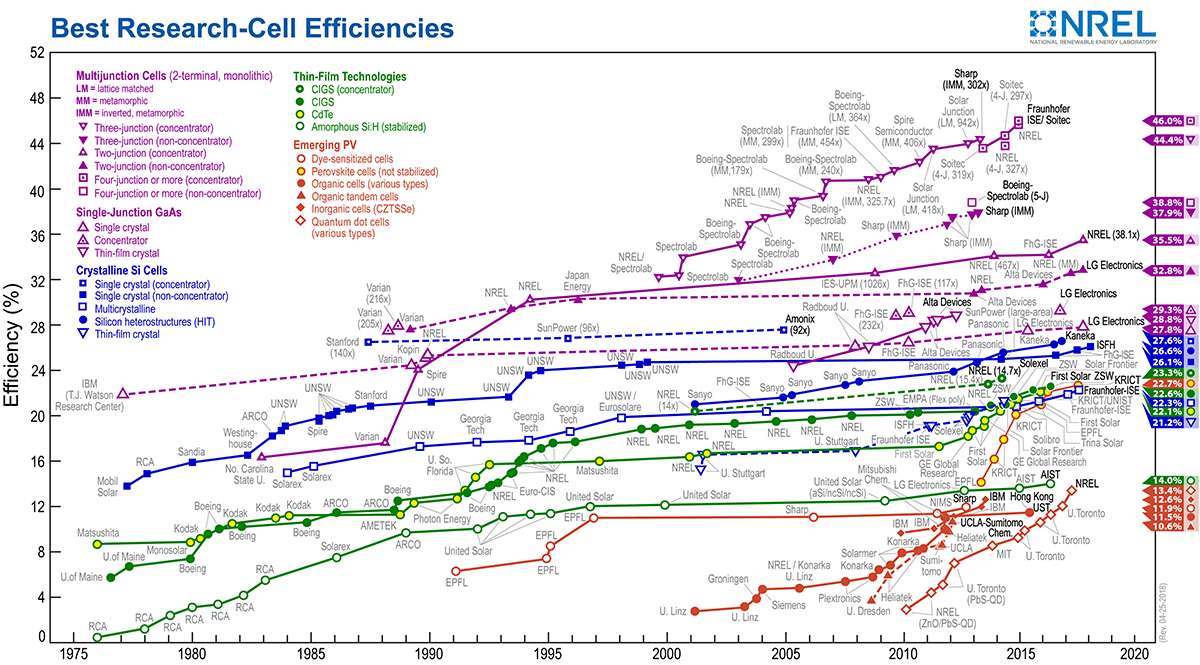
A major advantage of CPV over PV is its higher efficiency (NREL, 2018) in converting light energy into electrical energy, implying less land area being required for CPV than for PV. However, many large-scale high DNI deployments are in desert regions (North Africa, Northern Chile, Australia, and SW USA) where the price of land is low so that the greater efficiency of CPV does not translate into an economic advantage. In this paper, we therefore focus on urban deployment where the value of land or roof area is significant, in order to investigate situations in which CPV has a higher internal rate of return (IRR) than PV. This leads us to focus our research on behind-the-meter (BTM) applications on customer premises instead of utility-scale deployments. Adding the cost of land to solar projects reduces their IRR and we therefore conduct our analysis in cities in the high DNI region of the southwestern USA where we can expect an elevated IRR.
The phasing out of feed-in-tariffs (FITs) has lead to opportunities for CPV deployment under net-metering (NM) programs, in which customers receive a credit on their electricity bill for electricity fed into the grid up to a certain limit. Most FITs are flat rate, guaranteeing a constant price for electricity generated in $/kWh, whereas NM applies to a range of tariffs including peak dependent tariffs for medium to large-sized businesses. Charges for peak usage ($/kW) each month under these tariffs can constitute a significant percentage of a customer's electricity bill with most of the remainder being charges for electricity ($/kWh). When these peaks are due to air conditioning, we can expect them to be reduced significantly by solar power which is generating well at the same time. We therefore focus on customers subject to such peak charges, and in the cities studied, such tariffs apply to customers with peak power consumption > 200 kW.
In order to compare the economic viability of CPV and PV, we require comparable customer premises installations. Pedestal-mounted CPV tracking systems are unsuited to roof-tops due to wind loads and the cost of reinforcing the roof structure to support the pedestal. They also do not compete well with fixed PV in ground-mount scenarios because of the additional space required between CPV modules to avoid shading (Apostoleris et al., 2018). In the present paper we therefore analyse CPV with microtrackers integrated into the modules, moving the cell in relation to fixed optics (Price et al., 2017) and resulting in a shape and size for CPV modules similar to that of PV modules. In particular, both types of module can be fixed and can be mounted on roofs or on the ground with identical shading implications.
Early designs of fixed CPV modules, e.g., Zettasun and Suncycle, involved complex moving parts and resulted in a CPV module significantly thicker than a PV module. Comparable thickness is advantageous since it allows CPV modules to be installed at similar cost to PV modules using similar racking. CPV can then share the benefits resulting from the efficiencies that have been achieved in PV installation costs over the years. There is however a trade-off between thickness, optical concentration ratio, and the range of incidence angles that can be accepted. Recent designs move the cell in a plane between refractive and reflective optics so that it maintains the focus of the direct sunlight as the sun moves across the sky. The work of Price et al. (2015) achieved a 200x concentration ratio for ±60° incidence angles in a module 1 cm thick. Their more recent design (Price et al., 2017) achieves 660x concentration for ±70° incidence angles in a module < 2 cm thick. In a test, it generated 54% more electricity per unit area than a 17% efficient PV module. Future designs may aim for higher concentration at a lower range of incidence angles which may be economic since irradiance is lower at high incidence angles.
Microtracker integrated CPV is reviewed by Apostoleris et al. (2016), but commercial product costs ($/W) are not yet available. This paper establishes target costs which would enable micro-tracked CPV to be more profitable than PV in specific situations.
The simplest way to implement solar behind the meter is to use electricity generated to offset loads and to send any surplus to the grid under NM, which is one situation that we analyse. The current 7% per annum decline in battery prices (Rubel et al., 2017; Sekine and Goldie-Scot, 2017;), is resulting in their increased use in conjunction with solar. The introduction of a battery and optimal microgrid controller allows additional savings at an additional cost and we therefore investigate optimal control schedules and battery capacities to maximize IRR for PV and CPV. Microgrid economics has an established literature which we now review in order to identify the contribution of the present paper.
Microgrid Economics Literature Review
Above we have given the major relevant references relating to CPV costs and micro-tracking; we now focus on the literature on microgrid economics.
Microgrid optimization occurs at three levels (i) control of voltage, current and power, (ii) control of power quality, and (iii) control of scheduling and economics, and a comprehensive review is provided by Meng et al. (2016). Focusing here on optimal scheduling and economics, various approaches have been used including: minimizing annual net cost of operation (Azzopardi and Mutale, 2009), minimizing cost of electricity consumed in a commercial building (Marnay et al., 2008; Fina et al., 2017; Mariaud et al., 2017), optimal participation in an energy market (Celli et al., 2005), optimal integration of distributed wind generation into the grid (Zhou and Francois, 2011), optimal management of a rural microgrid (Zhang et al., 2012), optimal PV-battery system for demand charge or peak reduction (Hanna et al., 2014; Khalilpour and Vassallo, 2016; Park and Lappas, 2017; Parra et al., 2017; McLaren et al., 2018; Raoufat et al., 2018), and optimal PV-storage capacity in terms of grid impact and PV utilization rate (Brusco et al., 2016; Merei et al., 2016; Cervantes and Choobineh, 2018; Freitas et al., 2018; Raoufat et al., 2018). These papers focus on PV microgrids. There is a lack of literature on the economics of CPV microgrids because of the predominance of PV in recent solar projects. However, (Moumouni and Baker, 2015) analyse battery size to buffer the intermittency of grid connected CPV.
Although peak load in commercial buildings often coincides with solar generation making PV a viable option for peak reduction (Merei et al., 2016), energy storage could provide additional benefits to customers, particularly those with less variable demand (McLaren et al., 2018). Linear programming has often been used to determine optimal PV-storage system sizes (Hanna et al., 2014; Khalilpour and Vassallo, 2016; and Mariaud et al., 2017; Cervantes and Choobineh, 2018), however Zhang et al. (2017a) use three rule-based operation strategies which optimized the system using non-linear programming. Under current market prices, battery storage was found in some cases to be uneconomical and delivering minimal cost reduction (Merei et al., 2016; Mariaud et al., 2017; Zhang et al., 2017a; Raoufat et al., 2018). In such circumstances, it is possible for batteries to provide additional services such as ramp rate control and frequency regulation (Raoufat et al., 2018). Conversely, storage integration yielded financially beneficial results at lower technology cost limits as modeled in McLaren et al. (2018), nearly doubled net present value of cash flow in Khalilpour and Vassallo (2016), decreased maximum load by nearly 10% in Hanna et al. (2014), supplied energy at 34% less cost than network prices in Park and Lappas (2017), and produced electricity bill savings of up to 12% in Brusco et al. (2016). Financial viability of a battery storage with PV microgrid can be impacted by other variables such as electricity retail prices (Fina et al., 2017; Parra et al., 2017), forecasting of solar irradiance (Hanna et al., 2014; Mariaud et al., 2017), and presence of net-metering, which reduced financial benefits gained through storage in McLaren et al. (2018), and resulted in a larger optimal PV-battery system size in Cervantes and Choobineh (2018), as compared to no net-metering.
The measure we use as the objective function is the IRR. Other valid metrics include net present value (NPV) and lifetime cost of electricity (LCOE) which have been used by many authors (e.g., Reichelstein and Yorston, 2013; Makbul et al., 2015; Mudasser et al., 2015; Wouters et al., 2015; Boloukat and Foroud, 2016; Khalilpour and Vassallo, 2016; Mariaud et al., 2017; Parra et al., 2017; Zhang et al., 2017a). Such studies require assuming a value for the discount rate, and have assigned a range of values from 7.5 to 10%, reflecting a subjective assessment of the risk of the project. Both NPV and IRR are useful in assessing the economic viability of a single project, since they deal with economic return on investment when the price at which electricity can be sold is known. LCOE is useful when comparing among several alternative utility-scale projects and bidding on the price at which they can supply electricity, since it focuses on the cost at which electricity can be produced. In our case, we are assessing a behind-the-meter project subject to published electricity tariffs and therefore our choice is between IRR and NPV. When the assessment is done for a specific site for a specific organization, the discount rate of that organization can be used to calculate the NPV. In our case, we are considering more generic projects for which there is no available discount rate. The rationale for choosing IRR for the present paper is therefore that IRR does not involve assuming a discount rate.
Objectives and Contributions of the Current Paper
The primary objective of this paper is to estimate target prices for micro-tracked CPV at which it can compete with fixed PV in behind-the-meter applications. In order to achieve this objective we analyse the economics of PV and CPV microgrids. Since there is a lack of literature on the economics of CPV microgrids, we also provide a comparative analysis of PV and CPV microgrids as a secondary objective.
In summary, the present paper extends the literature by:
• Estimating target prices for micro-tracked CPV at which it is cost-competitive with PV;
• Comparing the operation and economics of PV and micro-tracked CPV microgrids in behind the meter applications with peak demand charges in addition to electricity charges.
Energy and Economic Modeling
The analysis uses three stages of modeling: (i) energy yield from PV and CPV (ii) optimal scheduling of electricity in microgrids and (iii) optimal IRR over 32 year life of the PV and CPV installation. We use these models to calculate the IRR from a PV microgrid with current installed PV costs, optimal battery size, and a given land price. We then calculate the IRR of a CPV microgrid at the same land price for a range of potential capital costs of CPV ($/W). The target CPV cost is the one that results in an IRR that matches the PV IRR. If micro-tracked CPV can be produced at or below that cost, it will achieve a higher IRR than PV and hence be cost competitive with PV.
Energy Yield Models
In this section we list the factors taken into consideration in calculating the PV and CPV energy yield from the irradiance and temperature data. We give references instead of detailed equations, since this paper focuses on the economically optimal operation of the microgrid in order to estimate target CPV costs. The solar energy yield st in hour t is estimated in each month based on the size of the solar installation S (kW DC).
CPV Energy Yield Model
The DC energy yield from CPV is modeled using 17 years of DNI and temperature measurements from Solar Anywhere satellite data (Clean Power Research, 2018) using an efficiency of 32% for a triple junction cell (NREL, 2018). This is then modified to take into account the effect of:
a) temperature, giving a modification in cell efficiency of −0.07%/°C relative to a normal operating temperature of 25°C (Muller et al., 2015)
b) spectrum, using the zenith angle of the sun as a proxy (Yandt et al., 2015),
c) low irradiance < 600 W/m2, resulting in a modification of efficiency of −0.0195%/(W/ m2) (Gerstmaier et al., 2011) and
d) module degradation over time which has proven to be too small to measure accurately (Gerstmaier et al., 2011) and which we conservatively estimate at 0.025%/year, i.e., half the PV degradation rate of 0.05%/year (Lowder et al., 2013).
PV Energy Yield Model
The DC energy yield from PV is modeled from DNI, Global Horizontal Irradiance (GHI) and temperature measurements from Solar Anywhere satellite data (Clean Power Research, 2018) based on the classic model of Masters (2004) using a cell efficiency of 15.6% (NREL, 2018) and an albedo = 0.2 for reflected light from the ground in front of the module. The model is modified to take account of the effect of:
a) temperature, giving a modification in cell efficiency of −0.4%/°C relative to a normal operating temperature of 25°C (Sahin et al., 2017)
b) reflections proportional to 0.05(secθ−1) at angle, θ, between the direct beam irradiance and the normal to the plane of the module (Sandia lab, 2018) and (PVsyst, 2018) and
c) modules degradation of 0.05%/year (Lowder et al., 2013).
Microgrid Economics Optimization Model
The solar microgrid is illustrated in Figure 1 and the associated notation is summarized in Table 1.
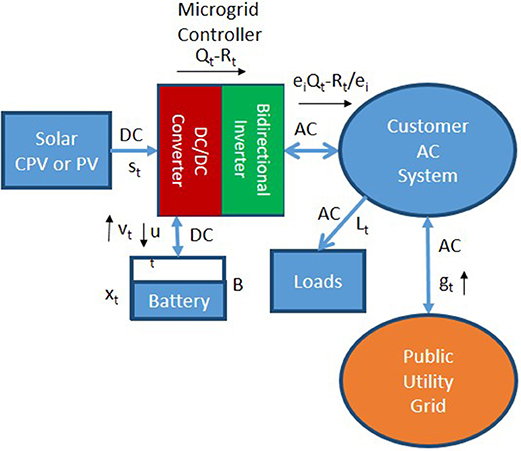
Figure 1. Commercial customer solar microgrid showing notation and direction of power flows.
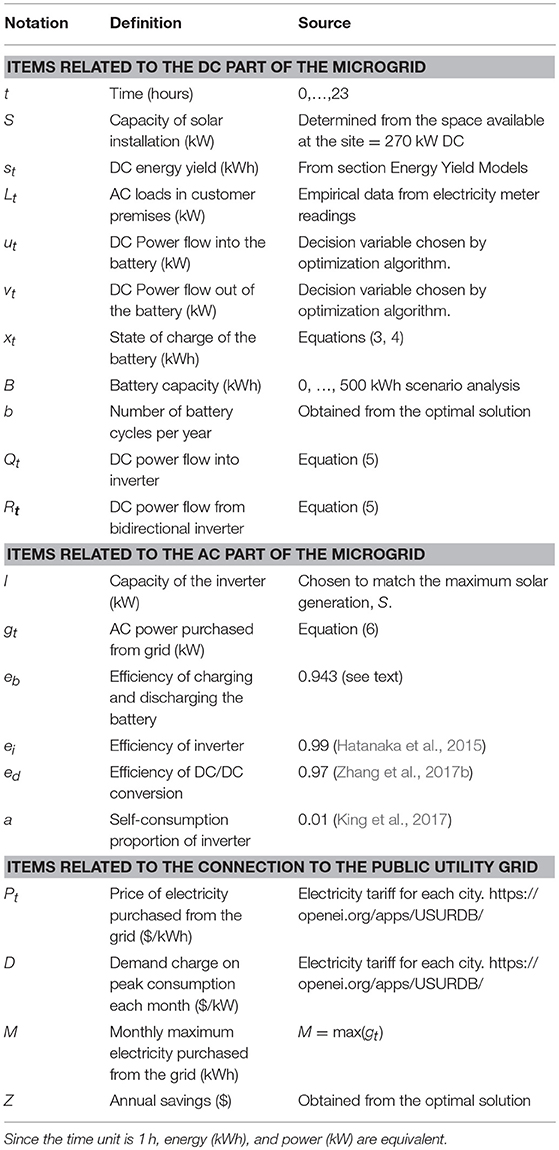
Table 1. Notation and data sources used in microgrid modeling.
Our model optimizes the operation of the microgrid each day of each month for workdays and weekends separately to take into account variations in the load and electricity tariff. The objective function is the total electricity bill from electricity and demand charges, and the decision variables are the peak consumption and the energy flow into and out of the battery:
We note that the demand charge is applied to the hour with the peak consumption from the grid during each month: M = max(gt). This non-linear relationship is replaced by the following equivalent linear formulation in which M becomes a decision variable:
A first group of constraints represents the dynamics of the microgrid operation as shown in Figure 1.
The flows into and out of the battery are treated as separate decision variables because the inefficiency of the battery results in asymmetric operation:
This inefficiency also ensures that the optimal solution can never have both ut and vt positive at the same time, t. In order to estimate eb, we combine academic research information and commercial product information. Energy efficiencies of anode, cathode and multiple cell management are 0.937, 0.965, and 0.9873 for an overall efficiency of 0.893 (Meister et al., 2016 and Zhang et al., 2016). The Tesla Powerwall 2 battery, (Tesla, 2018), and the Aquion M110 LS83 battery, (Aquion Energy, 2018), have round trip efficiencies of 85–92%, averaging at 88.5%. Averaging the academic research figure and the commercial figure, we obtain a round trip efficiency of 0.889, giving a one-way efficiency of
In order to ensure that the operation of the battery 1 day does not adversely affect its operation the next day, we impose the constraint:
The net flow of power from the DC part of the system into the inverter is given by:
and hence the power purchased from the grid is given by:
The inefficiency of the inverter also ensures that the optimal solution cannot have both Qt and Rt positive at the same time, t.
A second group of constraints are also imposed, modeling the capacity of the various components of the microgrid:
In order to ensure 5,000 cycles of battery lifetime operation, we operate the battery between 10 and 90% of capacity (Saft, 2018). This also ensures that there is reserve battery capacity available to smooth out short term (of the order of seconds and minutes) fluctuations in solar energy yield.
The power flow into and out of the battery is related to the battery capacity and the ratio between the two is determined by the battery design. We choose a ratio of 0.5 (kW/kWh) as being representative of a typical microgrid battery with capacity of about 100 kWh (Kokam, 2018).
The power flow into and out of the inverter is limited by the inverter capacity:
The resulting model is linear and is optimized using linear programming, thus guaranteeing a global optimum. The inputs to the model are the solar power produced, st, the AC loads in the customer premises, Lt, the price of purchasing electricity from the grid, Pt, and the demand charge, D. For a range of battery sizes, B, we minimize the customer electricity bill each month for workdays and weekends separately and calculate the annual savings, Z(B), from using the solar microgrid with battery capacity, B, compared to satisfying all the loads from grid purchased electricity. We also note the number of battery cycles, b, during the course of a year in this optimal solution, which is used in the next section to estimate costs associated with end of life battery cell replacement.
This calculation is repeated for energy yield from PV and CPV resulting in annual savings, ZPV(B) and ZCPV(B), respectively.
IRR Optimization
The notation and sources of information for IRR optimization are given in Table 2. The internal rate of return (IRR) is calculated from the cash flows over the 32 year life of the solar microgrid. The incoming cash flows correspond to the annual savings calculated in section Microgrid Economics Optimization Model increased according to the rate of increase of electricity prices and decreased according to degradation of the solar modules:
The outgoing cash flows consist of capital and operating costs. The capital costs are incurred in year 0 and include the cost of solar installation, the battery, and the land or roof area occupied by the solar installation:
In standard test conditions, 1 m2 corresponds to 1 kW of solar irradiance. Therefore, the land or roof area is:
We note that cS is known for PV. Section Methodolgy describes how a target value of cS is estimated for CPV, which is a major result of this analysis.
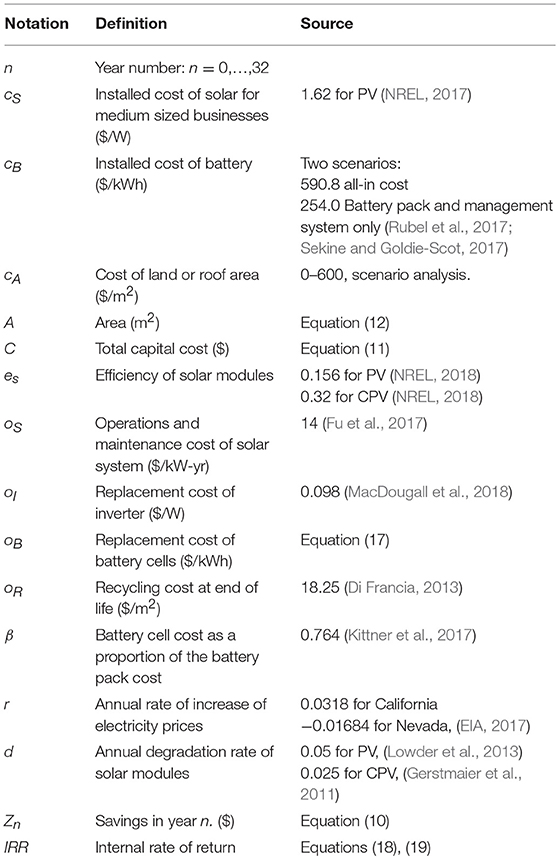
Table 2. Notation and sources of information for calculation of IRR.
The operations costs, On, in year n, are associated with annual maintenance of the system, inverter replacement, battery cell replacement and end of life recycling costs. A battery with a life of 5,000 cycles using b cycles per year lasts for ⌊5000/b⌋ years. In practice, we found this to come to between 11 and 20 years, so that battery cells need replacing either once or twice during the 32 year life of the system.
The operations and maintenance costs for micro-tracked CPV are taken to be the same as those for PV (Fu et al., 2017) since no independent figure is available and since the form factor of micro-tracked CPV is very similar to that of PV.
Rapid declines in battery prices imply that it is necessary to forecast the price of battery cells in the future years when they will need replacing. This was based on averaging projections of the prices of battery packs ($/kWh) from BCG and Bloomberg (Rubel et al., 2017; Sekine and Goldie-Scot, 2017), and scaling the result according to the battery cell price as a proportion of the battery pack cost (Kittner et al., 2017). A logarithmic regression (R2 = 0.996) results in an estimated battery cell cost ($/kWh) in year n (for n = 0 in 2018) of:
The IRR is the discount rate at which the net present value (NPV) of this sequence of cash flows is zero:
The notation used in this calculation emphasizes the dependence of certain variables on the battery size, B, since we need to choose the value of B that maximizes IRR(B). The IRR for PV is:
Methodolgy
Sequence of Calculations
The aim of the current paper is to assess the economic viability of CPV in behind-the-meter applications in commercial buildings using available anonymized consumption data for such a customer. We aim to calculate a target cost cS for CPV that results in an IRR for CPV that is equal to the IRR for PV. If micro-tracked CPV can be produced at a price less than this target value of cS then it will be more economically viable than PV as it would have a higher IRR. We first calculate the IRR for PV and then find a CPV cost cS that results in a matching IRR following the procedure in Figure 2.
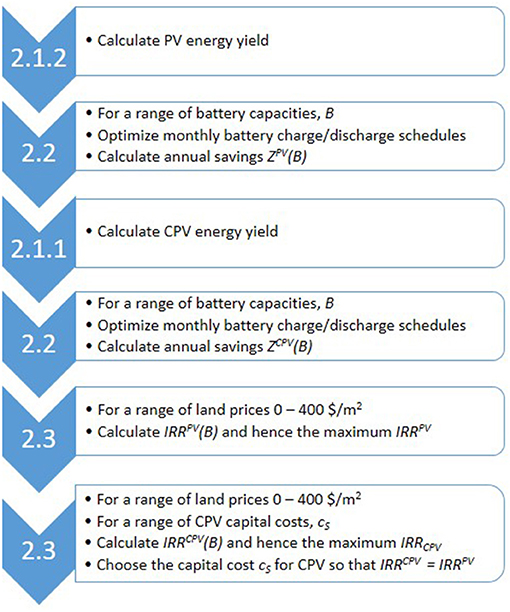
Figure 2. Sequence of calculations from different subsections of section Energy and Economic Modeling.
Scenarios and Corresponding Data Sources
The four main determinants of solar microgrid economics in behind the meter applications are the battery prices, the solar energy yield, the electricity tariff and the customer's load profile. These factors have many parameters that vary with hour, day, and month. Our aim is to obtain results based on empirical and realistic data that can be clearly interpreted as opposed to providing a comprehensive review of all possible parameter values. We therefore deal with the first two factors, energy yield and electricity tariff, by selecting three cities (Las Vegas, NV; Lancaster, CA; and Modesto, CA) in the high irradiance region of southwestern USA, two of which (Las Vegas and Lancaster) have similar energy yield and two of which (Lancaster and Modesto) have similar tariffs (Table 3 and Figure 3). For the customer load profile, we have available anonymized data from a medium sized business customer. However, load profiles are very specific to individual customers and therefore we also investigate two stylized load profiles representing a commercial site used primarily on workdays from (i) 8 a.m. to 6 p.m. and (ii) 9 a.m. to 5 p.m., Figure 4. The stylized load profiles have the same annual total consumption as the empirical data from the customer. The PV capacity determined by the customer site layout is 270 kW DC. For our comparative analysis of PV and CPV microgrids, we therefore also use a 270 kW DC CPV system. CPV uses less land/roof area than PV for the same amount of power and an alternative comparison would be with a 550 kW CPV system occupying the same area as the 270 kW PV system. However, this would imply a CPV system generating a greater proportion of the customer load, introducing multiple differences in the battery scheduling. An apples for apples comparison is to have both PV and CPV systems at 270 kW.
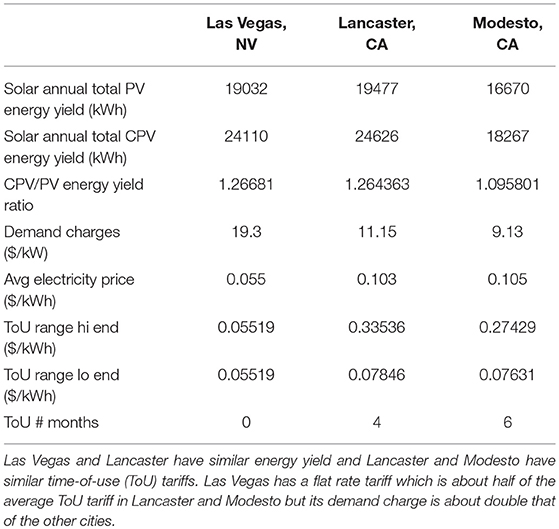
Table 3. Energy yield for 270 kW DC solar installations and medium sized business tariffs.
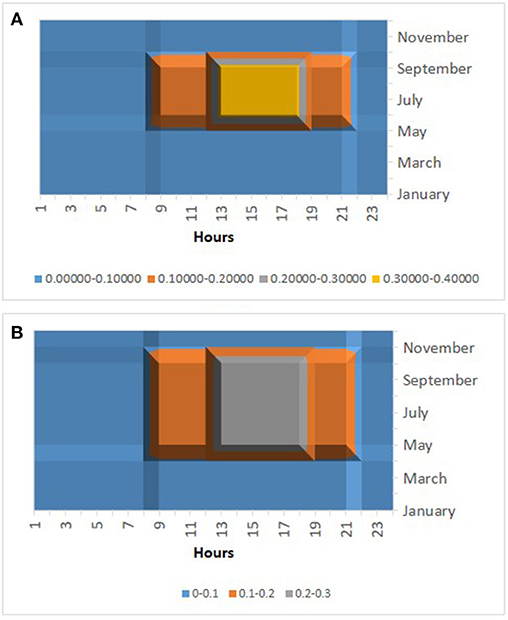
Figure 3. Time of use tariffs ($/kWh) in (A) Lancaster, CA, and (B) Modesto, CA, over 24 h and 12 months.
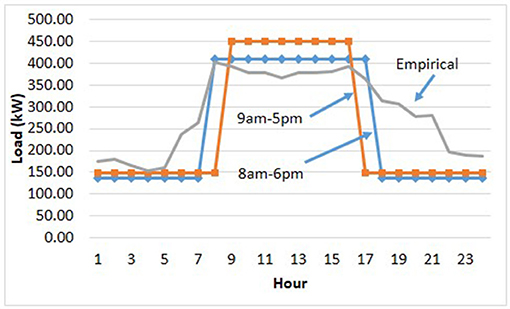
Figure 4. Example AC load profiles over 24 h for 3 scenarios for workdays in June. The total annual load is scaled to be the same for each profile.
PV and CPV Economic Analysis Results and Discussion
In this section we achieve our original objective of estimating target prices for micro-tracked CPV at which it can be at least as profitable as fixed PV. This involves the economic optimization of CPV and PV microgrids. Section Introduction: Trends in CPV and Microgrid Economics demonstrated an absence of research literature on economic optimization of CPV microgrids with demand charges and we therefore present results comparing CPV and PV microgrids with demand charges in addition to presenting the final result on target CPV prices.
In section Analysis for Zero Land/Roof Price, we analyse the cost of CPV at which it can compete with PV for the situation in which the land/roof on which the solar is installed is free of charge. We then move on to address the effect of various land/roof prices in section Impact of Land Prices.
Analysis for Zero Land/Roof Price
Optimum Battery Scheduling: PV/CPV Comparison
An example of optimum battery scheduling in Lancaster in June is shown in Figures 5A,B following the procedure in section Microgrid Economics Optimization Model. The effect of demand charges can be seen in the flat profile of grid purchases in the late morning, and the effect of time of use charges can be seen in further reductions in grid demand in the afternoon. The use of linear programming ensures that the savings achieved is a global optimum, however the optimum battery schedule is not unique. For instance, the battery can be charged from the grid at any time when the time of use (ToU) charges are at a minimum so long as that charging does not increase the peak demand or exceed battery capacity.
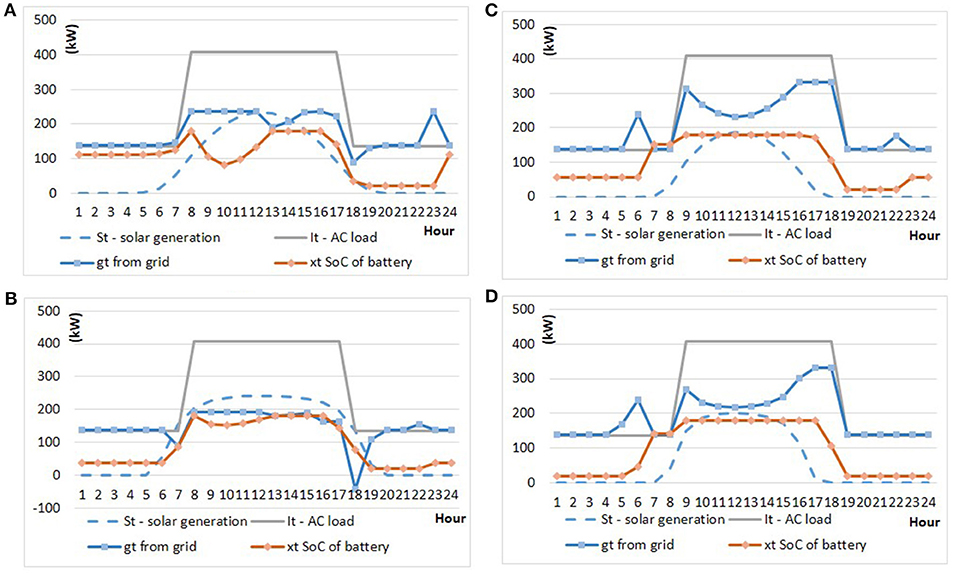
Figure 5. Example optimum battery schedules (kWh) over a 24 h workday for Lancaster, CA, with an 8 a.m.−6 p.m. load profile and a battery size of 200 kWh, for (A) PV and (B) CPV during June and (C) PV and (D) CPV during December.
We note how the broader generation profile of CPV compared to PV has enabled the peak consumption from the grid to be lower in the case of CPV. It is this combination of CPV plus a battery that enables CPV to compete effectively with PV.
In both PV and CPV microgrids, the battery is fully charged in time for the start of the daytime load. However for PV, even in June, the battery needs to be depleted to about 50% of capacity while the solar energy yield is increasing during the later morning. At midday, some of the solar energy yield is used to recharge the battery, which is ready for use as the sun starts to set in the late afternoon. This pattern is much less pronounced in the case of CPV due to its broader generation profile. This results in more battery cycles for PV than for CPV, necessitating battery cell replacement earlier, thus adding to costs in the PV system.
In both PV and CPV, the grid purchases are reduced below the maximum grid consumption in the afternoon when ToU charges are high. This is distributed over more hours in the case of CPV; however, such a distribution over hours with the same ToU charge is another example of the non-uniqueness of the optimal schedule.
Figures 5C,D illustrate the situation in December which is different than that of June in that the broader generation profile of CPV does not achieve a significantly lower demand charge than PV. The peak consumption from the grid is 332 kW for PV and 331 kW for CPV. Instead, CPV energy yield is used to reduce electricity charges during the day. One reason for this difference between summer and winter is that the solar generation profile for both PV and CPV is narrower than in the summer, but a second important contributing factor is the clock change for daylight saving time. In the winter the gap between solar generation and the workday is primarily in the afternoon whereas in the summer it is more equally split between morning and afternoon. The capacity of the battery to bridge this afternoon gap is the determining factor in the resulting peak demand charge. In Figure 5, a 200 kWh battery is used. Doubling that capacity to 400 kWh reduces the peak consumption from the grid in December to 284 kWh for PV and 272 kWh for CPV, conferring an advantage to CPV. Whether such savings covers the cost of large batteries is discussed in section Optimal IRR and Target CPV Costs.
The points described in this section apply, in general, to all 3 load profiles in all 3 cities.
Demand Charge Dollar Savings: PV/CPV Comparison
The first four steps of the methodology in Figure 2 allow us to investigate the dollar savings from PV and CPV before accounting for the costs. In section Introduction: Trends in CPV and Microgrid Economics, we emphasized the importance of peak demand charges to medium sized business customers and how batteries can contribute to reducing peaks in consumption from the grid when the load profile extends to times at which solar power is not generating well. Examples of such energy flows are given in Figure 5. We now quantify the dollar impact of this effect by giving the percentage of savings that is due to reduced demand charges (as opposed to reduced electricity charges) from optimum scheduling of different sizes of battery. The results are shown in Figure 6. The much higher demand charges in Las Vegas (given in Table 3) result in a much higher percentage of savings being due to demand charges compared to the other two cities. The demand charges in Lancaster are only slightly higher than in Modesto, giving closer results between those two cities.
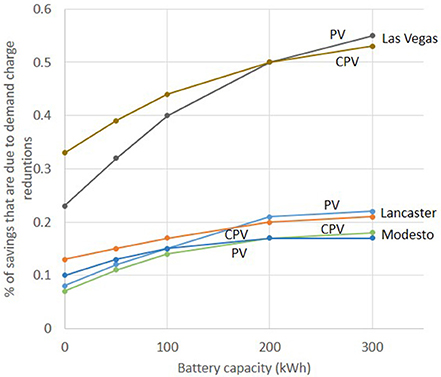
Figure 6. Percentage of the dollar savings that is due to reduced demand charges as a function of battery size for Lancaster, CA, with the 8 a.m.−6 p.m. demand profile.
Figure 6 also clearly shows that the larger the battery, the greater the corresponding percentage that demand charges contribute to total savings. However, there is a difference between PV and CPV. The battery size needs to be very large before the percentage contribution of demand charges is higher for PV than for CPV. The greater gap between the load profile and the generation profile for PV means that a larger battery is required to bridge it. With smaller batteries, saving demand charges contributes a greater percentage of total savings for CPV than for PV. The dollar cost of the larger batteries required by PV is discussed in section Optimal IRR and Target CPV Costs.
This discussion of the proportional contribution of demand charges to total savings must be complemented by considering the absolute dollar value of those total savings. This is higher for CPV than for PV, corresponding to the higher energy yield of CPV shown in Table 3.
These points are generally true for all three load profiles shown in Figure 4.
Optimal IRR and Target CPV Costs
The additional savings derived from increased battery size are associated with the corresponding battery costs, which we now deal with by calculating the IRR following the procedure in section IRR Optimization. We first work with the all-in battery price of $590/kWh from Table 2 that includes battery pack, balance of system hardware, soft costs and engineering procurement and construction. We also include inverter replacement costs, battery cell replacement costs, operations and maintenance costs, end-of-life recycling costs, etc. as given in Table 2. An example of the cash flows is given in Figure 7.
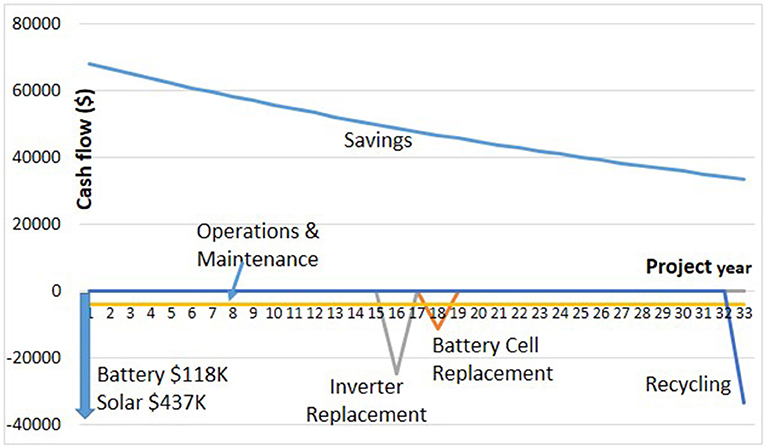
Figure 7. Example 32 year cash flows for PV IRR calculation: Las Vegas, 9 a.m.−5 p.m. load profile, 200 kWh battery.
In the case of PV, we include the installed PV capital costs which leads to an IRR for each battery size. PV developers would naturally choose the battery size that maximizes this IRR. The target CPV cost is chosen so that, for each possible battery size in the CPV microgrid, CPV attains at least this maximum IRR achievable from PV. We then note the battery size in the CPV microgrid that allows the highest CPV target price.
Figure 8 presents the results for Las Vegas, displaying the PV IRR and the CPV target price on the left and right vertical axes respectively. Figure 8B shows the maximum PV IRR of 9.9% for the 9 a.m.−5 p.m. load is achieved with a 200 kWh battery. The optimization is performed with a granularity in battery prices corresponding to the availability of commercial products. This is also the scenario shown in Figure 7. The target CPV cost to achieve the same IRR depends on the size of battery used in the CPV microgrid and is less than 2.08 $/W for all battery sizes. The maximum CPV cost of 2.08 $/W at which CPV can compete with PV is in a CPV microgrid including a 100 kWh battery. The optimal battery size in a CPV microgrid is lower than the optimal battery size in a PV microgrid because the CPV solar generation profile is better able to supply the 9 a.m.−5 p.m. load profile.
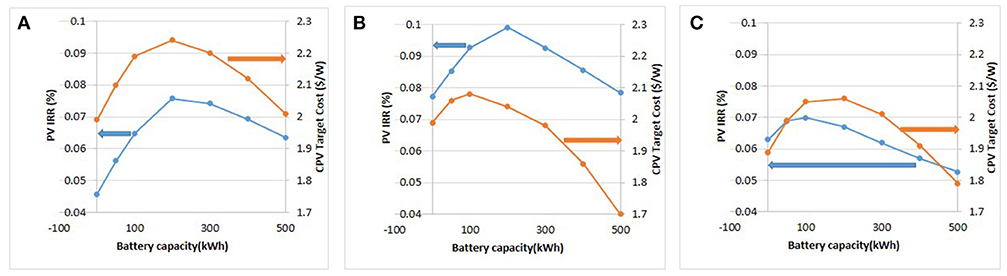
Figure 8. PV IRR (blue graph, left axis) and CPV target cost to match the maximum PV IRR (orange graph, right axis) for Las Vegas (A) 8 a.m.−6 p.m. load (B) 9 a.m.−5 p.m. load (C) empirical load.
The broader load profile from 8 a.m. to 6.p.m., Figure 8A, is less well matched to the solar generation profile of PV or CPV, resulting in a lower PV maximum IRR of 7.6% using a 200 kWh battery. For this load profile, CPV can match the PV IRR at a CPV cost of 2.24 $/W using a 200 kWh battery.
The empirical load profile, analyzed in Figure 8C, is broader still (Figure 4) and results in a lower maximum PV IRR of 7.0% using a 100 kWh battery. The optimal way for a CPV microgrid to compete is with a 200 kWh battery and a price of up to 2.06 $/W. The total energy yield of CPV is higher than that of PV and hence it can benefit from use of a larger battery.
The broader the load profile, the lower the optimal PV IRR. In order to compete, a CPV microgrid developer can choose a battery size that allows high CPV target prices. If micro-tracked CPV modules are available below this target price, a higher IRR is obtainable from a CPV microgrid using a range of battery sizes.
The corresponding results for Lancaster and Modesto are summarized in the top half of Table 4. The optimal PV IRR is 20–25%, much higher than the 7–10% in Las Vegas, due to the electricity charges being about double those in Las Vegas and due to the ToU peak period being during the hours when solar is generating well. The savings due to demand charges are proportionately higher in Las Vegas, as seen in Figure 6, because of the high demand charges in that city, but in absolute terms they are insufficient to achieve IRRs as high as those in Lancaster and Modesto.
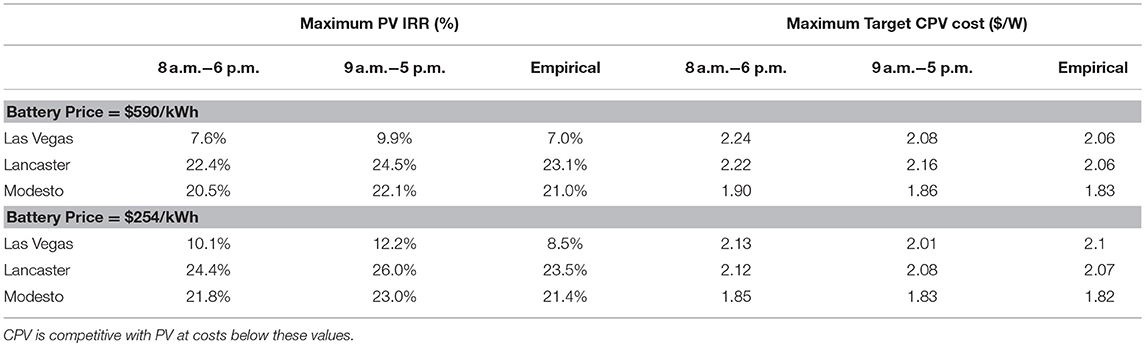
Table 4. Optimal PV IRR under 3 load profiles in 3 cities and the target CPV cost required to match that IRR.
Solar microgrids in Lancaster and Modesto have an optimal battery capacity of zero. The maximum PV IRR is achieved for all load profiles without a battery and the highest target CPV cost also does not involve a battery. The dollar value of savings from the use of solar microgrids increases as battery size increases but not sufficiently to offset the cost of the battery. Battery costs are forecast to decline at 6.5% per year until 2025 (Rubel et al., 2017; Sekine and Goldie-Scot, 2017). A battery could therefore be added to a PV or CPV system at a later date, when it becomes economically viable, albeit with costs associated with the retrofit.
The above results are obtained with a 2018 battery price of $590.8/kWh from Table 2, which includes not only the battery pack and management system, but also project development, engineering procurement and construction, grid connection and balance of system hardware. If some of these costs can be shared with similar costs included in the installation costs of solar, the additional cost of the battery may be reduced.
The battery pack plus management system cost only $254/kWh (Rubel et al., 2017; Sekine and Goldie-Scot, 2017). At this price it is economically optimal to use batteries in all 3 cities and the corresponding results are recorded in the lower half of Table 4. Lower battery prices increase the PV IRR, setting a tougher bar with which CPV needs to compete. Lower battery prices also benefit CPV, but the net effect is a reduction in the target price of CPV at which it can compete with PV. A battery price of $254/kWh compared to $590/kWh is a very substantial reduction, however the impact on CPV target prices is less than 5%. This is in part due to the fact that the battery constitutes a small part of the total system cost and also because a reduction in battery prices benefits both PV and CPV. The impact on target CPV costs reflects the difference in the extent to which battery prices affect the economics of PV compared to CPV. The fact that the overall effect is small implies that the CPV target prices in Table 4 are robust to changes in battery prices.
The target CPV costs given in Table 4 are influenced by 5 factors:
1. Battery prices. As just discussed, CPV target costs are insensitive to battery prices.
2. The customer load profile. The broader the load profile, the lower the optimum PV IRR, but there is little impact on CPV target prices.
3. The electricity tariffs in the 3 cities. There are major differences among these tariffs, given in Table 3 and Figure 3, with Lancaster and Modesto being very different from Las Vegas. However, those differences apply to both PV and CPV and Table 4 shows that they have little impact on the CPV target price that competes with PV.
4. The trends in electricity prices in the future. There is a major difference between California and Nevada given in Table 2. However, again this impacts both PV and CPV, and Table 4 shows that it has little impact on the point of competition between them.
5. The solar irradiance in each city. Table 3 shows that the ratio of CPV/PV annual energy yield is lower in Modesto than in Lancaster and Las Vegas, resulting in lower target CPV costs in Modesto in Table 4.
Battery prices, load profile, and present and future electricity tariffs have a major impact on both PV and CPV IRR, and uncertainty about future trends introduces risk into solar projects. However, they have little impact on target CPV costs implying that the CPV target costs in Table 4 are insensitive to these factors.
Comparison With Other Approaches to Estimating CPV Costs
A simplistic approach to estimating costs at which CPV would compete with PV is to ignore ToU charges, demand charges, and load profiles. Capital costs of solar installations are high compared to the discounted stream of annual operating costs so that a simplistic approach can also justify ignoring operating costs. The ratio between CPV and PV costs for the same level of profitability should now reflect the ratio in the energy yield. Using our PV installed cost from Table 2 and the energy yield ratios from Table 3 leads to the target CPV prices of 2.05, 2.05, and 1.78 $/W for Las Vegas, Lancaster, and Modesto respectively, lower than those from our more comprehensive analysis in Table 4. This shows that the additional detail in our analysis is important to include since it results in different and more accurate estimates.
Systems costs for pedestal-tracked CPV have been declining and a learning analysis (Haysom et al., 2015) indicated a rapid learning rate of 18% cost reduction for every doubling of deployment volume. However, recent CPV deployment volume has been lower than originally expected resulting in current cumulative deployment estimates of 330 MW (Ekins-Daukes and Johnson, 2017) and 360 MW (Gil et al., 2017), and a corresponding average installed systems cost of 2.4 $/W using the learning analysis. An industry survey indicated median costs of 3.3 $/W (Ekins-Daukes and Johnson, 2017).
There is evidently a major difference between pedestal tracking and micro-tracking both from a technology and a cost perspective and these figures of 2.4 and 3.3 $/W are not directly comparable with those in Table 4. However, we present them here since other estimates of micro-tracked CPV are not available at the time of writing. That the figures in Table 4 are lower motivates us to achieve higher target CPV costs by including the impact of land/roof prices, which we do in section Impact of Land Prices.
Practical Considerations
The geographical and architectural layout of customer sites differ considerably. The analysis in this paper is intentionally kept broad in order to estimate micro-tracked CPV prices for the industry as a whole. It would need to be made specific to an individual site for implementation of an actual project.
One site-specific consideration is whether the area available for solar is limited in some way. For instance the roof area of a commercial building can only supply enough PV solar for the electricity consumption of 2–3 floors of office space. CPV would have an advantage if the building manager of a taller building wished to supply a significant proportion of the electricity load from solar.
A second factor is the orientation of the PV solar modules. Much solar analysis assumes south facing modules tilted just below the latitude to maximize energy yield. Roof top installations may require less tilt to reduce wind load, and the architectural and site layout may require azimuths to the east or west of south. Tomosk et al. (2017) analyzed ToU tariffs in 25 cities in southwestern USA and calculated the orientation of PV modules that maximizes IRR. They found that the average absolute increase in IRR was only 0.29%. Haysom et al. (2016) found that with a ToU tariff in Las Vegas, 95% of the revenue could be obtained within a 68° range of azimuth. Our own analysis finds that the absolute change in IRR compared to azimuth = 0, tilt = latitude is 0.11, −0.28, and −0.55% for azimuth = –20°, tilt = latitude; azimuth = –40°, tilt = latitude; azimuth = 0°, tilt = 0°, respectively. These minor differences for a wide range of orientations, together with the fact that this paper does not deal with the specifics of architectural and site layout justifies using south facing modules tilted just below the latitude in our analysis.
Impact of Land Prices
In section Analysis for Zero Land/Roof Price we analyzed target CPV prices with respect to 3 dimensions: load profile, city and battery price. Adding land prices in this section introduces a 4th dimension. Table 4 indicates that battery price has very little influence on the results and we therefore condense our analysis in this section back to 3 dimensions by doing the analysis for an average battery price of $422.4/kWh. This represents a battery price in which half of the project development, engineering, procurement and construction (EPC), associated hardware and grid connection costs are already included in the solar installation costs.
Following the procedure in section IRR Optimization at the end of Figure 2, we choose a range of land prices from $0 to $400/m2 in increments of $100/m2. For each of these land prices we first calculate the battery capacity for a PV microgrid that maximizes the IRRPV. We then choose a CPV target cost that matches that optimized IRRPV using a range of battery capacities in the CPV microgrid from 0 to 400 kWh. We select the battery capacity that allows the highest CPV target cost. This procedure follows that illustrated in Figure 8, repeated for each of the land prices considered. It should be noted that the results in Figures 5, 6 are for savings and do not involve costs. They therefore apply equally to the analysis in this section.
An example of the results is given in Figure 9 for Lancaster using the 8 a.m.−6 p.m. load profile. In Figure 8 the horizontal axis is battery capacity and the graphs show the PV IRR and target CPV price across a range of battery capacities. The maximum PV IRR and target CPV cost correspond to the peaks of the graphs. In Figure 9, this maximization is subsumed into each point on the graphs and the horizontal axis is now land price. The optimum battery capacities are indicated at each point on the graphs. We note that at higher land prices, the optimal battery capacity is also higher.
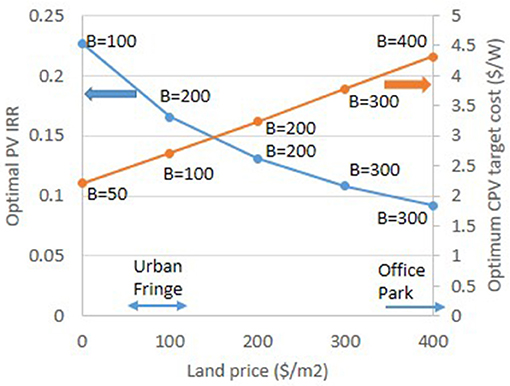
Figure 9. Results of choosing optimal battery capacities at different land prices in Lancaster with the 8 a.m.−6 p.m. load profile, (i) for PV IRR (left axis, blue graph) and (ii) for the CPV target cost that matches the PV IRR (right axis, orange graph). The battery capacities that achieve these optima are indicated by each point on the two graphs.
Commercial land prices in Las Vegas, Lancaster and Modesto range from $50 to 100/m2 for semi-rural land at the city edge, to ~$400/m2 in commercial office parks in the suburbs (Land and Farm, 2018). Figure 9 shows that in these areas, target prices for micro-tracked CPV are in the range of current estimates for pedestal tracked CPV [$2.4/W (Haysom et al., 2015) and $3.3/W (Ekins-Daukes and Johnson, 2017)], and can be even higher when land prices are at the top end of the range. Much higher land prices in downtown areas would theoretically imply cost competitiveness of CPV at even higher target prices, but in reality, Figure 9 shows that the corresponding IRR would be too low. Typically, an IRR of at least 7.5–10% is expected in solar projects (Wouters et al., 2015; Parra et al., 2017).
The cost of land as a proportion of the total project cost is shown in Figure 10. The proportion is lower for CPV than for PV for two reasons (i) CPV is more efficient than PV and hence requires less land and (ii) the fact that CPV has a higher target price than current PV prices means that the cost of the solar part of the project is higher for CPV than for PV. Although CPV uses half as much land as PV, in proportionate terms the cost of land in an optimized CPV system is less than half of the corresponding cost for PV.
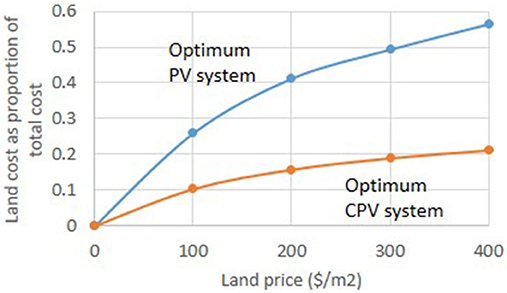
Figure 10. Land cost as a proportion of total project cost for the optimal battery sizes from Figure 9.
The other load profiles result in little change to Figure 9 and we record the results in Table 5. For Las Vegas, the low electricity prices result in an IRR for PV in Table 4 that is much lower than for Lancaster and Modesto. Adding a cost of land results in IRR values less than 7.5–10%, and these projects would typically not be implemented by solar developers. Table 5 therefore contains results for Lancaster and Modesto without including Las Vegas.
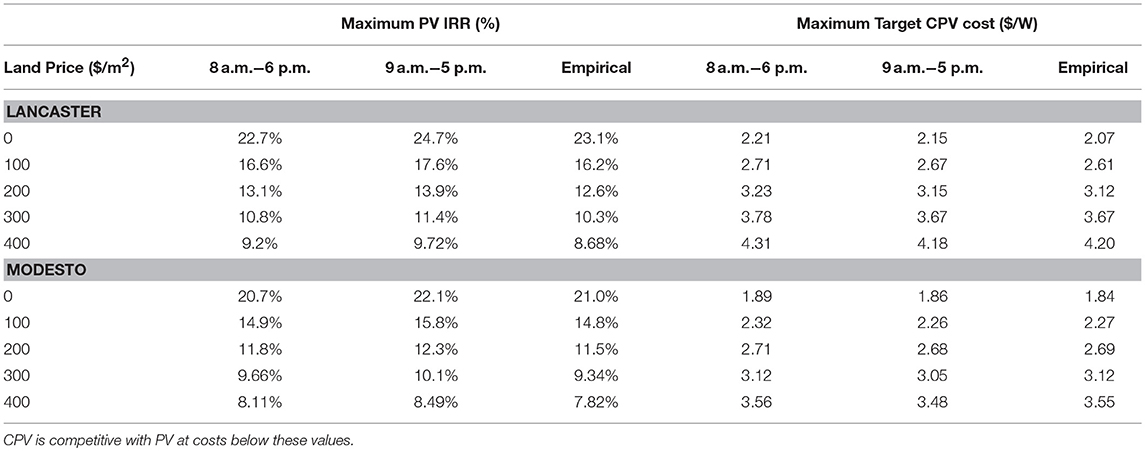
Table 5. Optimal PV IRR under 3 load profiles in Lancaster and Modesto and the target CPV cost required to match that IRR for different land prices and a battery price of $422.4/kWh.
Table 5 gives target prices for micro-tracked CPV that are in the same range as current estimates for pedestal tracked CPV. Care should be taken in extrapolating the results for land prices over $400/m2 since the corresponding IRRs are marginal from the point of view of solar developers.
Modesto and Lancaster have similar tariffs, but in Modesto the annual energy yield from CPV is 10% higher than for PV, Table 3, whereas in Lancaster the corresponding figure is 26%. Target CPV prices are 13–21% higher in Lancaster than in Modesto. We noted this effect in Table 4 with a land price of zero and Table 5 shows that it becomes more pronounced at higher land prices. Land price, tariff, and the ratio of CPV to PV annual energy yields are the main determinants of target CPV prices. The load profile and the battery price have little impact.
The highest CPV target prices can be expected in areas with high tariffs, a high ratio of CPV to PV annual energy yields and high land prices. An upper limit on land prices is however imposed by the need to obtain a sufficient IRR for the project to go ahead. This paper has shown that these constraints are satisfied in Lancaster, Modesto and Las Vegas and result in realistic CPV target prices.
Conclusions
To date, 86% of CPV deployments have been utility-scale projects using pedestal mounted trackers. Research into micro tracking technology for CPV, in which the cell is moved in relation to fixed optics can result in a form factor for the modules that is similar to that of fixed PV, allowing CPV to compete with PV in behind-the-meter applications. However, at the time of writing, commercial prices for micro-tracked CPV are unavailable. In such situations, the cost of land/roof area can be a significant factor, conferring an advantage on CPV over PV since CPV's greater efficiency allows it to occupy less land/roof area. In this paper we estimate target prices for micro-tracked CPV ($/W) at which it can compete with PV in behind-the-meter situations using microgrids with battery capacities optimized for each situation. This analysis takes into account the price of batteries used in microgrids, the load profile of the customer, the demand and time-of-use charges, future trends in electricity prices and the hourly variation of solar irradiance.
Using data from cities in southwestern USA, for which land prices range from $50 to $100/m2 at the outskirts to ~$400/m2 in suburban commercial parks, results were obtained for target micro-tracked CPV prices at which CPV achieves the same internal rate of return as PV. Prices ranged from $2.3 to 2.7/W at the outskirts to $3.5–4.3/W in suburban commercial parks. When land/roof area is essentially free of charge, the corresponding CPV target prices range from $1.8 to 2.2/W. For comparison, current prices for pedestal mounted CPV range from $2.4 to 3.3/W. If micro-tracked CPV can be commercialized at prices similar to those of pedestal mounted CPV, it therefore has considerable opportunities to compete with fixed PV.
An important finding of this research is that the target CPV prices are insensitive to (i) the prices of batteries used in the solar microgrids (ii) the load profile of typical office buildings (iii) the demand and time-of-use charges and (iv) future trends in electricity tariffs. This robustness in our results is due to the fact that the analysis shows that these factors affect the profitability of PV and CPV in similar ways even though the optimal battery size in the microgrid is different for PV and CPV. The two factors that have a major influence on target CPV prices are (i) land price and (ii) the ratio of CPV to PV annual energy yield. Prices at the low(high) end of the ranges given in the previous paragraph correspond to an energy yield ratio of 1.10(1.27).
These results were obtained after optimization of PV and CPV microgrids, including optimal scheduling of power in/out of the battery and optimal battery sizing. The internal rate of return is then calculated over a 32 year life of the solar modules, replacing the battery and inverter as necessary within that time frame. This work allowed us to derive conclusions about how optimized CPV microgrids compare with optimized PV microgrids, whereas the current microgrid literature focuses on PV.
The broader generation profile of CPV compared to PV better matches broad load profiles in office buildings extending outside the stylized 9 a.m.−5 p.m. range. However, in scenarios in which an optimized PV microgrid required a battery, the same was true of CPV. Optimized CPV microgrids have the following advantages over optimized PV microgrids: (i) they achieve a higher reduction in peak time-of-use electricity charges (ii) they achieve a greater reduction in monthly peak consumption from the grid, thus reducing demand charges (iii) they require less battery cycles, thus reducing battery cell replacement costs.
Demand charges based on peak monthly consumption from the grid are a major reason for using batteries in a microgrid, allowing solar power to be shifted to times of peak consumption. The percentage of savings that is due to reduced demand charges is higher for CPV than for PV up to a certain battery capacity. PV can achieve a higher percentage demand charge savings than CPV at the expense of a larger battery. The size of battery that is optimal in a CPV microgrid is smaller than that in a PV microgrid for most land prices.
In summary, PV and CPV microgrids are optimized with different battery schedules and different battery sizes. However, the target price at which micro-tracked CPV competes with PV is insensitive to those differences and to battery prices, load profiles, and electricity tariffs. CPV target price depends primarily on the land price and on the ratio between CPV and PV annual energy yield. Those target prices are realistic compared to pedestal mounted CPV.
Author Contributions
DW: conception and design of the work, drafting the work, agree to be accountable for all aspects of the work in ensuring that questions related to the accuracy or integrity of any part of the work are appropriately investigated and resolved, overall project leadership and management. SB: the acquisition of data for the work, literature review and positioning the work within the existing body of knowledge, critical review of the work and additions to the manuscript. CR-G: analysis or interpretation of data for the work, optimization and scenario analysis, critical review of the work and additions to the manuscript.
Funding
This research was funded by the Social Sciences and Humanities Research Council of Canada, grant #892-2017-2060.
Conflict of Interest Statement
The authors declare that the research was conducted in the absence of any commercial or financial relationships that could be construed as a potential conflict of interest.
The reviewer CW and handling editor declared their shared affiliation at time of review.
References
Apostoleris, H., Stefancich, M., and Chiesa, M. (2016). Tracking-integrated systems for concentrating photovoltaics. Nat. Energy 1:16018. doi: 10.1038/nenergy.2016.18
Apostoleris, H., Stefancich, M., and Chiesa, M. (2018). Concentrating Photovoltaics (CPV): The Path Ahead. Springer.
Aquion Energy (2018). M110-LS83 Battery Module Product Specification Sheet. Available online at: https://cdn2.hubspot.net/hubfs/147472/01_Product_Documentation/Aquion_Energy_M110-LS83_M110-L083_Product_Specification_Sheet.pdf (Accessed August 30, 2017).
Azzopardi, B., and Mutale, J. (2009). “Smart integration of future grid-connected PV systems,” in Proceedings of the 34th IEEE Photovoltaic Spec. Conf. (PVSC) (Philadelphia, PA), 2364–2369.
Boloukat, M., and Foroud, A. (2016). Stochastic-based resource expansion planning for a grid-connected microgrid using interval linear programming. Energy 113, 776–787. doi: 10.1016/j.energy.2016.07.099
Brusco, G., Burgio, A., Menniti, D., Pinnarelli, A., and Sorrentino, N. (2016). The economic viability of a feed-in tariff scheme that solely rewards self-consumption to promote the use of integrated photovoltaic battery systems. Appl. Energy 183, 1075–1085. doi: 10.1016/j.apenergy.2016.09.004
Celli, G., Pilo, F., Pisano, G., and Soma, G. G. (2005). “Optimal participation of a microgrid to the energy market with an intelligent EMS,” in International Power Engineering Conference (Singapore).
Cervantes, J., and Choobineh, F. (2018). Optimal sizing of nonutility-scale solar power system and its battery storage. Appl. Energy 216, 105–115. doi: 10.1016/j.apenergy.2018.02.013
Clean Power Research (2018). Clean Power Research , SolarAnywhere Data. Available online at: http://www.solaranywhere.com (Accessed March 30, 2018).
Cole, W., Frew, B., Gagnon, P., Richards, J., Sun, Y., Zuboy, J., et al. (2017). SunShot 2030 for Photovoltaics (PV): Envisioning a Low-Cost PV Future. NREL.
Di Francia, G. (2013). “The impact of recycling policies on the photovoltaic levelized cost of the electricit,” in International Conference on Renewable Energy Research and Applications (Madrid), 979–983.
Ekins-Daukes, N., and Johnson, A. D. (2017). “Cost Requirements for High Volume CPV Manufacturing,” in CPV-13 Conference (Ottawa, ON).
Fina, B., Fleischhacker, Auer, H., and Lettner, G. (2017). Economic assessment and business models of rooftop photovoltaic systems in multiapartment buildings: case studies for Austria and Germany. J. Renewable Energy 2018:9759680. doi: 10.1155/2018/9759680
Freitas, S., Reinhart, C., and Brito, M. C. (2018). Minimizing storage needs for large scale photovoltaics in the urban environment. Sol. Energy 159, 375–389. doi: 10.1016/j.solener.2017.11.011
Fu, R., Feldman, D., Margolis, R., Woodhouse, M., and Ardani, K. (2017). U.S. Solar Photovoltaic System Cost Benchmark: Q1 2017. NREL Report NREL/TP-6A20-68925.
Gerstmaier, T., Gomez, M., Gombert, A., Mermoud, A., and Lejeune, T. (2011). “Validation of the PVSyst performance model for the Concentrix CPV technology,” in 7th International Conference on Concentrating Photovoltaic Systems: CPV-7 2011, Vol 1407 (Las Vegas, NV), 366–369.
Gil, E., Martinez, M., and de la Rubia, O. (2017). “Operation and Maintenance Results from ISFOC CPV Plants,”in CPV-13 Conference (Ottawa, ON).
Grand View Research (2017). Market Estimates & Trend Analysis, Concentrated Photovoltaic Market. Available online at: https://www.grandviewresearch.com/industry-analysis/concentrated-photovoltaic-market (Accessed February 21, 2018).
Hanna, R., Kleissl, J., Nottrott, A., and Ferry, M. (2014). Energy dispatch schedule optimization for demand charge reduction using a photovoltaic-battery storage system with solar forecasting. Sol. Energy 103, 269–287. doi: 10.1016/j.solener.2014.02.020
Hatanaka, A., Kageyama, H., and Masuda, T. (2015). “A 160-kW high-efficiency photovoltaic inverter with paralleled SiC-MOSFET modules for large-scale solar power,” in 2015 IEEE International Telecommunications Energy Conference (INTELEC), 1–5.
Haysom, J. E., Hinzer, K., and Wright, D. J. (2016). Impact of electricity tariffs on optimal orientation of photovoltaic modules. Prog. Photovolt. Res. Appl. 24, 253–260. doi: 10.1002/pip.2651
Haysom, J. E., Jafarieh, O., Anis, H., Hinzer, K., and Wright, D. J. (2015). Learning curve analysis of concentrated photovoltaic systems, Prog. Photovolt. Res. Appl. 23, 1678–1686. doi: 10.1002/pip.2567
Khalilpour, R., and Vassallo, A. (2016). Planning and operation scheduling of PV-battery systems: a novel methodology. Renew. Sust. Energ. Rev. 53, 194–208. doi: 10.1016/j.rser.2015.08.015
King, D. L., Gonzalez, S., Galbraith, G. M., and Boyson, W. E. (2017). Performance Model for Grid-Connected Photovoltaic Inverters. Sandia Report. SAND2007–5036.
Kittner, N., Lill, F., and Kammen, D. M. (2017). Energy storage deployment and innovation for the clean energy transition. Nat. Energy 2:17125. doi: 10.1038/nenergy.2017.125
Land Farm (2018). Land and Farm, Land for Sale. Available online at: www.landandfarm.com (Accessed May 20, 2018).
Lowder, T., Mendelsohn, M., Speer, B., and Hill, R. (2013). Continuing Developments in PV Risk Management: Strategies, Solutions, and 383 Implications. National Renewable Energy Laboratory. Available online at: http://www.nrel.gov/docs/fy13osti/57143.pdf (Accessed March 29, 2016).
MacDougall, H., Tomosk, S., and Wright, D.J. (2018). Geographic maps of the impact of government incentives on the economic viability of solar power. Renew. Energy 122, 497–506. doi: 10.1016/j.renene.2017.12.108
Makbul, A. M., Hiendro, A., and Twaha, S. (2015). Economic analysis of PV/diesel hybrid system with flywheel energy storage. Renew. Energy 78, 398–405. doi: 10.1016/j.renene.2015.01.026
Mariaud, A., Acha, S., Ekins-Daukes, N., Shah, N., and Markides, C. N. (2017). Integrated optimisation of photovoltaic and battery storage systems for UK commercial buildings. Appl. Energy 199, 466–478. doi: 10.1016/j.apenergy.2017.04.067
Marnay, C., Venkataramanan, G., Stadler, M., Siddiqui, A., Firestone, R., and Chandran, B. (2008). Optimal technology selection and operation of commercial-building microgrids. IEEE Trans. Power Syst. 23, 975–982. doi: 10.1109/tpwrs.2008.922654
Masters, G. (2004). Renewable and Efficient Electric Power Systems, Hoboken, NJ: John Wiley & Sons, Ltd.
McLaren, J., Anderson, K., Laws, N., Gagnon, P., DiOrio, N., and Li, X. (2018). Identifying Critical Factors in the Cost-Effectiveness of Solar and Battery Storage in Commercial Buildings. National Renewable Energy Laboratory. Available online at: https://www.nrel.gov/docs/fy18osti/70813.pdf. NREL/PR-6A20-70813
Meister, P., Jia, H., Li, J., Kloepsch, R., Winter, M., and Placke, T. (2016). Best practice: performance and cost evaluation of lithium ion battery active materials with special emphasis on energy efficiency. Chem. Mater. 28, 7203–7217. doi: 10.1021/acs.chemmater.6b02895
Meng, L., Sanseverino, E. R., Luna, A., Dragicevic, T., Vasquez, J. C., and Guerrero, J. M. (2016). Microgrid supervisory controllers and energy management systems: a literature review Renew. Sustain. Energy Rev. 60, 1263–1273. doi: 10.1016/j.rser.2016.03.003
Merei, G., Moshovel, J., Magnor, D., and Sauer, D. U. (2016). Optimization of self-consumption and techno-economic analysis of PV-battery systems in commercial applications. Appl. Energy 168, 171–178. doi: 10.1016/j.apenergy.2016.01.083
Moumouni, Y., and Baker, R. J. (2015). “Buffer sizing of concentrated photovoltaic batteries: an economic analysis,” in IEEE 58th International Midwest Symposium on Circuits and Systems (MWSCAS) (Fort Collins, CO).
Mudasser, M., Emmanuel, K., and Yiridoe, corscadden, k. (2015). cost-benefit analysis of grid-connected wind biogas hybrid energy production, by turbine capacity and site. Renew. Energy 80, 573–582. doi: 10.1016/j.renene.2015.02.055
Muller, M., Kurtz, S., Steiner, M., and Siefer, G. (2015). Translating outdoor CPV I–V measurements to a CSTC power rating and the associated uncertainty. Prog. Photovolt. Res. Appl. 23, 1557–1571. doi: 10.1002/pip.2590
NREL (2018). Best Research-Cell Efficiencies.Available online at: https://www.nrel.gov/pv/assets/images/efficiency-chart.png (Accessed Feb 3, 2018).
Park, A., and Lappas, P. (2017). Evaluating demand charge reduction for commercial-scale solar PV coupled with battery storage. Renew. Energy 108, 523–532. doi: 10.1016/j.renene.2017.02.060
Parra, D., Norman, S. A., Walker, G. S., and Gillott, M. (2017). Optimum community energy storage for renewable energy and demand load management. Appl. Energy 200, 358–369. doi: 10.1016/j.apenergy.2017.05.048
Price, J. S., Grede, A. J., Wang, B., Lipski, V. M., Fisher, B., Lee, K. T., et al. (2017). High-concentration planar microtracking photovoltaic system exceeding 30% efficiency. Nat. Energy 2:17113. doi: 10.1038/nenergy.2017.113
Price, J. S., Sheng, X., Meulblok, B. M., Rogers, J. A., and Giebink, N. C. (2015). Wide-angle planar microtracking for quasi-static microcell concentrating photovoltaics. Nat. Commun. 6:6223. doi: 10.1038/ncomms7223
PVsyst (2018). 6 Help. Array Incidence Loss (IAM). Available online at: http://files.pvsyst.com/help/index.html?iam_loss.htm, (Accessed March 1, 2018).
Raoufat, M. E., Asghari, B., and Sharma, R. (2018). “Model predictive BESS control for demand charge management and PV-utilization improvement,” in Conference on Innovative Smart Grid Technology (ISGT) (Washington, DC).
Reichelstein, S., and Yorston, M. (2013). The prospects for cost competitive solar PV power. Energy Policy 55, 117–127. doi: 10.1016/j.enpol.2012.11.003
Rubel, H., Pieper, C., Zenneck, J., and Sunak, Y. (2017). How Batteries and Solar Power are Disrupting Energy Markets. BCG Report. Available online at: https://www.bcg.com/en-ca/publications/2017/energy-environment-how-batteries-and-solar-power-are-disrupting-electricity-markets.aspx (Accessed Feb 15, 2018).
Saft (2018). Lithium-Ion Battery Life. Available online at: https://www.saftbatteries.com/ (Accessed May 25, 2017).
Sahin, A. Z., Rehman, S., and Al-Sulaiman, F. (2017). Global solar radiation and energy yield estimation from photovoltaic power plants for small loads. Int. J. Green Energy 14, 490–498. doi: 10.1080/15435075.2016.1278374
Sandia lab (2018). ASHRAE Incidence Angle Modifier Model. Available online at: https://pvpmc.sandia.gov/modeling-steps/1-weather-design-inputs/shading-soiling-and-reflection-losses/incident-angle-reflection-losses/ashre-model/ (Accessed March 30, 2018).
Tesla (2018). Powerwall. Available online at: https://www.tesla.com/en_CA/powerwall (Accessed August 30, 2017).
Tomosk, S., Haysom, J. E., Hinzer, K., Schriemer, H., and Wright, D. J. (2017). Mapping the geographic distribution of the economic viability of photovoltaic load displacement projects in sw USA. Renew. Energy 107, 101–112. doi: 10.1016/j.renene.2017.01.049
Wouters, C., Fraga, E., and James, A. (2015). An energy integrated, multi-microgrid, MILP (mixed-integer linear programming) approach for residential distributed energy system – planning – a south Australian case-study. Energy 85, 30–44. doi: 10.1016/j.energy.2015.03.051
Yandt, M. D., Hinzer, K., and Schriemer, H. (2015). “Identifying representative air masses for multi-junction solar cell bandgap optimization 367 to maximize annual energy yield,” in Photovoltaic Specialist Conference (PVSC), 2015 IEEE 42nd (New Orleans, LA).
Zhang, S., Qiang, J., Yang, L., and Zhao, X. (2016). Prior-knowledge-independent equalization to improve battery uniformity with energy efficiency and time efficiency for lithium-ion battery. Energy 94, 1–12. doi: 10.1016/j.energy.2015.11.004
Zhang, X., Sharma, R., and He, Y. (2012). “Optimal energy management of a rural microgrid system using multi-objective optimization,” in IEEE PES Innov Smart Grid Technol (ISGT) (Washington, DC), 1–8.
Zhang, Y., Bezawada, Y., Fu, R., Tian, W., and Winter, R. M. (2017b). “Study of a 3kW high-efficient wide-bandgap DC-DC power converter for solar power integration in 400V DC distribution networks,” in 2017 IEEE 12th International Conference on Power Electronics and Drive Systems (PEDS), 680–684.
Zhang, Y., Lundblad, A., Campana, P. E., Benavente, F., and Yan, J. (2017a). Battery sizing and rule-based operation of grid-connected photovoltaic-battery system: a case study in Sweden. Energy Convers. Manage. 133, 249–263. doi: 10.1016/j.enconman.2016.11.060
Keywords: concentrator photovoltaics, micro-tracking, CPV, microgrid, internal rate of return, demand charges, behind-the-meter
Citation: Wright DJ, Badruddin S and Robertson-Gillis C (2018) Micro-Tracked CPV Can Be Cost Competitive With PV in Behind-The-Meter Applications With Demand Charges. Front. Energy Res. 6:97. doi: 10.3389/fenrg.2018.00097
Received: 02 July 2018; Accepted: 03 September 2018;
Published: 25 September 2018.
Edited by:
Kok-Keong Chong, Universiti Tunku Abdul Rahman, MalaysiaReviewed by:
Chee-Woon Wong, Universiti Tunku Abdul Rahman, MalaysiaRunsheng Tang, Yunnan Normal University, China
Copyright © 2018 Wright, Badruddin and Robertson-Gillis. This is an open-access article distributed under the terms of the Creative Commons Attribution License (CC BY). The use, distribution or reproduction in other forums is permitted, provided the original author(s) and the copyright owner(s) are credited and that the original publication in this journal is cited, in accordance with accepted academic practice. No use, distribution or reproduction is permitted which does not comply with these terms.
*Correspondence: David J. Wright, ZHdyaWdodEB1b3R0YXdhLmNh