 Verena Heinisch
 Mikael Odenberger
- Division of Energy Technology, Chalmers University of Technology, Gothenburg, Sweden
An increase in distributed small-scale generation and storage in residential prosumer households requires an understanding of how the household-controlled operation of these distributed technologies differ from a system-optimal utilization. This paper aims at investigating how residential photovoltaic (PV)-battery systems are operated, given different assumed incentives, and whether or not a prosumer induced operational pattern differs from what is desirable from a total electricity system point of view. The work combines a household optimization model that minimizes the annual household electricity bill for two price zones in southern Sweden with a dispatch model for the northern European electricity supply system. The results show significant differences in the charging and discharging patterns of residential batteries. A household annual electricity cost minimization gives many hours in which only a fraction of the battery capacity is used for charging and discharging, mainly driven by incentives to maximize self-consumption of PV-generated electricity. In contrast, in a total electricity system operational cost minimization larger fractions of the available battery capacity are utilized within single hours. In the total system optimization case, the batteries are charged and discharged less frequently and the energy turnover in the batteries is only half that of the household optimization case. For all the cases studied, the hourly electricity price provides only a limited incentive for households to operate their batteries in a system-optimal manner.
Introduction
The rapidly decreasing cost of photovoltaic (PV) panels together with their characterization as modular (and thereby, scalable) enable electricity end-users of different sizes to transform from purely passive consumers to so-called “prosumers” (a fusion of the terms “producers” and “consumers”), who are capable of generating electricity on their own property (Schleicher-Tappeser, 2012). This possibility for microgeneration in private households has extended the activities of electricity customers from simply purchasing electricity from utilities, to taking a more active role in the production and storage of electricity. The IEA-RETD (2014) report on residential prosumers has identified two factors as being important for the rapid increase in the number of residential prosumers: (1) economic aspects, such as reduced PV installation prices and increased retail prices of electricity; and (2) behavioral factors, such as the desire for greater self-sufficiency, and increased environmental awareness. As costs for battery systems are also expected to continue to fall (Nykvist and Nilsson, 2015), there will be additional opportunities for prosumers to assume control over their electricity utilization and to increase self-consumption of the electricity generated by their own PV panels. Breen (2013) has argued that the future of storage lies behind the meter. A consequence of such a development will be that the patterns of consumer load profiles will increasingly change from the present residential demand curves. Thus, it is important to obtain a better understanding of how prosumer demand and supply patterns affect the electricity system. As Agnew and Dargusch (2015) have pointed out, the different motivations of electricity end-users may change their demand patterns, and thereby disrupt the operation of the current centralized electricity supply system. In this paper, we investigate the extent to which unregulated prosumer patterns differ from the overall system optimal utilization of PV and battery systems, and whether it is of value to incentivize a certain behavior on the consumer side.
On the household level, variable renewable electricity (VRE) generation from PV panels, which peaks around mid-day, usually does not match the daily variations in residential electricity demand, for which the peaks occur during mornings and evenings. Small-scale distributed storage helps to bridge this gap by enabling shifting of the PV electricity supply to later hours. Nair and Garimella (2010) have assessed the techno-economic benefits of different battery storage technologies as a means to integrate small-scale VRE. The economic benefits to households from PV-battery systems usually arise from the difference between the retail and wholesale prices for electricity. Electricity that is fed into the grid by households is often priced at wholesale market levels, while the retail price of purchased electricity is usually higher, including electricity taxes and grid fees. Previous studies of PV-battery system operation from a household perspective have focused on either the economic benefits of these systems or the goal of reaching high levels of household electricity self-sufficiency, as identified in the review of Hoppmann et al. (2014). Hoppmann and coworkers also modeled the optimal PV and storage system sizes for households under different scenarios for the German market. Mulder et al. (2013) have analyzed the dimensioning of PV-battery systems with varying electricity prices and investment years, using the current German incentive system as the starting point. Weniger et al. (2014) have investigated the sizing and economic feasibility of residential PV-battery systems, and they have concluded that self-consumption of PV systems, rather than feed-in payments, will become increasingly important, such that in the long-term scenario, combining residential PV systems with batteries will be the most economically efficient solution for residential customers. Nyholm et al. (2016) have shown how different battery sizes increase the levels of self-consumption and self-sufficiency of Swedish households. Metz and Saraiva (2015) have discussed the impact of storage systems used for self-consumption as well as electricity arbitrage trading on the demand for electricity, utilizing German standard load profiles. Linssen et al. (2015) have studied the impacts of battery capacity on PV electricity self-consumption and economic feasibility in residential households, and further shown that the use of realistic load profiles is essential for reliable conclusions as to the application of PV-battery systems. In the present study, we not only consider PV-battery installations from the household perspective, as in the studies discussed above, but we also place the emphasis on analyzing how household-optimal operation differs from total system-optimal operation for PV-battery systems.
Storage systems that are connected to distributed PV generation have the potential to reduce the voltage fluctuations associated with intermittent feed-in at different locations in a low-voltage grid, and can also help with flattening the electricity demand peaks. Here, we do not consider the impacts of different residential battery dispatch strategies on the operation of the distribution system, since the focus of the present study is to elucidate differences between household-optimal and total system-optimal utilization of PV-battery systems. Shivashankar et al. (2016) have provided an overview of the problems caused by the fluctuating power output of PVs and how these can be mitigated. Other studies have examined the scheduling of residential batteries and the impact on voltage fluctuations, reverse power flows, and electricity demand smoothening (Leadbetter and Swan, 2012; Nottrott et al., 2013; Purvins et al., 2013; Schneider et al., 2014; Moshövel et al., 2015; Ratnam et al., 2015, 2016) as well as the positive effects related to the batteries not being located at the customer side (Tant et al., 2013). The conflicting interests of distribution system operators (DSOs) and energy trading companies, in terms of the operation of storage systems in distribution grids, have been explored previously (Divya and Østergaard, 2009; Nykamp et al., 2013). The responses of consumers with respect to what degree tariff designs can trigger investments in and operation of PV-battery systems have also been discussed (Jargstorf et al., 2015).
Another group of studies has focused on understanding how future residential load profiles may differ from today's demand curves (Elsland et al., 2013; Veldman et al., 2013; Kaschub et al., 2016). A general conclusion from these studies is that a growth in residential electricity demand as well as increased volatility in residential load curves can be expected to impact the electricity system and utilization of distribution and transmission grids.
While previous work focuses on either the economic or energy self-sufficiency-related benefits for residential prosumers on the single household level or the impacts of PV-battery systems on the distribution grid or the load profile, we ask the question if there is a contradiction in how it is most valuable to operate PV-battery systems from a system perspective compared to from a household perspective or if the values of these two perspectives are of complementing character. Thus, we take a comparative approach in investigating the different incentives for a system-optimal vs. a household-optimal operation of the household PV-battery systems. The underlying research questions are:
• What are the most influential factors that shape the households' consumption profile from the grid, if PV-battery systems become common in households?
• How does the presence of a PV-battery system in (Swedish) households impact the total electricity system balance on an hourly scale? Can a PV-battery system be beneficial to the total electricity system balance under the current incentive structure (market setup) or will this require new policy?
As Mulder et al. (2013) have argued, residential electricity customers are likely to become the first available business case involving small-scale storage of electricity, as they experience the highest electricity prices. Our study compares a system in which electricity end-users maximize their income from PV-battery systems to a case in which it is assumed that the possibility exists to control the operation of all the battery capacity available in the system, in a way that supports minimization of the total operational costs of the system. Thus, the driving forces for the preferred charge and discharge patterns of the batteries from a single household and an overall system perspective are compared. This comparison is performed by modeling the change in residential electricity demand from the grid due to the operation of PV-battery systems in southern Sweden, including the influences of interactions with cost-optimal electricity system dispatch of the northern European electricity system.
Methodology and Model Description
We model the optimal operation of residential PV-battery systems in two southern Swedish regions with consequent impacts on the electricity dispatch, and considering import/export to surrounding regions. Two main cases are investigated: (a) minimizing the annual household electricity cost (Household case); and (b) dispatching the same battery capacity from a system-optimal perspective (System case). In addition, in section Seasonal Differences in Battery Charge and Discharge, a Seasonal Split case is considered, in which the PV-battery systems are controlled by household optimization during summer hours and as part of the total system optimization during winter hours.
Figure 1 shows the modeling package applied in this work and in what order the sub-models are run. The Household case is run in two steps (steps 1 and 2 in Figure 1) and the System case in three steps (steps 1–3 in Figure 1), where steps 1–3 represent:
1. Derivation of electricity generation composition: The electricity generation system is derived for the year of interest (here, Year 2032) from the ELIN investment model (for further details, see Odenberger et al., 2009; Göransson et al., 2014). The generation and transmission capacities from two different ELIN scenarios, as described in Table 1 and section Composition of the Electricity Generation System from the ELIN Investment Model, are utilized as inputs to the EPOD dispatch model (steps 2 and 3).
2. Optimal residential PV-battery capacity and household-optimal PV-battery system dispatch: The residential PV-battery capacity utilized for both the Household case and System case is calculated using the iterative approach presented by Goop et al. (submitted), also described in Goop (2017). This iterative modeling approach combines the European dispatch model EPOD with a local household annual electricity cost-optimization model that includes prosumer investments in PV-battery capacity. This method allows one to account for feedback between the electricity system dispatch and the optimal size of residential PV-battery systems. The procedure derives the optimal household PV-battery capacities and optimal operation pattern of the batteries as well as the electricity system dispatch, considering the household load profiles.
3. Extended EPOD modeling for system-optimal dispatch of PV-battery systems: Using the household PV and battery capacities derived in step 2, the system-optimal charge and discharge of centrally controlled PV-battery systems are modeled as part of the total system cost optimization in the EPOD dispatch model.
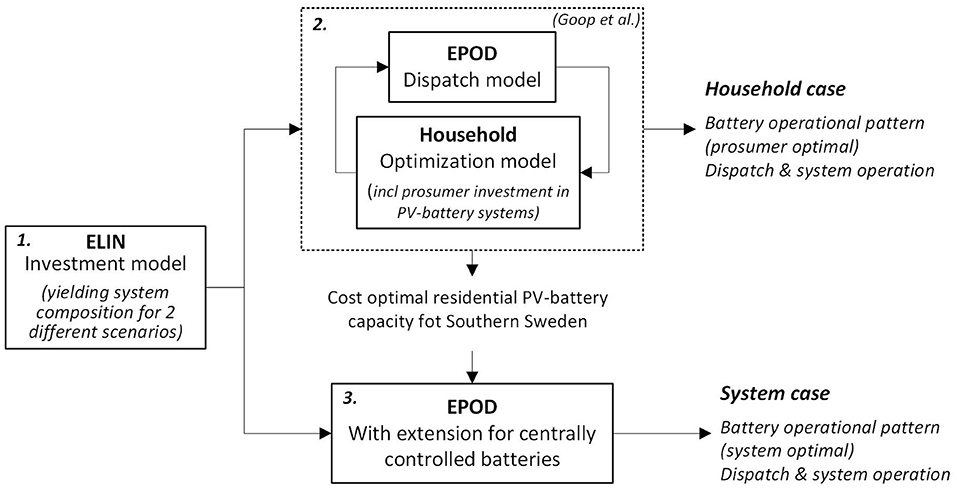
Figure 1. Schematic of the modeling procedure, including the electricity generation system investment model ELIN, the iterative approach that combines the European dispatch model EPOD and a household annual cost-optimization model [developed by Goop et al. (submitted), see also (Goop, 2017)], and the EPOD model, which is further extended to represent centrally controllable battery capacity.
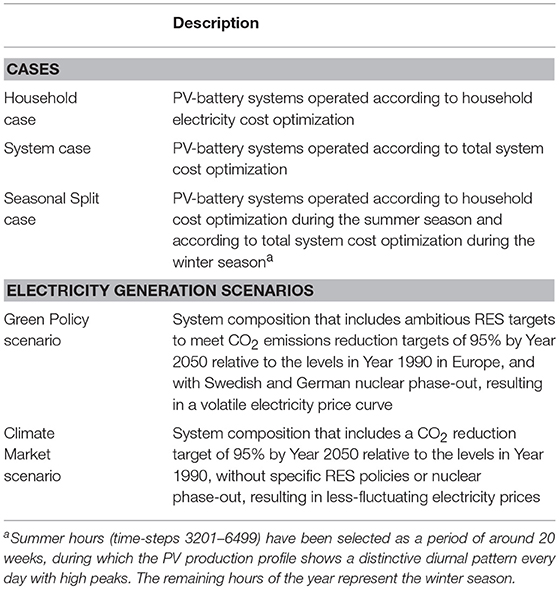
Table 1. Summary of cases and scenarios considered in the modeling.
Figure 2 shows the regions represented in the ELIN and EPOD models. The residential PV-battery systems are implemented in the two southern Swedish regions, SE1 and SE2. More details of the modeling are given in the following sub-sections. Electricity generation capacities according to output from the ELIN investment model, as well as technology input data to the ELIN and EPOD models can be found in the Appendix, in the Supplementary Material.
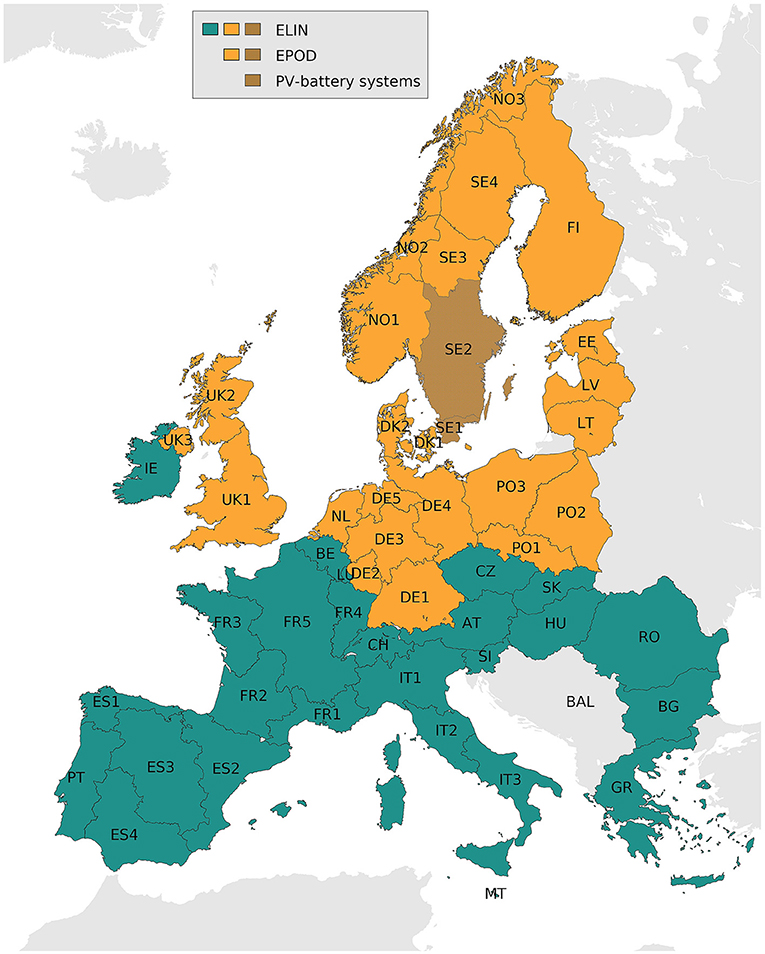
Figure 2. Regions considered in the ELIN (green, orange, and orange-patterned) and EPOD (orange and orange-patterned) models. Residential PV-battery systems (orange-patterned) are included in the southern Swedish regions (SE1 and SE2) in the modeling package [Figure adapted from Goop et al. (submitted)].
Table 1 gives a summary of the two modeled cases introduced above–the Household case and System case–as well as the two electricity generation scenarios considered. The two cases are complemented with a mixed case in which residential PV-battery systems are operated according to the household cost optimization strategy during the summer season and according to the total system dispatch strategy during the winter season (Seasonal Split case). This Seasonal Split case is used to investigate a possible business case, where prosumer households could be compensated to adapt the charge and discharge patterns of their PV-battery systems according to the system value, during specific periods of the year. Thus, while the households still have access to the PV-battery systems throughout the whole year, during the winter season, battery operation is dictated by the total system optimization.
Composition of the Electricity Generation System From the ELIN Investment Model
The ELIN model defines cost-optimal investments in electricity generation and transmission capacity in the European Union, Norway and Switzerland, up to Year 2050 under different policy constraints, such as a cap on CO2 emissions (Odenberger et al., 2009; Göransson et al., 2014). For the present work, the system composition represented in the dispatch modeling has been derived from the ELIN-generated results for the two scenarios of “Green Policy” and “Climate Market” (Table 1). Both scenarios comply with stringent CO2 emissions reductions. The Green policy scenario represents a future electricity system pathway with a high share of renewables, shorter lifetimes for Swedish and German nuclear power plants, and no option for carbon capture and storage (CCS). For comparison, the Climate Market scenario, with more nuclear capacity, no specific RES target, and the possibility to invest in CCS, and thus, with less fluctuating marginal electricity prices is analyzed (see section Less-Fluctuating Marginal Price Curve). Figure 3 gives the total generation capacity for Sweden, as obtained from ELIN modeling of the Green Policy and Climate Market scenarios. Under the label “solar,” the total PV capacity in the system is plotted, i.e., the investment in PV capacity from residential prosumers, as explained in step 2 in Figure 1 as well as centralized solar PV from the ELIN model. Electricity demand for the modeled Year 2032 accounts for a total of 147 TWh for all four Swedish regions in the Green Policy scenario and 160 TWh for the Climate Market scenario. Further details of the assumptions made and the modeling of the electricity system scenarios can be found in Unger et al. (2014).
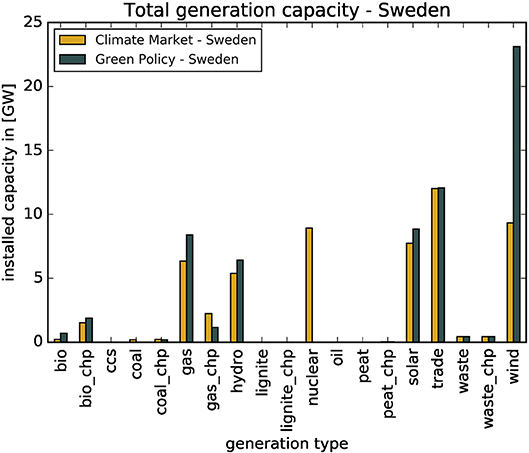
Figure 3. Generation capacities for Sweden according to output from the ELIN investment model for Year 2032. The PV capacity from the household annual cost optimization model, which residential prosumers invest in, has been added to the 0.9 GW of PV capacity from the ELIN model under the label “solar”.
Optimal Residential PV-Battery Capacity and Household-Optimal PV-Battery System Dispatch
The household-optimal PV-battery capacity utilized in the modeling for the System case and Household case have been identified with the iterative modeling approach developed by Goop et al. (submitted). Goop and colleagues combined the EPOD dispatch model with a household annual electricity cost-minimizing model that includes household cost-optimal investments in residential PV-battery systems. The EPOD dispatch model minimizes total system running costs of electricity generation, expressed as:
where represents the running costs of all plants p during time-step t, gcp, t is the generation of plant p in time-step t, and is the sum of the part-load and start-up costs for plant p in time-step t. The set I describes all regions in the model, Pi is the set of aggregated power plants in region i, and T is the set of time-steps.
The household investment model minimizes the total electricity costs for all households, given as:
where N ⊂ I is the set of all regions containing household load profiles and Hi is the set of all households in the region i. and are the prices for buying electricity from the grid and selling electricity to the grid, respectively, for every region i and time-step t, which are related to the marginal prices of electricity in the EPOD dispatch model. The variables and give the amount of electricity bought from and sold to the grid in each region i, by each household h and in every time-step t. bi, h, fi, h, and ui, h are the sizes of batteries, PV-panels and inverters invested in by each household h in every region i. kbat, kPV, and kinv are the respective costs for batteries, PV-panels and inverters and abat, aPV, and ainv are the annuity factors for batteries, PV-panels and inverters, respectively.
In the household cost-optimization model, hourly wholesale prices plus energy tax, grid fees, and VAT are assumed for electricity bought by the prosumers, while electricity prices and a reimbursement are considered for electricity sold by the prosumers. Table 2 gives the assumed investment costs and systems lifetimes, as applied in Goop et al. (submitted).
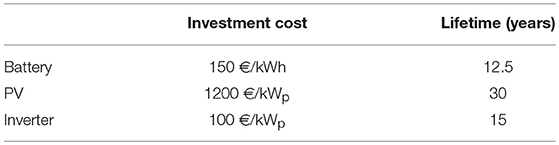
Table 2. Costs and lifetime assumptions for residential PV-battery system investments, as obtained from Goop et al. (submitted).
Running the two models iteratively allows for the representation of the impact of a change in residential load curves, i.e., the feedback effects from increased employment of PV-battery systems, on the electricity system dispatch and, thereby, on the marginal costs. Consequently, a change in the marginal cost of electricity, which is used as a price curve for the household cost-optimization model affects the profitability of residential PV-battery systems and, thereby, influences PV-battery sizes.
Table 3 shows the results for residential PV and battery capacities after convergence through several iterations between the EPOD and the household optimization model, for the Green Policy and the Climate Market scenarios. While in the Green Policy scenario prosumer PV-battery installations in the SE2 region result in higher absolute values it should be noted that the residential electricity demand in this region (17.8 TWh) is considerably higher than that in region SE1 (3.8 TWh). The share of annual PV-generated electricity within the annual aggregated residential electricity demand is higher in region SE1 (0.537) that in region SE2 (0.364). In the Climate Market scenario, optimal PV capacities result in values similar to those in the Green Policy scenario, whereas battery sizes are considerably smaller in the Climate Market scenario. This suggests that the investments in batteries made by residential electricity customers are smaller in a future that has less-fluctuating prices and, thereby, a lower potential to exploit the batteries in order to sell electricity during high-price hours (as seen mainly during the winter in the Green Policy scenario). For a more detailed discussion on this topic, see the paper of Goop et al. (submitted) or Goop (2017).
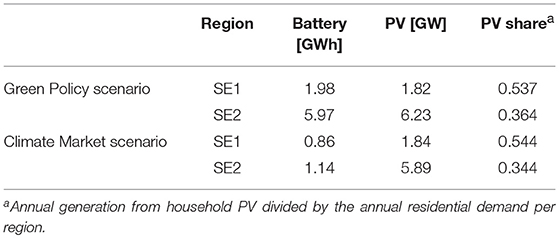
Table 3. Sizes of PV and battery installations obtained from Goop et al. (submitted) and utilized for the modeling in both the System case and Household case, as given for the Green Policy and Climate Market scenarios.
Extended EPOD Modeling for System-Optimal Dispatch of PV-Battery Systems
The EPOD model, described in Odenberger et al. (2009) and Göransson et al. (2014) is a linear dispatch model that has the objective to minimize the total costs for electricity generation as written in Equation (1) above and includes thermal power plant cycling. For the present work, the model is run with an hourly time resolution for 25 regions in Northern Europe.
The modeling additions developed to analyze the System case in the present work allow investigation of the operation of batteries as part of the total system dispatch. The amount of energy stored in the battery at every time-step BatSti, tis:
where BatChi, trepresents the amount of electricity charged to the battery at every hour t in every region i, BatDisChi, t is the amount of electricity discharged from the battery, and BatEff is the roundtrip efficiency of 95%.
The maximum capacity is defined as the aggregate for each modeled region i in the dispatch model. We model the usable part of the battery capacity, which is also reflected in the battery cost assumptions. The amount of stored energy has to be lower than or equal to this maximum at all times.
The maximum charge and discharge per hour have to be lower than or equal to the maximum capacity per region.
A nodal balance ensures that the demand in each region is met:
where Demandi, t is the demand in each region i at hour t, and is the quantity of electricity traded between regions i and j at hour t.
We assume perfect foresight for the load profiles, weather conditions, and electricity prices. The solar generation output is modeled based on the geographic location (Norwood et al., 2014).
Results
Sections Battery operational patterns from the system and household perspectives, Prosumers' impacts on system operational costs and system dispatch, Seasonal differences in battery charge and discharge present the results obtained for the Green Policy electricity generation scenario when investigating residential PV-battery systems in a future with a high share of intermittent renewables; for the comparative analysis described in section Less-Fluctuating Marginal Price Curve, the results for both the Green Policy scenario and the Climate Market scenario are considered.
Battery Operational Patterns From the System and Household Perspectives
Figure 4 shows the relationship between battery operational patterns in the System and Household cases, the residential electricity demand, and PV generation as well as the marginal prices of electricity for the Swedish price area SE1 in an hourly time resolution for 2 summer weeks. Figure 4A shows the diurnal patterns of household load and residential PV-electricity generation. It can be seen that during the summer months the PV production peaks are generally higher than the residential demand. Figure 4B shows the charge and discharge of the battery systems for the System and the Household cases. A diurnal operational pattern, which is in line with the PV production, is seen for the case with household optimal utilization of batteries. As a result of this charge and discharge pattern, the diurnal shape related to the solar electricity generation is also visible in Figure 4C, where the energy stored at each time-step is plotted. It is clear that in the Household case, the available batteries are utilized for storing PV-generated electricity over several hours, making it available for in-house usage rather than selling it to an energy retailer. The reason for favoring self-consumption over the selling of PV-generated electricity in the Household case is grid parity, i.e., the price difference between buying and selling electricity from and to an electricity retailer. For the Household case, VAT and grid fees have to be paid on top of the hourly varying wholesale prices for all electricity bought, while only the hourly electricity market price plus a low compensatory payment are received for any electricity sold. The benefit derived from being able to self-consume a large part of the generated PV electricity is a major driving force for battery operation from the household perspective.
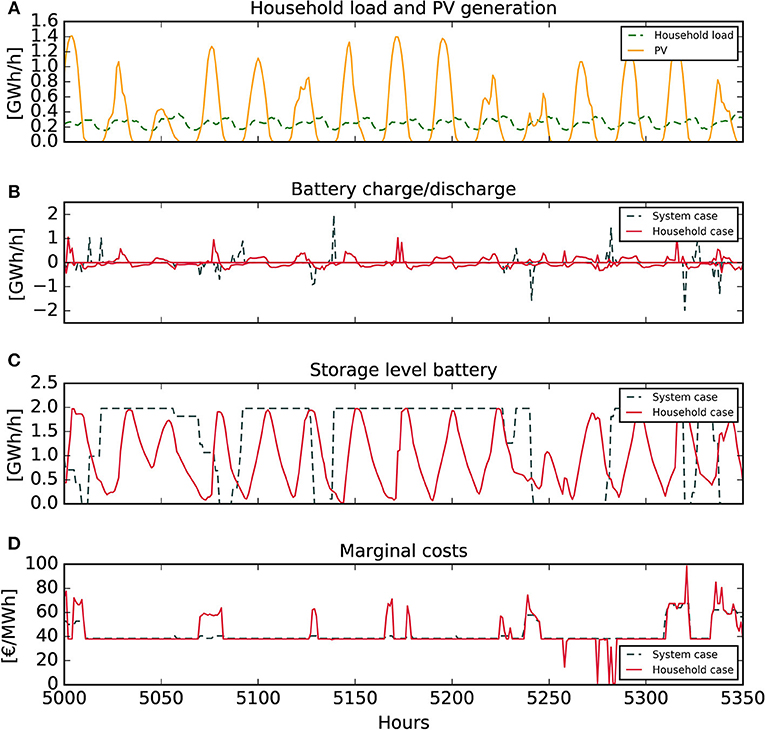
Figure 4. (A) Household load and PV generation for two summer weeks in Year 2032, (B) the corresponding battery charge (on the positive y-axis) and discharge (negative y-axis) patterns, (C) the amount of electricity stored in the batteries, and (D) the marginal costs on an hourly resolution for 2 summer weeks, all as obtained from the modeling comparing the System and the Household cases in region SE1 for the Green Policy scenario.
In the System case, batteries are included in the electricity system dispatch, thereby allowing for the charging and storage of electricity during hours of low marginal cost of electricity and for the avoidance of start-up costs and high marginal cost generation during other hours (further discussed in section Prosumers' Impacts on System Operational Costs and System Dispatch). The system-optimal charging and discharging patterns shown in Figure 4B are much less regular than for the household-optimal operation of batteries, leading to longer periods during which there is a fully charged or discharged battery, as shown in Figure 4C. Comparing this to Figure 4D, which shows the marginal cost curves for the System and Household cases, it is evident that some discharge peaks in the System case coincide with hours in which the marginal costs are lower in the System case than in the Household case. This shows that one effect of cost-optimal operation of battery systems from a system perspective are periods of lowered marginal costs, compared to the case in which households decide the charge and discharge pattern. Household PV-battery operation with current incentives to self-consume in-house generated PV-electricity therefore does not facilitate system balance. A new tariff system or policy that makes it more profitable for households to adapt their electricity buying and selling pattern to hourly variations in the electricity price as compared to self-consume as much electricity as possible, could make the household PV-battery dispatch better resemble the system-optimal dispatch. The pattern shown in Figure 4 is similar for the other weeks in the year investigated.
Figure 5 gives the distributions of charge and discharge events comparing the System and Household cases in regions SE1 and SE2. In both regions, low-level (in GWh/GWhinstalled) charge and discharge events occur significantly more frequently in the Household case, which is driven by a surplus PV production that is lower than the battery capacity. In the System case, however, the batteries are more frequently charged and discharged closer to the rated power, to avoid cycling costs, generation or import during high-price hours or the curtailment of electricity with low running costs. The explanation for the distribution of charge and discharge events in the Household case can again be found in the diurnal pattern of energy shifting from the household perspective. While PV production peaks at noon, residential electricity demand is highest in the morning and evening hours. For the purpose of maximizing the household self-consumption of PV-generated electricity, charging small amounts of excess PV generation to the battery during the day for several consecutive hours, followed by several hours of discharging so as to meet the increased demand in the evening hours is the most beneficial strategy for the household. The exception to this pattern is those time periods, mainly during winter, during which the price variations are sufficiently large to make it profitable for the household to buy and store electricity during low-price hours, with the aim of using or selling the electricity during high-priced hours. There is no exogenous limitation to this trading pattern in the modeled cases, although the incentive for arbitrage is indirectly dampened by the roundtrip efficiency of the batteries.
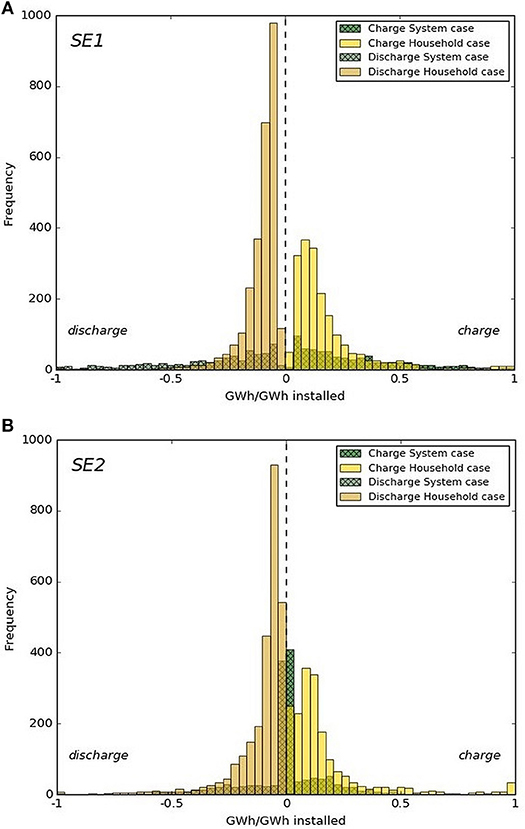
Figure 5. Frequencies of charge and discharge events for the Household and System cases in southern Swedish regions SE1 (A) and SE2 (B), as obtained from the modeling of the Green Policy scenario. (For the sake of clarity, charge/discharge events that are very low, i.e., in the range of −0.03 to 0.03 GWh/GWhinstalled, have been omitted).
In region SE2 (Figure 5B), a larger battery capacity of almost 6 GWh/h (compared to about 2 GWh/h in SE1) is installed, which also corresponds to larger investments in PV. Since the capacities of the battery and PV installations are matched to the households' electricity demand (see section Methodology and Model Description), the pattern of utilization of PV-battery systems in the Household case for region SE1 is similar to that for region SE2. Interestingly, the battery dispatch from a system perspective (the System case) differs slightly to that for region SE1. In SE2, the larger total battery capacity in absolute terms that is available leads to more occasions on which only parts of the battery storage capacity is utilized within a single hour, so as to avoid, for instance, expensive peaking units. This indicates that when the battery capacity is comparable or higher than the capacity that is frequently supplied by balancing and peaking units, the marginal system benefits of further increasing the battery capacity are diminished. It should be noted that the present study focuses on the effects of household-driven investments in batteries; to draw conclusions regarding suitable storage sizes from the system perspective will require further analyses.
The number of hours of battery charging and discharging is lower in the System case than in the Household case. Figure 6 shows the storage level duration curve for regions SE1 and SE2. For both Swedish regions, more hours of fully charged or discharged batteries occur in the System case, while the curve for the Household case is flatter, which means that there are more hours with partly charged batteries. Summed over the year that is modeled, the batteries are charged 50% more in terms of energy in the Household case than in the System case. This difference in charging means that there is greater utilization of batteries when they are operated according to the household-optimal strategy.
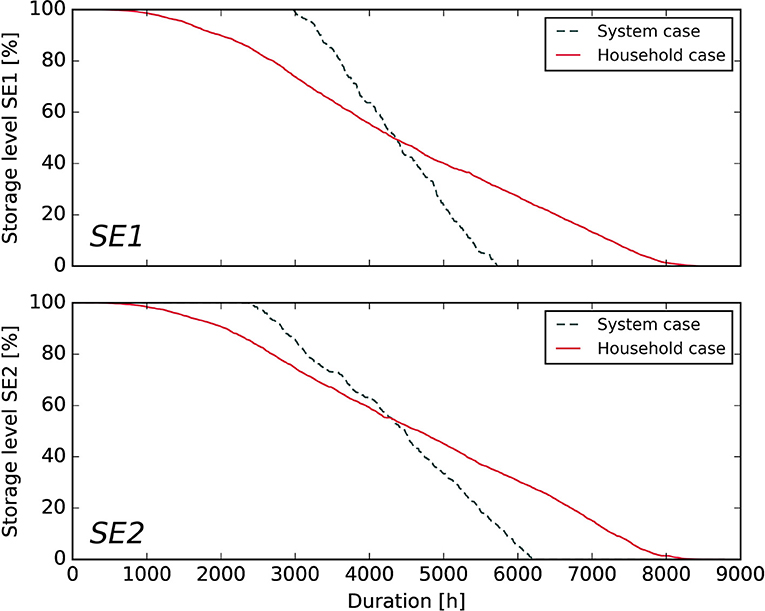
Figure 6. Duration curve for the battery storage levels in the price areas SE1 and SE2 for the System and Household cases, as obtained from the modeling of the Green Policy scenario in Year 2032.
Prosumers' Impacts on System Operational Costs and System Dispatch
Table 4 summarizes the cost differences between the System and Household cases, expressed as the average running and start-up costs for the SE1 and SE2 price areas. In SE1 and SE2, the average running costs can be reduced by 2.3% and almost 4%, respectively when batteries are operated from a system-optimal perspective rather than according to household-optimal battery scheduling. The start-up costs in regions SE1 and SE2 can be reduced by 30.6 and 22.2%, respectively, using a system-optimal compared to a household-optimal battery operation. As trade is included in the modeling set-up, regions bordering on SE1 and SE2 are affected by the introduction of PV-battery systems. Thus, additional savings, corresponding to 30% of the regional savings in SE1 and SE2, can be achieved in the remainder of the northern European regions that are modeled. However, it should be borne in mind that residential PV-battery systems are introduced only in the two Swedish regions SE1 and SE2. Figure 7 shows the annual level of generation in the System case minus the level of generation in the Household case, for regions SE1 and SE2 in Year 2032. It can be concluded that the largest impact on annual generation from the household-optimal scheduling of PV-battery systems (as compared to system-optimal operation) arises from the reduction of gas-peak generation in SE2 in the System case. At the same time, the import of electricity into SE2 is increased compared to the Household case, which suggests that during hours of less-costly generation in neighboring regions, electricity is imported and stored in batteries so as to replace expensive peaking generation at some other forward point in time.
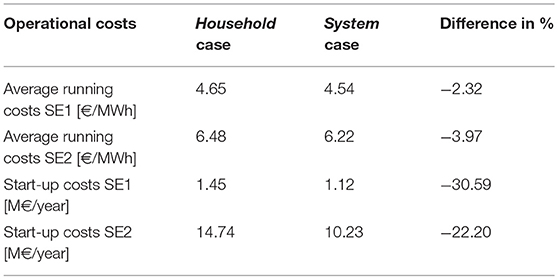
Table 4. Cost comparison of the System and Household cases for Swedish operational costs, as obtained from modeling of the Green Policy scenario.
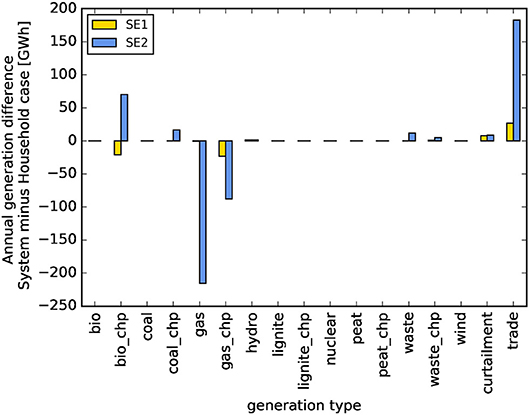
Figure 7. Annual differences in the levels of generation from the various technologies between the System case and Household case for regions SE1 and SE2 for the Green Policy scenario, as derived from the modeling in this work. The results are given as the level of annual generation in the System case minus the level of annual generation in the Household case for Year 2032. Trade is indicated as a positive value for imports to the region and as a negative value for exports from the region, yielding a net increase in imports when comparing the System and Household cases in the figure.
Figure 8 shows the dispatch levels in the System and Household cases with hourly time resolution for two summer weeks in the SE2 region. In addition to the hourly generation mix, the figure includes exports, curtailment of electricity, and charge of the battery systems (on the negative y-axis) as well as battery discharge and the import of electricity (on the positive y-axis). With the red bolded line representing the load curve in the region, it becomes evident how the charging of batteries correlates with periods of high PV generation as well as with hours with high wind generation and, sometimes, with hours with high levels of imports to the region. The discharge of batteries acts as a “gap-filling” measure, i.e., as a complement to the other sources of electricity supply to meet the load. While no regular pattern can be discerned for charging in the System case in Figure 8A, for the Household case in Figure 8B, charging and discharging mainly follow a diurnal trend that matches the PV generation (discussed in section Battery Operational Patterns from the System and Household Perspectives).
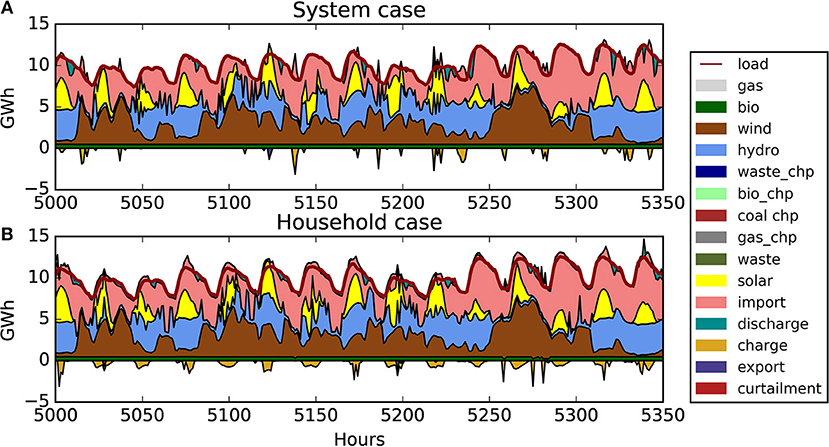
Figure 8. Dispatch for system and household optimization in SE2 for two summer weeks in Year 2032, as derived from the modeling in this work, for (A) the System case and (B) the Household case in the Green Policy scenario.
Seasonal Differences in Battery Charge and Discharge
Irrespective of the case analyzed, the modeling results indicate a seasonal difference in the utilization of PV-battery systems. Figure 9 shows the difference in average seasonal charging of batteries per hour between the System and Household cases. In the System case, for both regions, the batteries are on average charged more per hour during winter-time than during summer-time. In contrast, in the Household case, the batteries are on average charged more per hour during summer than during winter, although the inter-seasonal difference is smaller than for the System case. Overall, the batteries are charged more often during both seasons in the Household case than in the System case.
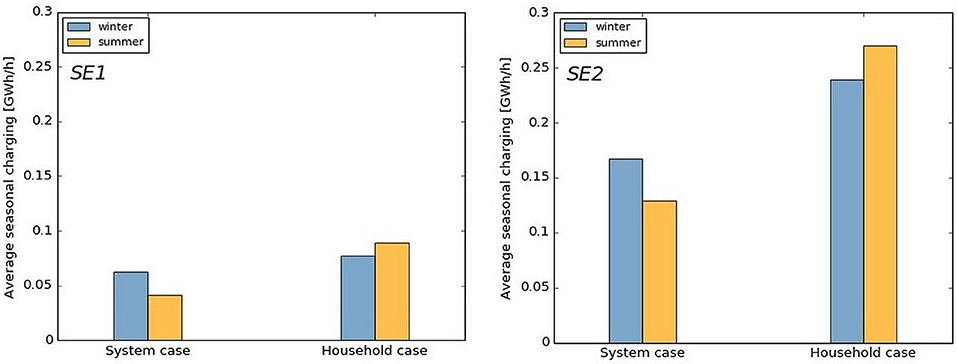
Figure 9. Average seasonal charging per hour for the System and Household cases in regions SE1 and SE2, as obtained from the modeling of the Green Policy scenario in Year 2032.
The differences in operation of batteries between summer and winter as well as between the System case and Household case point to the potential of exerting shared control over residential PV-battery systems, i.e., controlling from the system perspective during the winter, when the batteries are used more often during the year in the System case, and controlling from the household perspective during summer, when the batteries are utilized more often in the Household case. This control could be implemented via regulations or incentives for households with batteries to modulate battery operation toward solving system issues, rather than mainly for storing self-produced PV electricity.
The Seasonal Split case shown in Table 1 has been analyzed to understand the implications of shared control over PV-battery systems. In the Seasonal Split case, the electricity system operational costs can be reduced when battery dispatch is included in the total system optimization during winter hours, instead of applying the household optimal battery dispatch over the whole year, as in the Household case. In the two Swedish regions SE1 and SE2, the start-up costs and running costs can be reduced by a total of almost 30 M€ for the modeled year in the Seasonal Split case compared with the Household case. Prosumer households, on the other side, experience a reduced benefit from their PV-battery systems when they are not able to control the battery dispatch over the whole year. In regions SE1 and SE2, the benefit derived from PV-battery systems drops by 73 € on average per household in the Seasonal Split case, as compared to the Household case. This amounts to a total of 123 M€/year for the aggregate of all modeled Swedish households. Thus, from a Swedish perspective, the total monetary benefit that residential customers can receive from operating their PV-battery systems during winter is greater than that attainable from operating the storage system from a system perspective. However, it should be kept in mind that additional system values such as ancillary services, which could be provided by battery systems, have not been considered. Furthermore, the composition of the Nordic electricity generation system, with a large proportion of reservoir hydropower being available for variation management, can be assumed to reduce the value of batteries to the system investigated in this study, as compared to a situation in which other European regions with different electricity generation mixes were investigated. On the household side, the benefit of utilizing batteries to sell during hours of high electricity prices during winter-time is likely to be overestimated, given that perfect foresight on electricity prices was adopted in the modeling and the fact that in the modeling all the households react simultaneously to changes in electricity prices.
Less-Fluctuating Marginal Price Curve
While all the previous results have been taken from the Green Policy scenario, the patterns of PV-battery system utilization in the Household and System cases have also been investigated for the Climate Market scenario (see Table 1 and section Optimal Residential PV-Battery Capacity and Household-Optimal PV-Battery System Dispatch). Figure 10 compares the frequencies of charge and discharge events in region SE1 for the two different scenarios, Green Policy and Climate Market as well as for the two cases, System and Household. It can be seen that for the Household case, the Climate Market (Figure 10A) and Green Policy (Figure 10B) scenarios have similar distributions of charge and discharge events. With the flatter electricity price curve in the Climate Market scenario, the only driving force for battery operation from the household perspective is the matching of PV-generated electricity to the load curve, which results in a diurnal pattern of small charge events during daytime, to facilitate discharge during the late-afternoon and evening hours. For the System case in the Climate Market scenario, Figure 10C reveals that batteries are less useful in terms of reducing the total system operational costs in a future with relatively stable marginal prices, as compared to a scenario with higher variability of the marginal price curve, as in the Green Policy scenario (Figure 10D), in which the batteries are charged and discharged more often from a system perspective.
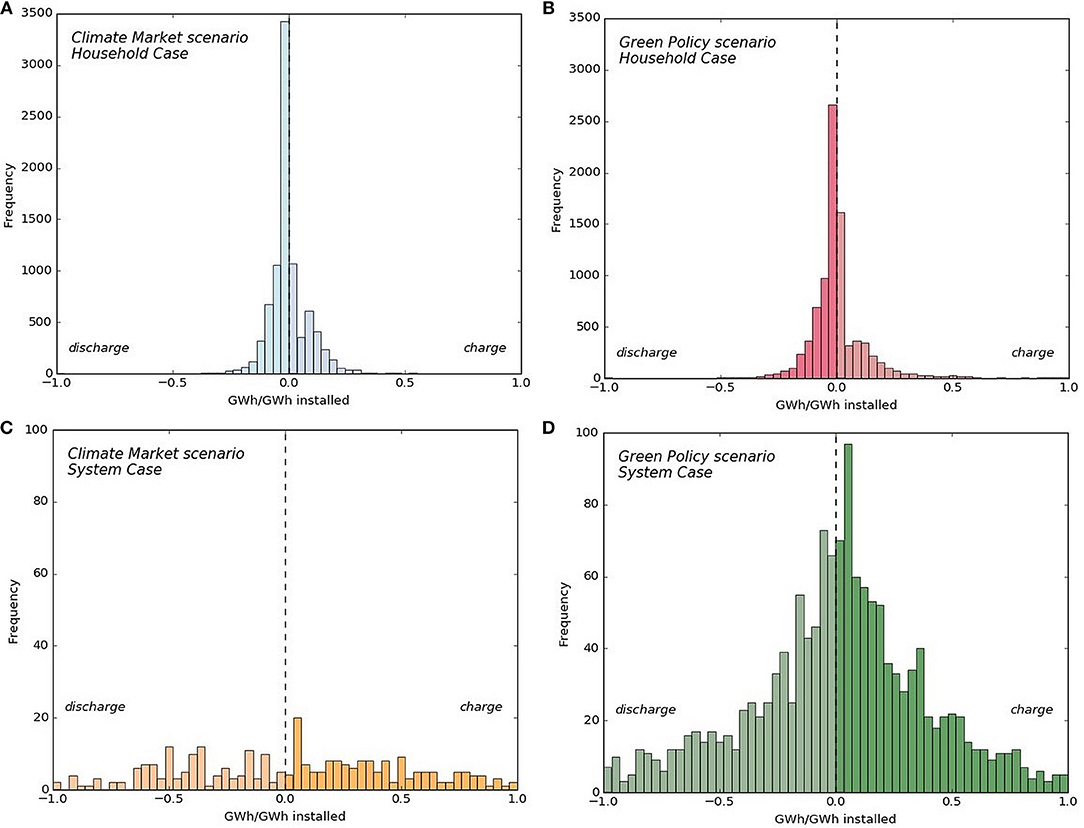
Figure 10. Frequencies of charge and discharge events for region SE1 in the Climate Market scenario (flatter price curve) for (A) the Household case and (C) the System case, and in the Green Policy scenario (higher variability of the price curve) for (B) the Household case, and (D) the System case. For better readability the Household cases in (A,B) are plotted with a different scale on the y-axis than the System cases in (C,D).
Discussion
The present work models cost optimization for prosumers who are equipped with PV-battery systems. The applied method has perfect foresight and includes no restrictions on the maximum amounts of electricity consumed from or fed into the grid by prosumer households in single time-steps. This possibility to perfectly plan the battery charging and discharging together with the assumption of distribution grids free of congestion, is likely to overestimate the benefit of batteries in households both in the System and Household cases. Yet, the principal differences in the results between the two cases are likely to also be valid in a real case. In the Household case, the optimal charge and discharge patterns of the household battery systems in response to electricity price variations could cause amplifications of peaks in the demand of electricity from the electricity grid. In the case of low electricity prices in the household cost-minimization, the modeling approach leads to a large share of all the households reacting by charging their batteries with low-price electricity. High prices for electricity under these model assumptions will result in many prosumers wanting to sell electricity. With all the prosumer households reacting simultaneously to the same electricity price variations, the applied method is likely to over-estimate the benefits accrued from battery utilization in order to sell during high-price hours. A simultaneous response to price signals from a high number of households is not desirable from the perspectives of the distribution grid and electricity supply system. With a large prosumer battery capacity in the system, it is preferable to include this capacity in the electricity market bidding process such that the battery charging and discharging is reflected in the electricity price with charging corresponding to production and discharging corresponding to increase in load. This would then reduce the electricity price difference between hours of charging and discharging experienced by the prosumers. However, the main driving force for household-optimal operation of PV-battery systems (Household case) is found to be the increasing self-consumption of in-house generated electricity and thus reduced electricity price variations have a relatively low impact on prosumer behavior. The present study does not consider the provision of ancillary services to the distribution grid, which has the potential to increase the value of battery systems. Including compensation for ancillary services could increase the prosumer benefit from PV-battery systems and could suggest additional incentives for adapting operational patterns.
For the representation of battery systems several simplifications have been applied in the modeling. With an hourly resolution in the dispatch and the household optimization model, it is assumed that batteries can be totally charged or discharged at a maximum rate of 1 h. Thus, impacts on battery performance from fast charge and discharge events or battery aging are not considered in the modeling. The results on battery dispatch in our modeling give a more regular daily charging and discharging cycle for the Household case as compared to the System case, whereas the latter case yields a more seldom utilization of the battery systems. Battery degradation as modeled with a statistical battery degradation cost model for the distributed utilization of Li-ion batteries in the Italian power system by Mureddu et al. (2018), or battery aging as applied by Gitizadeh and Fakharzadegan (2014) can provide further understanding of how the operation and dispatch affects the lifetime of battery systems. A comparison of battery degradation and aging in the Household case relative the System case would be an interesting topic for future work. However, since the aim of this study is to estimate effects on the power flow profiles to and from households given two different operational regimes, in the System and the Household cases, the simplified representation of batteries applied in this work has been judged to be sufficient.
The setup of the electricity tariff structure has a strong impact on economic incentives for residential prosumers to engage in PV-battery system operation and investments, which has to be kept in mind when interpreting the findings of the present study. The relationship between grid fee designs and residential prosumers is 2-fold. On the one hand, the grid fee has to be designed by the distribution system operator (DSO), so as to cover the expenses associated with operating and maintaining the distribution grid. On the other hand, the design of the grid fee influences the prosumer response to varying electricity prices in terms of the timing and amounts of electricity they decide to buy or sell, as discussed by Jargstorf et al. (2015). This buying and selling pattern in turn alters prosumer utilization of the local grid, as discussed by Kaschub et al. (2016). In general, a distinction can be made between energy-based and capacity-based pricing systems; in the former, grid fees are paid dependent upon how much electricity is consumed from the grid, whereas in the latter, the fees paid depend on the capacity peak during a certain time period. Energy-based tariffs, as addressed in the present work, provide incentives to prosumers to self-consume PV-generated electricity, as shown by the results of this study. Such self-consumption of PV-generated electricity reduces the base load in the distribution grid, thereby reducing the revenues for a DSO, while failing to eliminate peaks of consumption and production. This effect does not necessarily reduce the stress placed on the grid or the costs required to maintain a stable grid. To cover their costs, DSOs might decide to redistribute the grid fees to customers who do not have micro-generation or storage systems. In an earlier study, Jargstorf et al. (2013) argued that for residential customers with micro-generation and storage systems, a tariff that combines an energy-related part and a part based on the peak load would give the most reasonable results in terms of how the tariff reflects the cost for the distribution grid. Goop et al. (submitted) have shown that the incentive to invest in residential battery capacity is lower in a case with fixed grid costs than in a case with energy-based grid fees. The profitability of residential PV-battery systems is boosted by the fact that there is no energy tax for electricity that is self-consumed within the household. Further insights into how different tariff systems and support schemes can lead to residential PV-battery system utilization that differs from the operation as optimal from a total electricity generation system perspective, will likely be gained from future investigations.
In a system different to the Nordic system in for example the amount of non-dispatchable electricity generation or the availability of reservoir hydro power, both the household- as well as system-optimal dispatch of PV-battery systems can be expected to differ from the results of this work. In a system with less possibility for variation management by reservoir hydro power, the value of batteries in the System case could be expected to be higher. The dispatch of batteries in the Household case is greatly influenced by the incentive to utilize in-house generated PV electricity. Differences in price signals sent to the household prosumers in a system with larger fluctuations in electricity generation and fewer options for variation management could on the other hand influence the profitability of household arbitrage trading, i.e., there will be a stronger value for purchasing electricity in low-cost hours and selling at higher priced hours. In a future electricity system that is to a larger extent based on variable renewables, different alternatives to manage these variations as well as the costs for different types of variation management should be explored and analyzed. Flexibilities in the electricity demand curve that can be provided by prosumers equipped with distributed generation and storage systems are a possibility to meet these fluctuations in the power system. Local balancing of distributed generation and demand also has the potential to decrease power system congestion.
Conclusions
The charge and discharge patterns of residential PV-battery systems are modeled from the perspectives of the household annual electricity cost optimization (Household case) and the overall system (System case) for two price areas in southern Sweden and under future scenarios that entail extensive reductions in CO2 emissions from the European electricity generation system. The modeling results show that the main driving force for battery dispatch in the Household case is the incentive to avoid the electricity taxes and grid fees currently imposed on purchased electricity, for those situations where self-consumption of in-house generated solar electricity can be increased with the help of battery systems. Therefore, household optimization of battery dispatch involves many hours during which small amounts of electricity are being charged or discharged to or from the battery, in order to match diurnal solar generation and household load patterns. The value of battery operation in the System case lies in the avoidance of power plant start-ups and curtailment of non-dispatchable power generation as well as in the shifting of low-cost electricity supply so as to avoid expensive peak unit generation. We show that the operation of batteries in the System case results in less frequent battery charge and discharge, but utilization of the larger parts of the battery capacity within single time-steps. When included in the household cost optimization, battery systems charge 50% more energy annually compared to a total system-optimized charging strategy. Less volatile marginal prices of electricity decrease the value of batteries to the electricity system, but have no significant effect on the PV-battery system operation when controlled by prosumer households.
In the Household case, battery dispatch is dominated by the diurnal patterns of household electricity demand and PV-generation. The incentive to self-consume PV generated electricity makes prosumer households utilize their batteries more during summer hours. Yet, even in winter, when the control of the battery dispatch is most valuable to the electricity system, current incentives of avoided taxes and fees on self-generated electricity in prosumer households makes the control over battery system dispatch more valuable to households than the electricity system. As long as the economic gain from not paying taxes and fees on self-generated electricity is larger for the prosumer than the monetary benefit from adapting the battery dispatch to hourly price signals, households are unlikely to contribute to balancing intermittent electricity generation in the electricity system. Household-controlled charging and discharging patterns of battery systems leads to an increased utilization of peak power plants in the electricity system. With PV-battery systems dispatched according to the system-optimal perspective, i.e., according to the benefit of the electricity system instead of individual households, average running costs are reduced by around 4% in the Swedish region SE2 and ~2.3% in region SE1. Design of new policies or tariff systems that reduce the incentive to utilize residential battery systems for self-consumption of PV-electricity generated by the household could increase households' response to hourly varying electricity prices and thereby make their battery dispatch pattern more similar to the system-optimal dispatch. Yet, such a tariff system that removes the monetary benefit of household self-consumption will decrease the profitability for households to invest in PV-battery systems, leading to lower overall PV and battery capacity.
Author Contributions
VH is the corresponding author. MO, LG, and FJ contributed in the analysis and editing, and supervised the work.
Funding
This work was supported by the Swedish Energy Agency within the program titled Energy systems.
Conflict of Interest Statement
The authors declare that the research was conducted in the absence of any commercial or financial relationships that could be construed as a potential conflict of interest.
Supplementary Material
The Supplementary Material for this article can be found online at: https://www.frontiersin.org/articles/10.3389/fenrg.2018.00145/full#supplementary-material
References
Agnew, S., and Dargusch, P. (2015). Effect of residential solar and storage on centralized electricity supply systems. Nat. Clim. Change 5, 315–318. doi: 10.1038/nclimate2523
Breen, M. (2013). The Future of Energy Storage Is Behind the Meter. Available online at: https://www.greentechmedia.com/articles/read/the-future-of-energy-storage-is-behind-the-meter (Accessed November 11, 2016).
Divya, K. C., and Østergaard, J. (2009). Battery energy storage technology for power systems—An overview. Electr. Power Syst. Res. 79, 511–520. doi: 10.1016/j.epsr.2008.09.017
Elsland, R., Boßmann, T., Hartel, R., Gnann, T., Genoese, M., and Wietschel, M. (2013). “Analysis of structural changes of the load profiles of the german residential sector due to decentralized electricity generation and e-mobility,” in Sustainability in Energy and Buildings (Heidelberg: Springer), 71–84. doi: 10.1007/978-3-642-36645-1_7
Gitizadeh, M., and Fakharzadegan, H. (2014). Battery capacity determination with respect to optimized energy dispatch schedule in grid-connected photovoltaic (PV) systems. Energy 65, 665–674. doi: 10.1016/j.energy.2013.12.018
Goop, J. (2017). Modelling Interactions Between Distributed Energy Technologies and the Centralised Electricity Supply System. Available online at: https://research.chalmers.se/publication/251520 (Accessed June 13, 2018).
Göransson, L., Goop, J., Unger, T., Odenberger, M., and Johnsson, F. (2014). Linkages between demand-side management and congestion in the European electricity transmission system. Energy 69, 860–872. doi: 10.1016/j.energy.2014.03.083
Hoppmann, J., Volland, J., Schmidt, T. S., and Hoffmann, V. H. (2014). The economic viability of battery storage for residential solar photovoltaic systems–A review and a simulation model. Renew. Sustain. Energy Rev. 39, 1101–1118. doi: 10.1016/j.rser.2014.07.068
IEA-RETD (2014). Residental Prosumers–Drivers and Policy Options (RE-Prosumers). Available online at: http://iea-retd.org/wp-content/uploads/2014/09/RE-PROSUMERS_IEA-RETD_2014.pdf (Accessed July 7, 2016).
Jargstorf, J., De Jonghe, C., and Belmans, R. (2015). Assessing the reflectivity of residential grid tariffs for a user reaction through photovoltaics and battery storage. Sustain. Energy Grids Netw. 1, 85–98. doi: 10.1016/j.segan.2015.01.003
Jargstorf, J., Kessels, K., and Belmans, R. (2013). “Capacity-based grid fees for residential customers,” in 2013 10th International Conference on the European Energy Market (EEM) (Stockholm), 1–8. doi: 10.1109/EEM.2013.6607294
Kaschub, T., Jochem, P., and Fichtner, W. (2016). Solar energy storage in German households: profitability, load changes and flexibility. Energy Policy 98, 520–532. doi: 10.1016/j.enpol.2016.09.017
Leadbetter, J., and Swan, L. (2012). Battery storage system for residential electricity peak demand shaving. Energy Build. 55, 685–692. doi: 10.1016/j.enbuild.2012.09.035
Linssen, J., Stenzel, P., and Fleer, J. (2015). Techno-economic analysis of photovoltaic battery systems and the influence of different consumer load profiles. Appl. Energy 185, 2019–2025. doi: 10.1016/j.apenergy.2015.11.088
Metz, D., and Saraiva, J. T. (2015). “Evaluation of the impact of storage systems on grid electricity demand in the German context,” in 2015 12th International Conference on the European Energy Market (EEM) (Lisbon), 1–5. doi: 10.1109/EEM.2015.7216604
Moshövel, J., Kairies, K.-P., Magnor, D., Leuthold, M., Bost, M., Gährs, S., et al. (2015). Analysis of the maximal possible grid relief from PV-peak-power impacts by using storage systems for increased self-consumption. Appl. Energy 137, 567–575. doi: 10.1016/j.apenergy.2014.07.021
Mulder, G., Six, D., Claessens, B., Broes, T., Omar, N., and Mierlo, J. V. (2013). The dimensioning of PV-battery systems depending on the incentive and selling price conditions. Appl. Energy 111, 1126–1135. doi: 10.1016/j.apenergy.2013.03.059
Mureddu, M., Facchini, A., and Damiano, A. (2018). A statistical approach for modeling the aging effects in li-ion energy storage systems. IEEE Access 6, 42196–42206. doi: 10.1109/ACCESS.2018.2859817
Nair, N.-K. C., and Garimella, N. (2010). Battery energy storage systems: assessment for small-scale renewable energy integration. Energy Build. 42, 2124–2130. doi: 10.1016/j.enbuild.2010.07.002
Norwood, Z., Nyholm, E., Otanicar, T., and Johnsson, F. (2014). A Geospatial comparison of distributed solar heat and power in europe and the US. PLoS ONE 9:e112442. doi: 10.1371/journal.pone.0112442
Nottrott, A., Kleissl, J, and Washom, B. (2013). Washom energy dispatch schedule optimization and cost benefit analysis for grid-connected, photovoltaic-battery storage systems. Renew. Energy 55, 230–240. doi: 10.1016/j.renene.2012.12.036
Nyholm, E., Goop, J., Odenberger, M., and Johnsson, F. (2016). Solar photovoltaic-battery systems in Swedish households–self-consumption and self-sufficiency. Appl. Energy 183, 148–159. doi: 10.1016/j.apenergy.2016.08.172
Nykamp, S., Bosman, M. G. C., Molderink, A., Hurink, J. L., and Smit, G. J. M. (2013). Value of storage in distribution grids #x2014;competition or cooperation of stakeholders? IEEE Trans. Smart Grid 4, 1361–1370. doi: 10.1109/TSG.2013.2254730
Nykvist, B., and Nilsson, M. (2015). Rapidly falling costs of battery packs for electric vehicles. Nat. Clim. Change 5, 329–332. doi: 10.1038/nclimate2564
Odenberger, M., Unger, T., and Johnsson, F. (2009). Pathways for the North European electricity supply. Energy Policy 37, 1660–1677. doi: 10.1016/j.enpol.2008.12.029
Purvins, A., Papaioannou, I. T., and Debarberis, L. (2013). Application of battery-based storage systems in household-demand smoothening in electricity-distribution grids. Energy Convers. Manag. 65, 272–284. doi: 10.1016/j.enconman.2012.07.018
Ratnam, E. L., Weller, S. R., and Kellett, C. M. (2015). An optimization-based approach to scheduling residential battery storage with solar PV: assessing customer benefit. Renew. Energy 75, 123–134. doi: 10.1016/j.renene.2014.09.008
Ratnam, E. L., Weller, S. R., and Kellett, C. M. (2016). Central versus localized optimization-based approaches to power management in distribution networks with residential battery storage. Int. J. Electr. Power Energy Syst. 80, 396–406. doi: 10.1016/j.ijepes.2016.01.048
Schleicher-Tappeser, R. (2012). How renewables will change electricity markets in the next five years. Energy Policy 48, 64–75. doi: 10.1016/j.enpol.2012.04.042
Schneider, M., Boras, P., Schaede, H., Quurck, L., and Rinderknecht, S. (2014). Effects of operational strategies on performance and costs of electric energy storage systems. Energy Procedia 46, 271–280. doi: 10.1016/j.egypro.2014.01.182
Shivashankar, S., Mekhilef, S., Mokhlis, H., and Karimi, M. (2016). Mitigating methods of power fluctuation of photovoltaic (PV) sources – A review. Renew. Sustain. Energy Rev. 59, 1170–1184. doi: 10.1016/j.rser.2016.01.059
Tant, J., Geth, F., Six, D., Tant, P., and Driesen, J. (2013). Multiobjective battery storage to improve pv integration in residential distribution grids. IEEE Trans. Sustain. Energy 4, 182–191. doi: 10.1109/TSTE.2012.2211387
Unger, T., Odenberger, M., and Johnsson, F. (2014). “Four scenarios for the European electricity generation,” in European Energy Pathways, Towards a Sustainable European Electricity System (Chalmers University of Technology, Department of Energy and Environment), 131–142. Available online at: http://www.energy-pathways.org/EEPsummary.htm (Accessed August 16, 2017).
Veldman, E., Gibescu, M., Slootweg, H. J. G., and Kling, W. L. (2013). Scenario-based modelling of future residential electricity demands and assessing their impact on distribution grids. Energy Policy 56, 233–247. doi: 10.1016/j.enpol.2012.12.078
Keywords: techno-economic modeling, residential PV-battery systems, storage system operation, electricity system dispatch modeling, household electricity cost optimization, prosumer load profiles
Citation: Heinisch V, Odenberger M, Göransson L and Johnsson F (2019) Prosumers in the Electricity System—Household vs. System Optimization of the Operation of Residential Photovoltaic Battery Systems. Front. Energy Res. 6:145. doi: 10.3389/fenrg.2018.00145
Received: 29 June 2018; Accepted: 17 December 2018;
Published: 10 January 2019.
Edited by:
Sgouris Sgouridis, Masdar Institute of Science and Technology, United Arab EmiratesReviewed by:
Haris Doukas, National Technical University of Athens, GreeceMatteo Chiesa, Masdar Institute of Science and Technology, United Arab Emirates
Copyright © 2019 Heinisch, Odenberger, Göransson and Johnsson. This is an open-access article distributed under the terms of the Creative Commons Attribution License (CC BY). The use, distribution or reproduction in other forums is permitted, provided the original author(s) and the copyright owner(s) are credited and that the original publication in this journal is cited, in accordance with accepted academic practice. No use, distribution or reproduction is permitted which does not comply with these terms.
*Correspondence: Verena Heinisch, dmVyZW5hLmhlaW5pc2NoQGNoYWxtZXJzLnNl