 Aparajita Datta
 Ramanan Krishnamoorti
- 1Hobby School of Public Affairs, University of Houston, Houston, TX, United States
- 2Department of Chemical and Biomolecular Engineering, University of Houston, Houston, TX, United States
- 3Department of Chemistry, University of Houston, Houston, TX, United States
As development in India paces up, energy demand is projected to increase; exerting pressure on the environment and presenting the added challenge of mitigating greenhouse gas emissions at an accelerated pace. Carbon capture, utilization, and sequestration (CCUS) is one of the mitigation strategies that India could adopt in this context, in the backdrop of an energy industry largely dominated by coal. Specifically, the north-eastern state of Assam in India is home to large point-sources of CO2 emissions like power, chemical or fertilizer plants, and has abundant sinks in the form of mature oil fields, coal beds, and saline aquifers. This work discusses the emission cuts that can be achieved by retrofitting existing point-sources with CCUS systems, and the techno-economic considerations thereof. We analyze how the levelized cost of electricity will change across three power plants, and how the economics of capture and avoidance costs at a chemical plant can revive its current financial situation, to present why there is an incentive for CCUS in Assam. The results show that for any CCUS implementation plant design, age and preparedness are factors that influence the economics and can lead to huge differentials. Since no new major expansions are planned in the region, investing in retrofitting will deliver immediate results toward achieving climate goals, while allowing time for the future deployment of renewable energy sources and energy storage solutions.
Introduction
Energy drives economic productivity, making it central to the development of any modern economy. Studies have indicated a high positive correlation between energy consumption and economic growth (Mallick, 2009; Faisal et al., 2017). Sustainable development has grown to be an important facet of this discussion. In 2015, The UN General Assembly adopted a committed goal on energy under its Sustainable Development Goals (SDGs) for its 2030 Agenda. Otherwise known as SDG7, it calls for ensuring access to affordable, reliable, sustainable, and modern energy for all (Bharali and Borgohain, 2013; United Nations, 2015, 2018). Concentrated efforts to achieve sustainable development through increased efficiency and by cutting down on emissions have commenced across all major sectors of energy consumption. Diversifying the energy portfolio to lower reliance on fossil fuels has driven energy policies around the world. However, sectors like transportation continue to depend heavily on energy dense liquid fossil fuels (Figure 1). Balancing economic growth, creating new opportunities for development, and making communities inclusive and equitable, while ensuring resilience against extreme weather events and climate change have thus become more pertinent than ever.
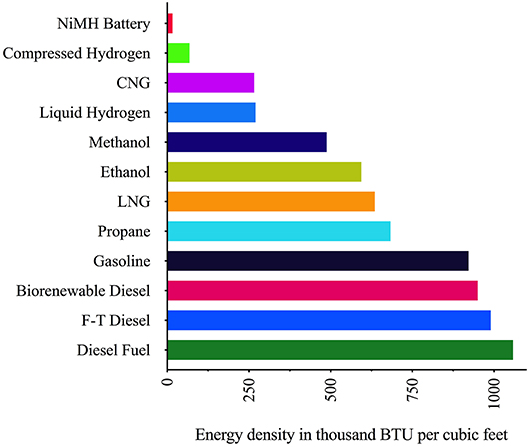
Figure 1. Energy density of different fuels and energy storage options. Data Source: U.S. Department of Energy (Eberhardt, 2002).
Amidst rising greenhouse gas emissions, world leaders met in Paris in 2015 to sign pledges and develop frameworks to limit the increase in global average temperatures to well-below 2°C above pre-industrial levels and to pursue efforts to limit the temperature increase even further to 1.5°C. To date, 181 nations have ratified the Paris Agreement (Bharali and Borgohain, 2013; International Energy Agency, 2016).
India has emerged as a leader in this direction and is taking steps toward achieving its clean energy and climate action commitments under the Paris Climate Agreement. India's commitments are (International Energy Agency, 2016):
• Increase the share of non-fossil energy to 40% in the energy mix by 2030;
• Reduce emissions by 30% by 2030 with 2005 levels as a baseline;
• Focus efforts toward enhancing investments in development programs in areas that are vulnerable to climate change and develop climate adaptation strategies that include health and disaster management;
• Create an additional carbon sink of 2.5 to 3 billion tons CO2-equivalent by increasing forest and tree cover by 2030.
To achieve these targets and address energy security, sustainable development, and climate change mitigation technologies need to be adopted at an accelerated pace. Carbon Capture, Utilization, and Sequestration (CCUS) in conjunction with fossil energy-based power plants is deemed as a key technology with significant potential to mitigate carbon while limiting climate change (Singh and Singh, 2016). CCUS is a complex set of processes that capture CO2 emissions from sources like coal-fired power plants and either uses it as raw material for products or as enabling fluids such as in enhanced oil recovery and stores it to control the release of emissions into the atmosphere (Carbon Capture and Storage Association, 2011b).
Experts and advisors from 40 countries recently approved the IPCC Special Report on Global Warming testifying to the scope and urgency of climate policy and carbon mitigation. It finds that limiting global warming would require rapid and dramatic reduction in anthropogenic emissions. Specifically, CO2 emissions would need to fall by 45% from 2010 levels by 2030 and reach a net zero by 2050. The report identifies India as particularly vulnerable to climate change owing to its huge susceptible demographic, ongoing unplanned development, geographical location, exposure to poverty, and dependence on agriculture and fishery sectors (IPCC, 2018).
The Government of India recently approved a policy framework to promote and incentivize enhanced/improved recovery of oil, gas, and unconventional hydrocarbon resources to boost domestic production. The framework aims to support infrastructure, logistics and fiscal incentives while strengthening environmental protection. The policy aims to envision the potential for enhanced recovery of every field in all contractual regimes, as well as nomination fields. An increase of 5% in recovery rate for original in-place volume for oil production and 3% for original in-place volume in gas production is expected to produce an additional 120 MMT of oil and 52 BCM of gas for the next 20 years (Press Information Bureau, 2018).
In the light of these developments, the focus of this paper is to emphasize on the urgency of deploying CCUS systems in India, especially in Assam, which is an excellent candidate for CO2-based EOR. By providing estimates for the storage potential exclusively for the Assam basin, and a techno-economic analysis for the Bongaigaon, Lakwa and Namrup power plants, as well as the Brahmaputra Valley Fertilizer Company (BVFCL) plant, the paper aims to establish foundational analysis and strengthen existing pre-feasibility research for CCUS in northeastern India, with the hope of engaging stakeholders toward urgent climate action, and to allow replication in other regions of India.
Population Growth and Energy Demand
India is in the early stages of a key transformation of its economy. According to an IMF report from 2017, India's economy is 3rd in the world (International Monetary Fund, 2017). It is home to about 1.4 billion people, equivalent to almost 18% of the world's population. It is a close second to China's population, which it is set to overtake by 2025. The pace of India's population growth is 15 million per year, which is currently the world's greatest numerical growth (Figure 2).
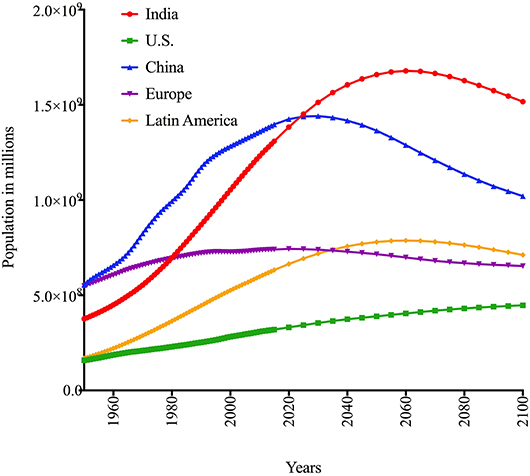
Figure 2. Population Trends: India and the World. Data Source: Department of Economic and Social Affairs, United Nations (United Nations, 2017).
This growing population is expected to contribute more than any other country to the global energy demand by 2040. India's increasing urbanization is also a driver of the rising energy demand. According to estimates, an additional 257 million people would be living in Indian cities by 2040. Amidst rapid development, these factors are expected to intensify the current energy deficit which has about 240 million people living without access to modern energy. This gap and the need to diversify its energy portfolio will likely guide the country's energy policy in the coming years. Primarily, fossil fuels have met this demand thus far. Further expansion for oil and natural gas are difficult not just for environmental concerns, but also for the economy since India imports most of its oil and gas. As homes have moved away from traditional sources of biomass including cow dung, fuelwood, and straw, a majority of the Indian energy demand is now met by fossil fuels. Coal accounts for about 57% of the primary energy mix in India. Oil is second at 29% and followed by natural gas at 7%. Hydro, renewables, and nuclear meet the rest of the demand contributing 4, 2, and 1% respectively. Given that India is the second largest producer of coal in the world and has the fourth largest reserves, the availability and affordability of coal relative to other fossil fuels has contributed to its abundant usage in the energy sector. On the other hand, India imports almost 80% of its oil requirements, and 45% of its natural gas requirements. Figure 3 provides further insights on how energy consumption across the world has transformed over time, and the trends that can be expected in future.
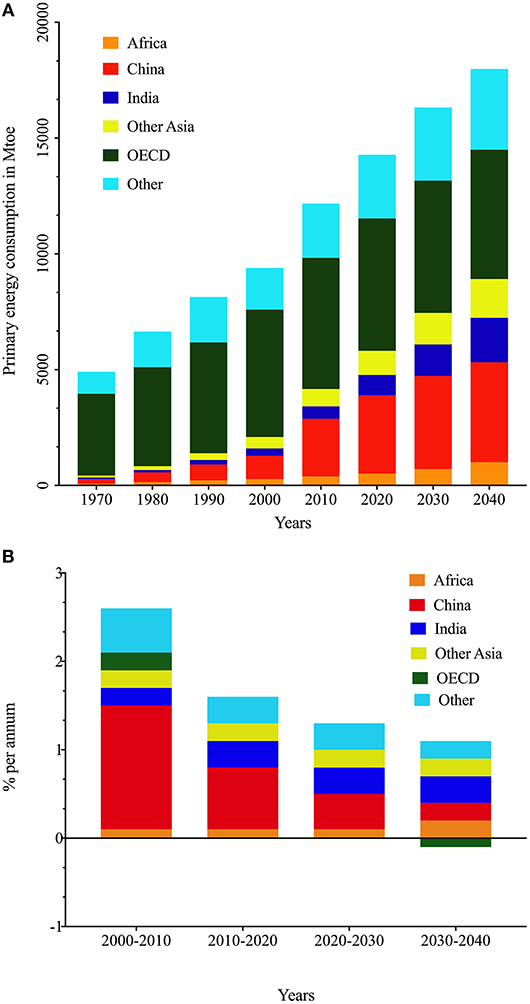
Figure 3. (A) Primary energy consumption by region. Data Source: BP Energy Outlook 2018 (United Nations, 2017). (B) Percentage growth by regional contributors. Data Source: BP Energy Outlook 2018 (United Nations, 2017).
By 2040, energy demand is expected to grow by ~165% as compared to current levels. Natural gas demand is expected to grow ~160%, hydropower by ~100%, nuclear by 320%, and renewables by a massive 710% (BP, 2017). Although India has added substantial renewable electricity production capacity recently, coal is expected to remain the dominant fuel in India with ~50% share in total production in 2040. Table 1 details how the world's energy mix is expected to change through 2040, while Figure 4 presents the case for India in specific.
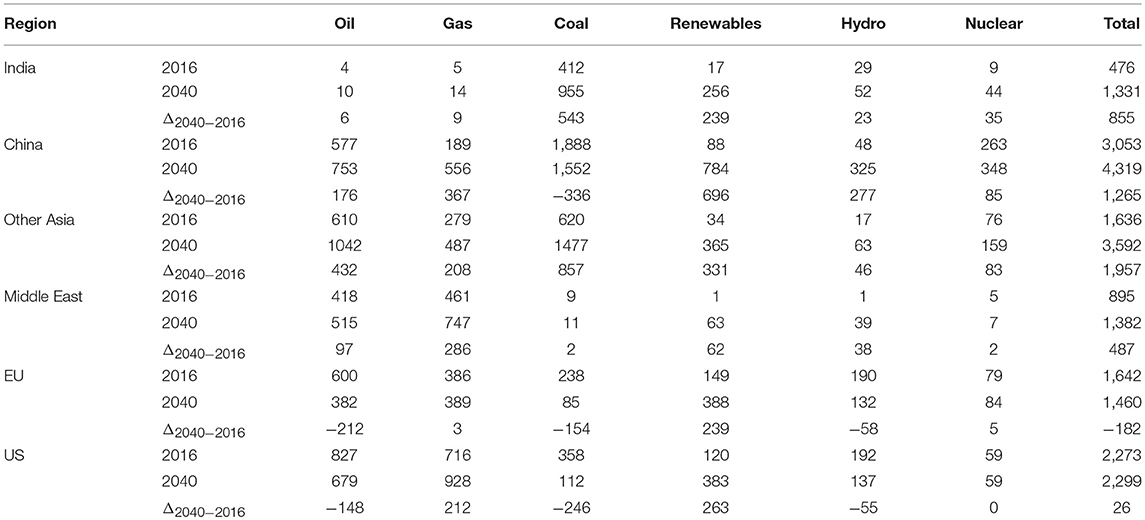
Table 1. Expected change in fuel mix by region in million toe 2016–2040 (United Nations, 2018).
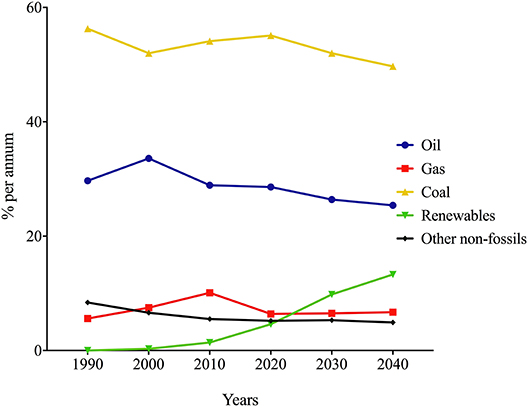
Figure 4. Share of primary energy mix. Data Source: BP Energy Outlook 2018 (BP, 2018).
Environmental and Socio-Economic Challenges
With abundant use of coal comes the environmental challenge of increased CO2 emissions (Guttikunda and Jawahar, 2014). India is the world's fourth largest emitter of CO2, with emissions growing at ~5% per year in 2017, with an average steady growth of 6% over the last decade. Figure 5 provides a current sectoral view of the origin of CO2 emissions in India (Department of Science and Technology, 2018).
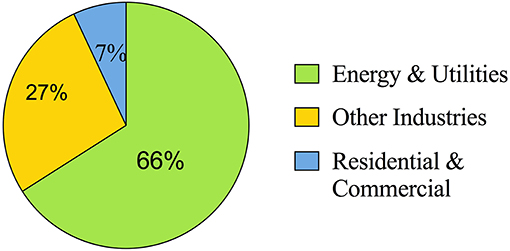
Figure 5. Sectoral distribution of CO2 emissions in India. Data Source: Department of Science and Technology, Govt. of India (Department of and Science Technology, 2017).
The impact of emissions is widespread, going far and beyond the domains of environment and energy security. Escalating pandemic diseases and other impacts on human health are being linked to increasing emissions. Research suggests that the rampant issue of protein deficiency in India will magnify as the growing CO2 levels in the atmosphere will affect the yield and quality of crops, putting 53 million people at a new risk of consuming protein deficient diet (Smith et al., 2017). Studies have also suggested that crops like rice will be adversely affected in terms of important nutrients like vitamin B, iron and zinc along with protein levels (Zhu et al., 2018). States like Assam that produce and consume rice as a staple will likely face the most nutritional deficits and other associated health risks such as effects on early childhood development, respiratory and cardiovascular issues, vector, and water-borne diseases.
Background
Given the dearth of strong climate incentives or tax policies, a strategic driver of CCUS innovation is the utilization of CO2 for enhanced oil recovery or CO2 enabled EOR. Traditionally, CO2 enabled EOR has been facilitated by drawing naturally occurring carbon from underground reservoirs to inject it into declining oil fields to boost their output, which makes CO2 an essential commodity for the oil and gas industry (Zhai et al., 2015). Paradoxically, CO2 for EOR is in short supply and expensive. Due to this gap, CCUS is considered an attractive alternative with greater potential, as compared to traditional CCS (Asian Development Bank, 1998; International Energy Agency, 2015; Consoli et al., 2017).
Oil and Gas Maturity in India
The first oil well in India was a hand dug well at a depth of 102 feet in Upper Assam, but the well could not produce satisfactorily. The first commercial discovery of oil took place in 1889 at Digboi in north-eastern Assam. Over the next few years, systematic drilling began in the region, and India's first refinery was set up in Digboi soon after. India's first discoveries, post-independence, were also made in Assam, in Naharkatiya and Moran oilfields, in the years 1953 and 1956, respectively. These and all other modern wells exploit oil and gas reservoirs that are at depths of 1,200–5,000 m. A number of oilfields like Geleki, Rudrasagar, Lakwa, Jorajan, Dikom, Kathalani, Makum, and Hapjan were discovered next. This was followed by the exploration of more than 100 oil and gas fields. Till the 1960s, Assam was the only oil producing state in India (Bharali and Borgohain, 2013). Most of the oil and gas discovered in the 1980s was found in the Barail Group of Upper Eocene to Lower Oligocene age and the Tipam group of upper Miocene age. In 1989, a major discovery was made when oil was found in Lakadong member of Sylhet Formation (Lower Eocene) in Dikom oilfield. Since then many oilfields have been discovered that are producing hydrocarbons from reservoirs of Lower Eocene—Upper Palaeocene age. Over the next years several new fields were discovered in Assam, Andhra Pradesh, Gujarat, Cambay basin and Rajasthan. The Digboi oilfield, which is still producing oil, though at a very low rate, is producing oil from reservoirs in Tipam Formation (Miocene). Naharkatiya and Moran oilfields are producing from reservoirs in Barail Formation (Oligocene)1. During the last 10 years, fields have been discovered mostly in Paleocene to Lower Eocene age. For the Borholla oil fields specifically, accumulations were in the fractured granitic rocks belonging to the Precambian age. The area south and south-east of the Brahmaputra river have been explored so far, but the area north of the river has not been explored suitably. Figure 6 maps major oil fields, power plants and fertilizer plants in Assam.
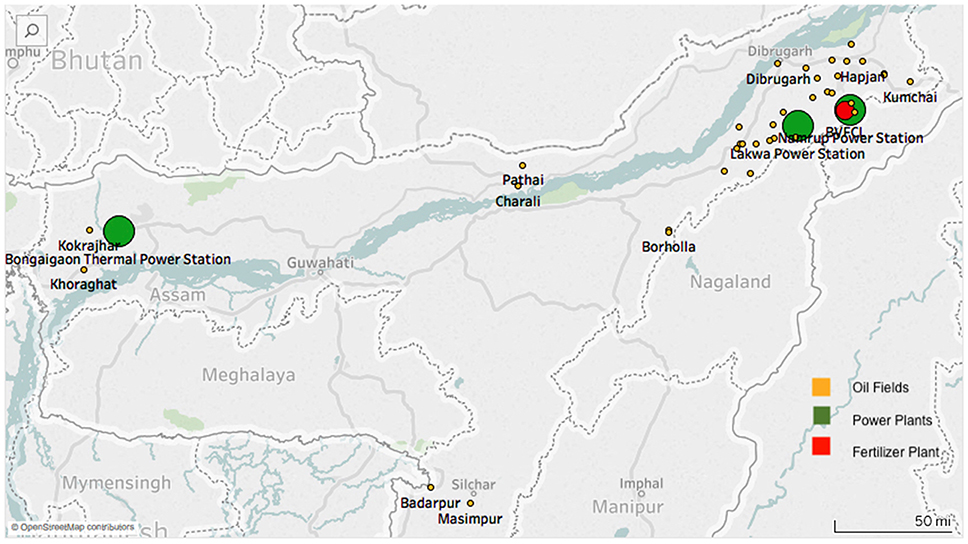
Figure 6. Major oil fields, power plants and fertilizer plant in Assam. Data Source: Brahmaputra Valley Fertilizer Corporation Ltd., Assam Power Generation Corporation Ltd., NTPC Ltd., Directorate General of Hydrocarbons, Ministry of Petroleum & Natural Gas, Govt. of India; Government of Assam (Brahmaputra Valley Fertilizer Corporation Limited, 2016; APGCL, 2017; NTPC, 2017; Directorate General of Hydrocarbon, 2018).
Technological Options for CCUS
The advantage of CCUS over traditional CCS is in the utilization of the CO2 feedstock toward valuable commercial products such as enabling EOR, making fuels and chemicals, while contributing to climate change mitigation at the same time. In general, the process of CCUS can be classified into three stages: capture, transport, and utilization and/or storage. The capture phase separates CO2 from other gases during production and can be further broadly categorized based on the technological approach used. These categories are- pre, post, and oxy-combustion. Pre-combustion capture involves converting fuels into a mixture of hydrogen and CO2 before the combustion is completed. The hydrogen rich fuel is combusted while the CO2 is separated, transported, and utilized. In post-combustion capture, CO2 is captured from the exhaust of the combustion process by absorbing in a suitable solvent. Upon separation from the solvent, the CO2 can be transported and utilized. Oxy-combustion uses oxygen instead of air for combustion of the fuel. This process produces an exhaust stream that mainly consists of water vapor and carbon dioxide, easing the separation of CO2 (Carbon Capture and Storage Association, 2011a). The transport phase is usually characterized by pipeline-based transport to sink or as raw-material for utilization. The utilization or storage phase can be categorized based on the end use of the CO2- utilized in production of valuable products, used for CO2 based EOR or for storage in geological formations such as saline aquifers, basalt formations etc. Modeling for this paper has been based on post-combustion capture based on reviewed literature that suggests the costs and ease of retrofitting the same are the least when compared to oxy and pre-combustion, even though the environmental benefits for the other methods may be greater (Global CCS Institute, 2010; Peter and Bongartz, 2015).
CCUS in India So Far
Apart from a few small-scale private demonstration projects, India currently has no CCUS projects at scale. CO2-enabled EOR provides a business case for CCUS in India since (Department of Science and Technology, 2018):
• Estimates suggest that for every ton of CO2 sequestered, between 1.5 and 4 barrels of additional oil can be extracted;
• Implementing and integrating CO2 based EOR in existing water flood or other primary production wells are easily achievable with a small additional capital expenditure;
• With field data from successful implementations, the demonstrated parasitic load for the capture and transport of CO2 can be reduced to below 17% from an expected 32%;
• Within reasonable constraints of source and sink, a transport distance of < 100 miles and no right-of-way constraints, return of investment can be achieved in 5–7 years;
• No substantial CCUS deployment initiatives have been undertaken by public sector oil and gas or power companies in India.
CO2 Enabled EOR Potential in Assam
Proven reserves in Assam are currently at 1,600 million tons, and the production from the state accounts for about 12% of India's total oil and gas production. The Ultimately Recoverable Resources or URR for oil in Assam is about 174 million tons. The production trends in Assam are summarized in Figure 7.
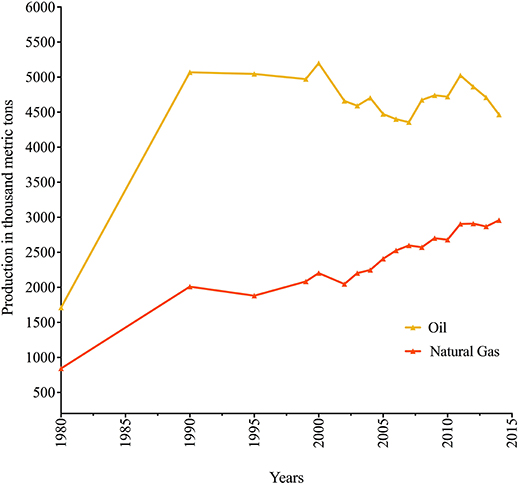
Figure 7. Oil and Gas production in Assam 1980–2014. Data Source: Directorate General of Hydrocarbons, Ministry of Petroleum and Natural Gas, Govt. of India (Directorate General of Hydrocarbon, 2018).
The average oil and gas recovery factor in India is about 37%, with Assam fields ranging from 20 to 40%. Amidst severe social, geographical and geopolitical challenges, which are discussed later, oil production in Assam is faced with multiple technological and environmental handicaps as well. Obtaining environmental permits for the heavily forested areas around the Brahmaputra river valley, which is grappling with pollution, lack of sewage treatment plants and disposal of waste in the river is becoming the top barrier for oil companies. Well-bore instability and the resulting inability to drill gauge holes in the pay zone is also a common challenge. For shallow wells improved drilling fluid technology has resolved the issue to some extent, but deep wells are still problematic to drill, despite changes in casing policy, mud systems, mud weight etc. Along with a natural decline in well pressure, artificial lifts face frequent downtime due to power cuts. Poor inflow, high gas-oil ratio, inability to retrieve unserviceable equipment despite fishing attempts, and increasing water cuts (99+% in certain cases). With Assam's current state of falling oil production and India's commitments toward climate change mitigation, CCUS is an attractive solution.
An updated assessment of CO2 storage potential of fields in India, and Assam in particular, has not been carried out in recent times. An assessment carried out by IEA in 2008 attempted to classify the storage alternatives in India, and calculate their capacity (Holloway et al., 2009). The calculation was based on the assumptions that:
• In the absence of field-specific data, it was assumed that all the gas produced from these fields with the oil production is dissolved gas, the reservoir volume of which can be accounted for by applying a formation volume factor. This may lead to underestimating the storage capacity since some of the pore space occupied by gas caps will not be accounted for;
• The density of CO2 is assumed as 600 kg/m3, as a reasonable value for the range of initial reservoir temperature and pressure and for wells with a depth of 1,200–5,000 m.
Using the same assumptions and method of calculation, the storage capacity was calculated using the following equation (Equation 1):
where, MCO2is the CO2 storage capacity, Voil is the volume of ultimately recoverable oil at standard conditions, Bo is the oil formation volume factor, and ρCO2 is the density of CO2 at reservoir conditions which is typical of supercritical CO2.
Given an oil formation volume factor of ~1.5 for a typical field in the Assam geological area, the resultant storage potential for all the known fields in Assam (with total hydrocarbon volume of ~ 3.5 billion barrels of oil equivalent; 174 million tons of ultimately recoverable oil) (Wandrey, 2004) is in excess of 100 Megatonnes of CO2.
Electricity Demand and Supply in Assam
Assam has a long-standing history of a shortage of power supply, especially in rural pockets. Assam's current demand stands at about 1,800 MW for 2016–17. Since 2004, India's Central and the Assam State governments undertook several reforms to strengthen the power sector. As of 2017, Assam has an installed capacity of ~1,500 MW, out of which about 1,000 MW is coal-based, 40 MW is gas-based, 400 MW is hydropower and 45 MW is renewables. As per the Assam budget of 2017, 2,526 villages have been electrified, which is 13% short of total rural electrification. A recent forecast of the long-term power requirements of the state expects demand to shoot up to 2,534 MW by 2021–22. Much of this demand is expected to be met through coal-based resources. Assam has also acquired loans from the Asian Development Bank to aid its ailing thermal plant infrastructure, to expand its transmission and distribution capacity, and increase access for remote communities (Asian Development Bank, 2018).
Chemicals and Fertilizers Demand and Supply in Assam
Asia's oldest gas-based fertilizer plant was started in Assam in the early 1960s by the Fertilizer Corporation of India. Discovery of fossil fuel resources in the Naharkatiya region propelled the government to plan for proper utilization of the vast amount of natural gas that was flared before the unit was set up. In 2002, the plant bifurcated from the erstwhile Hindustan Fertilizer Corporation Ltd. and was renamed the Brahmaputra Valley Fertilizer Corporation Ltd. (Brahmaputra Valley Fertilizer Corporation Limited, 2016). The plants were then rejuvenated and constituted as Namrup I, II, and III, with the former producing ammonia and the other 2 units producing both ammonia and urea. The existing plants have already surpassed the average life of 15–20 years for a chemical plant; the technology they operate with is now obsolete and finding spare parts for their archaic plant design has become increasingly difficult. However, given the dearth of supply in the region, the plants are still running, though, at a much-reduced efficiency of about 80% incurring financial loss to the order of $15 million (MEF Partners, 2009). The plant currently produces 351,000 tons per annum of ammonia and 311,400 tons per annum of urea. Efforts began in 2018 to ramp up production, to install a new unit to match demand, to provide direct and indirect employment, to offer incentives to ancillary industries, and to take advantage of cheaply available natural gas resources from the nearby fields in Namrup, Moran, Naharkatiya, and Lakwa regions (Press Trust of India, 2016).
The production of ammonia creates CO2 as an unavoidable by-product. These CO2 streams are highly concentrated and in excess of ~95% purity. Often considered the lowest-hanging fruit of industrial CCUS (International Energy Agency, 2015), these streams only require compression, transport and storage, thus bringing down capture costs significantly by eliminating the cost of separation.
Distance, Logistical, and Socio-Political Challenges for CCUS in Assam
Assam's mountainous terrain and thrust-belt geology make it difficult and investment intensive to build critical infrastructure such as pipelines for transportation. Also, Assam shares international borders with Bangladesh, and transport of coal is dependent on the Siliguri Corridor or the Chicken Neck, that connects West Bengal to the North-Eastern States. Any CO2 enabled EOR efforts will be closely linked to a steady supply of coal from the Raniganj field, which has dwindled in recent years owing to the absence of other transport routes. Also, inclement weather conditions in Assam, that include annual torrential rains and flooding in the Brahmaputra valley, cause disruptions in power plant and oil field operations, often leading to shutdowns. Historically, the commercial relationship between national oil companies that operate the oil wells in the Assam basin and the Assam Power Generation Company Limited have been tarnished by occasions of miscommunication and mistrust leading to supply and demand challenges and operational inefficiencies in the past. These dynamics will influence the planning and scoping of the source and sink resources. Most importantly, carbon capture and transportation efforts are accompanied by a significant energy penalty. Since a considerable section of the population in India does not have access to power, the energy penalty associated with carbon capture and transport will put further pressure on the grid. Additionally, all CCUS efforts will have to account for the ancillary exhausts from the system. Assam also has a tumultuous history of insurgency from anti-establishment local separatist groups, that not only vandalize equipment at state-owned facilities, but have also paved the way for political instability and security threats to officials working in the facilities, which makes any new technological advancement vulnerable to the threat of physical damage, as well as that of being politically stalled (Nayak, 2012). Along with techno-economic viability, the challenge of public perception is also a key factor of concern for the implementation of CCUS. Lack of public awareness, a not-in-my-backyard (NIMBY) mindset, associating CCUS with the promotion of coal, and the perception of associated risks surrounding storage and transport can significantly stall progress for CCUS in the politically sensitive and volatile state of Assam.
Methodology
Scenario Building
Potential sources and sinks for CCUS were first identified to understand the economic and performance implications of undertaking CCUS activities in Assam, given the demand and supply economics, logistics, and the above-motioned challenges. Three categories of sources were identified: coal-fired power plant, natural gas-fired power plant, and fertilizer production plant. The distance between these sources and CO2 demanding sinks were mapped to identify the least-cost alternative in terms of transport and storage infrastructure (Figure 6).
Modeling Methods
Power Plants
For this analysis, a coal- fired plant and two natural gas-fired plants were used as reference cases on which CCUS implementations were simulated using the Integrated Environmental Control Model (IECM) (Consoli et al., 2017), an open source tool developed and maintained by the Carnegie Mellon University (Carnegie Mellon University, 2017). IECM is a modeling program that executes cost and performance analyses of equipment in power plants—coal-fired and natural gas-fired. It also provides mechanisms to calculate the cost of adding emission control equipment to the plants. It allows the user to classify the plant design using the following parameters: Power plant type; fuel type; NOx Control; SOx Control; Particulate Matter Control; Mercury Control; Solid Management system; Water Management System, and Carbon Capture and Storage. The first step of modeling involved inputting parameters for the reference or base plant. Next the combustion, financing, emissions, and tax rate data were included in IECM. Calculations for retrofitting a CCUS system were carried out based on these input parameters for the base plant, where IECM allows the user to choose the desired CCUS implementation and compare costs to the base plant.
IECM is integrated with Aspen Plus® V7.2 (AspenTech, 2017) to calculate values for a variety of design configurations to come up with an optimized base plant configuration. IECM also provides the optionality to modify values for the base case, if required. The model runs on the Aspen Plus® and is based on the Technical Assessment Guide from Electric Power Research Institute (EPRI, 2013). The base plant simulation is carried out for a range of conditions and for variations in the system variables to cover a full factorial model space, using which multivariate linear regression equations are created that are incorporated as a module in IECM. Once the base plant calculations are carried out, cost-based calculations for CO2 capture process areas are undertaken to provide a comparative analysis of with and without CCUS cases. Using regression, a scaling equation is used to calculate the cost of implementing CCS across equipment, process streams, and units, which is given as:
where, X is the cost of the piece of equipment as estimated by the IECM, Xref is the reference cost of a similar piece of reference equipment that may be larger or smaller, or may process more or less of a key component of the system, Y is a process parameter of the piece of equipment for which costs are to be estimated, and Yref is a reference process parameter of the reference equipment. The reference equipment and associated costs are taken from the literature, Aspen Icarus® (AspenTech, 2017).
For transportation of CO2 from the source to the sink the available alternatives are pipelines, motor carriers, tanker ships, and railroad transport. The choice is made by considering the location of sink, the distance of source to sink, and the quantity of CO2 that will be transported. Most often the quantity and conditions under which CO2 must be transported makes pipelines the most economical and technically feasible choice. As default, IECM assumes all transportation of CO2 only via pipelines, which is appropriate for the volumes of CO2 and distance considered in our analysis. When CO2 must be carried over long distances it is desirable that it does not contain any moisture in order to avoid corrosion in the pipelines. Also, it must be compressed to high pressures to transport as a liquid or a super-critical fluid. This requires the installation of multi-stage compression units with inter-stage cooling and drying, booster stations and pumps. The net elevation change, material used for pipelines, inlet and outlet pressures, annual cost of maintaining the pipeline, and pipeline flow are also crucial factors that IECM accounts for based on user inputs of location, base plant design, distance between source and sink, process efficiency, and terrain.
For the storage phase, IECM allows for the following methods: enhanced oil recovery (EOR), enhanced coal bed methane (ECBM), geological storage, and ocean storage. The calculations in this study were conducted for pipeline transportation and EOR-based storage. For EOR, IECM treats potential financial benefits as negative costs while calculating projected costs for implementation of CCUS. No tax incentives or production incentives are accounted for in the simulation.
Finally, the cost of electricity is calculated by dividing the total annualized plant cost by the net electricity generated. Mathematically, it can be expressed as:
where, COE is the Cost of Electricity in $/MWh, TCC is the total capital cost in $, FCF is the fixed charge factor (fraction), which when multiplied by the total capital cost yields the annualized capital expense that must be recovered via revenue through the sale of electricity. FOM is the annual fixed operating & maintenance costs in $, which when added to the annualized capital expense yields the annualized plant cost in $. VOM is the Variable O&M costs, excluding fuel cost in $/MWh, HR is the heat rate of the power plant in MJ/MWh, FC is the unit fuel cost in $/MJ, CAPF is the annual average capacity factor (fraction), and MW is the net power plant capacity in MW. Eight thousand seven hundred sixty is the number of hours in one year measured in h.
The costs are calculated as:
• CO2 capture Capital Cost: Expressed as constant or current dollars for a given year.
• CCS levelized O&M Cost for transport: All transportation is assumed via pipelines and is calculated from the pipeline sub-process model.
• CCS levelized O&M Cost for storage: This provides the unit cost of CO2 utilization/storage. Depending upon the method employed there may be some revenue generated as in the case of EOR or CBM which is treated as a negative cost, or additional cost may be incurred, as discussed above.
• Annual Fixed Cost: The operating and maintenance fixed costs are given as an annual total. This number includes all maintenance materials and all labor costs.
• Annual Variable Cost: The operating and maintenance variables costs are given as an annual total. This includes all reagent, chemical, steam, and power costs.
• Total Annual Operations and Maintenance (O&M) Cost: This is the sum of the annual fixed and variable operating and maintenance costs.
• Annualized Capital Cost: This is the total capital cost expressed on an annualized basis, taking into consideration the levelized carrying charge factor, or fixed charge factor, over entire book life.
Fertilizer Plant
It is difficult to quantify the exact cost of CO2 enabled EOR from the Brahmaputra Valley Fertilizer Corporation Ltd. plant, due to unavailability of data. The following calculations provide a rough estimate of the cost of the project. Consider the following reaction that takes place in a modern fertilizer plant (Jan-Petter, 2014):
Based on Figure 8, the carbon footprint can be calculated using:
where, ECNH3 is the energy consumption for ammonia production in GJ per t NH3, CF is the carbon factor of energy source in t CO2 per GJ, and NH3AN is the amount of ammonia used for producing AN with a conversion factor of 0.213 t NH3 / t AN while accounting for 3% efficiency loss, NH3HNO3is the amount of ammonia used for producing nitric acid at a conversion rate of 0.213 t NH3 / t AN while accounting for 6% efficiency loss. EHNO3is the emission from nitric acid production in t N2O per t HNO3, GWFN2O is the global warming factor for N2O in t CO2 eq per t N2O, HNO3AN is the amount of nitric acid used for producing AN with a conversion factor of 0.788t HNO3 / t AN while accounting for 3% efficiency loss, ECAN is the energy consumption for AN solution and solidification process in GJ per t AN, HeatHNO3 is the heat export from nitric acid production in GJ per t AN, and CFreplaced energy is the carbon factor of replaced energy in t CO2 per GJ.
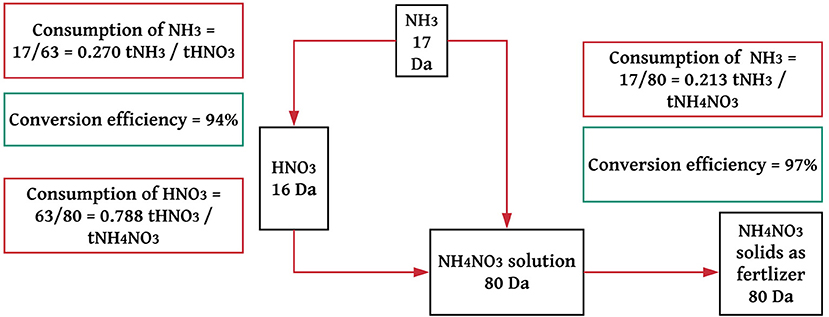
Figure 8. Schematic diagram of conversion of ammonia into ammonium nitrate in a fertilizer plant. Data Source: Yara International ASA (Jan-Petter, 2014).
Using Best Available Techniques (BAT) data from a typical fertilizer plant, the carbon footprint for a natural gas-fired fertilizer plant is 3.6 t CO2-equivalent per t N.
Performance Parameters
Amine based and ammonia based capture systems were considered for Namrup and Lakwa plants, while for Bongaigaon plant a membrane based capture system was also considered in addition to the amine and ammonia based systems. To maintain the same yardstick for comparison an amine based system with an FG+ amine was employed. Other available alternatives included MEA and Cansolv. FG+ was chosen because it allows for higher absorption, and higher CO2 carrying capacity, while lowering energy demand and capital costs. It also lowers solvent losses, reduces reclaimer waste production and further lowers handling and disposal costs. FG+ was also chosen because of its vast commercial experience, its solvent being neither custom made nor expensive to produce, and the primary ingredient being readily available worldwide. For the purpose of this study, the CO2 removal efficiency was set at 90% and a Direct Contact Cooler was used to cool the flue gases before it entered the amine system to enhance the reaction. The performance parameters in Table 2 were used while simulating plant conditions in IECM. Details for the performance parameters, additional parameters, and alternative capture scenarios can be found in Appendixes A,B (Bharat Heavy Electricals Limited, 1983; Mukherjee and Srivastava, 2005; Assam Electricity Regulatory Commission, 2012; Indian Power Sector, 2012; Assam Power Generation Corporation Limited, 2013; Gupta, 2015; Bakshi and Iyer, 2017).
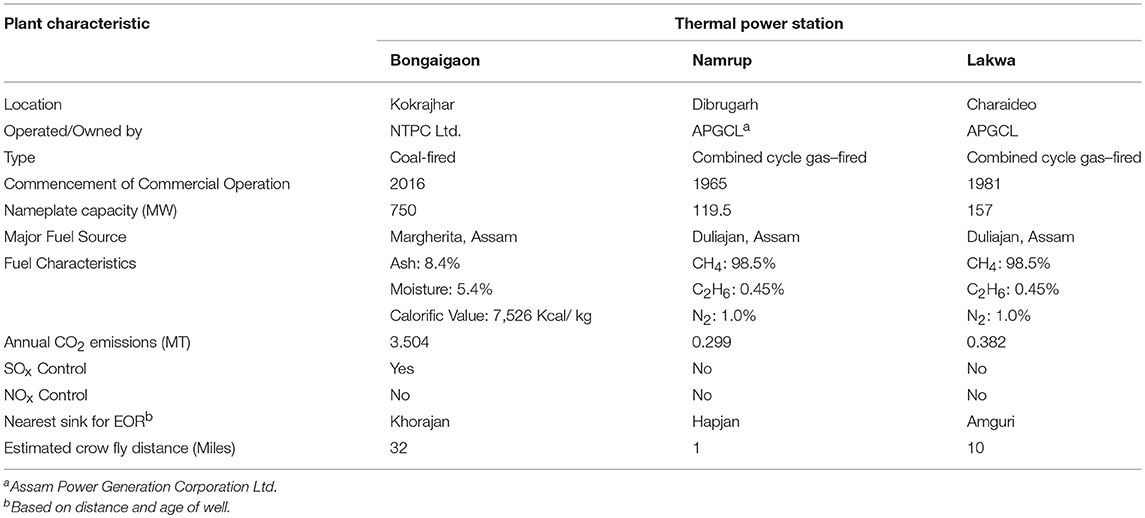
Table 2. Plant performance parameters in assam (Carbon Capture and Storage Association, 2011b; Sharma and Mahapatra, 2018).
Results
Power Plants
The levelized cost of electricity (LCOE) is a common and convenient measure to evaluate the competitiveness of different technologies and is used here to compare the efficacy of adding CCUS to their operations and the results are presented in Table 3. LCOE assumes a financial life and duty cycle, and calculates the cost of building and operating the technology, and therefore, depends directly on fuel characteristics and costs, fixed and operating costs of the plant, assumed utilization rates and capacity factors. As discussed, when calculating the cost of electricity for a CCUS enabled plant, the transportation method, distance between source and sink, and the storage method are also crucial. Since this study is based in Assam, the hilly terrain will add to the costs, will require boosting stations over long distances. On the other hand, since the chosen method of storage is EOR, all potential financial benefits through utilization are taken into account while calculating final costs, as discussed in section Power Plants.
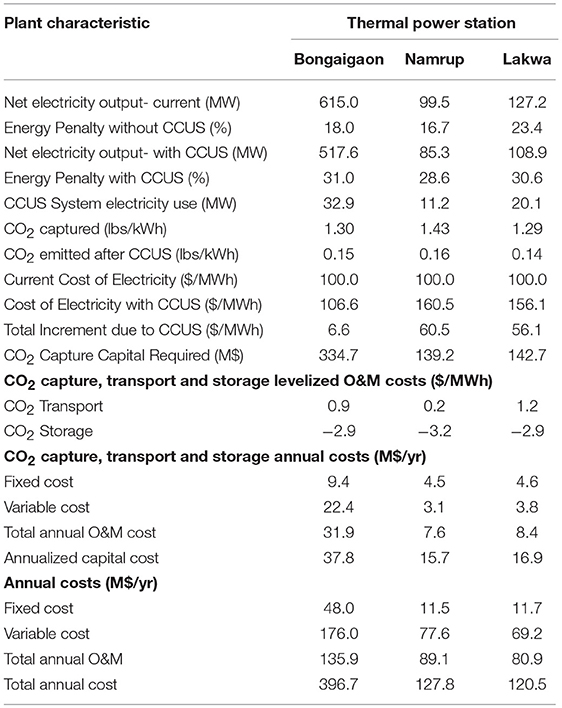
Table 3. Economic comparisons of incorporating CCUS at various assam based thermal power plant stations (all results reported in 2017 USD).
The results in Table 3 suggest that although both Namrup and Lakwa gas-fired plants are excellent potential sources in terms of distance from the nearest sink and CCUS related costs, it would increase the LCOE by almost 56–61% as against 7% in case of the Bongaigaon plant, despite it being farthest from the CO2 sink at Khoraghat. Even though Assam benefits from the presence of vast natural gas resources and low prices, the age of these gas plants, older design practices, and their crippling infrastructure makes taking advantage of these low prices for enabling economical CCUS extremely difficult. In fact, both these gas-fired plants have operated for longer than the average life, only to bridge the supply-demand gap in Assam, and may be unable to support a retrofit without a total system overhaul. Bongaigaon Thermal Power Station (BTPS), on the other hand, given its relative youth, newer design practices and plans for a potential expansion in the next few years, is perfectly positioned for a CCUS retrofit. BTPS' capacity factor of ~80%, as against the national average of about 60%, its steam generator efficiency of 100% TMCR, particulate emissions from its ESP not exceeding 31 mg/Nm3, and guaranteed removal of minimum 95% sulfur by its FGD system are some of its infrastructural advantages. A projected 250 MW expansion, if executed, will add to these advantages. However, comparing the energy penalties with and without CCUS, we see an almost 2-fold increase in penalty in case of a CCUS retrofit. This loss contradicts the aim of providing all consumers with access to electricity. Any CCUS efforts at BTPS will put additional burden on the plant and expansions may be needed to substantiate for the penalty while ensuring adequate supply to consumers.
Precise values for cost of capture and avoidance are difficult to quantify since we do not have adequate data on flue gases emitted from each of these plants. Although, current estimates in literature suggest the levelized cost of capture for a subcritical plant with an amine-based CCUS system to be ~ $56/ton CO2 captured and the cost of avoidance to be ~ $67/ton CO2 avoided for typical Indian conditions (Kapila et al., 2011; Rao and Kumar, 2014; Viebahn et al., 2014; Singh et al., 2016).
The negative cost or benefit of utilizing CO2 via EOR instead of traditional storage can be observed in the levelized O&M costs for transport and storage. Although, the per MWh costs are lowest and EOR-based storage benefits highest for the Namrup plant, the low capacity of the plant will limit the benefits. Bongaigaon plant, on the other hand, despite the largest source to sink distance amongst the three cases, provides a competitive opportunity at ~$19 million in O&M benefits from storage per year. Therefore, analyzing the additional value of extracting more oil through EOR with the injection of CO2 is a good indicator of the supplementary revenue that can be achieved through utilization. Although, it should be noted here that IECM does not include functionalities to simulate for different well characteristics and detailed storage parameters that will influence the benefits. As discussed in the background section, 1.5 to 4 barrels of additional oil can be extracted per ton of sequestered CO2, as discussed above. Assuming a cost of $53/barrel, the economic benefits extend to ~$80–$210/ ton of sequestered CO2.
Fertilizer Plant
The BVFCL plant produces ~350,000 tons of ammonia annually. According to the efficiency of the reaction in Equation 4, this is equivalent to ~75,000 tons equivalent of AN solids. According to Equation 5, this would imply a CO2 equivalence of ~270,000 tons per year for this plant. The value of the CO2 sequestered from this project would be energy equivalent to ~360,000 MWh of electricity (Environmental Protection Agency, 2008).
Estimates suggest the cost of capture for high purity CO2 sources like ammonia production is approximately $16.50 t/CO2, while the cost of CO2 avoided is $30/t CO2 (Leeson et al., 2017). Therefore, the annual cost of CO2 capture and avoidance for this plant are ~$4.5 million and $8.1 million, respectively.
Discussion
With its current policies, India is on track to meet its Paris Climate Agreement targets. Some projections estimate that India may also overachieve its non-fossil capacity target for the power sector along with its overall emission intensity target by 2030. As India continues investing in renewables, the energy portfolio will diversify and will be able to quickly provide affordable energy to those without access or with limited access. Yet, India's Draft Electricity Plan corroborates the need for coal expansion, and therefore, coal will still rank first, even with this diversification (Central Electricity Authority, 2016). For a nation as dependent on coal as India, the importance and need for carbon mitigation technologies like CCUS cannot be debated. The timeline of implementation is therefore extremely crucial. The mitigation potential of CCUS as a technology has been long proven. There is also a huge market for CO2 as a raw material, and CO2 based EOR is a front-runner among these, providing an economic incentive for CCUS, along with environmental and social benefits.
The results of this analysis highlight that although Indian plants are prime candidates for such projects, plant preparedness and age are factors that influence the economics and can lead to huge differentials. Given the urgency of carbon mitigation, investing in retrofits in Assam will deliver results immediately as against greenfield projects, since no new power plant expansions are in the pipeline for the area, and moreover are likely to have significant latency because of environmental reviews and technology validation. Planned expansions in other Indian states over the next few years are currently focusing on the construction of ultra-supercritical plants that will save 25% of the coal reserve and cut down on emissions by 15% (Times News Network, 2017). Although construction will begin in 2019, the first plant is expected to be operational only by 2025. Also, in November 2005, in an attempt to solve India's debilitating power crisis, the government had formulated an ambitious plan to build Ultra Mega Power Plants or UMPPs, each of which would generate close to 4,000 MW of electricity and would be built by both national power companies and private entities, founded on the idea that such economies of scale would ensure uninterrupted power supply. But out of the 16 planned plants, many failed to take off, and the ones that did were mired in controversies, demands for higher tariffs, and unviable economies. With most of these problems arising out of policy loopholes, the revival of these projects currently seems bleak.
The additional cost per unit of electricity and the energy penalty are antithetical to India's vision of affordable and available-for-all electricity. However, the substantial reduction in emissions that can be achieved through retrofitting cannot be overlooked. Eighty-five percent of all power plants in India are subcritical (MEF Partners, 2009), therefore, greater capture costs cannot be averted for now. As with other technologies, improved technical knowledge and innovations with each new project will bring the costs down in future, providing a greater economic incentive with time. Currently, the upfront cost of capital, energy, and operation at power plants can only be balanced by achieving consistent environmental and social benefits that are sustainable, which this proposed idea presents. Coupling with the recent policy framework to promote and incentivize enhanced recovery is expected to galvanize investment and create new employment opportunities while de-risking technological and financial impediments. When compared with estimates in literature for proposed CCUS deployments at other coal-fired plants in India, the increment in cost of electricity is much lower as compared to an average of $45/ MWh increment estimate for plants in Western, Southern or Northern India. It has often been suggested in previous recommendations that CCUS should be adopted at plants where imported coal is used instead of Indian coal, given the high ash content in the latter. However, costs are significantly reduced if plants with indigenous coal supply are chosen as candidates for CCUS, given the price differential. Specifically, when compared to CCUS proposals at other NTPC plants such as Ramagundam, Talcher, and Badarpur, that use local coal, the increment in cost of electricity at Bongaigaon is lower by about $47–55. The availability of a merry-go-round between the Bongaigaon plant and the Margherita coal field for coal transport, in addition to the close distance of the sink, as compared to an average distance of 155 miles for the other plants are primary reasons for the comparatively lower increment in COE (Rao and Kumar, 2014; Singh et al., 2016). Despite the challenges in Assam, the abundance of sinks in close proximity to CO2 emitting sources is a crucial advantage for this region.
The techno-economic analysis in this paper has not factored for critical social, economic, and environmental challenges and opportunities, along with the logistical challenges discussed earlier. For instance, the Brahmaputra river is a major source of fresh water in North East India. In Assam it flows for ~400 miles, its longest among Indian states. Years of neglect, oil spills from nearby oil production, slurry from coal washeries have already tipped contaminant and bacteria amounts beyond permissible levels. Runoffs and spills have also led to significant soil pollution, impacting the rich alluvial soil that supports the agricultural economy of Assam (AT News, 2017). Tea production, a major source of revenue for the state, and other food and cash crops like rice, jute, sugarcane, oilseeds and potato production have been impacted by pollutants, change in land use patterns, and urbanization (Borah, 2010; Duncan et al., 2016). Assam's rich biodiversity, which includes the Kaziranga National Park—a UNESCO World Heritage site and one of the few remaining places that house a substantial population of the Asiatic one-horned rhinoceros—has been threatened by climate change and industrialization (Gogoi, 2015). While CCUS efforts will provide necessary intervention to mitigate climate change in this sensitive geo-ecological region, the environmental impact and footprint of a CCUS retrofit needs to be evaluated critically and holistically. Additional water consumption at source, waste water generation at sink, effects on aquatic, terrestrial, and avifauna are some of the environmental concerns that will require policy-based intervention and developmental planning that is sustainable. Along with this, the added burden on plants due to energy penalties from CCUS may necessitate subsequent expansion projects. For a state already facing acute power shortage and frequent power cuts, these expansions will be accompanied by socio-political challenges, and environmental and economic impacts. CCUS also suffers from the effects of public perception, primarily due to low public awareness, the perceived risk of leakage from storage sites, and a NIMBY mindset. Living close to a CCUS site has been shown to have influenced public perception. Living in a tourism or mining region has also decreased acceptance (Braun, 2016). Assam being both a tourism hub and a mining center is at increased risk of resistance from the public. Added to this, Assam has a history of anti-establishment challenges from separatist movements aiming to hinder any government backed initiative. These longstanding conflicts make new technological projects, including pipeline projects, sensitive to public perception. Public perception can also be negatively shaped by the risk of induced seismicity due to injection of CO2. Although induced seismicity has been reported widely over the last 4 decades, very few induced earthquakes have been recorded at sites of storage. Estimates in literature suggest that injecting commercial scales of CO2 can potentially produce seismicity at the depths of about 3 miles, but a site by site evaluation will need to be conducted to evaluate the likelihood of induced seismicity. Therefore, developing robust statistical and physical models that can help lessen the risks of induced seismicity, along with the potential loss of public support, loss to infrastructure, and loss to the integrity of the reservoir are essential to risk mitigation and transforming the social perception of CCUS (International Energy Agency, 2013; James and Anna, 2016)
A comprehensive life-cycle analysis that accounts for social, economic, and environmental benefits will highlight the credible opportunities of the proposed idea. A sustainable tradeoff between economy, environment, and community development will create new and continued opportunities for Assam. Employment generation through expansion, protection of biodiversity, the interests of indigenous communities and farmer's interests, and organized waste management can mitigate and reverse the effects of unplanned industrial development, (Saikia, 2018) and significantly lower carbon footprint. Along with benefits for the primarily agrarian economy of Assam, this could spur investment in the area in other sectors like manufacturing, education, research, recreation, and tourism. However, industrial development and planning will need to be supported and substantiated with sustainable community planning for the growing urban population and the indigenous population in rural pockets.
Challenges and Gaps in Analysis
The lack of availability of certain input parameters such as information on any upgrades or maintenance activity that may have been carried out at Lakwa or Namrup since their inception and of recent estimates of economic parameters or operating conditions for similar plants were the foremost challenges. They were adjusted for in the calculations by using available information in the public domain even if it was dated, or by using IECM default values in places where no information was available. IECM assumes U.S. plant designs as default parameters, and although, significant attempts were made to simulate the exact plant conditions while modeling in IECM, certain inherent design and policy differences between Indian and US conditions like maximum allowed age of the plant, land tax, environmental tax etc., have not been accounted for. The default values of these parameters have been calculated by IECM using the Technical Assessment Guide and values derived in a 2011 paper by Versteeg and Rubin (Versteeg and Rubin, 2011). These parameters represent the best currently available information on CCUS technology. Although certain design specifications are an indicator of the age of a plant, and IECM accounts for these in its calculations, it does not explicitly factor in the level of preparedness or the lack of it. For region-specific costs that are influenced by ambient temperature and pressure, average weather data for Assam was used as an alternative to data for each of the plant locations. For the storage and utilization phase, thermal effects, the potential of leakage, capacity of each well on case by case basis have not been included in the calculations. The calculations for the BVFCL plant should be considered as a rough approximation, due to the unavailability of emissions data.
Conclusions
In this paper a techno-economic analysis for the deployment of CCUS in Assam has been carried out across 3 power plants and a chemical plant. The power plants have been considered for an amine-based post-combustion retrofit and the subsequent energy penalties, increase in cost of electricity, capture and avoidance costs, capital costs, O&M costs, and transport and storage costs are reported and analyzed. For the chemical plant, an estimate for the increase in annual costs was provided. Environmental benefits at both point-sources were considered, and the recommendations of the paper are supported by higher cost of avoidance of CO2 as compared to the cost of capture. The paper reinforces that CCUS at all plants will not offer the same results and benefits. However, newer power plants like Bongaigaon Thermal Power Station and high purity sources like Brahmaputra Valley Fertilizer Corporation Limited plant provide a substantial and lucrative incentive to deploy CCUS, and to utilize the CO2 for EOR now. The paper highlights India's climate urgency and the need for CCUS-based policies to meet its climate targets. Although most CCUS feasibility studies in the past have been carried out without focusing on northeastern India, this paper establishes that despite challenges Assam is a suitable candidate for CCUS that provides an incentive for rapid development and CCUS implementation.
Author Contributions
All authors listed have made a substantial, direct and intellectual contribution to the work, and approved it for publication.
Conflict of Interest Statement
The authors declare that the research was conducted in the absence of any commercial or financial relationships that could be construed as a potential conflict of interest.
Acknowledgments
The authors would like to acknowledge the inputs provided by Jagdesh Kripalani that lead to a comprehensive discussion in this work.
Supplementary Material
The Supplementary Material for this article can be found online at: https://www.frontiersin.org/articles/10.3389/fenrg.2019.00012/full#supplementary-material
Footnotes
1. ^Presently, there are 26 existing sedimentary basins in India covering an area of 1.2 million square miles (Leeson et al., 2017). These fields are classified into 4 categories based on commercial production, and the accumulation of hydrocarbon. Category 1 basins are the ones with established commercial activity. Cambay, Krishna Godavari, Rajasthan, Mumbai offshore, Cauvery, Assam shelf and Assam- Arakan fold belt are category 1 basins. The Assam basin covers an area of about 45,000 square miles. The major tectonic elements of the basin are the Assam Shelf, the Assam-Arakan Fold belt and the Naga Schuppen belt.
References
APGCL (2017). Running Projects for APGCL. Assam Power Generation Corporation Ltd. Available online at: http://apgcl.org/run_prj.html (Accessed October 31, 2018).
Asian Development Bank (1998). India: Implementation of Clean Technology Through Coal Beneficiation. Technical Assistance Consultant's Report.
Asian Development Bank (2018). India: Assam Power Sector Enhancement Investment Program - Tranche 4. Sovereign (Public) Project.
Assam Electricity Regulatory Commission (2012). Petition for Revised Annual Revenue Requirement and Determination of Generation Tariff for the Financial Year 2014-15. Guwahati: Assam Power Generation Corporation Limited.
Assam Power Generation Corporation Limited (2013). Social Due Diligence Report- Tranche-1:(Lakwa Replacement Power Plant-70-MW).
Bakshi, A. S., and Iyer, M. K. (2017). “Approval of tariff for Bongaigaon Thermal Power Station,” in 45/GT/2016, ed C. E. R. Commission (New Delhi: Central Electricity Regulatory Commission), 1–87.
Bharali, B., and Borgohain, P. (2013). Few characteristics of tipam sandstone formation within oilfield areas of upper assam – a study based on wireline log data. J. Earth Sci. 36–45. Available online at: https://www.researchgate.net/publication/299566200_Few_Characteristics_of_Tipam_Sandstone_Formation_Within_Oilfield_Areas_of_Upper_Assam_-_A_Study_Based_on_Wireline_log_Data
Bharat Heavy Electricals Limited (1983). Civil, Structural, Piling & Architectural Works of 1 X 38 Mw Stg, 3 Nos. Hrsg & Bops For Apgcl/Lakwa Waste Heat Recovery Project (Phi), Assam. Kolkata: Bharat Heavy Electricals Limited.
Brahmaputra Valley Fertilizer Corporation Limited (2016). Available online at: https://bvfcl.com/about/ (Accessed April 16, 2018).
Braun (2016). “Not in my backyard: CCS storage sites and public perception of CCS,” in Kiel Working Papers. Kiel.
Carbon Capture Storage Association (2011a). Capture. Available online at: http://www.ccsassociation.org/what-is-ccs/capture/ (Accessed January 9, 2019).
Carbon Capture Storage Association (2011b). What is CCS? Carbon Capture and Storage Association. Available online at: http://www.ccsassociation.org/what-is-ccs/ (Accessed April 20, 2017).
Carnegie Mellon University (2017). Integrated Environmental Control Model (11.2). Department of Engineering and Public Policy.
Central Electricity Authority (2016). Draft National Electricity Plan. Generation:In fulfilment of CEA's obligation under section 3(4) of the Electricity Act 2003. Central Electricity Authority, Ministry of Power, Government of India.
Consoli, C. P., Havercroft, I., and Irlam, L. (2017). Carbon capture and storage readiness index: comparative review of global progress towards wide-scale deployment. Energy Procedia 114, 7348–7355. doi: 10.1016/j.egypro.2017.03.1585
Department of Science and Technology (2017). Annual Report 2017. Department of Science and Technology, Government of India.
Department of Science and Technology (2018). A Roadmap for India. New Delhi: Department of Science and Technology, Govt. of India.
Directorate General of Hydrocarbon (2018). Evolution of Indian Oil and Gas Industry. Directorate General of Hydrocarbon, Ministry of Petroleum and Natural Gas, Govt. of India. Available online at: http://www.dghindia.org/index.php/page?pageId=56 (Accessed April 20, 2018).
Duncan, J., Saikia, S., Gupta, N., and Biggs, E. (2016). Observing Climate Impacts on Tea Yield in Assam, India.
Eberhardt, J. J. (2002). “DOE Fuels of the Future for Cars and Trucks Energy Efficiency and Renewable Energy,” in Diesel Engine Emissions Reduction (DEER) Workshop (San Diego, CA: U.S. Department of Energy).
Environmental Protection Agency (2008). Greenhouse Gas Equivalencies Calculator. United States Environmental Protection Agency. Available online at: https://www.epa.gov/energy/greenhouse-gas-equivalencies-calculator (Accessed March 16, 2018).
EPRI (2013). Technical Assessment Guide-Power Generation and Storage Technology Options, in Power Generation and Storage Technology Options: 2013 Topics. Electric Power Research Institute, 1–624.
Faisal, F., Tursoy, T., and Ercantan, O. (2017). “The Relationship between Energy Consumption and Economic Growth: Evidence from non-Granger Causality Test,” in 9th International Conference on Theory and Application of Soft Computing, Computing with Words and Perception, Vol.120 (Budapest), 671–675.
Global CCS Institute (2010). Global Knowledge Sharing Framework. Phase 1: Project Reporting Framework. Carbon Capture, Use and storage (CCUS).
Gogoi, M. (2015). Kaziranga Under Threat: Biodiversity Loss and Encroachment of Forest Land. Environment and Political Weekly 50.
Guttikunda, S. K., and Jawahar, P. (2014). Atmospheric emissions and pollution from the coal-fired thermal power plants in india. Atmos. Environ. 92, 449–460. doi: 10.1016/j.atmosenv.2014.04.057
Holloway, S., Garg, A., Kapshe, M., Deshpande, A., Pracha, A. S., Khan, S. R., et al. (2009). An Assessment of the CO2 storage potential of the indian subcontinent. Energy Procedia 1, 2607–2613. doi: 10.1016/j.egypro.2009.02.027
Indian Power Sector (2012). Thermal Power Plant. Indian Power Sector. Available online at: http://indianpowersector.com/home/power-station/thermal-power-plant/ (Accessed January 9, 2019).
International Energy Agency (2015). Carbon Capture and Storage: The Solution for Deep Emissions Reductions. Special Reports. International Energy Agency.
International Energy Agency (2016). Nationally Determined Contribution to Paris Agreement: India. International Energy Agency. Available online at: https://www.iea.org/ (Accessed May 25, 2018).
International Monetary Fund (2017). World Economic Outlook, April 2017: Gaining Momentum? World Economic Outlook. International Monetary Fund.
IPCC (2018). Global Warming of 1.5°C. IPCCSpecial Report on the Impacts of Global Warming of 1.5 °C. Intergovernmental Panel on Climate Change.
James, V., and Anna, L. (2016). Stork Carbon capture and storage, geomechanics and induced seismic activity. J. Rock Mech. Geotech. Eng. 8, 928–935. doi: 10.1016/j.jrmge.2016.06.004
Jan-Petter, F. (2014). “Calculation of Carbon Footprint of Fertilizer Production,” in Open Information (Oslo: Yara International ASA), 1–6.
Kapila, R. V., Chalmers, H., Haszeldine, S., and Leach, M. (2011). “CCS prospects in India: results from an expert stakeholder survey,” in 10th International Conference on Greenhouse Gas Control Technologies, eds J. Gale, C. Hendriks, and W. Turkenberg (Guildford), 6280–6287.
Leeson, D., Mac Dowell, N., Shah, N., Petit, C., and Fennell, P. S. (2017). A techno-economic analysis and systematic review of carbon capture and storage (ccs) applied to the iron and steel, cement, oil refining and pulp and paper industries, as well as other high purity sources. Int. J. Greenhouse Gas Control 61, 71–84. doi: 10.1016/j.ijggc.2017.03.020
Mallick, H. (2009). Examining the linkage between energy consumption and economic growth in india. J. Dev. Areas 43, 249–280. Available online at: https://www.jstor.org/stable/40376283
MEF Partners (2009). Technology Action Plan, High-efficiency, Low-emissions Coal. Report to the Major Economies Forum on Energy and Climate. Major Economies Forum on Energy and Climate.
Mukherjee, S., and Srivastava, S.K (2005). Trace elements in high-sulfur assam coals from the makum coalfield in the northeastern region of india. Energy Fuels 19, 882–891. doi: 10.1021/ef049775
Nayak, N. (2012). Growing Maoist Activism in Assam: Sinister and Calculated Moves. (Accessed February 24, 2012).
NTPC (2017). Bongaigaon Thermal Power Project. NTPC Ltd. Available online at: http://www.ntpcindia.com/en/powergeneration/coal-based-power-stations (Accessed Jan 17, 2018).
Peter, M., and Bongartz, R. (2015). “Carbon Capture Technologies,” in Carbon Capture, Storage, and Use: Technical, Economic, Environmnetal, and Societal Perspectives, eds W. Kuckshinrichs and J.-F. Hake (Basel: Springer International Publishing), 14–47.
Press Information Bureau (2018). Cabinet Approves Policy Framework to Promote and Incentivize Enhanced Recovery Methods for Oil and Gas.
Rao, A. B., and Kumar, P. (2014). Cost implications of carbon capture and storage for the coal power plants in india. Energy Procedia 54, 431–438. doi: 10.1016/j.egypro.2014.07.285
Saikia, A. (2018). Unplanned urban growth: land use/land cover change in the Guwahati Metropolitan Area, India AU - Pawe, Chandra Kant. Geogr. Tidsskrift-Danish J. Geogr. 118, 88–100. doi: 10.1080/00167223.2017.1405357
Sharma, N., and Mahapatra, S. S. (2018). A preliminary analysis of increase in water use with carbon capture and storage for indian coal-fired power plants. Environ. Tech. Innov. 9, 51–62. doi: 10.1016/j.eti.2017.10.002
Singh, U., Anand Rao, B., and Chandel, M. K. (2016). “Economic Implications of CO2 Capture from the Existing as well as Proposed Coal-fired Power Plants in India under Various Policy Scenarios,” in 13th International Conference on Greenhouse Gas Control Technologies. Lausanne.
Singh, U., and Singh, G. (2016). Perspectives on carbon capture and geologic storage in the indian power sector. Strategic Plann. Energy Environ. 36, 43–66. doi: 10.1080/10485236.2016.11771075
Smith, M. R., Golden, C. D., and Myers, S. S. (2017). Potential rise in iron deficiency due to future anthropogenic carbon dioxide emissions. GeoHealth 1, 248–257. doi: 10.1002/2016GH000018
Times News Network (2017). India to Start Building Ultra Supercritical Thermal Plant in 2019. Times of India.
United Nations (2015). Sustainable Development Goal 7. United Nations. Available online: https://sustainabledevelopment.un.org/sdg7 (Accessed October 3, 2018).
United Nations (2017). “World Population Prospects 2017.” Population Division of the Department of Economic and Social Affairs, United Nations.
United Nations (2018). Paris Agreement - Status of Ratification. United Nations. Available online at: https://unfccc.int/process/the-paris-agreement/status-of-ratification (Accessed October 3, 2018).
Versteeg, P., and Rubin, E. S. (2011). Technical and economic assessment of ammonia-based post-combustion CO2 capture at coal-fired power plants. Int. J. Greenhouse Gas Control 5, 1596–1605. doi: 10.1016/j.ijggc.2011.09.006
Viebahn, P., Daniel, V., and Höller, S. (2014). Prospects of carbon capture and storage (CCS) in India's power sector – An integrated assessment. Appl. Energy 117, 62–75. doi: 10.1016/j.apenergy.2013.11.054
Wandrey, C. J. (2004). Sylhet-Kopili/Barail-Tipam Composite Total Petroleum System, Assam Geologic Province, India. U.S. Geological Survey Bulletin 2208-D.U.S. Department of the Interior.
Zhai, H., Ou, Y., and Rubin, E. S. (2015). Opportunities for decarbonizing existing U.S. Coal-fired power plants via CO2 Capture, Utilization and Storage. Environ. Sci. Tech. 49, 7571–7579. doi: 10.1021/acs.est.5b01120
Zhu, C., Kobayashi, K., Loladze, I., Zhu, J., Jiang, Q., Xu, X, et al. (2018). Carbon dioxide (CO2) levels this century will alter the protein,micronutrients, and vitamin content of Rice grains with potential health consequences for the poorest rice-dependent countries. Sci. Adv. 4, 1–8. doi: 10.1126/sciadv.aaq1012
Keywords: carbon capture utilization and sequestration, enhanced oil recovery, Assam, levelized cost of electricity, India, carbon mitigation
Citation: Datta A and Krishnamoorti R (2019) Opportunities for a Low Carbon Transition-Deploying Carbon Capture, Utilization, and Storage in Northeast India. Front. Energy Res. 7:12. doi: 10.3389/fenrg.2019.00012
Received: 03 November 2018; Accepted: 30 January 2019;
Published: 05 March 2019.
Edited by:
David J. Heldebrant, Pacific Northwest National Laboratory (DOE), United StatesReviewed by:
Yuan Jiang, Pacific Northwest National Laboratory (DOE), United StatesDebangsu Bhattacharyya, West Virginia University, United States
Copyright © 2019 Datta and Krishnamoorti. This is an open-access article distributed under the terms of the Creative Commons Attribution License (CC BY). The use, distribution or reproduction in other forums is permitted, provided the original author(s) and the copyright owner(s) are credited and that the original publication in this journal is cited, in accordance with accepted academic practice. No use, distribution or reproduction is permitted which does not comply with these terms.
*Correspondence: Ramanan Krishnamoorti, cmFtYW5hbkB1aC5lZHU=
†These authors have contributed equally to this work