 Christopher Moß
 Sunil A. Patil
 Uwe Schröder
- 1Institute of Environmental and Sustainable Chemistry, Technische Universität Braunschweig, Braunschweig, Germany
- 2Department of Earth and Environmental Sciences, Indian Institute of Science Education and Research, SAS Nagar, India
This study elucidates the role of micrometer-scale electrode surface structures on the growth and the electrochemical performance of mixed culture electrochemically active biofilms (EAB). For this purpose, copper electrodes were machined to generate micro-scale surface structures (roughness and waviness) ranging from a few μm to over 100 μm, which were characterized using confocal laser scanning microscopy (CLSM). The structured electrodes were used to cultivate acetate based, mixed culture, anodic EAB in order to establish relationships between the surface properties and (i) the growth behavior and (ii) the stationary electrocatalytic properties of the resulting EAB. On short time scale, the initial growth phase is shown to be significantly influenced behavior by the surface topology. The long term electrocatalytic biofilm performance, however, does not show any dependence on the surface structures and does thus not profit from the increased specific surface area and micro-scale surface area due to the increasing 3-dimensionality. The results of this study are of great importance for a more systematic development of tailored electrodes for microbial electrochemical technologies.
Introduction
Biofilm electrodes are the core functional element of the great majority of bioelectrochemical systems (BES), such as microbial fuel cells (MFC). A high biofilm electrode performance is thereby decisive for a future success of the respective microbial electrochemical technology. In order to increase this performance, the research community has been using biological and materials science approaches. Biological strategies aim at the improvement of the electrochemically active bacteria and their communities and involve the application of, e.g., sophisticated cultivation procedures (e.g., Riedl et al., 2017), and genetic tools (Li et al., 2018). Major tasks of materials science on the other hand are the improvement of the underlying electrode material toward improved bacterial attachment (Saito et al., 2011; Guo et al., 2013) and interfacial electron transfer (Guo et al., 2014) and, most importantly, the creation of electrodes that are able to host a large number of microbial cells. The latter aspect aims to create electrodes with a large surface area and thus to improve the ratio of electrode surface area to reactor volume for a high bioelectrochemical turnover. Over the past decade, multiple examples for surface structuring—from the nm to mm scale—or the application of porous electrodes with various pore dimensions (Chen et al., 2012; Ketep et al., 2014; Massazza et al., 2015; Baudler et al., 2017)—have been published. For a more thorough overview on the respective electrode materials, the reader may be directed to one of the recent review articles (Guo et al., 2015; Xie et al., 2015).
Looking into the above literature reveals that research on large-surface area electrodes for microbial electrochemical technologies has, to date, been performed mainly on an empirical basis and non-systematically. A comparison of literature from different labs or between different studies is often difficult due to the use of varying electrode materials and hence differing microorganisms and differing surface chemistries. The latter aspect has recently been highlighted in a publication by Champigneux et al. (2018). Further, many studies use only short experimental time scales that do not allow assessing the long-term bioelectrochemical performance of proposed electrode materials and structures and thus their suitability for technical application.
This study aims to systematically investigate the influence of micro-structures on growth behavior and bioelectrocatalytic performance of electrochemically active biofilms (EABs). Copper was used as the anode material for its excellent bioelectrochemical properties (Baudler et al., 2015) and the ease of mechanical surface processing. The metal was structured by mechanical turning and sanding, followed by thorough optical characterization. Mixed culture EABs were cultivated on these electrodes using acetate as the substrate, in order to assess the impact of the surface structures on the electrochemical biofilm behavior.
Experimental Section
Electrode Surface Modification and Characterization
The working electrodes were made of Copper rods (99.999%, ChemPur Feinchemikalien und Forschungsbedarf GmbH, Germany) with a diameter of 1 cm. The rods were cut into disks with a height of 0.6 cm. The surface of each cylinder was insulated with epoxy resin (R&G Faserverbundwerkstoffe GmbH, Germany) leaving the circular top base area open to pose as the Cu disc working electrodes.
Surface structures on the Cu disc surfaces were created by a modified turning process leading to wavelike structures of up to 130 μm in height (Table S2). Polished and roughened electrodes were prepared by using sandpapers of grain sizes between 2.12 and 82 μm (Table S3). Morphological characterization of the electrode surface was done using a Leica TCS SPE DM5500 confocal microscope. Before the microscopic analysis, every electrode sample was cleaned with isopropanol and immersed into 0.1M H2SO4 solution to remove any dirt or reactive impurities which could have been introduced during the manufacturing process. For micro-structured electrodes, a 10x air objective (Leica HC PL Fluotar 10x/0.3NA) was used to measure the sample electrode at 5 different spots not only at random locations but also at locations from the middle to the edge of the respective electrodes. This procedure was used to validate the turning process and to make sure the structures were uniform across the electrode surface. For polished and roughened electrodes, a 50x air objective (Leica HC PL Fluotar 50x/0.8NA) was used to measure at 10 randomly chosen locations on the electrode surfaces. Processing of the microscopic data was done using the software Leica Map 7.0.
Bioelectrochemical Setup and Experimental Conditions
The bioelectrochemical experimental setup consisted of a customized 1 L capacity round bottom glass reactor containing 600 mL of modified standard cultivation medium composed of phosphate buffer, 7.5 mL mineral and vitamin solutions (Balch et al., 1979) and 10 mM acetate. To achieve a high degree of comparability and to minimize statistic deviations up to six biofilm electrodes were cultivated simultaneously in every setup, each cell containing at least one electrode of every category (Figure 2, Table S2). The electrodes were placed concentrically in distance of roughly 4 cm around the reference electrode (Ag/AgCl, sat. KCl, Sensortechnik Meinsberg, Germany) to minimize potential shifts between the electrodes. A graphite rod of 4 cm length and 1 cm diameter was used as the counter electrode and was placed beside the reference electrode (Figure S1). At startup and after medium replacement for each batch cycle, the medium was deaerated by sparging nitrogen for at least 15 min. Additionally, fresh medium was deaerated for at least 15 min before it was added to the reactor for medium replenishments. The reactor was sealed using butyl rubber stoppers to maintain anaerobic conditions in the reactor. As a microbial inoculum source, a secondary culture containing mostly Geobacter anodireducens enriched from the primary wastewater of the wastewater treatment plant Steinhof, Braunschweig (Germany) was used (Baudler et al., 2014). To allow for a reproducible inoculation procedure, 6 mL bacterial suspension with an OD of 1 (measured using a UV-VIS spectrophotometer—Dr. Lange, Spektralphotometer CADAS 100) was added to the medium at the start of each experiment. The multi-electrode (6 working electrodes) setup was established using a VMP-3 potentiostat (Bio-Logic Science Instruments SAS, France) and an N-Stat Box (Bio-Logic Science Instruments SAS, France). To monitor the bioelectrocatalytic current generation, the Cu working electrodes were poised at −0.2V vs. Ag/AgCl reference electrode by using chronoamperometry (CA). The bioelectrochemical experiments were conducted for five batch cycles (roughly 70 days in total), over which the incubation temperature was constantly held at 35°C. The abiotic control tests confirmed the electrochemical stability of Cu electrodes under the tested electrochemical and biochemical conditions. This is well in accordance with the previous reports (Baudler et al., 2015). The experimental data in this study are based on at least two independent replicates for every individual electrode, measured in independent reactors. All error bars in this study represent the corrected sample standard deviation of the respective bioelectrochemical measurements.
Biofilm Electrode Characterization Using Confocal Laser Scanning Microscopy (CLSM)
After completion of the bioelectrochemical experiments, the biofilm electrodes were submerged in phosphate buffer solution for confocal microscopy. Measurements were done with a 25x water immersion objective (Leica HCX IRAPO L 25x/0.95NA) as reflection images. It should be noted that the penetration depth of the laser into the biofilms was around 60 μm, which means that information could only be obtained on this part of the biofilm. CLSM images were processed using the software Leica Map 7.0.
Results and Discussion
Characterization of Electrode Surfaces by CLSM
To correlate bioelectrochemical data with electrode surface properties, detailed knowledge of the surface shape is required. Generally, there are two different approaches to achieve this: manufacturing well defined surfaces or using thoroughly characterized surfaces. In this study, copper electrodes were micro-structured by a turning method. This method creates wavelike patterns of different sizes (Figure 1, Figure S3) on the electrode surface with a ratio of the height of the peaks compared to their distance of around 0.15 (Figures 1B,C). The turning process also introduces roughness to the electrode surface (Figure 1A). Since it was not possible to precisely define the dimensions and shape of the electrode surface structures in the manufacturing process, the prepared electrodes had to undergo a thorough surface characterization. Yet, trying to quantify the “real” surface area of an electrode equals to the so called coastline paradox—the closer we look at a given surface area, the more resolved surface structures become and the more they contribute to the determined surface area value (Kirkby and Mandelbrot, 1982; Hanaor et al., 2014). Thus, the real surface area is not a fixed value but it strongly depends on the used characterization technique1. We used confocal laser scanning microscopy, CLSM, as an optical surface characterization method to obtain representative topographical data. It has a lateral resolution of about 1 μm—the size dimension of a typical electrochemically active bacterium. Since any surface area enlargement by structures below cell size level cannot be accessed by a bacterium as a surface for growth, this study focuses on structures on bacterial scale and above. The surface structure can be separated into two components: Whilst structures around the bacterial level [represented by the roughness profile of the surface (Figure 1A)] technically increase the surface area, they do not provide additional area for bacterial/biofilm growth. The micro-structures introduced by the turning process are significantly larger than the electroactive bacteria which makes the additional area provided by these structures available for EAB growth [represented by the waviness profile (Figure 1A)].
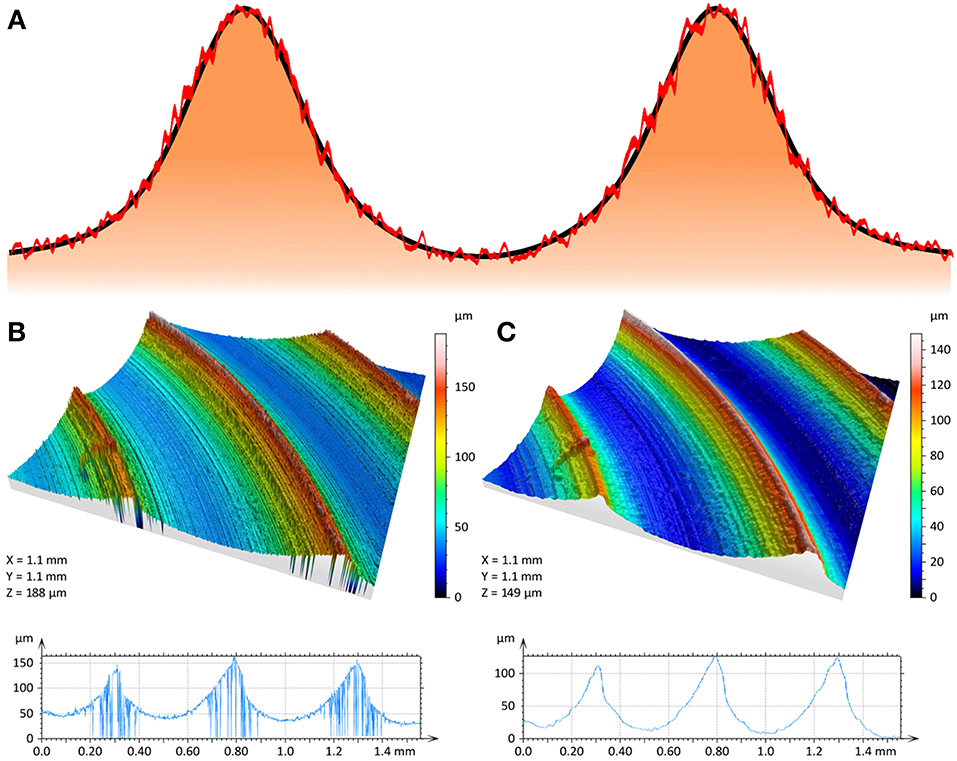
Figure 1. (A) Schematic view of the Copper surface profile generated through the turning process. The black and red borders represent, respectively, the waviness and roughness features of the surface. 3D-Images (top) and 2D-Profiles of the electrode surfaces (bottom); (B) unfiltered surface with measurement errors and (C) surface after application of a morphological filter.
Due to the occurrence of high-slope areas on the surface profile, artifacts appeared in the resulting CLSM images (Figure 1B). To determine the structure size correctly and to quantify the waviness and roughness of the surface, it is important to separate artifacts, roughness and waviness. A morphological filter (Leach, 2010) was therefore used to remove the artifacts (Figure 1B) while retaining the electrode geometry (Figure 1C). Accordingly, the waviness profile was defined to include the wavelike patterns introduced in the turning process while smaller surface structures were defined as roughness (Table S1). Removing smaller topological features, which are not part of the waviness profile using a high pass filter (Leach, 2010) leads to a clear separation of roughness and waviness according to the definition above.
There are several approaches to derive average structure heights from microscopic data. The most basic way is to extract several 2D-profiles and calculate the average structure height. However, this can be a cumbersome approach, which hardly accounts for the variance of surfaces with lower regularities. Using a method which accounts for the whole set of surface data can be helpful to increase representability and reproducibility of the obtained values. In this study, we used a watershed algorithm (Scott, 2009; Leach, 2010) to estimate the height of the respective surface structures. This algorithm generates one data point per dale representing the difference between the lowest point of the dale and the lowest point of the surrounding peaks. Average heights and standard deviations obtained by this method are presented in Table S2. Based on the distribution of their average structure heights, the micro- structured electrodes were classified into four groups and were studied accordingly. Groups 1, 2, 3, and 4 represent structure heights of 5–10, 20–30, 50–70, and above 90 μm, respectively. Group “0” is used to represent the polished electrodes with 0 μm structure height. A quantification of the waviness surface area shows an increase of up to 12% as compared to flat electrodes (Figure 2).
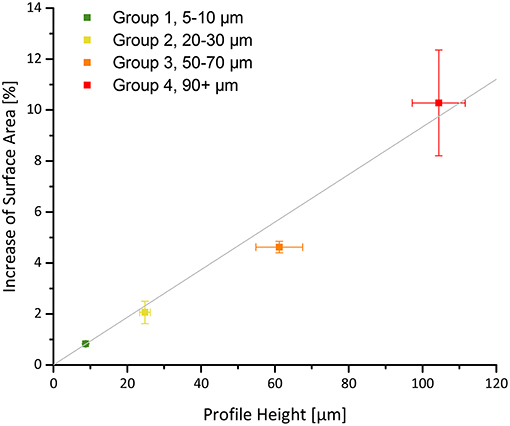
Figure 2. Increase of waviness surface area of micro-structured electrodes compared to a polished electrode (point of origin).
To estimate potential effects of the superimposing roughness, another set of electrodes was prepared and their roughness was measured by CLSM. Commonly the roughness of a surface is quantified using roughness parameters such as the dimensionless mathematical roughness factor, the arithmetical mean deviation (Ra) and the core roughness depth (Rk).
The dimensionless roughness factor is represented by the quotient of 3D real surface area and 2D geometrical surface area, however it carries no information on the axial dimensions of the sample. The Ra represents the standard height deviation from the center of the roughness profile. The Rk is calculated from the Abbott-Firestone-curve (Whitehouse, 2002; Leach, 2010) of the sample where the value of Rk accounts for the axial region representing the majority of the surface area. While both of these parameters carry information on the axial component of the surface, Rk offers a more accurate picture in terms of the height of the roughness profile compared to Ra (Figure S2). The results of the roughness measurement are displayed in Table S1 in terms of the areal parameters Sa and Sk; the used sandpapers are listed in Table S3. It can be seen that the roughness values extend from 0 for a polished surface to a value slightly above the roughness of the micro-structured surfaces.
Bioelectrochemical Behavior of Micro-Structured Copper Electrodes
The bioelectrochemical performance of the optically characterized Cu electrodes was assessed by cultivating EABs at the respective electrodes at a constant potential of −0.2 V (vs. Ag/AgCl) for 5 batch cycles spanning over ~70 days (see Figure S4) and analyzing the resulting bioelectrocatalytic current flow. For statistical evaluation, the electrodes were grouped according to their average structure heights (Table S2).
Effect of Micro-Structuring on Initial Attachment of Microbial Cells and Biofilm Growth
The growth and metabolic activity of anodic electrochemically active bacterial can be monitored directly following the oxidative current generation of the biofilm electrode. In this study, we analyzed the onset time (or lag time) of the current generation as a parameter to compare the initial biofilm formation on the differently micro-structured electrodes. For an accurate comparison, both a definition for the onset (lag) times and a method to obtain reproducible and robust values are needed. In view of this, we define the onset or lag time of current output in a BES system as the time point where an exponential increase in current density can be observed. As a method to measure the onset times, we suggest the use of a graphical method (Figure 3, inset figure), wherein the onset time is obtained through a linear fit on the exponentially increasing current during the startup of the BES experiments. The onset time is then defined as the intersection of the resulting line with the origin of the Y-axis. The results obtained through this procedure for different electrodes are shown in Figure 3 with all data being normalized to the electrode with the longest onset time. The onset times ranged from 43 h for a micro-structured electrode with an average structure height of 106 μm to 56 h for a polished electrode with 0 μm height. Some of the data show a significant experimental variance of up to 10%. It is most likely that these variations in the lag time are to be attributed mainly to a non-uniform, turbulent flow regime of the buffer medium in the stirred batch reactors. Further impacts on the onset of the biofilm formation could be the cultivation temperature (Patil et al., 2010) and the number of active cells in the inoculum. Apart from the variance of the individual data, a clear effect of the micro-structuring on the current onset times can be seen (Figure 3). Thus, with growing structure heights, the onset times decrease significantly, with the largest effect of 20% lag time reduction for structure heights of around 100 μm. Hereby the strongest decrease can be observed for group 2 (structure height 20–30 μm). Further increasing the structure size seems less impactful, as the reduction between groups 2, 3, and 4 is—due to the comparatively high sample standard deviation—statistically not significant.
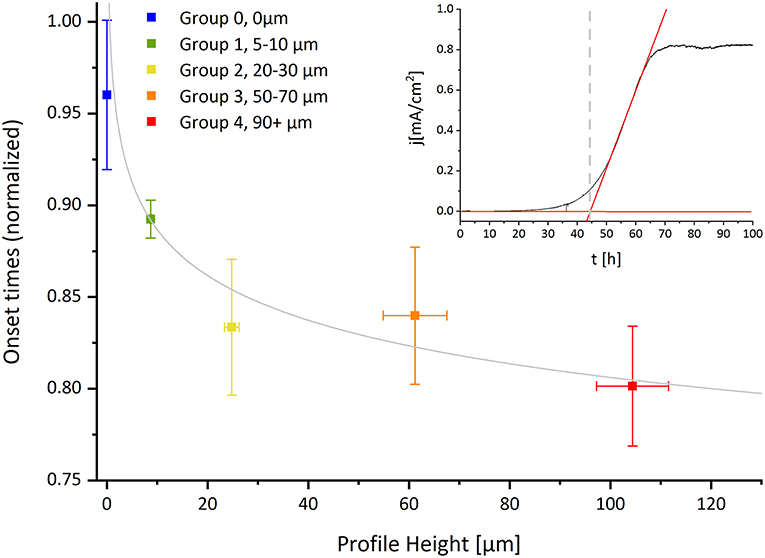
Figure 3. Main figure: Onset times for the bioelectrocatalytic current generation normalized to the slowest value, as a function of the electrode's average structure heights. Inset Figure: Illustration of the graphical method to determine the onset (lag) time of the biofilm formation from the chronoamperometric curve.
We attribute the observed enhancement in the start-up of the biofilm growth mainly to the axial component introduced by the micro-structures which influences the medium flow on the electrode surface. This can result in a reduction of sheer forces which favors the initial irreversible attachment of the microbial cells as well as the resulting biofilm growth (Alnnasouri et al., 2011). While small structures are close to the size of single cells of e.g., Geobacter species (Caccavo et al., 1994) and may therefore favor the attachment of single cells, they may be too small to support the formation of large cell clusters (Lebedev et al., 2014) and thick biofilms to an extent that translates into a significant decrease of current onset times. These effects can be mainly expected for larger structure heights.
Effect of Micro-Structuring on Bioelectrocatalytic Current Densities
Micro-structuring increases the specific surface area, i.e., the electrode's (real) surface area compared to its projected (geometric)1 surface area, significantly and also increases the area available for bacterial colonization. In our study, this is represented by the waviness profile (see Figure 2). To study the impact of the degree of surface structuring on the electrochemical biofilm performance, we extracted the maximum current densities of the respective biofilm electrodes measured in a series of semi-batch experiments (see Figure S4) over the course of five batch cycles (corresponding to a duration of ~70 days). It can be seen that the current densities of all electrodes range between 1 and 1.5 mA/cm2 for the first batch cycle. The maximum currents however starts declining over time during the subsequent batch cycles finally reaching a constant level of 0.5–0.7 mA/cm2 in cycles 4 and 5. Such behavior has been observed before (Babauta and Beyenal, 2014) and has been attributed to the maturation of the biofilm and associated limitations resulting from mass transfer (Renslow et al., 2013), electron transport (Liu and Bond, 2012) or proton accumulation (Torres et al., 2008).
To exclude any influence of copper as the electrode material, graphite electrodes were tested under the same conditions and showed a comparable behavior (Figure S5). A clear or significant relation between average structure height and maximum current density was not observed—neither in the early stages of the experiment nor for the mature biofilms which are achieved after 3 cycles or roughly 40 days of operation (Figure 4). It is difficult to evaluate the behavior in the early stages due to the high variance, which indicates that biofilm growth is still an important factor at this point.
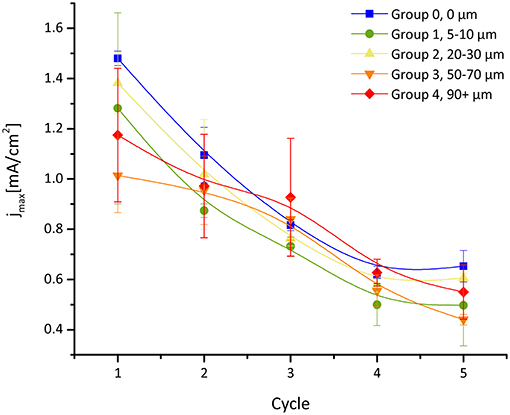
Figure 4. Maximum bioelectrocatalytic current densities over the course of 5 batch cycles (70 days) for different micro-structured Cu electrodes [derived from CA data (Figure S4)].
The results of these experiments lead to the conclusion that micro-structuring did not significantly influence the EAB performance, in particular on a longer time scale. It can be followed that there is no direct relationship between the electrodes' specific surface area or micro-scale surface area and the biofilm electrode performance. This leads to the conclusion that limitations introduced by axial biofilm growth and or structural changes occurring during maturation are leveling off the effect of the increase surface area. This is consistent with EIS measurements of the mature biofilms showing a long time constant process governing most of the resistance of the system which indicate intrinsic limitations of the biofilm transport processes (Figure S6). Thus, micro-scale surface area is most likely not a critical parameter for EAB performance.
CLSM Based Analysis of EAB Grown on Micro-Structured Electrodes
To obtain information on biofilm structure, CLSM measurements on the EAB grown on electrodes with different average structure heights (Table S2) were performed after the batch experiments. Digital camera and CLSM images are shown in Figure 5 and a schematic representation based on the CLSM images of EAB is shown in Figure 6. For all electrodes it was evident that the micro-structures were completely overgrown by the biofilm (Figures 5a,c). On the electrodes with larger micro-structures, the biofilm did adapt to the underlying structure while overgrowing it, thereby showing a wavelike shape (Figure 5c). Figure 5b shows a 3D-image of a biofilm grown on a polished electrode. The height distribution illustrates a fairly high surface roughness which is not related to the underlying structure. It seems that only larger surface structures can translate into a change in the EAB growth pattern while smaller asperities do not influence the biofilm growth on a large enough scale to be perceived (Figure 5). Figure 5d shows a 3D-image of a part of the micro-structured electrode (Figure 5c). Despite the high surface roughness of the biofilm, the wavelike shape of the underlying surface structure can be observed.
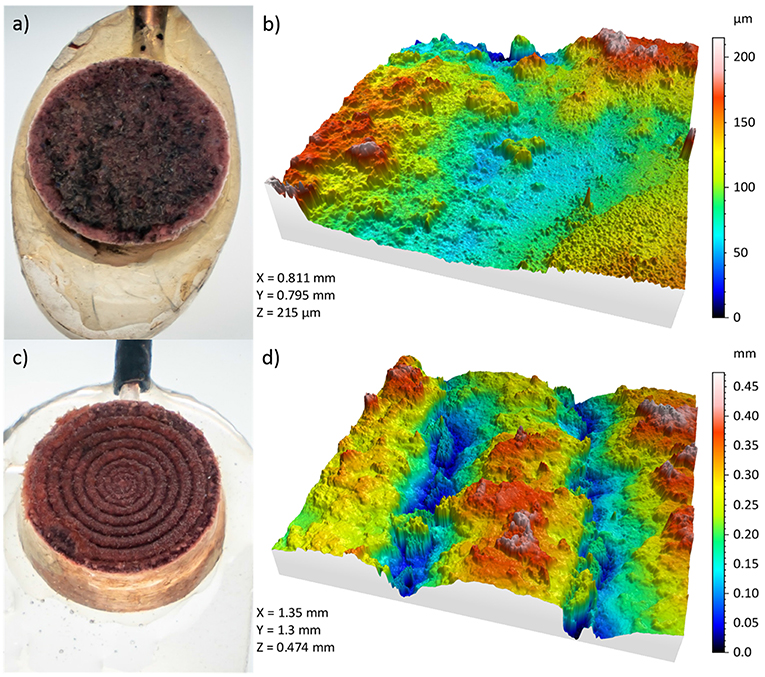
Figure 5. Digital (a) and CLSM (b) images of the EAB grown on a polished electrode. Digital (c) and CLSM (d) images of the EAB grown on a micro-structured electrode (average structure height 110 μm).
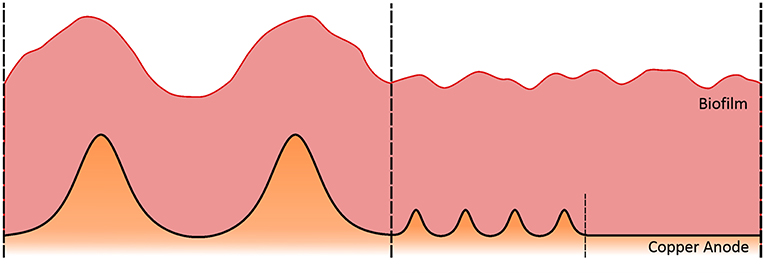
Figure 6. Schematic picture showing electrode structures of different sizes overgrown by a microbial biofilm.
The difference in height between the hills and the dales roughly equals the height of the underlying structure (Figure 5d). Since the biofilm performance limitations are likely due to the axial growth of the biofilm, the same limitations as for a flat surface apply to any point on the micro- structured surfaces, which leads to an electrode behavior adopting that of flat 2D-electrodes. Following this argumentation, a 3D-electrode behavior can only be achieved by structures that are significantly larger than the height of the biofilm. Thus, rather than the specific surface area of an electrode, the amount of available projected surface area seems to be the performance defining factor for typical biofilm electrodes. This is consistent with the high currents achieved in studies on macro-structure electrode designs (Chen et al., 2012).
Effect of Surface Roughness on Initial Attachment of Microbial Cells and EAB Growth
The focus of the above sections was on the waviness profile, neglecting the impact of surface roughness. To characterize the influence of the roughness profile on our measurements and thus to avoid mixing up the effects of roughness and waviness on the current onset times, additional short-term experiments with roughened electrodes were conducted (Figure S7). The electrodes were abraded with sandpapers to create different roughness profiles (Figure S2). On those electrodes, biofilms were grown under the same conditions as for the micro-structured electrodes. For the roughened electrodes (Figure 7, red symbols), no clear decrease of the current onset times can be seen as compared to the polished electrodes. Also, no clear relation between their core roughness depth and onset times can be derived. Thus, it appears that if there is an effect of the surface roughness on the onset times it is overruled by the experimental variance. It follows that whereas structures above 20 μm have a measurable effect on the biofilm development, μm-sized surface roughness does not (Pierra et al., 2018). The above findings appear to contradict recent findings of the Bergel group (Champigneux et al., 2018), who found a significant reduction of the lag time upon increasing surface roughness. The introduced roughness level in that paper, however, was in the low nm range, which seems to underline that a completely smooth electrode surface impedes bacterial colonization and already a nm-based roughness can improve colonization, e.g., by increasing the adhesive forces between bacteria and a sample (Boyd et al., 2002).
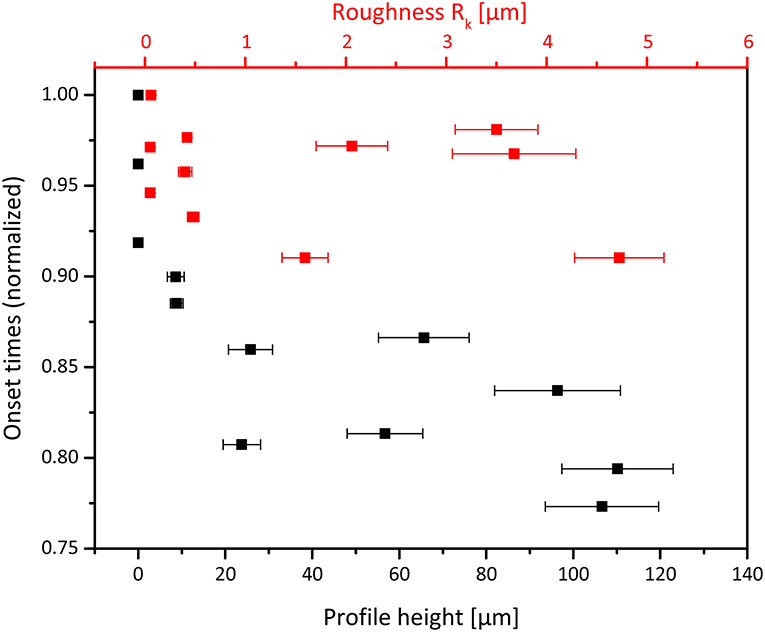
Figure 7. Effect of electrode surface roughness (red) and micro-structures (black) on current onset times.
Conclusions
In this study, we systematically assessed the role of micro-structures and surface roughness on the initial growth and the long-term behavior of acetate grown, mixed culture electroactive biofilms. We used copper as electrode material based on its excellent bioelectrochemical properties (Baudler et al., 2015) and the ease of mechanical surface processing. Based on our experimental results we can derive the following four major conclusions:
(I) The (long term) electrochemical performance (i.e., the achievable current density) of typical anodic mixed culture based biofilm electrodes is not significantly influenced or cannot be enhanced by surface structures in the dimension of up to 100 μm.
This finding has to be judged in the light of the thickness of a respective EAB. The electrochemical performance of biofilms that reach a thickness in the dimension of or are larger than the underlying electrode structure, does not profit from the increased specific surface area and micro-scale surface area due to the increasing 3D of these structures. By overgrowing the electrode structures, possible 3D effects are leveled off leading to a performance comparable to a 2D electrode surface. Especially for small structures, the biofilm shape (and thus performance) does not show significant difference to a flat electrode surface. As the size of the microstructure gets closer to the expected biofilm thickness, it becomes evident that the biofilm is adapting to the electrode structure and its increasing 3D.
(II) The projected surface area describes the surface area sufficiently accurate.
Based on the above finding, surface structures that are significantly smaller than the dimension (thickness) of the biofilm can be neglected in the calculation of the surface area. Thus, the projected surface area is a sufficiently accurate means to quantify the electrode surface area.
(III) Surface structures that are much larger than a bacterial cell reduce the onset time (lag time) of the biofilm formation; pure surface roughness does not.
Our experiments show that introducing surface structures (like a waviness) of up to 100 μm height strongly decreases EAB cultivation time. The strongest lag time reduction takes place between 0 and 20 μm structure height. The surface roughness on the other hand has no influence on the biofilm growth. We interpret this finding that at an electrode surface overflowed by a culture medium, surface structures that are considerably larger than the size of a bacterial cell influence the medium flow and reduce the lateral sheer force of the overflowing solution which leads to a preferred settling of cells inside of these structures. Apparently, a pure surface roughening, producing structures in the size dimension of a bacterium, does not lead to an improved bacterial settling at the electrode surface.
(IV) The duration of bioelectrochemical experiments needs be long enough to reach stationary biofilm conditions.
Many studies on EABs are performed at comparatively short time scales, in which the studied biofilms have not reached maturation. Often, the studied biofilms are still in their growth phase and have not reached their final constitution (Abbaszadeh Amirdehi et al., 2018). For the evaluation of the suitability of an electrode material for application in a bioelectrochemical system, however, the study of the long-term behavior is of utmost importance, since many effects, visible at short time scale, are likely to level off at longer time scales and are thus not of importance for electrode development.
The above statements need to be considered in relation to the studied biofilm systems (and their thickness). Thus, μm-thin anodic (Read et al., 2010; Carmona-Martínez et al., 2013) or cathodic (Kazemi et al., 2015) biofilms may profit much more from a micro-structuring than the here described Geobacter dominated mixed culture biofilm.
Author Contributions
All authors listed have made a substantial, direct and intellectual contribution to the work, and approved it for publication.
Conflict of Interest Statement
The authors declare that the research was conducted in the absence of any commercial or financial relationships that could be construed as a potential conflict of interest.
Acknowledgments
CM gratefully acknowledges financial support provided by the NTH-Research Unit ElektroBak—Innovative materials and concepts for microbial electrochemical systems. SP acknowledges the Alexander von Humboldt Foundation for financial support through a Humboldt Research Fellowship for experienced researchers program. We also thank the Deutsche Forschungsgemeinschaft (DFG) for support (DFG grant SCHR 753/10-2).
Supplementary Material
The Supplementary Material for this article can be found online at: https://www.frontiersin.org/articles/10.3389/fenrg.2019.00018/full#supplementary-material
Footnotes
1. ^For a thorough discussion on the real and projected surface area of electrodes and their determination the reader may be referred to a fundamental publication by Trasatti and Petrii (1992).
References
Abbaszadeh Amirdehi, M., Saem, S., Zarabadi, M. P., Moran-Mirabal, J. M., and Greener, J. (2018). Microstructured anodes by surface wrinkling for studies of direct electron transfer biofilms in microbial fuel cells. Adv. Mater. Interfaces 5:1800290. doi: 10.1002/admi.201800290
Alnnasouri, M., Lemaitre, C., Gentric, C., Dagot, C., and Pons, M. N. (2011). Influence of surface topography on biofilm development: experiment and modeling. Biochem. Eng. J. 57, 38–45. doi: 10.1016/j.bej.2011.08.005
Babauta, J. T., and Beyenal, H. (2014). Local current variation by depth in geobacter sulfurreducens biofilms. J. Electrochem. Soc. 161, H3070–H3075. doi: 10.1149/2.0131413jes
Balch, W. E., Fox, G. E., Magrum, L. J., Woese, C. R., and Wolfe, R. S. (1979). Methanogens: reevaluation of a unique biological group. Microbiol. Rev. 43, 260–296.
Baudler, A., Langner, M., Rohr, C., Greiner, A., and Schröder, U. (2017). Metal-polymer hybrid architectures as novel anode platform for microbial electrochemical technologies. ChemSusChem 10, 253–257. doi: 10.1002/cssc.201600814
Baudler, A., Riedl, S., and Schröder, U. (2014). Long-term performance of primary and secondary electroactive biofilms using layered corrugated carbon electrodes. Front. Energy Res. 2:30. doi: 10.3389/fenrg.2014.00030
Baudler, A., Schmidt, I., Langner, M., Greiner, A., and Schröder, U. (2015). Does it have to be carbon? Metal anodes in microbial fuel cells and related bioelectrochemical systems. Energy Environ. Sci. 8, 2048–2055. doi: 10.1039/C5EE00866B
Boyd, R. D., Verran, J., Jones, M. V., and Bhakoo, M. (2002). Use of the atomic force microscope to determine the effect of substratum surface topography on bacterial adhesion. Langmuir 18, 2343–2346. doi: 10.1021/la011142p
Caccavo, F., Lonergan, D. J., Lovley, D. R., Davis, M., Stolz, J. F., and Mcinerneyl, M. J. (1994). Oxidizing dissimilatory metal-reducing microorganism. Microbiology 60, 3752–3759.
Carmona-Martínez, A. A., Harnisch, F., Kuhlicke, U., Neu, T. R., and Schröder, U. (2013). Electron transfer and biofilm formation of Shewanella putrefaciens as function of anode potential. Bioelectrochemistry 93, 23–29. doi: 10.1016/j.bioelechem.2012.05.002
Champigneux, P., Renault-Sentenac, C., Bourrier, D., Rossi, C., Delia, M.-L., and Bergel, A. (2018). Effect of surface nano/micro-structuring on the early formation of microbial anodes with Geobacter sulfurreducens: experimental and theoretical approaches. Bioelectrochemistry 121, 191–200. doi: 10.1016/j.bioelechem.2018.02.005
Chen, S., He, G., Liu, Q., Harnisch, F., Zhou, Y., Chen, Y., et al. (2012). Layered corrugated electrode macrostructures boost microbial bioelectrocatalysis. Energy Environ. Sci. 5:9769–9772. doi: 10.1039/c2ee23344d
Guo, K., Donose, B. C., Soeriyadi, A. H., Prévoteau, A., Patil, S. A., Freguia, S., et al. (2014). Flame oxidation of stainless steel felt enhances anodic biofilm formation and current output in bioelectrochemical systems. Environ. Sci. Technol. 48, 7151–7156. doi: 10.1021/es500720g
Guo, K., Freguia, S., Dennis, P. G., Chen, X., Donose, B. C., Keller, J., et al. (2013). Effects of surface charge and hydrophobicity on anodic biofilm formation, community composition, and current generation in bioelectrochemical systems. Environ. Sci. Technol. 47, 7563–7570. doi: 10.1021/es400901u
Guo, K., Prévoteau, A., Patil, S. A., and Rabaey, K. (2015). Engineering electrodes for microbial electrocatalysis. Curr. Opin. Biotechnol. 33, 149–156. doi: 10.1016/j.copbio.2015.02.014
Hanaor, D. A., Ghadiri, M., Chrzanowski, W., and Gan, Y. (2014). Scalable surface area characterization by electrokinetic analysis of complex anion adsorption. Langmuir 30, 15143–15152. doi: 10.1021/la503581e
Kazemi, M., Biria, D., and Rismani-Yazdi, H. (2015). Modelling bio-electrosynthesis in a reverse microbial fuel cell to produce acetate from CO2 and H2O. Phys. Chem. Chem. Phys. 17, 12561–12574. doi: 10.1039/C5CP00904A
Ketep, S. F., Bergel, A., Calmet, A., and Erable, B. (2014). Stainless steel foam increases the current produced by microbial bioanodes in bioelectrochemical systems. Energy Environ. Sci. 7, 1633–1637. doi: 10.1039/C3EE44114H
Kirkby, M. J., and Mandelbrot, B. B. (1982). The Fractal Geometry of Nature. San Francisco, CA: W. H. Freeman.
Leach, R. K. (eds.). (2010). “Surface topography characterization,” in Fundamental Principles of Engineering Nanometrology (Amsterdam: Elsevier), 211–262.
Lebedev, N., Strycharz-Glaven, S. M., and Tender, L. M. (2014). High resolution AFM and single-cell resonance raman spectroscopy of Geobacter sulfurreducens biofilms early in growth. Front. Energy Res. 2:34. doi: 10.3389/fenrg.2014.00034
Li, M., Zhou, M., Tian, X., Tan, C., McDaniel, C. T., Hassett, D. J., et al. (2018). Microbial fuel cell (MFC) power performance improvement through enhanced microbial electrogenicity. Biotechnol. Adv. 36, 1316–1327. doi: 10.1016/j.biotechadv.2018.04.010
Liu, Y., and Bond, D. R. (2012). Long-distance electron transfer by G. sulfurreducens biofilms results in accumulation of reduced c-type cytochromes. ChemSusChem 5, 1047–1053. doi: 10.1002/cssc.201100734
Massazza, D., Parra, R., Busalmen, J. P., and Romeo, H. E. (2015). New ceramic electrodes allow reaching the target current density in bioelectrochemical systems. Energy Environ. Sci. 8, 2707–2712. doi: 10.1039/C5EE01498K
Patil, S. A., Harnisch, F., Kapadnis, B., and Schröder, U. (2010). Electroactive mixed culture biofilms in microbial bioelectrochemical systems: the role of temperature for biofilm formation and performance. Biosens. Bioelectron. 26, 803–808. doi: 10.1016/j.bios.2010.06.019
Pierra, M., Golozar, M., Zhang, X., Prévoteau, A., De Volder, M., Reynaerts, D., et al. (2018). Growth and current production of mixed culture anodic biofilms remain unaffected by sub-microscale surface roughness. Bioelectrochemistry 122, 213–220. doi: 10.1016/j.bioelechem.2018.04.002
Read, S. T., Dutta, P., Bond, P. L., Keller, J., and Rabaey, K. (2010). Initial development and structure of biofilms on microbial fuel cell anodes. BMC Microbiol. 10:98. doi: 10.1186/1471-2180-10-98
Renslow, R. S., Babauta, J. T., Majors, P. D., and Beyenal, H. (2013). Diffusion in biofilms respiring on electrodes. Energy Environ. Sci. 6, 595–607. doi: 10.1039/C2EE23394K
Riedl, S., Brown, R. K., Klöckner, S., Huber, K. J., Bunk, B., Overmann, J., et al. (2017). Successive conditioning in complex artificial wastewater increases the performance of electrochemically active biofilms treating real wastewater. ChemElectroChem 4, 3081–3090. doi: 10.1002/celc.201700929
Saito, T., Mehanna, M., Wang, X., Cusick, R. D., Feng, Y., Hickner, M. A., et al. (2011). Effect of nitrogen addition on the performance of microbial fuel cell anodes. Bioresour. Technol. 102, 395–398. doi: 10.1016/j.biortech.2010.05.063
Torres, C. I., Marcus, A., and Rittmann, B. E. (2008). Proton transport inside the biofilm limits electrical current generation by anode-respiring bacteria. Biotechnol. Bioeng. 100, 872–881. doi: 10.1002/bit.21821
Trasatti, S., and Petrii, O. A. (1992). Real surface area measurements in electrochemistry. J. Electroanal. Chem. 327, 353–376. doi: 10.1016/0022-0728(92)80162-W
Whitehouse, D. (eds.). (2002). “Profile and areal (3D) parameter characterzation,” in Surfaces and Their Measurement (London: HPS), 48–95.
Keywords: microbial electrochemistry, microbial fuel cells, microbial electrochemical technologies, surface topography, copper, confocal microscopy, micro-structures, Geobacter
Citation: Moß C, Patil SA and Schröder U (2019) Scratching the Surface—How Decisive Are Microscopic Surface Structures on Growth and Performance of Electrochemically Active Bacteria? Front. Energy Res. 7:18. doi: 10.3389/fenrg.2019.00018
Received: 16 December 2018; Accepted: 11 February 2019;
Published: 05 March 2019.
Edited by:
Subba Rao Chaganti, University of Windsor, CanadaReviewed by:
Mohanakrishna Gunda, Qatar University, QatarMatteo Grattieri, The University of Utah, United States
Copyright © 2019 Moß, Patil and Schröder. This is an open-access article distributed under the terms of the Creative Commons Attribution License (CC BY). The use, distribution or reproduction in other forums is permitted, provided the original author(s) and the copyright owner(s) are credited and that the original publication in this journal is cited, in accordance with accepted academic practice. No use, distribution or reproduction is permitted which does not comply with these terms.
*Correspondence: Uwe Schröder, dXdlLnNjaHJvZWRlckB0dS1icy5kZQ==