 Despina Vamvuka
 Stelios Alexandrakis
 Michael Galetakis2
- 1Laboratory of Solid Fuels Beneficiation and Technology, Department of Mineral Resources Engineering, Technical University of Crete, Chania, Greece
- 2Laboratory of Quality Control-Health and Safety, Department of Mineral Resources Engineering, Technical University of Crete, Chania, Greece
The combustion performance of a bio-solid waste from a wastewater treatment plant was studied in terms of efficiency and gaseous emissions, by carrying out experiments in a bubbling fluid bed unit and was compared with that of an agricultural waste. The effects of excess air and fuel feeding rate were investigated and a factorial design and modeling was developed in order to provide optimal values of process variables for minimizing emissions. The results showed that sewage sludge fuel burned at a much lower temperature than the woody fuel. CO emissions were low, SO2 emissions from the agricultural waste negligible, while those of sewage sludge exceeded legislation limits when excess air was below 50%. An increase in excess air from 30 to 50%, or of fuel feeding rate from 0.48 to 0.6 kg/h, resulted in higher NOx emissions from the woody fuel, exceeding emission guidelines. Concerning SO2 and NOx emissions from sewage sludge fuel, the effect of feeding rate was the same, however that of excess air was opposite, reducing their levels in flue gases. Combustion efficiency for both fuels was high, between 98.5 and 99.6%. Factorial design analysis and modeling indicated that for the woody fuel the optimum emission performance was accomplished when the feeding rate was 0.48 kg/h and the excess air 30%. For the sewage sludge fuel the optimum combustion and emission performance was achieved when the feeding rate was 0.72 kg/h and the excess air 50%.
Introduction
The ever increasing quantities of urban wastes, which are generated by every social activity, are becoming matter of public concern, due to environmental and human health impacts. Sewage sludge generated by municipal wastewater treatment plants is produced in large quantities in modern industrialized countries. In European Union, wastewater treatment plants produce up to ~30 kg dry sludge per capita yearly (Van Caneghem et al., 2012). In Greece, about 120,000 tons, equivalent to 0.025 Mtoe, are annually produced (Panoutsou et al., 2009). Land disposal is not only an environmental issue, but also a non-viable solution, due to the limited number of available sites and the high cost. The progressive decrease of sewage sludge use in agriculture, due to pathogens and toxic heavy metals, further stimulates the investigation for alternative disposal methods. The Waste Framework Directive has set the hierarchy that energy exploitation precedes deposition in landfills, for the sustainable management of such urban wastes (Van Caneghem et al., 2012). In this context, thermal treatment for energy production is an attractive solution, by destroying hazardous constituents, reducing the disposal volume of these wastes and increasing economic returns to urban communities.
Combustion and co-combustion are currently considered the most suitable processes for the implementation of sewage sludge in power systems, contributing also to the net reduction of CO2 emissions to the atmosphere, due to its biogenic nature. Among combustion technologies, fluidized bed is most promising, due to its inherent advantages, such as fuel flexibility, good mixing and relative low temperature, high efficiency, low pollutant emissions, and destruction of pathogens (Werther and Ogada, 1999; Van Caneghem et al., 2012; Vamvuka and Alloimonos, 2017; Vamvuka et al., 2017).
The two-fold nature of sewage sludge, a biogenic component associated with an inorganic component, the variable composition unlike other biomass materials, the high moisture and volatile matter contents, or the presence of problematic elements in ashes, imply a thorough investigation of its behavior in thermal systems. Most researchers have focused on the co-combustion of sewage sludge with coal in fluidized bed systems and some in pulverized coal units (Murakami et al., 2009; Wiechmann et al., 2013; Zhu et al., 2015; Kumar and Singh, 2017). For most power plants, a sewage sludge content ranging up to 5% of fuel mass has proven to be a viable solution (Hroncova et al., 2018). Emission characteristics of organic compounds (Zhang et al., 2013) and heavy metals (Cenni et al., 1998; Lopes et al., 2003), as well as the eco-toxicological properties of ashes (Barbosa et al., 2009) have been evaluated. Also, oxy-fired fluidized bed combustion, to control CO2 emissions, was found to give some significant results (Jang et al., 2016; Kumar and Singh, 2017).
Despite several sewage sludge combustion units already exist (Syed-Hassan et al., 2017), there is still a lack of fundamental understanding of the basic mechanisms of sewage sludge conversion in fluid beds (Urciuolo et al., 2012) and there is a need to study how the different characteristics of such waste fuels influence feeding, primary and secondary air required, temperature profiles, physico-chemical changes of sewage sludge particles during combustion, flue gas emissions, effect of ashes on system performance, and combustion efficiency. Based on the above discussion, present work aimed at investigating the thermal valorization of sewage sludge from a wastewater treatment plant in the island of Crete, through combustion in a bubbling fluidized bed unit. The combustion of an agricultural waste, abundant in South European countries, namely olive stone, was also tested under the same conditions in the fluid bed system, aiming to evaluate its performance as a co- fuel with sewage sludge for future applications. Thermal behavior, gaseous emissions, and efficiency were determined as a function of excess air and reactor loading. Furthermore, a three-level factorial design of experiments in conjunction with the response surface methodology, based on fuel properties and operating conditions was developed, in order to provide optimal values for minimizing emissions. This wide accepted methodology uses statistical techniques to estimate the effect of process parameters (feed rate and excess air), to response variables (emissions). Present results are expected to be useful for future application of these waste materials in local thermal processes.
Experimental
Raw Materials and Characterization
The raw materials selected for this study were one agricultural waste olive stone (OS), as being abundant in the region of Crete and South Europe in general and one bio-solid, sewage sludge (SS), from the wastewater treatment plant of the city of Chania, in Crete. After air drying (moisture content as received: SS 70%, OS 5%), the materials were ground and sieved to a particle size of 1–2.8 mm. Before being used in combustion tests, the fuels were pre-dried overnight in the oven (for larger scale units the fuels could be dried by the flue gases).
After homogenization and riffling, fuel analyses were performed according to the European standards. A Na-feldspar NaAlSi3O8 with an average particle size of 283 μm, known to diminish agglomeration problems (Vamvuka et al., 2016), was used as inert bed material of the fluidization reactor.
Combustion Experiments
Combustion experiments were carried out in an atmospheric lab-scale bubbling fluidized bed reactor (Figure 1) with an inner diameter of 70 mm and a total height of ~2 m, described in detail in a previous study (Vamvuka et al., 2016). The principal parts of the reactor are 2 silos with screw feeders, one dosimetric and one for delivering the fuel fast 2 cm above the diffuser into the bed (equipped with a water jacket), reactor body equipped with controlled heating furnace, seven K-type thermocouples and a differential pressure transducer, a tangential flow type cyclone, a gas heat exchanger, a tar condenser, and a multi-component gas analyzer MadurGa-40plus with conditioning unit. Product gases were analyzed for CO2, CO, O2, SO2, and NOx contents every 5 s by the analyzer. Each emission measurement was estimated as the mean value (m) of ~50 successive readings. Furthermore, the standard error of the measurement was estimated from the calculated standard deviation (s) at 95% confidence level. These uncertainties are shown as error bars in the constructed relevant diagrams.
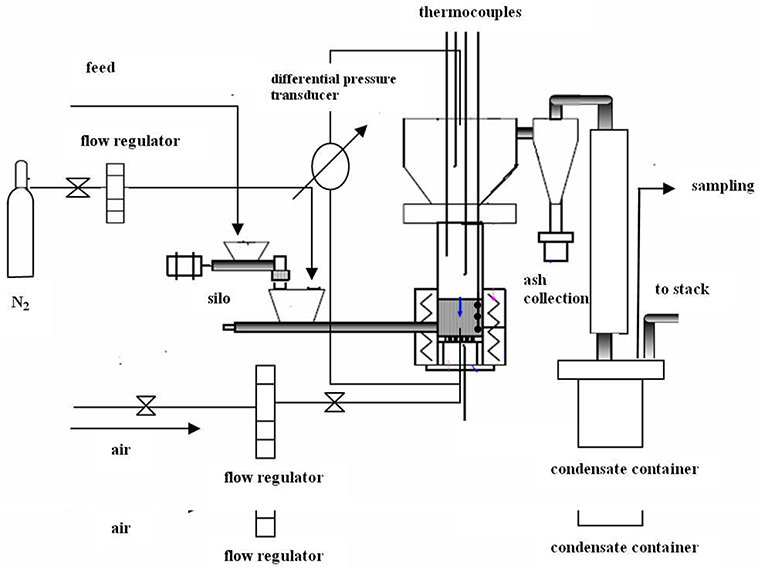
Figure 1. Schematic diagram of the fluidized bed system.
The minimum fluidization velocity (0.12 m/s) was determined by measuring the pressure drop across the bed and air diffuser plate vs. the superficial air velocity, using a cold reactor model. The preheating temperature of air was ~550°C. For each fuel, feed rate and excess air were selected as the principal independent variables. Feed rates varied between 0.48 and 0.72 kg/h and excess air ratios between 1.3 and 1.5. At the end of each run, fly ash and bed material were drained, weighed and analyzed for unburned carbon, while the latter was sieved to remove ash and attrited particles and made up with fresh feldspar prior to be used in the following test. During the experiments no signs of agglomeration were observed. The results were the average of two replications. All data was displayed and logged on a computer via a data acquisition unit.
Factorial Design and Modeling
A full factorial experimentation was adopted to investigate how the changes in process factors (feed rate and excess air) affect the response variables (CO, SO2, and NOx emissions). The feed rate and the excess air ratio were studied in three levels: 0.48, 0.6, and 0.72 kg/h and 1.3, 1.4, 1.5, respectively. This type of experimentation results in 9 different combinations for each fuel (OS and SS).
For the evaluation of such factorial design experimental results, the methodology suggested by Myers (1999) and Myers and Montgomery (2002) was used. This includes the estimation of the main effects and interactions of process factors on the response variables, as well as the development of polynomial models, linking response variables with process factors. The main effect of a process factor is estimated as the difference between the response of a factor at the high level and at the low level, when all other factors are adjusted at their central values (midway between their low and high levels). The interactions between two factors express the additional effect of one factor, when the other one is held at its high level. Interactions occur when the effect of one factor is different at various levels of the other factor. For each experiment, the response was calculated from a great number of data. The average value and the average error were also estimated.
Results
Fuel Characterization
Proximate and ultimate analyses of the two fuels are compared in Table 1. Both fuels were rich in volatile matter, however the higher content of ash and lower of carbon for sewage sludge resulted in a lower calorific value. The gross calorific value of these materials was significant and comparable to the upper limit of low rank coals. Chlorine content, related to corrosion and fouling was low, in contrast to nitrogen and sulfur contents of sewage sludge, which were high, revealing increased oxide emissions during combustion.

Table 1. Proximate and ultimate analyses and calorific value of the samples (% dry weight).
Axial Temperature Profiles, Flue Gas Emissions, and Combustion Efficiency at Fixed Operating Conditions
Temperature Profiles
Figure 2 depicts the temperature profiles along the reactor height at a feeding rate of 0.72 kg/h, an excess air ratio λ = 1.4 and steady state conditions. As can be observed, olive stone and sewage sludge behaved differently. Although both fuels reached a maximum temperature just 30 mm above the air diffuser within the bed, due to volatiles combustion, olive stone having higher carbon content and calorific value whereas lower content of ash (Table 1), burned at a much higher temperature, 849°C against 787°C for sewage sludge, which decreased rapidly toward the end of the expanded bed (>250 mm), as the heat transfer rate between the dense phase and the freeboard was higher in this region. Olive stone temperature gradually decreased in the freeboard zone and in the conical section of the furnace (not shown in the graph) reached a value of 400°C. On the other hand, the temperature profile of sewage sludge was almost uniform along the reactor (775–787°C), indicating that volatiles were released at a lower rate than olive stone and burned together with char. In the conical section sewage sludge attained a temperature of 440°C.
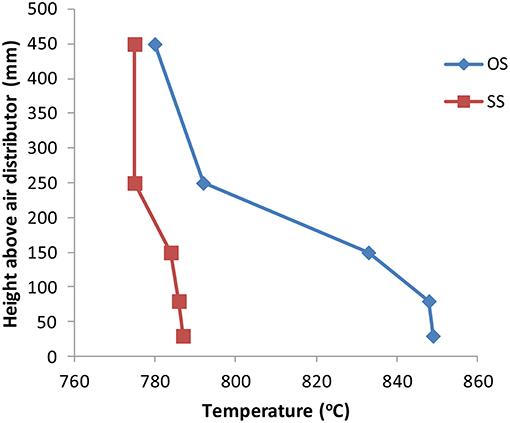
Figure 2. Temperature profiles of the fuels along the reactor height at F = 0.72 kg/h and λ = 1.4.
Flue Gas Emissions
The emissions of pollutant gases (average values ± standard error) at a feeding rate of 0.72 kg/h and excess air ratio λ = 1.4 are presented in Figure 3. The estimated standard error, expressed as relative error, was 4–5% for all measured emission gases. CO levels were kept well below legislation limits for small units (Hellenic Organization for Standardization, 2011; Jin et al., 2013). The lower concentration of CO emitted from olive stone is owned to the higher combustion temperature of this fuel. The higher emissions of CO from sewage sludge are attributed to the lower reactor temperature in this case, the carryover of particles into the freeboard resulting in insufficient time for CO to be oxidized in the upper part of the furnace and possibly the higher ash content of this fuel as compared to olive stone, which could weaken oxygen diffusion to the particles.
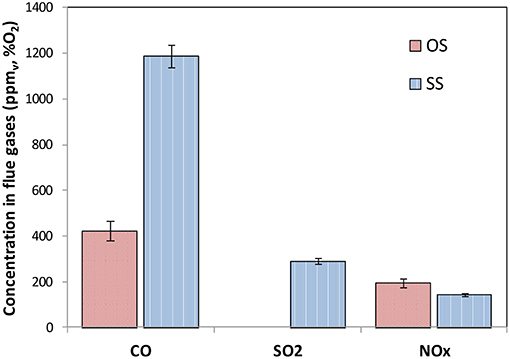
Figure 3. Flue gas emissions, average (± standard error), of fuels, at F = 0.72 kg/h and λ = 1.4.
SO2 level for olive stone was practically null, due to the low sulfur content of this sample, while that for sewage sludge exceeded emission guidelines (FEK, 2005). Consequently, primary or secondary measures, such as use of sulfur absorbent materials within the bed, or flue gas cleaning should be taken to meet legislation.
As concerns NOx emissions, Figure 3 shows that despite the greater amount of fuel-N of sewage sludge sample, NOx values of olive stone were higher and somehow over allowed limits for small units (Hellenic Organization for Standardization, 2011). This behavior can be explained by the fact that for waste biomass materials, such as sewage sludge, nitrogeneous compounds, mainly NH3 and HCN or hydrocarbon radicals evolving during thermal treatment, create a reducing environment diminishing NOx formation (Van Caneghem et al., 2012; Jin et al., 2013; Vamvuka et al., 2016). Therefore, in this case several measures such as air staging, flue gas recirculation or flue gas treatment are required to meet emission standards.
Combustion Efficiency
The combustion efficiencies of the materials studied presented in Table 2 are seen to be high, ranging between 98.7 and 99.5%. These values were controlled by the CO levels in flue gases, which represented the principal heat losses due to incomplete combustion of gases in the freeboard zone (LCO). Thus, olive stone, which was burned at a higher temperature and had lower CO emissions, attained a higher efficiency than sewage sludge. Furthermore, it can be observed that combustion loss deduced from the fly ash (Lfa) had the largest portion in the total loss in ash (loss from bottom ash Lba and fly ash Lfa). However, heat losses due to unburned carbon in ashes had a minor effect on efficiency.
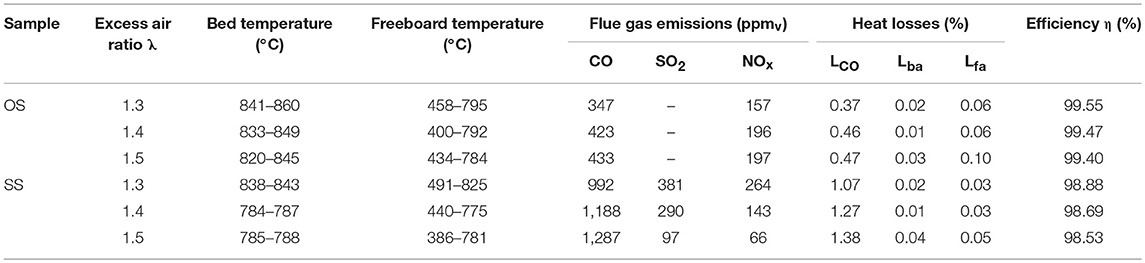
Table 2. Fluidized bed combustion performance of fuels at different excess air ratios and feed rate 0.72 kg/h.
Axial Temperature Profiles, Flue Gas Emissions, and Combustion Efficiency at Various Operating Conditions
Temperature Profiles
The axial temperature distribution along the reactor as a function of stoichiometric air ratio λ is represented in Table 2. As can be observed, when excess air ratio was increased from 1.3 to 1.5 combustion temperature within the bed and the freeboard was lowered for both fuels, due to the dilution effect of excessive air, which caused flue gas cooling. The drop in temperature for olive stone was up to 21°C, however for sewage sludge it was higher, up to 58°C. Thus, when air velocity was lower (at λ = 1.3), the residence time of sewage sludge fuel within the bed was greater and the fuel burned at a higher temperature (843°C).
Furthermore, Table 3 shows that when the feeding rate of the fuels was raised, at constant excess air percentage, combustion temperature of olive stone increased up to 68°C, while that of sewage sludge decreased by ~10°C in the bed. This behavior reveals that a higher reactor loading with sewage sludge fuel, the content of which in ash was high, created a fuel-rich zone within the bed, which lowered oxygen concentration to the particles, resulting in reduced burnout and consequently a drop of temperature.
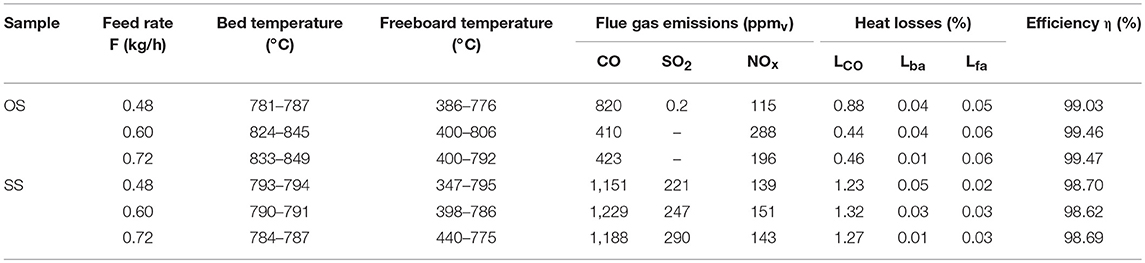
Table 3. Fluidized bed combustion performance of fuels at different feed rates and excess air ratio 1.4.
Flue Gas Emissions
As concerns flue gas emissions, Figure 4 illustrates that when excess air was increased CO levels were higher, due to the temperature reduction in the furnace, as previously shown. All values were below legislation limits (Hellenic Organization for Standardization, 2011; Jin et al., 2013). For olive stone SO2 emissions were negligible, even when the amount of air was increased. Also, NOx emissions increased with excessive air, pointing to a fuel- NOx formation mechanism. On the other hand, for sewage sludge fuel both SO2 and NOx emissions decreased, when excess air ratio was raised from 1.3 to 1.5. This drop was most probably attributed to the lower combustion temperatures attained in the reactor in this case (about 55°C lower, as Table 2 shows), which counteracted the formation of sulfur and nitrogen oxides. The values obtained at λ = 1.3 and λ = 1.4 exceeded emission guidelines (EC, 2001; Hellenic Organization for Standardization, 2011) and several measures should be taken, such as use of sulfur absorbents for SO2 and air staging, flue gas recirculation or flue gas treatment for NOx.
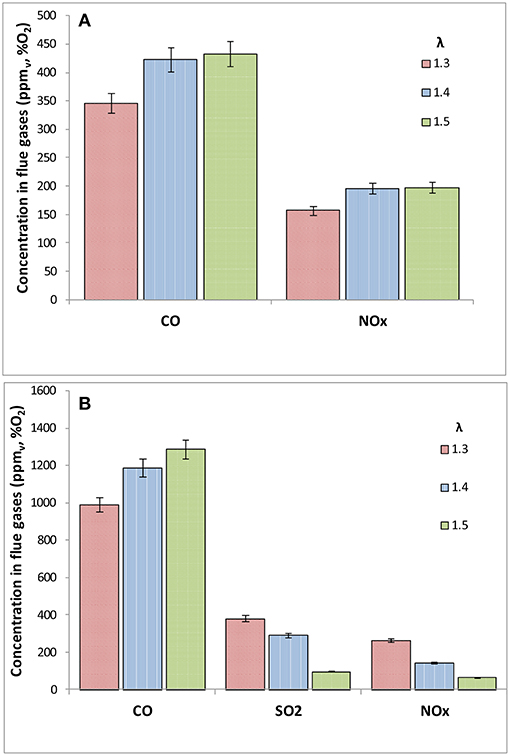
Figure 4. Effect of excess air ratio on average (± standard error) flue gas emissions of (A) OS and (B) SS fuels at F = 0.72 kg/h.
The effect of reactor loading on pollutant emissions is shown in Figure 5. As can be seen, CO levels in flue gas were dependent on combustion temperature. Thus, for olive stone, by increasing the feed rate the CO concentration was reduced, due to the higher temperatures and improved burnout of the fuel. For sewage sludge fuel, where the temperature difference between low and high feeding rate was small, CO levels were similar. Moreover, Figure 5 indicates that when feed loading was raised from 0.48 to 0.6 kg/h, SO2 and NOx emissions were higher, as they originated from the sulfur and nitrogen content of the fuel. The mitigation of NOx production at the higher feed rate (0.72 kg/h) is most probably attributed to the greater amount of volatiles fed with the fuel in this case, which created an oxygen-lean zone suppressing NOx formation. All CO values recorded were in accordance to guideline limits (Hellenic Organization for Standardization, 2011; Jin et al., 2013), however those of SO2 for sewage sludge fuel and NOx for olive stone fuel at loadings higher than 0.48 kg/h, were outside legislation limits (EC, 2001; Hellenic Organization for Standardization, 2011).
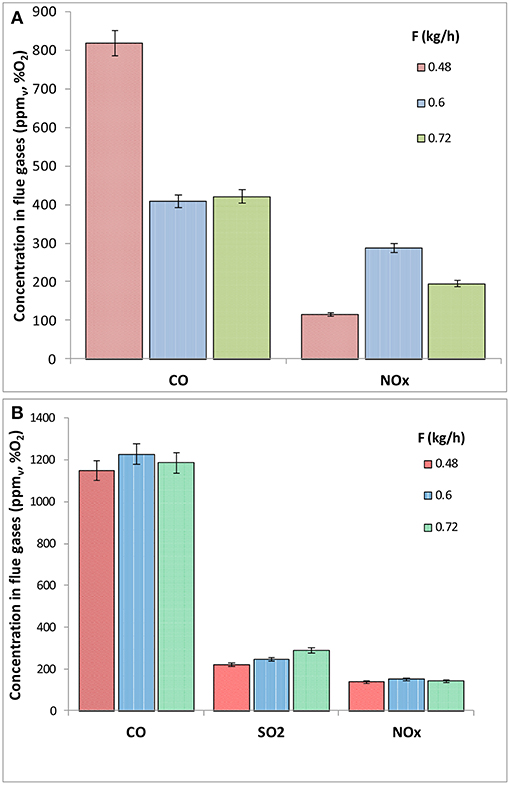
Figure 5. Effect of fuel feed rate on average (± standard error) flue gas emissions for (A) OS and (B) SS fuels at λ = 1.4.
Present gaseous emission values could not be directly compared to literature data, not only due to different experimental equipment and conditions, but also due to the fact that sewage sludge has been mainly studied for co-combustion with coal or other biomass fuels. Some results on the combustion of semi-dried sludge in a semi-pilot scale fluidized bed fed with 3 t/h (Sanger et al., 2001), showed NOx emissions to vary between 50 and 500 mg/m3 for 11% O2 in flue gas. In another investigation (Cammarota et al., 2013), where sewage sludge was conditioned with polyelectrolytes or inorganics, for feed rates about 1 kg/h and λ = 1.5, CO emissions varied between 700 and 1,300 ppm, SO2 emissions between 700 and 750 ppm, and NOx emissions between 250 and 2,400 ppm at about 7% O2 in flue gas. Combustion efficiencies ranged between 98.7 and 99.5%.
As concerns olive stone, the most relevant publication for olive cake (Akpulat et al., 2010) reported, for feed rate 1.3 kg/h and λ = 1.2–2.5, CO emissions ~3,000–11,000 mg/m3, SO2 emissions ~50–750 mg/m3, and NOx emissions ~500–1,500 mg/m3 at 6% O2 in flue gas. Generally, CO and NOx values of present study were similar or lower to those reported for other biomass fuels burned in small-scale fluidized bed units, which varied between 100 and 23,000 ppm (Khan et al., 2008; Akpulat et al., 2010) and 100–1,200 ppm (Madhiyanon et al., 2010; Arromdee and Kuprianov, 2012), respectively.
Combustion Efficiency
By comparing efficiency values in Tables 2, 3 it can be seen that variations with excess air or fuel feeding rate were small, as the principal heat losses due to incomplete combustion of flue gases in the freeboard area (LCO) were very low. Unburned carbon in fly ashes (Lfa) was higher than that of bottom ashes (Lba), but still minor. The higher temperatures attained in the reactor, at diminishing excess air, resulted in lower heat losses for both fuels, leading to improved burnout and higher efficiency. The same was true for the lower feed rate in the case of sewage sludge, whereas the higher feed rate in the case of olive stone fuel. Nevertheless, all values were high and ranged from 98.5 to 99.6% under the conditions studied.
Factorial Design Analysis and Optimization Model
The estimated values of main effects and interactions of the process variables (feed rate, excess air) on the CO, SO2, and NOx emissions for both fuels are given in Table 4. The effects on SO2 emissions were estimated only for sewage sludge, since for olive stone were negligible.
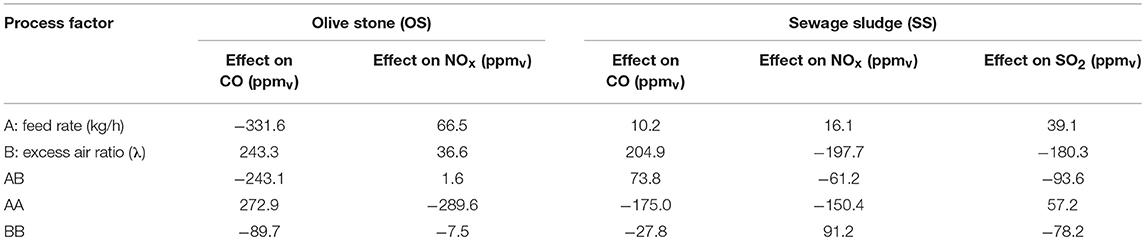
Table 4. Main effects and interactions of feed rate (F) and excess air (λ) on the emissions (CO, NOx, and SO2) for both fuels.
Results clearly indicate the strong negative effect of feed rate (A) on CO emissions for olive stone. In contrast, for sewage sludge the feed rate had a slight positive effect on CO emissions. Feed rate had positive effect on NOx emissions for both fuels. Regarding the excess air ratio (λ), it had a strong positive effect on CO and NOx emissions for olive stone. In the case of sewage sludge, it had also a strong positive effect on CO emissions, but a negative one on NOx emissions. As far as SO2 emissions are concerned, from Table 4 it is clear that the excess air ratio λ was the dominant factor that affected SOx emissions (strong negative effect), followed by the feed rate (positive effect). The interaction (AB) and the higher order effects (AA and BB) of feed rate and excess air ratio were significant, indicating the non-linear relations between the process factors and the response variables. The regression equations of the fitted empirical models, which relate response with process factors, are:
For olive stone:
For sewage sludge:
where: emissions CO, NOx and SO2 are in ppmv, λ = excess air ratio, and F = Feed rate in kg/h.
The above regression equations were used to determine the optimal values of F and λ, which minimize emissions. For olive stone fuel, CO emissions were significantly lower to the permissible national limits (Hellenic Organization for Standardization, 2011), thus the goal of the optimization was to minimize NOx emissions. Figure 6 presents the variation of NOx emissions over the examined region of F and λ. The combination of F and λ which minimized NOx emissions is F = 0.48 kg/h and λ = 1.3. On the other hand, for sewage sludge fuel the goal of optimization was to minimize simultaneously SO2 and NOx emissions. CO emissions for SS were also below the permissible limits. Figure 7 shows the variation of SO2 and NOx emissions over the examined region of F and λ. SO2 and NOx emissions show similar variation within the examined region, as a result of their strong positive correlation illustrated in Figure 8. Thus, the minimization of NOx led also to the minimization of SO2. The combination of F and λ, which minimized simultaneously NOx and SO2 emissions is F = 0.72 kg/h and λ = 1.5.
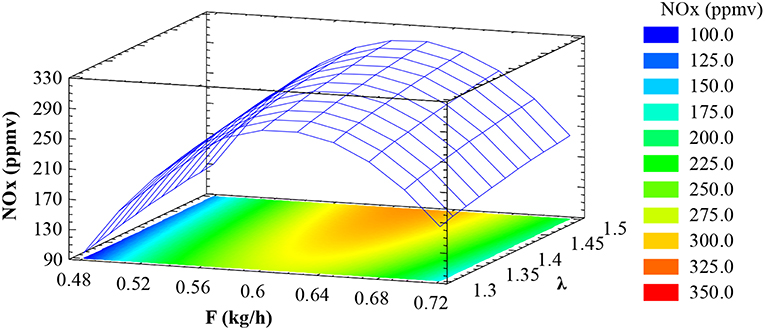
Figure 6. Response surface plot showing the effect of feed rate (F) and excess air ratio (λ) on NOx emissions of OS fuel.
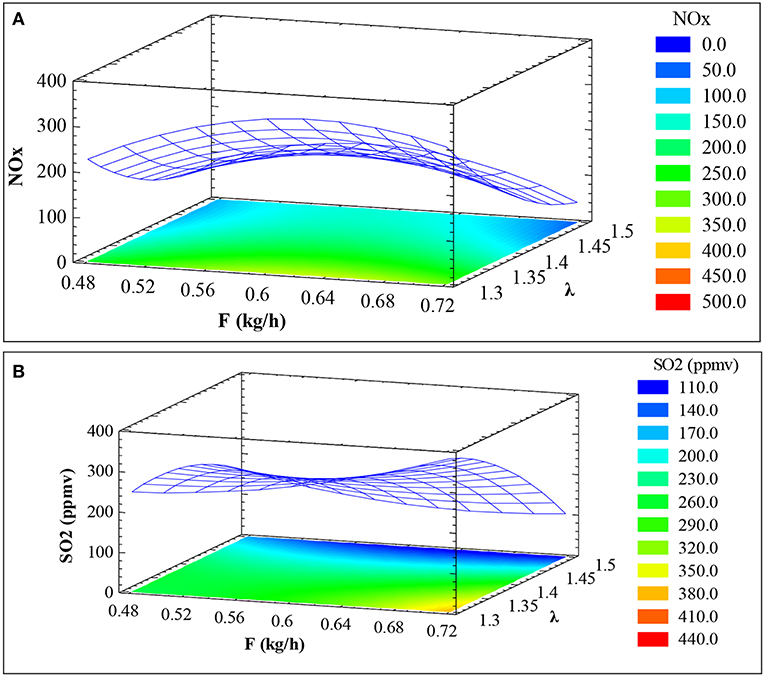
Figure 7. Response surface plot showing the effect of feed rate (F) and excess air ratio (λ) on (A) NOx and (B) SO2 emissions of SS fuel.
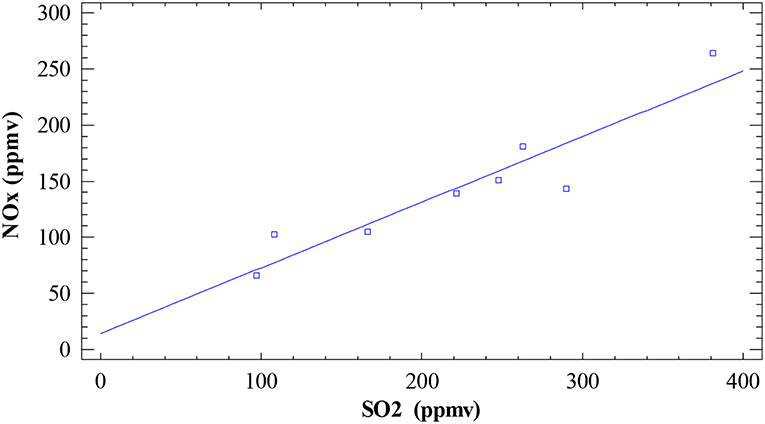
Figure 8. Correlation plot between SO2 and NOx emission for SS fuel.
Conclusions
During fluidized bed combustion tests, olive stone fuel burned mostly within the bed, while sewage sludge fuel burned uniformly along the reactor column at a lower temperature by about 60°C. CO levels in flue gases were well below legislation limits, with those of sewage sludge being higher due to the reduced reactor temperatures. SO2 emissions from olive stone were negligible, whereas those of sewage sludge exceeded legislation limits, except when excess air was high (50%) and the temperature reduced. However, NOx emissions followed the opposite trend, even though olive stone had lower nitrogen content.
CO levels in flue gases were strongly dependent on combustion temperature and increased with excess air, due to gas cooling. An increase in excess air from 30 to 50% or of the feeding rate from 0.48 to 0.6 kg/h resulted in higher NOx emissions from olive stone pointing to a fuel-NOx formation mechanism. Values at loading higher than 0.48 kg/h were outside emission guidelines. However, although the effect of feeding rate was the same for sewage sludge fuel too as concerns SO2 and NOx emissions, the effect of excess air ratio was opposite, reducing SO2 and NOx concentrations in flue gases, because the reactor temperature was quite low in this case. Combustion efficiencies for both fuels were high (98.5–99.6%), as heat losses were very low.
According to the factorial design analysis, the optimum emission performance was achieved in the case of olive stone fuel, when the combustor was operated at reduced loading and excess air ≤ 30%. For sewage sludge the optimum emission performance was achieved when the combustor was operated at higher loading and excess air 50%.
Author Contributions
DV writer of paper, experimental tests, and evaluation of results. SA experimental tests and evaluation of results. MG modeling and evaluation of results.
Conflict of Interest Statement
The authors declare that the research was conducted in the absence of any commercial or financial relationships that could be construed as a potential conflict of interest.
Acknowledgments
The authors kindly thank the laboratories of Hydrocarbons Chemistry and Technology and Toxic and Hazardous Waste Management, of the Technical University of Crete for the ultimate analysis and the calorific value measurements of the samples.
References
Akpulat, O., Varol, M., and Atimtay, A. (2010). Effect of freeboard extension on co-combustion of coal and olive cake in a fluidized bed combustor. Bioresour. Technol. 101, 6177–6184. doi: 10.1016/j.biortech.2010.03.022
Arromdee, P., and Kuprianov, V. (2012). Combustion of peanut shells in a cone-shaped bubbling fluidized-bed combustor using alumina as the bed material. Appl. Energy 97, 470–482. doi: 10.1016/j.apenergy.2012.03.048
Barbosa, R., Lapa, N., Boavida, D., Lopes, H., Gulyurtlu, I., and Mendes, B. (2009). Co-combustion of coal and seage sludge: chemical and ecotoxicological properties of ashes. J. Hazard. Mater. 170, 902–909. doi: 10.1016/j.jhazmat.2009.05.053
Cammarota, A., Chirone, R., Salatino, P., Solimene, R., and Urciuolo, M. (2013). Particulate and gaseous emissions during fluidized bed combustion of semi-dried sewage sludge: effect of bed ash accumulation on NOx formation. Waste Manag. 33, 1397–1402. doi: 10.1016/j.wasman.2013.02.016
Cenni, R., Frandsen, F., Gerhardt, T., Spliethoff, H., and Hein, K. R. G. (1998). Study on trace metal partitioning in pulverized combustion of bituminous coal and dry sewage sludge. Waste Manag. 18, 433–444. doi: 10.1016/S.0956-053X.(98)00127-5
EC. (2001). Directive/80/EC of the European Parliament and of the Council of 23 October 2001. Limitation of Emissions of Certain Pollutants into the Air From Large Combustion Plants.
Hellenic Organization for Standardization. (2011). Limit Values for CO and NOx Emissions for New Thermal Units Using Solid Biofuel. EN 303.05/1999.
Hroncova, E., Ladomersky, J., and Musil, J. (2018). Problematic issues of air protection during thermal processes related to the energetic uses of sewage sludge and other waste. Case study: co-combustion in peaking power plant. Waste Manag. 73, 574–580. doi: 10.1016/j.wasman.2017.08.025
Jang, H., Kim, J., Back, S., Sung, J., Yoo, H., Choi, H., et al. (2016). Combustion characteristics of waste sludge at air and oxy-fuel combustion conditions in a circulating fluidized bed reactor. Fuel 170, 92–99. doi: 10.1016/j.fuel.2015.12.033
Jin, Y., Lu, I., Ma, X., Liu, H., Chi, Y., and Yoshikawa, K. (2013). Effects of blending hydrothermally treated municipal solid waste with coal on co-combustion characteristics in a lab-scale fluidized bed reactor. Appl. Energy 102, 563–570. doi: 10.1016/j.apenergy.2012.08.026
Khan, A., Aho, M., deJong, W., Vainikka, P., Jansens, P., and Spliethoff, H. (2008). Scale-up study on combustibility and emission formation with two biomass fuels (B quality wood and pepper plant residue) under BFB conditions. Biomass Bioenergy 32, 1311–1321. doi: 10.1016/j.biombioe.2008.03.011
Kumar, R., and Singh, R. I. (2017). An investigation of co-combustion municipal seage sludge with biomass in a 20kW BFB combustor under air-fired and oxygen-enriched condition. Waste Manag. 70, 114–126. doi: 10.1016/j.wasman.2017.09.005
Lopes, M. H., Abelha, P., Lapa, N., Oliveira, J. S., Cabrita, I., and Gulyurtlu, I. (2003). The behavior of ashes and heavy metals during the co-combustion of sewage sludge in a fluidized bed. Waste Manag. 23, 859–870. doi: 10.1016/S0956-053X(03)00025-4
Madhiyanon, T., Sathitruangsak, P., and Soponronnarit, S. (2010). Combustion characteristics of rice-husk in a short-combustion chamber fluidized bed combustor (SFBC). Appl. Therm. Eng. 30, 347–353. doi: 10.1016/j.applthermaleng.2009.09.014
Murakami, T., Suzuki, Y., Nagasawa, H., Yamamoto, T., Koseki, T., Hirose, H., et al. (2009). Combustion characteristics of sewage sludge in an incineration plant for energy recovery. Fuel Process. Technol. 90, 778–783. doi: 10.1016/j.fuproc.2009.03.003
Myers, R. H. (1999). Response surface methodology-current status and future directions. J. Qual. Technol. 31, 30–44. doi: 10.1080/00224065.1999.11979891
Myers, R. H., and Montgomery, D. C. (2002). Response Surface Methodology: Product and Process Optimization Using Designed Experiments, 2nd Edn. New York, NY: John Wiley and Sons.
Panoutsou, P., Eleftheriadis, J., and Nikolaou, A. (2009). Biomass supply in EU27 from 2010 to 2030. Energy Policy 37, 5675–5686. doi: 10.1016/j.enpol.2009.08.032
Sanger, M., Werther, J., and Ogada, T. (2001). NOx and N2O emission characteristics from fluidized bed combustion of semi-dried municipal sewage sludge. Fuel 80, 167–177. doi: 10.1016/S0016-2361(00)00093-4
Syed-Hassan, S. S., Wang, Y., Hu, S., Su, S., and Xiang, J. (2017). Thermochemical processing of sewage sludge to energy and fuel: fundamentals, challenges and considerations. Renew. Sust. Energy Rev. 80, 888–913. doi: 10.1016/j.rser.2017.05.262
Urciuolo, M., Solimene, R., Chirone, R., and Salatino, P. (2012). Fluidized bed combustion and fragmentation of wet sewage sludge. Exp. Therm. Fluid Sci. 43, 97–104. doi: 10.1016/j.expthermflusci.2012.03.019
Vamvuka, D., and Alloimonos, N. (2017). Combustion behavior of olive pruning/animal manure blends in a fluidized bed combustor. Heliyon 3, 1–16. doi: 10.1016/j.heliyon.2017.e00385
Vamvuka, D., Papas, M., Alloimonos, N., and Kapenekaki, M. (2017). Evaluation of meat and bone meal as a secondary fuel with olive byproducts in a fluidized bed unit. Performance and environmental impact of ashes. Energy Fuels 31, 7214–7222. doi: 10.1021/acs.energyfuels.7b00957
Vamvuka, D., Papas, M., Geletakis, M., and Sfakiotakis, S. (2016). Thermal valorization of an animal sludge for energy recovery via co-combustion with olive kernel in a fluidized bed unit: optimization of emissions. Energy Fuels 30, 5825–5834. doi: 10.1021/acs.energyfuels.6b00961
Van Caneghem, J., Brems, A., Lievens, P., Block, C., Billen, P., Vermeulen, I., et al. (2012). Fluidized bed waste incinerators: design, operational and environmental issues. Prog. Energy Combust. Sci. 38, 551–582. doi: 10.1016/j.pecs.2012.03.001
Werther, J., and Ogada, T. (1999). Sewage sludge combustion. Prog. Energy Combust. Sci. 25, 55–116. doi: 10.1016/S0360-1285(98)00020-3
Wiechmann, B., Dienemann, C., Kabbe, C., Brandt, S., Vogel, I., and Roskosch, A. (2013). Sewage Sludge Management in Germany. Umweltbundesamt (UBA), Dessau-Roßlau.
Zhang, G., Hai, J., Cheng, J., Cai, Z., Ren, M., Zhang, S., et al. (2013). Evaluation of PCDD/Fs and metals emission from a circulating fluidized bed incinerator co-combusting sewage sludge with coal. J. Environ. Sci. 25, 231–235. doi: 10.1016/S1001-0742(12)60009-6
Keywords: sewage sludge, fluidized bed, combustion, emissions, modeling
Citation: Vamvuka D, Alexandrakis S and Galetakis M (2019) Combustion Performance of Sludge From a Wastewater Treatment Plant in Fluidized Bed. Factorial Modeling and Optimization of Emissions. Front. Energy Res. 7:43. doi: 10.3389/fenrg.2019.00043
Received: 29 November 2018; Accepted: 18 April 2019;
Published: 07 May 2019.
Edited by:
Peter Bakonyi, University of Pannonia, HungaryReviewed by:
Fabrizio Scala, University of Naples Federico II, ItalyFehmi Akgun, TUBITAK Marmara Research Centre Energy Institute, Turkey
Copyright © 2019 Vamvuka, Alexandrakis and Galetakis. This is an open-access article distributed under the terms of the Creative Commons Attribution License (CC BY). The use, distribution or reproduction in other forums is permitted, provided the original author(s) and the copyright owner(s) are credited and that the original publication in this journal is cited, in accordance with accepted academic practice. No use, distribution or reproduction is permitted which does not comply with these terms.
*Correspondence: Despina Vamvuka, dmFtdnVrYUBtcmVkLnR1Yy5ncg==