 Chunhui Zhang
 Jiyang Yu
 Xianping Zhong
 Muhammad Saeed
- Department of Engineering Physics, Tsinghua University, Beijing, China
Since the Fukushima nuclear power plant accident, the nuclear safety experts devote a number of efforts to explore the potential risk of hydrogen detonation and measures for the mitigation of hydrogen safety during a severe accident in the nuclear power plant. A series of experiments have been performed to investigate the behavior of hydrogen distribution during a severe accident in the nuclear power plant. This study aims to investigate the gaseous stratification break-up phenomenon in the presence of a vertical gas fountain on the top of containment using Code_Saturne. The computed results not only analyze the flow field of the gas and the density distribution in the containment, but also measure the adequacy of Code_Saturne concerning the multi-component gas flow calculation.
Introduction
A severe accident occurred as a result of huge earthquake at the Fukushima Daiichi Nuclear Power Plant, located in the East Pacific Ocean in Japan, on March 11, 2011 (IAEA, 2015). In this accident, the loss of backup power caused the core to lose continuous cooling of the coolant and finally led to the melting of the core. Then the hydrogen generated during the process of cladding oxidation. As the generated hydrogen reached to a certain concentration, an explosion occurred in the nuclear power plant. Since then, the research on hydrogen safety in the containment of nuclear power plants during a severe accident has become a hot topic for the nuclear safety experts.
Due to the existence of the buoyancy force, hydrogen will accumulate in the upper region of the containment (Rodi, 1982). When the local hydrogen and oxygen concentration reaches to a specific value, the explosion or combustion will occur, which results in worse consequences. It is worth noting that in this process, the mixed gas will be stratified due to the difference of density. As the hydrogen rises due to its lower density, the gas between the top of the containment and the source of hydrogen will be converted into hydrogen plus air. The mass fraction of hydrogen in the mixed gas increases with height, so that the density of the mixed gas decreases with height, and the stratification will take place in the mixed gas. The situation mentioned above is an ideal state and does not consider the influence and destruction of other phenomena. In the actual containment of nuclear power plant, there are several phenomena that may break the gas stratification during severe accident such as injection of a sprinkler system, hydrogen recombiner and gas injection, etc. Moreover, the steam will condensate on the wall, which leads to passive heat transfer and mass transfer. It will cause buoyancy-driven flow and exacerbate gas mixing. However, it does not mean that the hydrogen stratification will not occur during a severe accident. Taking the LOCA accident of the pressurized water reactor as an example, for the pressurized water reactor which using vertical steam generator and higher containment, the main circuit is located in the lower position of the containment while the blasting valve of the pressure regulator relief box is located in the higher position. During the accident, the hydrogen and water vapor will be released if the main circuit break and a huge amount of substances and energy will be released in the lower portion of the containment. If the containment has internal and external parts, it will easily generate circulating flow, which exacerbates mixing. If the rupture is near the regulator release valve, the mass source and energy source will appear at a higher position in the containment. Then the gas stratification may occur. This phenomenon has already been observed in the PHDR(Projekt HDR-Sicherheitsprogramm) experiment (IAEA-TECDOC-1661, 2011).
In order to study these phenomena in depth, the researchers have performed a lot of experimental projects and also developed some code to tackle this problem. In 2006, Auban et al. performed an experiment with horizontal jet steam in the air using the PANDA(located at PSI in Switzerland) experimental facility (Auban et al., 2007). The ThAI (Thermal-hydraulics, Hydrogen, Aerosol, and Iodine) experimental facility was also used to perform horizontal steam jet in a layered helium mixture (Allelein et al., 2007). In 2008, Gupta et al. performed several tests focused on the possibility of the permanence of hydrogen stratification just beneath the containment dome under conditions determined by low velocity and a plume or jet of higher density (Gupta et al., 2008). In 2009, Mott and Woods investigated the mixing of a stratified fluid of finite volume by a turbulent buoyant plume (Mott and Woods, 2009). In 2007, Guyez et al. made an investigation on turbulent mixing at a stable density interface (Guyez et al., 2007).
Model of Code_Saturne
Code_Saturne is a general purpose computational fluid dynamics (CFD) free computer software package developed by EDF(Electricite De France). It solves the Navier-Stokes equations for 2D, 2D-axisymmetric and 3D flows, steady or unsteady, laminar or turbulent, incompressible or weakly dilatable, isothermal or not, with scalars transport if required (Archambeau et al., 2004).
The mass conservation equation is given by1:
where ρ refers to the density of the fluid, U refers to the velocity of the fluid and Γ refers to the mass source term. This term is included in the mesh located near the air injection nozzle in this work.
The momentum conservation equation is given by
where refers to additional momentum source term. The mesh located near the air injection nozzle products momentum source due to mass source in this work. σ refers to the Reynolds stress tensor. Here we take the k-ε model as an example, The expression of σ is:
Experiment Introduction and Model Building
Experiment Introduction
In 2008, CEA(French Atomic Energy Commission) and LEEF(Experimental Fluid Mechanics Laboratory) performed an experiment of vertical fountain in the erosion of gaseous stratification on small scale. Helium is used to simulate hydrogen released by cladding metal water reaction in the experiment for safety reasons. The purpose of this experiment was to study the effect of air fountain in the low-density gaseous stratification in the top part of the containment (INSAG, 1996; Deri et al., 2010).
The facility of this experiment is a transparent box whose height is 1.29 m and the bottom is a square of 0.92 m side length as shown in Figure 1. There is a gap of 0.06 m height on the wall near the bottom of the box which is the outlet to the environment. The environmental condition is 1 atm and room temperature. There is a vertical air inlet of 0.02 m diameter at the center of the bottom. Six thermoelectric sensors were installed at different heights on one wall to measure the concentration of helium at these positions. The six positions are 0.49 m, 0.69 m, 0.83 m, 0.96 m, 1.09 m, and 1.29 m high, respectively.
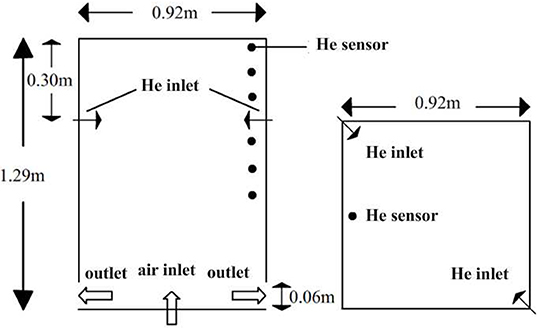
Figure 1. Experiment facility.
At the beginning of the experiment, the box was filled with air. Then a 9.1 g helium was injected horizontally at 0.99 m high during 300 s and the overflowed air was exhausted through the outlet. The gaseous stratification was formed and the gas free diffused for 60 s after the helium injection. The air was injected vertically from the inlet in the center of the bottom during 360 s to 660 s. The experiment tested six different velocities of air injection to observe the influence on the erosion of the gaseous stratification. The gas free diffused after 660 s and the experiment continued till 2000 s. The six different velocities tested in the experiment are 0.411 m/s, 0.849 m/s, 1.286 m/s, 1.929 m/s, 2.803 m/s, 5.143 m/s, respectively.
According to the experimental results, the erosion effect caused by different air inject velocities are divided into three regimes. When the velocity is small, the molecular diffusion is dominant in the mix of gas. As the velocity increases, the buoyancy become more dominant in the mix of gas and the stratification zone was push upward. If the velocity continuously increases, the injected air will reach to the top and will break the stratification zone directly. Under this circumstance, the momentum is dominant in the mix of gas.
In order to distinguish these three regimes, a dimensionless number called Froude number was introduced as following:
where L refers to local inject diameter; Urefrefers to the velocity of air injection in the stratification zone; N is the characterized parameter of stratification zone defined as:
where ρ1and ρ2 are, respectively, the density of the bottom and the upper zone.
According to the experimental data, six Froude numbers(0.16, 0.33, 0.50, 0.75, 1.09, 2.00) are chosen to observe the three regimes mentioned above. When Froude number = 2, an immediate mixing occurs. On the other hand, when Froude number less than 1, the buoyancy overwhelms the momentum and the air injection is thus unable to penetrate the stratification. So the Froude number 1.09 is known as the demarcation of the buoyancy-dominant regime and the momentum-dominant regime (Deri et al., 2010). In order to verify the ability to simulate the three regimes(free diffusion, buoyancy and momentum) by Code_Saturne, we choose Froude number = 1.09 for the final simulation.
Geometry Model
The whole geometry was simplified as a three-dimensional quarter size to reduce the simulation time and simplify the computation. Symmetry condition was imposed for the whole domain and simulated the same problem in the remaining experimental domain. The diameter of air inlet is 0.02 m, so we use a square inlet with 0.01 m on each side which is nearly the size of one mesh cell as shown in Figure 2. We add a mass source in the mesh above the inlet instead of an inlet boundary condition for the concision of the boundary condition.
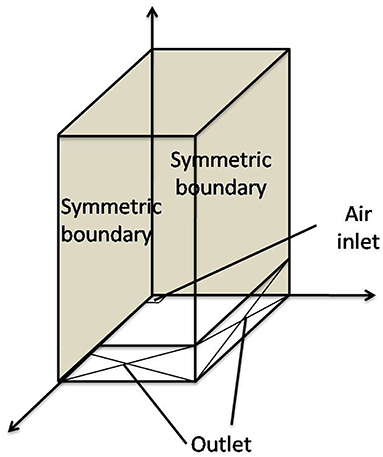
Figure 2. Geometry and boundary condition.
User-Defined Model
Because the gas in the experiment facility remains constant (room temperature), the energy conservation equation is not considered in this case. This case contains two different kinds of gas (air and helium), therefore, a user-defined diffusion equation for helium mass fraction calculation is added to the total mass conservation equation of Code_Saturne:
where DHerefers to the diffusion coefficient of helium in air, which is achieved by experiment (7.35*10−5m2s−1) (Deri et al., 2010).
Results and Discussion
Before the calculation for the final results, some pre-work need to be done. First, the calculation of the initial density distribution was made to verify the accuracy of this simulation. The simulations starts at 300 s (after the helium injection) with no air injection till the end. Then the mesh sensitivity analysis was performed to ensure that the final results are mesh-independent solutions. At last, the final calculation included three stages: the free diffusion stage(300 s−360 s), the air injection stage(360 s−660 s), the free mixing stage(660 s−2000 s).
Initial Condition
The experiment focuses on the break regime caused by the air fountain after the gas stratified, so we ignore the process of helium injection. Therefore, we choose the moment which stopped the injection of helium at 300 s as the initial time for our simulation. At this phase of the simulation the gaseous stratification formed and became stable. The total mass of helium will no longer increase. This initial time is also recommended by the experiment researchers and the article provides the detailed initial density distribution in the facility at 300 s.
In order to prove the accuracy of the initial density distribution, we use Code_Saturne to simulate a case without air inlet (i.e., there is only molecular diffusion) and compare with the experimental data before the case of Fr = 1.09.
For the purpose of reducing the influence introduced by the difference of air density, the recorded experimental data adopted a dimensionless form:
where ρref refers to the reference density i.e., the density of pure air in the experimental condition.
For the convenience of comparison, the results calculated by Code_Saturne are also transformed by the formula above. The comparison is shown in Figure 3.
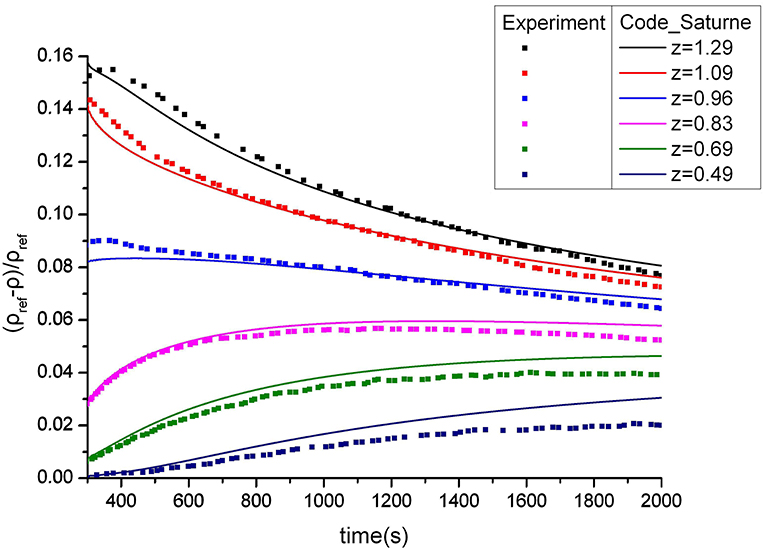
Figure 3. Density comparison(without air inlet).
The calculation starts at 300 s of the physical time. It has been observed that the results of the three positions near the top are in better agreement with the experimental data well. At the beginning, the density of the mixture gas is very small which means the mass fraction of helium is large, so the diffusion process is very fast. But as the diffusion continues, the gradient of the mass fraction becomes smaller and finally stabilized. The processes of the three positions near the bottom are opposite to the above positions and the density decrease. The tendencies of the three curves are the same with the experimental data but the deviation is larger than the curves above. The calculation results are under estimated compared to the experimental data in late stage which mean that the total helium mass is a little larger than the experimental data. That's probably because there is no gas leak in numerical calculation.
Calculation With Air Injection
Test on Sensitivity of Mesh
After the verification of initial density distribution, some analysis tests on sensitivity of mesh has been performed. If there is no air injection, the velocity of the gas in the experimental facility is very low. Therefore, the size of the mesh has no effect on the calculation results. When the air injection velocity was set to 2.803 m/s, the size of the mesh will have a significant effect on the results.
This paper tested three kinds of mesh:
• Coarse mesh: The number of cells is 63580(34*34*55). The maximal size is 0.034 m while the minimal size is 0.00886 m.
• Normal mesh: The number of cells is 78848(32*32*77). The maximal size is 0.030 m while the minimal size is 0.010 m.
• Fine mesh: The number of cells is 95232(32*32*93). The maximal size is 0.030 m while the minimal size is 0.010 m (Supplementary Image 1).
The three different curves represent the calculation results of three different fineness of mesh as shown in Figure 4. For the sake of simplicity, only the time-varying graph of density at Z = 0.2 m is shown. Fixed time steps i.e., 0.01 s is used in all three cases (which is also the best value obtained by time step sensitivity analysis). From Figure 4, we can see that there is a significant requirement for the fineness of the mesh if the time step is 0.01 s. If the mesh size is too coarse, it will create instability, resulting in concussions in the final results. And the rougher the mesh size, the greater the oscillation amplitude. According to the test results, we have chosen the most refined mesh for the following calculation in this paper.
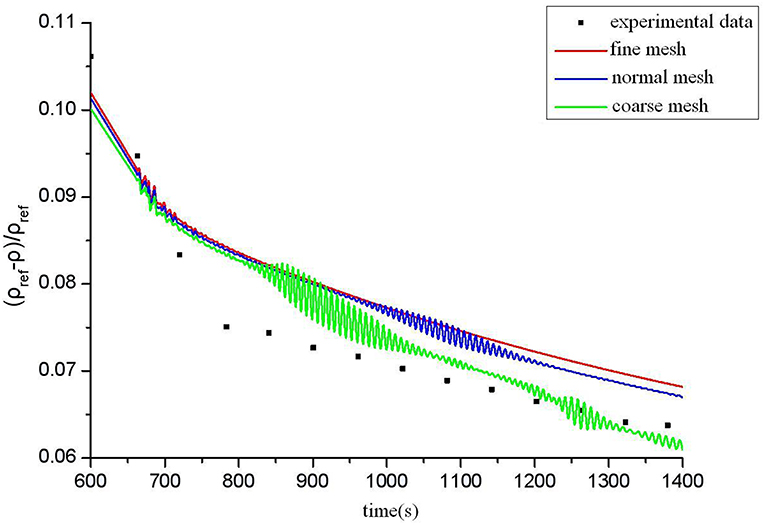
Figure 4. Density comparison of different mesh size (Fr = 1.09).
This test of sensitivity for the mesh was also applied to the initial condition calculation(without air injection). As the velocity of the gas in this case is very low, there is no difference for three kinds of mesh size, consequently, the coarse mesh is fine enough to have a mesh-independent solution.
Calculation of the Case Using Fine Mesh
After the verification of initial density distribution and tests on sensitivity of mesh and time step, finally we got results as following figure:
In the experiment, the stage from 300 s to 360 s was free diffusion after helium injection. So we also considered this stage in our simulation. We can see the curves were smooth at the beginning according to Figure 5 and Supplementary Table 1. Then the air injected vertically upward from the center of the bottom at speed of 2.803 m/s. The three curves in the upper region decline fast which means that the densities of three positions near the top increase quickly. This is not because the air went into the zone directly. As we see in Figures 6, 7, at the first 2 s of air injection(360 s−362 s), the high-speed air directly flowed into the top part of the box. But after that, it will split into two eddies separately above and under the plane of 0.85 m height. The upper eddy entrained the gas of large density from the lower part to the top thus resulting in the increase of density in the upper zone. The lower eddy also entrained the gas of small density from the upper part so the density in the lower zone decreased. The three curves in the lower zone increase slowly during the stage of air injection(360 s−660 s). After the injection, the three lower curves in the stage of free mixing were similar to the case without air injection.
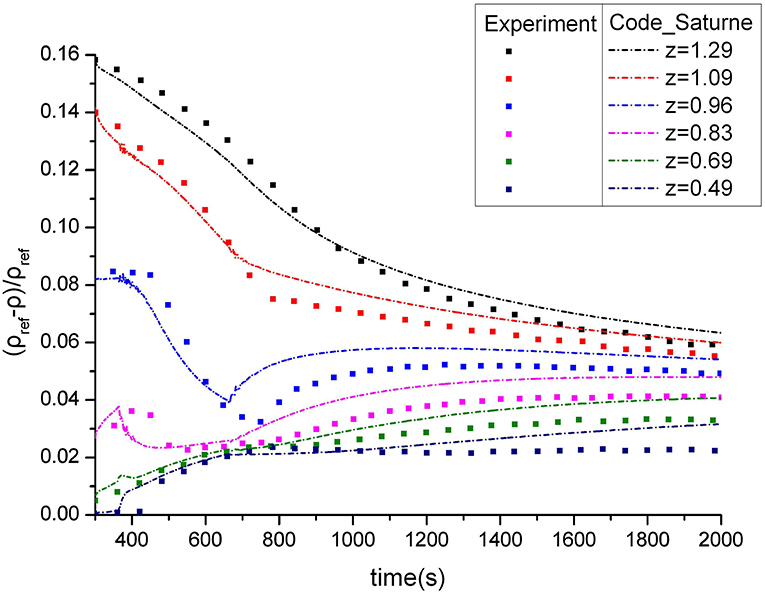
Figure 5. Density comparison (Fr = 1.09).
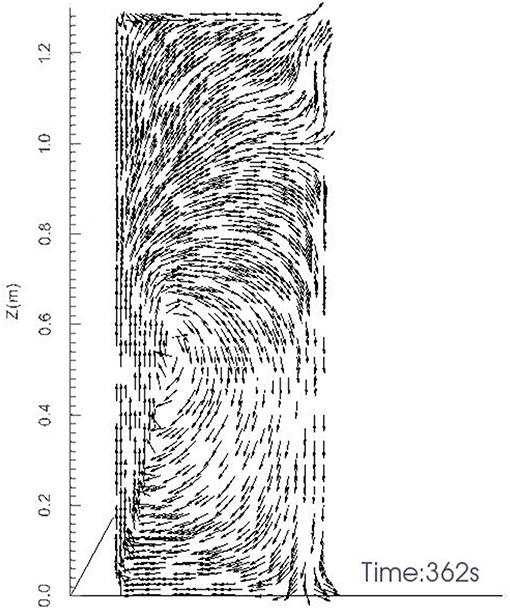
Figure 6. Flow field at 362s.
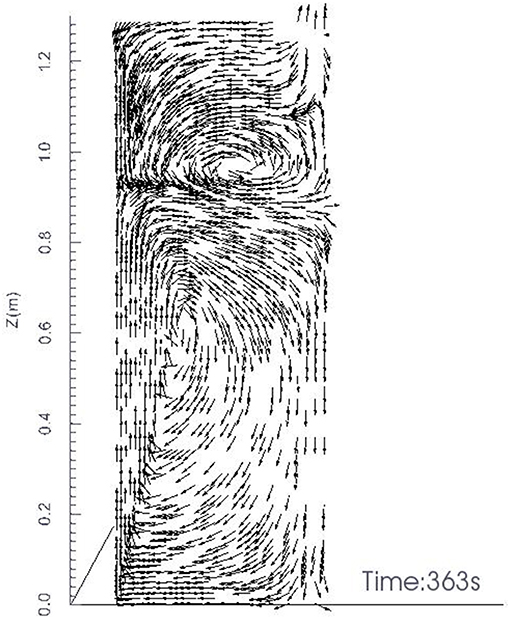
Figure 7. Flow field at 363s.
According to Figure 5, at the stage from 300 s to 660 s when the air injection stopped, the calculated results are in better agreement compared with the experimental data well. But at the next stage of free diffusion, the calculated results of density at six positions are under estimated as compared with the experimental data. We see that this deviation is close to the case without air injection. So we can inference that it is the deviation caused by the free diffusion that leads to the same problem. As it mentioned in section Initial Condition, that's probably because there is no gas leak in numerical calculation.
Conclusions
This paper presents a numerical investigation on gaseous stratification break-up phenomenon of air fountain experiment by Code_Saturne. The numerical investigation includes the verification of initial condition, the sensitivity test of time step, the sensitivity test of mesh size and the final numerical calculation of the air fountain experiment.
The numerical simulation for the initial condition shows the result of gaseous stratification phenomenon. This result verifies the model of buoyancy driven flow in Code_Saturne and establishes a good foundation for subsequent calculation. After the sensitivity test of mesh size, the best parameters and mesh for the numerical simulation of the air fountain experiment were found.
The final calculation results show the process of gaseous stratification break-up phenomenon of air fountain. At the beginning, the air injected to the zone of gaseous stratification directly. After the injection the flow was driven by buoyancy force and molecular diffusion. The largest relative error of the density in all six positions is <3% which verifies the accuracy of the Code_Saturne.
Data Availability
All datasets generated for this study are included in the manuscript/Supplementary Files.
Author Contributions
All authors listed have made a substantial, direct and intellectual contribution to the work, and approved it for publication.
Conflict of Interest Statement
The authors declare that the research was conducted in the absence of any commercial or financial relationships that could be construed as a potential conflict of interest.
Acknowledgments
This work is supported by National Natural Science Foundation of China (No. 11705189).
Supplementary Material
The Supplementary Material for this article can be found online at: https://www.frontiersin.org/articles/10.3389/fenrg.2019.00057/full#supplementary-material
Supplementary Image 1. Fine mesh.
Supplementary Table 1. Data of calculation result.
Footnotes
1. ^Theoretical manual of Code_Saturne. Available online at: http://code-saturne.org
References
Allelein, H. J., Fischer, K., Vendel, J., Malet, J., Studer, E., Schwarz, S., et al. (2007). International Standard Problem isp47 on Containment Thermal Hydraulics. Tech. Rep. 10, OECD/NEA/CSNI.
Archambeau, F., Méchitoua, N., and Sakiz, M. (2004). Code_Saturne: a FV code for the computation of turbulentincompressible flows – industrial applications. Int. J. Finite. 1, 1–62. Available online at: https://hal.archives-ouvertes.fr/hal-01115371
Auban, O., Zboray, R., and Paladino, D. (2007). Investigation of large-scale gas mixing and stratification phenomena related to LWR containment studies in the PANDA facility. Nuclear Eng. Design, 237, 409–419. doi: 10.1016/j.nucengdes.2006.07.011
Deri, E., Cariteau, B., and Abdo, D. (2010). Air fountain in the erosion of gaseous stratification. Int. J. Heat Fluid Flow. 31, 935–941. doi: 10.1016/j.ijheatfluidflow.2010.05.003
Gupta, S., Paladino, D., Benz, P., and Prasser, H. M. (2008). “Experimental analysis of containment atmosphere mixing and stratification induced by vertical fluid release,” in 16th International Conference on Nuclear Engineering (Orlando, FL), 48–502.
Guyez, E., Flor, J. B., and Hopfinger, E.J. (2007). Turbulent mixing at a stable density interface: the variation of the buoyancy flux-gradient relation. J. Fluid Mech. 577, 127–136. doi: 10.1017/S0022112007004958
INSAG (1996). Defence in Depth in Nuclear Safety. Tech. Rep. INSAG-10, International Atomic Energy Agency, International Nuclear Safety Advisory Group.
Mott, R. W., and Woods, A. W. (2009). On the mixing of a confined stratified fluid by a turbulent buoyant plume. J. Fluid Mech. 623, 149–165. doi: 10.1017/S002211200800520X
Keywords: numerical simulation, air fountain experiment, code_saturne, hydrogen distribution, containment
Citation: Zhang C, Yu J, Zhong X and Saeed M (2019) A Numerical Investigation on Gaseous Stratification Break-Up Phenomenon of Air Fountain Experiment by Code_Saturne. Front. Energy Res. 7:57. doi: 10.3389/fenrg.2019.00057
Received: 20 May 2019; Accepted: 29 May 2019;
Published: 19 June 2019.
Edited by:
Jun Wang, University of Wisconsin-Madison, United StatesReviewed by:
Mohammad Alrwashdeh, Khalifa University, United Arab EmiratesWeiqian Zhuo, Virginia Tech, United States
Copyright © 2019 Zhang, Yu, Zhong and Saeed. This is an open-access article distributed under the terms of the Creative Commons Attribution License (CC BY). The use, distribution or reproduction in other forums is permitted, provided the original author(s) and the copyright owner(s) are credited and that the original publication in this journal is cited, in accordance with accepted academic practice. No use, distribution or reproduction is permitted which does not comply with these terms.
*Correspondence: Chunhui Zhang, c2Fyc3pjaEAxNjMuY29t